norske hydro · 3) ebitda and investments per segment are specified in note 2: operating segment...
TRANSCRIPT

2017Q
fourth quarter report
4

Contents
Financial review 2Overview 2Market developments and outlook 5Additional factors impacting Hydro 8Underlying EBIT 9Finance 15Tax 15
Pro forma information 16
Interim financial statements 18Condensed consolidated statements of income (unaudited) 18Condensed consolidated statements of comprehensive income (unaudited) 19Condensed consolidated balance sheets (unaudited) 20Condensed consolidated statements of cash flows (unaudited) 21Condensed consolidated statements of changes in equity (unaudited) 22Notes to the condensed consolidated financial statements (unaudited) 23
Alternative performance measures 30
Additional information 36Financial calendar 36
Oslo, February 15, 2018
FOURTH QUARTER REPORT 20171

Overview
Summary underlying financial and operating results and liquidity
Key financial information
NOK million, except per share data
Fourth
quarter
2017
Third
quarter
2017
Change
prior
quarter
Fourth
quarter
2016
Change
prior year
quarter
Year
2017
Year
2016
Revenue 38 803 22 799 70 % 21 250 83 % 109 220 81 953
Earnings before financial items and tax (EBIT) 4 511 2 323 94 % 1 964 >100 % 12 189 7 011
Items excluded from underlying EBIT1)
(956) 123 >(100) % (135) >(100) % (974) (586)
Underlying EBIT1)
3 555 2 446 45 % 1 829 94 % 11 215 6 425
Underlying EBIT :
Bauxite & Alumina 1 872 413 >100 % 711 >100 % 3 704 1 227
Primary Metal 1 377 1 298 6 % 601 >100 % 5 061 2 258
Metal Markets 185 91 >100 % 152 22 % 544 510
Rolled Products 95 95 - 6 >100 % 380 708
Extruded Solutions2)
284 284
Energy 457 368 24 % 359 27 % 1 531 1 343
Other and eliminations2)
(715) 181 >(100) % (1) >(100) % (289) 380
Underlying EBIT1)
3 555 2 446 45 % 1 829 94 % 11 215 6 425
Earnings before financial items, tax, depreciation and
amortization (EBITDA)3)
6 481 3 766 72 % 3 563 82 % 18 344 12 485
Underlying EBITDA1)
5 524 3 889 42 % 3 143 76 % 17 369 11 474
Net income (loss) 3 600 2 184 65 % 1 008 >100 % 9 184 6 586
Underlying net income (loss)1)
2 816 1 785 58 % 968 >100 % 8 396 3 875
Earnings per share 1.71 1.00 72 % 0.52 >100 % 4.30 3.13
Underlying earnings per share1)
1.33 0.82 62 % 0.48 >100 % 3.95 1.84
Financial data:
Investments1) 3) 24 632 1 424 >100 % 3 541 >100 % 28 848 9 137
Adjusted net cash (debt)1)
(17 968) (2 976) >(100) % (5 598) >(100) % (17 968) (5 598)
Underlying Return on average Capital Employed (RoaCE)1)
9.6 % 5.1 %
Key Operational informationFourth
quarter
2017
Third
quarter
2017
Change
prior
quarter
Fourth
quarter
2016
Change
prior year
quarter
Year
2017
Year
2016
Bauxite production (kmt)4)
3 049 3 043 - 3 063 - 11 435 11 132
Alumina production (kmt) 1 693 1 605 5 % 1 635 4 % 6 397 6 341
Primary aluminium production (kmt) 528 527 - 526 - 2 094 2 085
Realized aluminium price LME (USD/mt) 2 092 1 921 9 % 1 647 27 % 1 915 1 574
Realized aluminium price LME (NOK/mt) 17 066 15 496 10 % 13 659 25 % 15 888 13 193
Realized USD/NOK exchange rate 8.16 8.07 1 % 8.29 (2) % 8.30 8.38
Rolled Products sales volumes to external market (kmt) 224 236 (5) % 213 5 % 940 911
Extruded Solutions sales volumes to external market (kmt)5)
318 170 87 % 155 >100 % 845 682
Power production (GWh) 3 089 2 509 23 % 2 551 21 % 10 835 11 332
1) Alternative performance measures (APMs) are described in the corresponding section in the back of the report.
2) Other and eliminations includes Hydro's 50 percent share of underlying net income from Sapa until end of third quarter 2017, while 100 percent of Extruded Solutions' underlying EBIT isdisclosed separately as of fourth quarter 2017.
3) EBITDA and investments per segment are specified in Note 2: Operating segment information.
4) Paragominas production, on wet basis.
5) Hydro's 50 percent share of Sapa sales volumes until end of third quarter 2017 and 100 percent of Extruded Solutions sales volumes as of the fourth quarter 2017.
FOURTH QUARTER REPORT 2017 2

Hydro's underlying earnings before financial items and tax increased to NOK 3,555 million in the fourth quarter, up fromNOK 2,446 million in the third quarter. The increase mainly reflects a higher realized alumina sales price and all-in metalprice1), partly offset by increased raw material costs and fixed costs.
Compared to the fourth quarter of 2016 the underlying EBIT increased significantly from NOK 1,829 million to NOK 3,555million. The increase reflects a higher all-in metal price and alumina sales price, partly offset by increased raw material costsand fixed costs.
For the full year 2017 Hydro's underlying EBIT increased to NOK 11,215 million from NOK 6,425 million for 2016. Theincrease reflects a higher all-in metal price and alumina sales price, partly offset by increased raw material costs, fixed costs andnegative currency effects.
Due to performance challenges in Rolled Products and slower than expected progress of improvements at Albras in PrimaryMetal, progress on Hydro's "Better" improvement program is behind plan. While Hydro did not reach the 2017 target ofNOK 500 million, the delay is not expected to impact the revised 2019 target of NOK 3.0 billion.
Hydro’s acquisition of Orkla’s 50 percent ownership in Sapa was completed on October 2, 2017, giving Hydro full ownershipof Sapa. Financial results for the new fully owned entity are presented in the new business area Extruded Solutions. Sapa’sresults for the first nine months are reported as a 50 percent owned joint venture accounted for under the equity methodwithin the Other and eliminations business area. For more information see note 4 to the interim financial statements.
Hydro's net cash position decreased from NOK 7.7 billion2) to a net debt position of NOK 4.1 billion at the end of thequarter. Net cash provided by operating activities amounted to NOK 6.4 billion. Net cash used in investment activities,excluding short term investments, amounted to NOK 14.1 billion.
For 2017, Hydro's Board of Directors proposes a dividend of NOK 1.75 per share reflecting Hydro's strong operationalperformance for 2017 and solid financial position. This is up from NOK 1.25 per share paid out for 2016, which is still to beconsidered a floor. The proposed payment represents a 41 percent pay-out ratio of reported net income for the year anddemonstrates the company's commitment to provide a competitive cash return to shareholders, also taking into account thevolatility in the aluminium industry.
1) The all-in metal price refers to the LME cash price plus premiums.
2) Net cash (debt) includes Cash and cash equivalents and Short-term investments less Bank loans and other interest bearing Short-term debt and Long-term debt.
Reported earnings before financial items and tax amounted to NOK 4,511 million for the fourth quarter. In addition to thefactors discussed above, reported EBIT included net unrealized derivative losses of NOK 231 million, positive metal effects ofNOK 146 million, a charge of NOK 210 million, of which NOK 181 million is linked to an environmental liability at theKurri Kurri site and NOK 29 million is related to rationalization costs in Extruded Solutions. In addition, a charge of NOK245 million related to a customs case in Germany and a gain of NOK 33 million in relation to remeasurement ofenvironmental liabilities in Germany. Reported earnings also included a net remeasurement gain of NOK 2,171 millionrelating to previously owned shares in Sapa and an inventory valuation expense of NOK 707 million related to the Sapatransaction.
Reported EBIT and net income
In the previous quarter reported earnings before financial items and tax amounted to NOK 2,323 million, including netunrealized derivative gains of NOK 23 million and negative metal effects of NOK 151 million. Reported earnings alsoincluded a net gain of NOK 6 million in Sapa (Hydro's share net of tax) relating to unrealized derivative gains.
For the full year 2017, reported earnings before financial items and tax amounted to NOK 12,189 million. Reported EBITincluded net unrealized derivative losses of NOK 466 million and positive metal effects of NOK 419 million. Reported EBITalso included a net loss of NOK 19 million in Sapa (Hydro's share net of tax) relating to unrealized derivative losses and netforeign exchange losses, a charge of NOK 210 million, of which NOK 181 million is linked to an environmental liability atthe Kurri Kurri site and NOK 29 million is related to rationalization costs in Extruded Solutions. In addition a charge of
FOURTH QUARTER REPORT 20173

NOK 245 million related to a customs case in Germany and a gain of NOK 33 million in relation to remeasurement ofenvironmental liabilities in Germany. Reported EBIT also included a net gain of NOK 2,171 million and an inventoryvaluation expense of NOK 707 million, both related to the Sapa transaction.
In the previous year, reported earnings before financial items and tax amounted to NOK 7,011 million including netunrealized derivative gains and positive metal effects of NOK 553 million in total. Reported earnings also included charges ofNOK 192 million relating to the demolition of the Kurri Kurri site, impairment charges of NOK 426 million relating to thepart-owned projected CAP alumina refinery and the Hannover site, a net gain of NOK 314 million relating to the sale ofcertain assets in Grenland, in addition to a negative adjustment relating to the sale of the Slim rolling mill in the fourth quarterof 2015. Other positive effects of NOK 223 million reflects the compensation relating to the completion of outstandingcontractual arrangements with Vale and a charge of NOK 32 million relating to remeasurement of environmental liabilities inGermany. In addition, reported earnings included a net gain of NOK 113 million for Sapa (Hydro's share net of tax), relatingto unrealized derivative gains, rationalization charges and net foreign exchange gains.
Net income amounted to NOK 3,600 million in the fourth quarter including net foreign exchange losses of NOK 696million, mainly unrealized, reflecting the strengthening of EUR forward rates against NOK resulting in an unrealized loss onembedded derivatives in power contracts denominated in EUR while the strengthening of USD against BRL affected USdollar debt in Brazil.
In the previous quarter net income amounted to NOK 2,184 million including a reduction in tax expense and related interestincome of NOK 125 million in total following a closed tax case in September 2017. Net income also included net foreignexchange gains of NOK 520 million, mainly unrealized, reflecting a weakening of USD against BRL affecting US dollar debtin Brazil, while the weakening of EUR forward rates against NOK resulted in an unrealized gain on the embedded derivativesin power contracts denominated in EUR.
Net income for 2017 amounted to NOK 9,184 million. This included a net foreign exchange loss of NOK 875 millionreflecting a strengthening of USD against BRL affecting US dollar debt in Brazil, while the strengthening of EUR forwardrates against NOK resulted in an unrealized loss on the embedded derivatives in power contracts denominated in EUR.
For the previous year net income amounted to NOK 6,586 million. This included a net foreign exchange gain of NOK 2,266million reflecting the strengthening BRL versus US dollars affecting US dollar liabilities in Brazil, as well as the strengtheningNorwegian kroner versus Euro affecting liabilities in Euro in Norway and embedded currency derivatives in power contracts.Net income also included a reduction in tax expense and related interest income of NOK 700 million in total followingsettlement of a tax case in April 2016.
FOURTH QUARTER REPORT 2017 4

Market developments and outlook
Industry statistics, commentary and other information in the table and text in this section have been derived from analystreports, trade associations and other public sources as well as Hydro's own analysis unless otherwise indicated. The informationin this section is intended to provide an overview of the main developments in the key markets Hydro is exposed to. Statisticspresented in prior reports may have been restated based on updated information. Currency rates have been derived fromNorges Bank.
Market statistics
Fourth
quarter
2017
Third
quarter
2017
Change
prior
quarter
Fourth
quarter
2016
Change
prior year
quarter
Year
2017
Year
2016
USD/NOK Average exchange rate 8.16 7.96 3 % 8.38 (3) % 8.26 8.40
USD/NOK Period end exchange rate 8.21 7.97 3 % 8.62 (5) % 8.21 8.62
BRL/NOK Average exchange rate 2.51 2.52 - 2.54 (1) % 2.59 2.42
BRL/NOK Period end exchange rate 2.48 2.50 (1) % 2.65 (6) % 2.48 2.65
USD/BRL Average exchange rate 3.24 3.16 3 % 3.30 (2) % 3.19 3.48
USD/BRL Period end exchange rate 3.31 3.19 4 % 3.25 2 % 3.31 3.25
EUR/NOK Average exchange rate 9.60 9.35 3 % 9.04 6 % 9.33 9.29
EUR/NOK Period end exchange rate 9.84 9.41 5 % 9.09 8 % 9.84 9.09
Bauxite and alumina:
Average alumina price - Platts PAX FOB Australia (USD/t) 446 334 33 % 308 45 % 355 254
China bauxite import price (USD/mt CIF China) 53 51 4 % 49 7 % 51 49
Global production of alumina (kmt) 30 838 31 247 (1) % 30 409 1 % 124 017 114 963
Global production of alumina (ex. China) (kmt) 14 181 14 114 - 14 164 - 55 963 54 720
Primary aluminium:
LME three month average (USD/mt) 2 119 2 028 4 % 1 709 24 % 1 980 1 610
LME three month average (NOK/mt) 17 285 16 125 7 % 14 320 21 % 16 337 13 509
Standard ingot premium (EU DP Cash) 159 141 13 % 131 22 % 148 132
Extrusion ingot premium (DP) 353 345 2 % 312 13 % 334 317
Global production of primary aluminium (kmt) 16 019 16 087 - 15 449 4 % 63 552 58 982
Global consumption of primary aluminum (kmt) 16 122 16 096 - 15 262 6 % 63 595 60 087
Global production of primary aluminium (ex. China) (kmt) 6 937 6 856 1 % 6 846 1 % 27 213 26 945
Global consumption of primary aluminum (ex. China) (kmt) 7 251 7 299 (1) % 6 963 4 % 29 196 28 249
Reported primary aluminium inventories (kmt) 5 283 5 557 (5) % 5 086 4 % 5 283 5 086
Rolled products and extruded products:
Consumption rolled products - Europe (kmt) 1 150 1 235 (7) % 1 092 5 % 4 882 4 706
Consumption rolled products - USA & Canada (kmt) 1 208 1 275 (5) % 1 143 6 % 5 049 4 786
Consumption extruded products - Europe (kmt) 707 763 (7) % 687 3 % 3 053 2 976
Consumption extruded products - USA & Canada (kmt) 583 628 (7) % 545 7 % 2 448 2 351
Energy:
Average southern Norway spot price (NO2) (NOK/MWh) 287 258 11 % 296 (3) % 269 233
Average mid Norway spot price (NO3) (NOK/MWh) 291 267 9 % 333 (13) % 275 266
Average nordic system spot price (NOK/MWh) 294 266 11 % 311 (5) % 274 250
In 2017, China imported 68.8 million mt of bauxite, 32 percent higher than 2016. The increase was driven by surgingimports from Guinea reaching 27.6 million mt in 2017 from 11.9 million mt in 2016 as new bauxite mines continuedincreasing production. Imports from Malaysia decreased 37 percent to 4.9 million mt as a bauxite mining moratoriumimposed from January 2016 was enforced more effectively. After a three year government imposed export ban, imports fromIndonesia resumed in July reaching 1.3 million mt for the year. Imports from Brazil decreased 25 percent to 3.3 million mt.
Bauxite and alumina
Chinese alumina imports amounted to 2.9 million mt in 2017, a 5 percent decrease compared with 2016. Imports fromAustralia decreased 31 percent compared to 2016, offset by higher imports from Indonesia and Vietnam as new refineriesreached full capacity during the year.
FOURTH QUARTER REPORT 20175

Platts alumina spot prices averaged USD 446 per mt in the fourth quarter, an increase of USD 112 per mt compared to theprevious quarter. Prices started the quarter at USD 440 per mt, increasing to an all time high of USD 484 per mt by the end ofOctober before retreating to USD 389 per mt at year-end. Average prices represented 21 percent of LME in the fourth quartercompared with 16.5 percent in the previous quarter. According to Chinese import statistics, Chinese bauxite price averagedUSD 51 per mt in 2017, 3 percent higher compared to 2016.
Three-month LME prices ranged between USD 2,006 and USD 2,257 per mt throughout the fourth quarter of 2017. Theaverage LME three-month price was USD 2,119, increasing by USD 91 per mt compared to the third quarter. Europeanaverage all-in metal prices1) increased from USD 2,153 per mt in the third quarter to USD 2,260 in the fourth quarter, bothdue to increase in LME prices and premiums.
Primary aluminium
European duty paid standard ingot premiums ended the quarter at USD 162 per mt, compared to USD 152 at the beginningof the quarter, and averaged USD 159 per mt in the fourth quarter compared to USD 141 per mt in the third quarter.Midwest premiums started the fourth quarter at USD 204 per mt, and ended the quarter at USD 209 per mt, averaging USD209 per mt compared to USD 173 per mt in the third quarter.
Shanghai Futures Exchange (SHFE) prices decreased slightly compared to the third quarter, in contrast to the positive LMEdevelopment during the quarter. The main reason for the decrease was increasing reported stock levels in China, in spite of theChinese Government’s efforts to reduce the capacity. Arbitrage potential and semis exports increased during the quartercompared to the third quarter.
Global primary aluminium consumption decreased by 0.2 percent to 16.1 million mt in the fourth quarter compared to thethird, mainly due to seasonality. Compared to the fourth quarter of 2016, global demand increased 5.6 percent. Globaldemand for primary aluminium grew by 5.8 percent in 2017, and is expected to grow by around 4-5 percent in 2018.
1) The all-in metal price refers to the LME cash price plus premiums.
Outside China, demand seasonally decreased by 0.7 percent in the fourth quarter compared to the third quarter, while theyear-on-year increase from the fourth quarter of 2016 was 4.1 percent. Consumption outside China amounted to 7.3 millionmt for the fourth quarter of 2017. Corresponding production amounted to 6.9 million mt, an increase of 1.2 percentcompared to the third quarter. Production outside China experienced a 1.2 percent increase compared to the fourth quarter of2016, largely driven by ramp up of new production capacity in India. Demand for primary aluminium outside China grew byaround 3.4 percent in 2017, and is expected to grow by 3-4 percent in 2018. Production outside China is expected to increaseby 3-4 percent in 2018.
Compared to the third quarter of 2017, Chinese aluminium consumption increased by 0.8 percent to 8.9 million mt. Theyear-on-year increase compared to the fourth quarter of 2016 was 6.9 percent. Corresponding aluminium productiondecreased by 1.6 percent compared to the third quarter, but increased 5.6 percent compared to the fourth quarter of 2016. TheChinese government has announced that they will continue with smelter curtailments next winter in order to reduce airpollution in a number of Chinese cities. Production of primary aluminium in China grew by 13.4 percent in 2017, but due tothe capacity control measurements that were introduced in 2017 production increase is expected to be dampened to around4-6 percent in 2018. Demand is expected to increase by 4-6 percent in 2018 compared to a growth of 8 percent in 2017.
The global primary aluminium market is expected to be largely balanced in 2018.
European demand for extrusion ingot increased in the fourth quarter compared to the fourth quarter of 2016. Demand forsheet ingot and primary foundry alloys also continued increasing, mainly due to the positive developments in the automotiveindustry.
Total global stocks at the end of the fourth quarter were estimated to be 12.5 million mt, at the same level as at end of thethird quarter as well as at the fourth quarter of 2016. LME stocks have declined further, amounting to 1.1 million mt at the
FOURTH QUARTER REPORT 2017 6
end of the fourth quarter, down 0.2 million mt from the end of the third quarter. Compared to fourth quarter of last year,LME stocks are down 1.1 million mt. Chinese reported stocks have increased 0.1 million mt since the third quarter, and 1.3million mt since the fourth quarter of 2016. Estimated unreported global stocks were stable compared to the third quarter of2017 but have decreased 0.2 million mt compared to the fourth quarter of 2016.
European demand for flat rolled products declined by around 7 percent compared to the third quarter of 2017 due toseasonality. Compared to the fourth quarter of the previous year demand increased by around 5 percent.
Rolled products
The substitution of steel by aluminium for automotive body sheet remains to be the key growth driver in automotive.European demand for automotive products was also driven by an increase in car production. Building and constructiondemand continued to recover. Beverage can developed positively driven by conversions of beverage can production lines fromsteel to aluminium. Foil products growth was supported by higher US foil demand as a result of imposed anti-dumping dutieson Chinese imports to US. The demand growth in general engineering was solid, especially in the industrial goods relatedsegments.
The European demand for flat rolled products is expected to increase in the first quarter of 2018 due to seasonality and soliddemand across segments.
European demand for extrusions declined 7 percent compared to the third quarter of 2017, mainly due to seasonality.Compared to the fourth quarter of the previous year demand increased by 3 percent, caused by growth within the automotiveand building and construction markets.
Extruded products
The North American demand for extrusion also experienced a seasonal reduction of 7 percent compared to the third quarter,demand increased 7 percent compared to the same quarter last year.
For the full year Europe experienced stronger automotive and transportation demand, as well as improved demand in thebuilding and construction markets. North America was also driven by stronger automotive demand and higher activity in thebuilding and construction market. The commercial transportation market has declined slightly, but improved towards the endof the year.
The first quarter is seasonally stronger than the fourth which is expected to be reflected in increased sales volumes. The currentmarket conditions are expected to continue into the first quarter of 2018.
Nordic spot prices were on average higher compared to previous quarter. Seasonally higher consumption, increasing exportvolumes towards continental Europe and somewhat lower than expected availability of nuclear power in Sweden gave supportto prices. The hydrological balance improved significantly during the quarter limiting the increase in prices.
Energy
The Nordic hydrological balance ended at around 14 TWh above normal1) for the fourth quarter compared to around 9 TWhbelow normal at the end of the previous quarter. Water reservoirs in Norway were 72 percent of full capacity at the end of thequarter, which is slightly below the normal level. Snow reservoirs were well above normal levels at the end of the quarter.
1) Normal based on long term historical averages.
FOURTH QUARTER REPORT 20177

Additional factors impacting Hydro
Primary Metal has sold forward around 50 percent of its expected primary aluminium production for the first quarter of 2018at a price level of around USD 2,100 per mt.1)
On July 10, 2017, Hydro entered into a contract to acquire 50 percent of the shares in Sapa AS, which was a joint ventureowned 50 percent by Hydro and 50 percent by Orkla, a listed company in Norway. Following completion of the transactionon October 2, 2017, Hydro owns 100 percent of Sapa AS, which is now renamed Hydro Extruded Solutions AS. For moreinformation see note 4 to the interim financial statements.
Sapa Profiles Inc. (SPI), a Portland, Oregon based subsidiary of Hydro Extruded Solutions AS (formerly Sapa AS) is underinvestigation by the United States Department of Justice (DOJ) Civil and Criminal Divisions regarding certain aluminumextrusions that SPI manufactured from 1996 to 2015, including extrusions that were delivered to a supplier to NASA. SPI iscooperating fully in these investigations. The investigations are currently ongoing, and, at this point, the outcome of theinvestigations and of any identified quality issues, including financial consequences, is uncertain. SPI also has been temporarilysuspended as a federal government contractor. Based on the information currently known to Hydro, Hydro does not expectany resulting liabilities to have a material adverse effect on its consolidated results of operations, liquidity or financial position.As part of the share purchase agreement the parties have agreed that Orkla ASA shall indemnify Hydro for 50 percent of anyliability in relation to this case.
The US tax reform enacted on December 22, 2017 will result in significant changes to existing tax laws in several areasaffecting Hydro. While the changes are expected to have a net positive impact on Hydro’s US operations, the tax reform alsomakes it necessary to review the impact of interest limitation provisions and base erosion anti abuse tax on certainintercompany transactions.
Hydro has made an investment decision to upgrade and start up the second production line at Hydro Husnes, Norway. Theline is expected to begin operations in the first half of 2020 doubling annual primary aluminium production at Husnes toaround 190,000 mt.
Extruded Solutions has agreed with Arconic to acquire its two extrusion plants in Brazil. The agreement will strengthenHydro’s downstream position in Brazil and create a solid platform for further growth. The two extrusion plants in Utinga andTubarão in southern Brazil have combined more than 600 employees, one cast house, seven presses ranging from 7 to 14inches and value-added capabilities. Brazilian competition authorities have approved the acquisition and closing of thetransaction is expected within the first half of 2018.
Hydro started producing the first aluminium metal at the technology pilot in Karmøy on January 29, marking the start ofverifying, at an industrial scale, the world’s most climate-and energy efficient aluminium technology. The technology pilot isdesigned with an annual production capacity of approximately 75,000 mt, consisting of 48 cells running on the HAL4etechnology (12.3 kWh/kg) and 12 cells using the HAL4e Ultra technology (11.5-11.8 kWh/kg).
1) Prices are fixed mainly one month prior to production. As a result, and due to the hedging of product inventories, Hydro's realized aluminium prices lag LME spot prices by around 1 to 2months.
FOURTH QUARTER REPORT 2017 8

Underlying EBIT
Alternative performance measures (APMs) are described in the corresponding section in the back of the report.
Operational and financial information
Fourth
quarter
2017
Third
quarter
2017
Change
prior
quarter
Fourth
quarter
2016
Change
prior year
quarter
Year
2017
Year
2016
Earnings before financial items and tax (EBIT) (NOK million) 1 872 413 >100 % 680 >100 % 3 704 1 196
Underlying EBIT (NOK million) 1 872 413 >100 % 711 >100 % 3 704 1 227
Underlying EBITDA (NOK million) 2 551 1 057 >100 % 1 258 >100 % 6 190 3 221
Alumina production (kmt) 1 693 1 605 5 % 1 635 4 % 6 397 6 341
Sourced alumina (kmt) 610 667 (9) % 883 (31) % 2 522 2 541
Total alumina sales (kmt) 2 344 2 251 4 % 2 472 (5) % 8 920 8 843
Realized alumina price (USD/mt) 1)
398 297 34 % 257 55 % 326 240
Bauxite production (kmt) 2)
3 049 3 043 - 3 063 - 11 435 11 132
Sourced bauxite (kmt) 3)
2 103 2 013 4 % 2 235 (6) % 7 601 8 499
Bauxite & Alumina
1) Weighted average of own production and third party contracts. The majority of the alumina is sold linked to either the LME prices or alumina index with a one month delay.
2) Paragominas production, on wet basis.
3) 40 percent MRN off take from Vale and 5 percent Hydro share on wet basis.
Underlying EBIT for Bauxite & Alumina increased significantly compared to the third quarter mainly due to higher realizedalumina prices, driven by a higher alumina index and LME. Both the bauxite mine in Paragominas and alumina refinery atAlunorte reached record yearly production of 11.4 million mt and 6.4 million mt respectively for 2017.
Bauxite & Alumina achieved its "Better Bauxite & Alumina" improvement program target of NOK 1 billion of annualimprovements two years ahead of schedule and have increased the 2019 target to NOK 1.3 billion.
Compared to the fourth quarter of 2016 the underlying EBIT increased, mainly due to higher realized alumina prices, partlyoffset by increased raw material cost.
Compared to the year 2016 the underlying EBIT increased mainly due to higher realized alumina prices. This was partly offsetby increased raw material cost and negative currency effects.
FOURTH QUARTER REPORT 20179

Primary Metal
Operational and financial information 1)
Fourth
quarter
2017
Third
quarter
2017
Change
prior
quarter
Fourth
quarter
2016
Change
prior year
quarter
Year
2017
Year
2016
Earnings before financial items and tax (EBIT) (NOK million) 1 112 1 282 (13) % 619 80 % 4 729 2 285
Underlying EBIT (NOK million) 1 377 1 298 6 % 601 >100 % 5 061 2 258
Underlying EBITDA (NOK million) 1 900 1 795 6 % 1 068 78 % 7 078 4 172
Realized aluminium price LME (USD/mt) 2)
2 092 1 921 9 % 1 647 27 % 1 915 1 574
Realized aluminium price LME (NOK/mt) 2)
17 066 15 496 10 % 13 659 25 % 15 888 13 193
Realized premium above LME (USD/mt) 3)
259 261 (1) % 240 8 % 265 263
Realized premium above LME (NOK/mt) 3)
2 116 2 106 - 1 993 6 % 2 197 2 201
Realized USD/NOK exchange rate 8.16 8.07 1 % 8.29 (2) % 8.30 8.38
Primary aluminium production (kmt) 528 527 - 526 - 2 094 2 085
Casthouse production (kmt) 550 548 - 523 5 % 2 169 2 146
Total sales (kmt) 554 568 (2) % 528 5 % 2 278 2 248
1) Operating and financial information includes Hydro's proportionate share of underlying income (loss) of equity accounted investments.
2) Realized aluminium prices lag the LME price developments by approximately 1.5 - 2 months.
3) Average realized premium above LME for casthouse sales from Primary Metal.
Operational and financial information Qatalum (50%)
Fourth
quarter
2017
Third
quarter
2017
Change
prior
quarter
Fourth
quarter
2016
Change
prior year
quarter
Year
2017
Year
2016
Revenue (NOK million) 1 613 1 370 18 % 1 256 28 % 5 821 4 801
Underlying EBIT (NOK million) 318 220 45 % 107 >100 % 985 341
Underlying EBITDA (NOK million) 599 497 21 % 407 47 % 2 157 1 528
Net income (loss) (NOK million) 259 159 62 % 49 >100 % 747 98
Underlying Net income (loss) (NOK million) 259 159 62 % 49 >100 % 747 98
Primary aluminium production (kmt) 78 78 - 77 1 % 310 306
Casthouse sales (kmt) 86 78 10 % 80 8 % 325 310
Underlying EBIT for Primary Metal improved in the fourth quarter due to higher realized aluminium prices, partly offset byhigher raw material prices and fixed costs.
The "Better Primary Metal" improvement program was behind plan for 2017 due to slower than expected progress ofimprovements at Albras. The delay is not expected to impact the 2019 target of NOK 1.0 billion.
Compared to the fourth quarter of 2016, underlying EBIT improved substantially, mainly due to higher realized all-in metalprices1) partly offset by higher raw material costs in addition to higher fixed costs.
Underlying EBIT for the year 2017 improved substantially compared to 2016, mainly due to the same factors discussed abovein addition to negative currency effects.
1) The all-in metal price refers to the LME cash price plus premiums.
FOURTH QUARTER REPORT 2017 10

Metal Markets
Operational and financial information
Fourth
quarter
2017
Third
quarter
2017
Change
prior
quarter
Fourth
quarter
2016
Change
prior year
quarter
Year
2017
Year
2016
Earnings before financial items and tax (EBIT) (NOK million) 158 59 >100 % 172 (8) % 485 629
Underlying EBIT (NOK million) 185 91 >100 % 152 22 % 544 510
Currency effects 47 12 >100 % (6) >100 % 83 -
Inventory valuation effects (19) (29) 34 % 9 >(100) % (38) (13)
Underlying EBIT excl. currency and inventory valuation effects 157 107 46 % 149 5 % 499 524
Underlying EBITDA (NOK million) 209 114 84 % 175 19 % 638 604
Remelt production (kmt) 137 136 1 % 133 3 % 568 548
Metal products sales excluding ingot trading (kmt) 1)
720 707 2 % 660 9 % 2 921 2 893
Hereof external sales (kmt) 589 639 (8) % 616 (5) % 2 575 2 627
1) Includes external and internal sales from primary casthouse operations, remelters and third party metal sources.
Underlying EBIT for Metal Markets improved in the fourth quarter, mainly due to higher results from sourcing and tradingactivities, in addition to positive currency effects and increased results from the remelters.
Compared to the fourth quarter of 2016, underlying EBIT for Metal Markets mainly improved due to positive currencyeffects, partly offset by negative inventory valuation effects.
Underlying EBIT for the year 2017 improved somewhat compared with 2016, mainly due to positive currency effects andimproved results from sourcing and trading activities. This was partly offset by lower results from the remelters, in addition tomore negative inventory valuation effects.
Operational and financial information
Fourth
quarter
2017
Third
quarter
2017
Change
prior
quarter
Fourth
quarter
2016
Change
prior year
quarter
Year
2017
Year
2016
Earnings before financial items and tax (EBIT) (NOK million) - (22) 100 % 91 (100) % 512 953
Underlying EBIT (NOK million) 95 95 - 6 >100 % 380 708
Underlying EBITDA (NOK million) 325 312 4 % 222 46 % 1 240 1 507
Sales volumes to external market (kmt) 224 236 (5) % 213 5 % 940 911
Sales volumes to external markets (kmt) - Product areas
Can & foil 87 91 (4) % 79 10 % 352 321
Lithography & automotive 68 76 (10) % 67 2 % 297 298
Special products 69 69 (1) % 67 3 % 291 292
Rolled Products 224 236 (5) % 213 5 % 940 911
Rolled Products
Underlying EBIT for the fourth quarter was on same level as the third quarter of 2017. Increasing margins driven by productmix and positive inventory effects were offset by seasonal reduction in sales volumes and year end maintenance costs. TheNeuss smelter result decreased in the fourth quarter due to increasing alumina and raw material prices.
In 2017, technical issues caused delays in ramp up of both the new recycling line for used beverage cans (UBC) and theAutomotive line 3. This, together with performance issues in some of the plants, adversely affected Rolled Products’improvement ambition in 2017. The "Better Rolled Products" improvement ambition has been delayed by one year, nowtargeting NOK 900 million by 2020, the revised 2019 target is NOK 700 million.
FOURTH QUARTER REPORT 201711

Compared to the fourth quarter of 2016 the underlying EBIT increased. Higher volumes and margins as well as positiveinventory effects more than offset negative currency developments and costs related to the ongoing ramp-up activities for thenew Automotive line 3. Results from the Neuss smelter have improved driven by the all-in metal price development.
Underlying EBIT for the year was significantly below 2016 due to a combination of factors. These include, reduced margins,costs related to year end maintenance and implementation of new equipment, ramp-up costs for the new automotive line 3,negative currency effects and inflationary cost pressure. Results from the Neuss smelter have improved driven by higher all-inmetal price development.
Operational and financial information
Fourth
quarter
2017
Third
quarter
2017
Change
prior
quarter
Fourth
quarter
2016
Change
prior year
quarter
Year
2017
Year
2016
Earnings before financial items and tax (EBIT) (NOK million) 1 722 1 722
Underlying EBIT (NOK million) 284 284
Underlying EBITDA (NOK million) 728 728
Sales volumes to external markets (kmt) 318 318
Sales volumes to external markets (kmt) - Business units
Extrusion Europe 130 130
Extrusion North America 134 134
Building Systems 19 19
Precision tubing 34 34
Extruded Solutions 318 318
Extruded Solutions
The new Extruded Solutions business area was formed at the beginning of the fourth quarter following Hydro's acquisition ofthe remaining 50 percent of Sapa shares. The business areas' financial results are fully consolidated from the closing dateOctober 2, 2017. Extruded Solutions’ underlying EBIT includes certain effects of the acquisition such as increaseddepreciation and amortization following fair value adjustments related to long-lived assets.
Sapa's financial results prior to the transaction were reported as a 50 percent owned joint venture in the Other andeliminations section.
For pro forma information related to the Extruded Solutions business area and a more detailed results explanation please seethe corresponding section later in this report.
For further details on the acquisition please also see note 4: Acquisition of Sapa.
FOURTH QUARTER REPORT 2017 12

Energy
Operational and financial information
Fourth
quarter
2017
Third
quarter
2017
Change
prior
quarter
Fourth
quarter
2016
Change
prior year
quarter
Year
2017
Year
2016
Earnings before financial items and tax (EBIT) (NOK million) 457 368 24 % 364 26 % 1 531 1 343
Underlying EBIT (NOK million) 457 368 24 % 359 27 % 1 531 1 343
Underlying EBITDA (NOK million) 519 424 23 % 412 26 % 1 757 1 553
Direct production costs (NOK million)1)
171 154 11 % 156 9 % 614 639
Power production (GWh) 3 089 2 509 23 % 2 551 21 % 10 835 11 332
External power sourcing (GWh) 2 498 2 497 - 2 238 12 % 9 562 8 935
Internal contract sales (GWh) 3 724 3 723 - 3 379 10 % 14 424 13 435
External contract sales (GWh) 230 115 >100 % 235 (2) % 767 769
Net spot sales (GWh) 1 633 1 168 40 % 1 176 39 % 5 206 6 063
1) Includes maintenance and operational costs, transmission costs, property taxes and concession fees for Hydro as operator.
Underlying EBIT for Energy increased compared to the previous quarter, mainly due to higher production and prices, partlyoffset by lower commercial results. The high production during the fourth quarter was driven by high inflow as well aspreparation for maintenance in the first quarter.
Compared to the fourth quarter of the previous year underlying EBIT increased mainly due to higher production.
Compared to the previous year underlying EBIT increased mainly due to higher prices, improved commercial results and lowerarea costs, partly offset by lower production.
FOURTH QUARTER REPORT 201713

Other and eliminations
Financial information
NOK million
Fourth
quarter
2017
Third
quarter
2017
Change
prior
quarter
Fourth
quarter
2016
Change
prior year
quarter
Year
2017
Year
2016
Earnings before financial items and tax (EBIT) (810) 222 >(100) % 38 >(100) % (495) 605
Sapa (50%) 1)
209 (100) % 167 (100) % 819 777
Other (279) (96) >(100) % (130) >(100) % (586) (458)
Eliminations (436) 68 >(100) % (38) >(100) % (522) 61
Underlying EBIT (715) 181 >(100) % (1) >(100) % (289) 380
1) Hydro's share of Sapa's underlying net income.
Other is mainly comprised of head office costs, and costs related to holding companies as well as earnings from Hydro'sindustrial insurance company. Other also includes transaction and integration costs related to the Sapa transaction.
Eliminations are comprised mainly of unrealized gains and losses on inventories purchased from group companies whichfluctuate with product flows, volumes and margin developments throughout Hydro's value chain.
Operational and financial information Sapa (50%)
Fourth
quarter
2017
Third
quarter
2017
Change
prior
quarter
Fourth
quarter
2016
Change
prior year
quarter
Year
2017
Year
2016
Revenue (NOK million) 6 992 6 105 21 808 26 663
Underlying EBIT (NOK million) 294 168 1 140 1 099
Underlying EBITDA (NOK million) 456 327 1 632 1 749
Net income (loss) (NOK million) 215 190 800 889
Underlying net income (loss) (NOK million) 209 167 819 777
Sales volumes (kmt) 170 155 527 682
Following the completion of the transaction to acquire the remaining 50 percent of Sapa shares, Sapa has been renamedExtruded Solutions and the fully consolidated financial results are presented in the Extruded Solutions business area.
FOURTH QUARTER REPORT 2017 14

Finance
Financial income (expense)
NOK million
Fourth
quarter
2017
Third
quarter
2017
Change
prior
quarter
Fourth
quarter
2016
Change
prior year
quarter
Year
2017
Year
2016
Interest income 67 86 (22) % 116 (43) % 322 468
Dividends received and net gain (loss) on securities 75 16 >100% 20 >100% 159 105
Financial income 142 101 40 % 137 4 % 481 574
Interest expense (115) (62) (86) % (121) 5 % (378) (362)
Capitalized interest 8 21 (61) % 14 (39) % 76 97
Net foreign exchange gain (loss) (696) 520 >(100%) (26) >(100%) (875) 2 266
Net interest on pension liability (51) (34) (49) % (64) 21 % (152) (210)
Other (65) (61) (6) % (78) 17 % (266) (240)
Financial expense (919) 384 >(100%) (277) >(100%) (1 596) 1 552
Financial income (expense), net (776) 485 >(100%) (140) >(100%) (1 114) 2 126
The net foreign exchange loss, mainly unrealized, of NOK 696 million reflects primarily a strengthening of EUR forward ratesagainst NOK. This resulted in an unrealized loss on the embedded derivatives in power contracts denominated in EUR. Inaddition the strengthening of USD against BRL affecting US dollar debt in Brazil contributed to the foreign exchange loss.
Interest expenses increased in the fourth quarter due to an increase in debt. Norsk Hydro ASA has successfully issued seniorunsecured bond issues in total of NOK 3.0 billion and SEK 3.0 billion. The purpose of the bond issues are general corporatepurposes and refinancing of debt raised in connection with the acquisition of Sapa AS.
Income tax expense amounted to NOK 135 million for the fourth quarter of 2017 or about 4 percent of income before tax.For the full year 2017, tax expense was about 17 percent of income before tax. The low tax rate results from a tax-free gain onthe revaluation of Hydro's previous ownership interests in Sapa and positive effects from US tax reform, partly offset by arelatively high share of reported income before tax subject to power sur tax.
Tax
FOURTH QUARTER REPORT 201715

Pro forma information
The following section is comprised of selected financial and operating information and a discussion of underlyingdevelopments including 100 percent of the acquired Sapa business for the full year 2017 on a comparable basis with the earlierperiods presented. In addition to the following pro forma information, please see note 4 to the condensed consolidatedfinancial statements later in this report for more information on the acquisition.
Key financial information
NOK million
Fourth
quarter
2017
Third
quarter
2017
Change
prior
quarter
Fourth
quarter
2016
Change
prior year
quarter
Year
2017
Year
2016
Revenue 38 803 35 454 9 % 32 568 19 % 148 920 130 630
Earnings before financial items and tax (EBIT) 3 048 2 640 15 % 2 045 49 % 11 927 8 229
Items excluded from underlying EBIT 508 114 >100 % (128) >100 % 510 (698)
Underlying EBIT1)
3 555 2 754 29 % 1 917 85 % 12 437 7 531
Earnings before financial items, tax, depreciation and
amortization (EBITDA) 5 016 4 482 12 % 4 038 24 % 19 294 15 331
Underlying EBITDA 5 524 4 596 20 % 3 927 41 % 19 786 14 633
Summary consolidated underlying financial and operating results
1) Underlying EBIT includes certain effects of the acquisition such as increased depreciation and amortization following fair value adjustment related to long-lived assets.
Operational and financial information
Fourth
quarter
2017
Third
quarter
2017
Change
prior
quarter
Fourth
quarter
2016
Change
prior year
quarter
Year
2017
Year
2016
Revenue (NOK million) 14 153 13 983 1 % 12 210 16 % 57 769 53 327
Earnings before financial items and tax (EBIT) (NOK million) 258 525 (51) % 272 (5) % 2 265 2 109
Unrealized derivative effects (NOK million) (4) (15) 73 % (82) 95 % 36 (333)
Significant rationalization charges and closure costs (NOK million) 29 - - 67 (56) % 29 109
Items excluded from underlying EBIT (NOK million) 25 (15) >100 % (15) >100 % 65 (224)
Underlying EBIT (NOK million)1)
284 510 (44) % 257 11 % 2 330 1 885
Earnings before financial items, tax, depreciation and
amortization (EBITDA) 703 918 (23) % 667 5 % 3 917 3 739
Underlying EBITDA (NOK million) 728 903 (19) % 652 12 % 3 982 3 516
Sales volumes to external markets (kmt) 318 339 (6) % 310 3 % 1 372 1 365
Sales volumes to external markets (kmt) - Business units
Extrusion Europe 130 138 (5) % 125 4 % 568 555
Extrusion North America 134 148 (9) % 131 2 % 584 585
Building Systems 19 18 6 % 18 5 % 78 76
Precision tubing 34 36 (4) % 35 (3) % 143 149
Extruded Solutions 318 339 (6) % 310 3 % 1 372 1 365
Extruded Solutions
1) Underlying EBIT includes certain effects of the acquisition such as increased depreciation and amortization following fair value adjustment related to long-lived assets.
FOURTH QUARTER REPORT 2017 16

Underlying EBIT for Extruded Solutions decreased compared to the pro forma underlying EBIT in the third quarter primarilydue to seasonally lower volumes, partly offset by increased margins.
Compared to the pro forma underlying EBIT in the fourth quarter 2016 the underlying EBIT increased in 2017, driven byimproved sales volumes and margins.
Pro forma underlying EBIT for the year increased compared to 2016. The increase was driven by increasing margins due to ahigher share of value-add business, partly offset by increased production costs.
FOURTH QUARTER REPORT 201717

Interim financial statements
Condensed consolidated statements of income (unaudited)
Fourth quarter Year
NOK million, except per share data 2017 2016 2017 2016
Revenue 38 803 21 250 109 220 81 953
Share of the profit (loss) in equity accounted investments 256 236 1 527 985
Other income, net 2 358 342 2 947 1 030
Total revenue and income 41 417 21 829 113 693 83 969
Raw material and energy expense 24 411 13 391 69 848 52 151
Employee benefit expense 5 578 2 382 13 285 9 485
Depreciation, amortization and impairment 1 970 1 599 6 162 5 474
Other expenses 4 948 2 493 12 209 9 848
Total expenses 36 907 19 866 101 504 76 958
Earnings before financial items and tax (EBIT) 4 511 1 964 12 189 7 011
Financial income 142 137 481 574
Financial expense (919) (277) (1 596) 1 552
Financial income (expense), net (776) (140) (1 114) 2 126
Income (loss) before tax 3 735 1 823 11 075 9 137
Income taxes (135) (815) (1 891) (2 551)
Net income (loss) 3 600 1 008 9 184 6 586
Net income (loss) attributable to non-controlling interests 100 (51) 401 199
Net income (loss) attributable to Hydro shareholders 3 499 1 059 8 783 6 388
Basic and diluted earnings per share attributable to Hydro shareholders (in NOK) 1)
1.71 0.52 4.30 3.13
Weighted average number of outstanding shares (million) 2 045 2 043 2 044 2 042
1) Basic earnings per share are computed using the weighted average number of ordinary shares outstanding. There were no significant diluting elements.
The accompanying notes are an integral part of the condensed consolidated financial statements (unaudited).
FOURTH QUARTER REPORT 2017 18

Condensed consolidated statements of comprehensive income (unaudited)
NOK million 2017 2016 2017 2016
Net income (loss) 3 600 1 008 9 184 6 586
Other comprehensive income
Items that will not be reclassified to income statement:
Remeasurement postemployment benefits, net of tax (276) 1 385 761 178
Share of remeasurement postemployement benefits of equity accounted investments, net
of tax - (41) (2) (41)
Total (276) 1 344 759 137
Items that will be reclassified to income statement:
Currency translation differences, net of tax 2 002 3 669 (1 387) 4 114
Unrealized gain (loss) on securities, net of tax (170) (16) (255) (47)
Cash flow hedges, net of tax 102 79 174 115
Share of items that will be reclassified to income statement of equity accounted
investments, net of tax (718) 277 (736) (281)
Total 1 216 4 009 (2 203) 3 901
Other comprehensive income 940 5 352 (1 444) 4 038
Total comprehensive income 4 540 6 361 7 740 10 624
Total comprehensive income attributable to non-controlling interests 150 332 103 889
Total comprehensive income attributable to Hydro shareholders 4 390 6 029 7 637 9 735
Fourth quarter Year
The accompanying notes are an integral part of the condensed consolidated financial statements (unaudited).
FOURTH QUARTER REPORT 201719

Condensed balance sheets (unaudited)
NOK million, except number of shares 2017 2016
Assets
Cash and cash equivalents 11 828 8 037
Short-term investments 1 311 4 611
Accounts receivables 19 983 10 884
Inventories 20 873 12 381
Other current assets 602 457
Total current assets 54 597 36 371
Property, plant and equipment 73 020 58 734
Intangible assets 12 712 5 811
Investments accounted for using the equity method 11 221 19 807
Prepaid pension 5 750 4 195
Other non-current assets 6 028 5 875
Total non-current assets 108 730 94 422
Total assets 163 327 130 793
Liabilities and equity
Bank loans and other interest-bearing short-term debt 8 245 3 283
Trade and other payables 19 561 10 108
Other current liabilities 5 521 3 716
Total current liabilities 33 326 17 106
Long-term debt 9 012 3 397
Provisions 5 828 4 384
Pension liabilities 15 118 12 871
Deferred tax liabilities 3 522 2 384
Other non-current liabilities 4 269 3 011
Total non-current liabilities 37 749 26 047
Total liabilities 71 075 43 153
Equity attributable to Hydro shareholders 87 074 81 906
Non-controlling interests 5 178 5 733
Total equity 92 252 87 640
Total liabilities and equity 163 327 130 793
Total number of outstanding shares (million) 2 045 2 043
December 31
The accompanying notes are an integral part of the condensed consolidated financial statements (unaudited).
FOURTH QUARTER REPORT 2017 20

Condensed consolidated statements of cash flows (unaudited)
NOK million 2017 2016 2017 2016
Operating activities
Net income 3 600 1 008 9 184 6 586
Depreciation, amortization and impairment 1 970 1 599 6 162 5 474
Other adjustments 829 1 640 (999) (2 042)
Net cash provided by operating activities 6 399 4 247 14 347 10 018
Investing activities
Purchases of property, plant and equipment (3 049) (2 562) (7 296) (6 913)
Purchases of other long-term investments (11 115) (61) (11 190) (183)
Purchases of short-term investments - (1 600) (5 094) (4 650)
Proceeds from long-term investing activities 41 238 742 1 115
Proceeds from sales of short-term investments 552 1 300 8 402 5 850
Net cash used in investing activities (13 571) (2 685) (14 436) (4 781)
Financing activities
Loan proceeds 7 500 1 377 15 271 5 208
Principal repayments (5 290) (2 916) (10 917) (7 525)
Net increase (decrease) in other short-term debt (1 268) (72) 2 515 265
Proceeds from shares issued 11 5 40 28
Dividends paid (74) (117) (3 069) (2 362)
Net cash provided by (used in) financing activities 879 (1 723) 3 840 (4 386)
Foreign currency effects on cash 268 246 40 269
Net increase (decrease) in cash and cash equivalents (6 025) 85 3 791 1 120
Cash and cash equivalents at beginning of period 17 853 7 952 8 037 6 917
Cash and cash equivalents at end of period 11 828 8 037 11 828 8 037
Fourth quarter Year
The accompanying notes are an integral part of the condensed consolidated financial statements (unaudited).
FOURTH QUARTER REPORT 201721

Condensed consolidated statements of changes in equity (unaudited)
Equity
Additional Other attributable Non-
Share paid-in Treasury Retained components to Hydro controlling Total
NOK million capital capital shares earnings of equity shareholders interests equity
December 31, 2015 2 272 29 068 (913) 45 850 (2 107) 74 169 5 159 79 329
Changes in equity for 2016
Treasury shares issued to employees 1 44 45 45
Dividends (2 043) (2 043) (320) (2 362)
Capital contribution in subsidiaries 4 4
Items not reclassified to income
statement in subsidiaries sold 16 (16) - -
Total comprehensive income for the
period 6 388 3 348 9 735 889 10 624
December 31, 2016 2 272 29 070 (870) 50 210 1 224 81 906 5 733 87 640
Changes in equity for 2017
Treasury shares issued to employees 27 60 87 87
Dividends (2 556) (2 556) (702) (3 258)
Capital contribution in subsidiaries 3 3
Items not reclassified to income
statement in subsidiaries acquired
and sold, net (3) 3 - 40 40
Total comprehensive income for the
period 8 783 (1 147) 7 637 103 7 740
December 31, 2017 2 272 29 097 (810) 56 435 80 87 074 5 178 92 252
The accompanying notes are an integral part of the condensed consolidated financial statements (unaudited).
FOURTH QUARTER REPORT 2017 22

Notes to the condensed consolidated financial statements
Note 1: Accounting policies
All reported figures in the financial statements are based on International Financial Reporting Standards (IFRS). Hydro'saccounting principles are presented in note 2 Significant accounting policies in Hydro's Financial Statements - 2016.
The interim accounts are presented in accordance with IAS 34 Interim Financial Reporting. The condensed consolidatedinterim financial information should be read in conjunction with Hydro's Financial Statements - 2016 that are a part ofHydro's Annual Report - 2016.
As a result of rounding adjustments, the figures in one or more columns may not add up to the total of that column.
Hydro identifies its reportable segments and discloses segment information under IFRS 8 Operating Segments. This standardrequires Hydro to identify its segments according to the organization and reporting structure used by management. SeeHydro's Financial statements - 2016 note 7 Operating and geographic segment information for a description of Hydro'smanagement model and segments, including a description of Hydro's segment measures and accounting principles used forsegment reporting. The Extruded Solutions segment includes the business acquired as a 100 percent owned subsidiary infourth quarter 2017. For the previous periods, the segment includes the same business reported as 50 percent owned jointventure, reported using the equity method. The segment was previously named Sapa. The acquisition is described in Note 4Acquisition of Sapa.
Note 2: Operating segment information
The following tables include information about Hydro's operating segments, including a reconciliation of EBITDA to EBITfor Hydro's operating segments.
FOURTH QUARTER REPORT 201723

Fourth quarter Year
NOK million 2017 2016 2017 2016
Total revenue
Bauxite & Alumina 8 040 5 834 25 421 19 543
Primary Metal 9 291 7 262 36 466 30 862
Metal Markets 12 991 10 117 50 606 43 254
Rolled Products 6 434 5 262 25 715 22 632
Extruded Solutions1)
14 153 - 14 153 -
Energy 2 169 2 314 7 705 7 180
Other and eliminations (14 276) (9 539) (50 847) (41 517)
Total 38 803 21 250 109 220 81 953
External revenue
Bauxite & Alumina 5 095 3 921 15 188 12 059
Primary Metal 2 068 1 582 7 578 5 529
Metal Markets 10 414 9 440 44 264 39 420
Rolled Products 6 375 5 205 25 538 22 469
Extruded Solutions1)
14 083 - 14 083 -
Energy 767 1 093 2 550 2 426
Other and eliminations - 10 18 50
Total 38 803 21 250 109 220 81 953
Internal revenue
Bauxite & Alumina 2 944 1 914 10 234 7 484
Primary Metal 7 223 5 680 28 888 25 333
Metal Markets 2 577 677 6 341 3 834
Rolled Products 59 57 178 163
Extruded Solutions1)
70 - 70 -
Energy 1 403 1 221 5 155 4 753
Other and eliminations (14 276) (9 549) (50 865) (41 567)
Total - - - -
Share of the profit (loss) in equity accounted investments
Bauxite & Alumina - - - -
Primary Metal 258 48 745 96
Metal Markets - - - -
Rolled Products - - - -
Extruded Solutions1)
12 190 812 889
Energy (7) - (7) -
Other and eliminations (7) (1) (24) -
Total 256 236 1 527 985
FOURTH QUARTER REPORT 2017 24

Fourth quarter Year
NOK million 2017 2016 2017 2016
Depreciation, amortization and impairment
Bauxite & Alumina 679 833 2 486 2 279
Primary Metal 526 467 2 026 1 913
Metal Markets 24 23 95 94
Rolled Products 230 216 860 799
Extruded Solutions1)
444 - 444 -
Energy 60 53 223 210
Other and eliminations 7 8 28 178
Total 1 970 1 599 6 162 5 474
Earnings before financial items and tax (EBIT)2)
Bauxite & Alumina 1 872 680 3 704 1 196
Primary Metal 1 112 619 4 729 2 285
Metal Markets 158 172 485 629
Rolled Products - 91 512 953
Extruded Solutions1)
1 722 190 2 522 889
Energy 457 364 1 531 1 343
Other and eliminations (810) (151) (1 295) (285)
Total 4 511 1 964 12 189 7 011
EBITDA
Bauxite & Alumina 2 551 1 513 6 190 3 475
Primary Metal 1 635 1 086 6 747 4 199
Metal Markets 182 195 579 723
Rolled Products 230 307 1 372 1 752
Extruded Solutions1)
2 166 190 2 966 889
Energy 519 416 1 757 1 553
Other and eliminations (803) (143) (1 268) (107)
Total 6 481 3 563 18 344 12 485
Investments3)
Bauxite & Alumina 662 1 629 1 634 3 544
Primary Metal 1 144 1 057 3 537 3 396
Metal Markets 70 58 143 101
Rolled Products 496 661 997 1 615
Extruded Solutions1)
22 137 - 22 137 -
Energy 114 115 361 318
Other and eliminations 8 22 39 162
Total 24 632 3 541 28 848 9 137
1) The Extruded Solutions segment includes the business acquired as a 100 percent owned subsidiary in fourth quarter 2017. For the previous periods, the segment includes the samebusiness reported as 50 percent owned joint venture, reported using the equity method.
2) Total segment EBIT is the same as Hydro group's total EBIT. Financial income and expense are not allocated to the segments. There are no reconciling items between segment EBIT toHydro EBIT. Therefore, a separate reconciliation table is not presented.
3) Additions to property, plant and equipment (capital expenditures) plus long-term securities, intangible assets, long-term advances and investments in equity accounted investments,including amounts recognized in business combinations.
FOURTH QUARTER REPORT 201725

NOK million EBIT
Depr.,
amor. and
impairment Other items2)
EBITDA
EBIT - EBITDA Fourth quarter
Bauxite & Alumina 1 872 679 - 2 551
Primary Metal 1 112 526 (2) 1 635
Metal Markets 158 24 - 182
Rolled Products - 230 - 230
Extruded Solutions1)
1 722 444 1 2 166
Energy 457 60 2 519
Other and eliminations (810) 7 - (803)
Total 4 511 1 970 - 6 481
NOK million EBIT
Depr.,
amor. and
impairment Other items2)
EBITDA
EBIT - EBITDA
Bauxite & Alumina 3 704 2 486 - 6 190
Primary Metal 4 729 2 026 (9) 6 747
Metal Markets 485 95 - 579
Rolled Products 512 860 - 1 372
Extruded Solutions1)
2 522 444 1 2 966
Energy 1 531 223 3 1 757
Other and eliminations (1 295) 28 - (1 268)
Total 12 189 6 162 (7) 18 344
1) The Extruded Solutions segment includes the business acquired as a 100 percent owned subsidiary in fourth quarter 2017. For the previous periods, the segment includes the samebusiness reported as 50 percent owned joint venture, reported using the equity method.
2) Investment grants, and amortization of excess values in equity accounted investments and impairment loss of such investments.
Hydro is involved in or threatened with various legal and tax matters arising in the ordinary course of business. Hydro is of theopinion that it is not probable that the resulting liabilities, if any, will have a material adverse effect on its consolidated resultsof operations, liquidity or financial position.
Note 3: Contingent liabilities
On July 10, 2017, Hydro entered into a contract to acquire 50 percent of the shares in Sapa AS, which was a joint ventureowned 50 percent by Hydro and 50 percent by Orkla, a listed company in Norway. Following completion of the transactionon October 2, 2017, Hydro owns 100 percent of the parent company Sapa AS, which is now renamed Hydro ExtrudedSolutions AS.
Note 4: Acquisition of Sapa
The acquisition of Orkla’s ownership interest in Sapa confirms Hydro’s strategy of being integrated and the combination isintended to make Hydro fully integrated across the value chain and markets. Hydro will increase its strength in technology,research and development, innovation and product development, and the service offering to the customers.
Hydro has paid a cash consideration of NOK 11 860 million for the 50 percent shares acquired on October 2, with certainpost-closing adjustments made during December resulting in a payment of NOK 46 million for the shares. The pricing isbased on an agreed enterprise value of NOK 27 billion for 100 percent of Sapa on a cash and debt free basis, adjusted for
FOURTH QUARTER REPORT 2017 26

certain items such as level of working capital and investments made during 2017. The fair value of Hydro’s previously held 50percent interest in Sapa is estimated at NOK 8,906 billion, resulting in a total value of Sapa’s net assets of NOK 20,813billion. A remeasurement gain of NOK 2,171 million, including certain items previously recognized in Other ComprehensiveIncome of NOK 751 million, was recognized in Other income, net, in the fourth quarter of 2017.
Acquisition related costs incurred during 2017 were approximately NOK 35 million, included in operating costs.
Hydro has started the process of identifying the fair value of assets acquired and liabilities assumed. This process depends onaccess to detailed information of Sapa’s businesses, and many of these procedures could thus not start before Hydro obtainedcontrol with Sapa at completion of the transaction. The estimated fair value of net assets of Sapa included in the table beloware the current estimates based on the valuation of the specific assets and liabilities, which is not yet completed. The valuationof property, plant and equipment and intangible assets is considered good estimates, however, certain quality assuranceprocedures have not yet been completed.
Sapa had uncertain and contingent liabilities mainly related to historic environmental issues on sites held and sites resold toothers prior to Hydro’s acquisition, as well as certain tax exposures. Investigation of the magnitude of such uncertain andcontingent liabilities is not yet completed. Further, Sapa Profiles, Inc, a US subsidiary of Sapa, is under investigation by theUnited States Department of Justice. This matter is further described in the section Additional factors impacting Hydro. Theoutcome of this investigation is not known, and the estimate included in the summary of assets and liabilities below may thusbe changed. As no claim has been specified towards the company, a range of possible outcomes has not been established.Hydro will be entitled to reimbursement from the seller for 50 percent of the amount to be finally paid related to this case, andfor certain environmental costs. The preliminary estimate of contingent obligations in the acquired business included in thetable below amounts to about NOK 850 million and a related indemnity asset receivable from the seller of about NOK 130million.
A preliminary estimate of goodwill in the transaction amounts to NOK 4,119 million, including goodwill recognized in Sapaprior to the acquisition, and is reflected in the preliminary purchase price allocation. Significant contributors to the estimatedgoodwill are synergies in the transaction, the assembled and skilled work force in the organization as well as the time value ofdeferred tax liabilities recognized at nominal amounts as required by IFRS.
Any adjustments in later period will impact deferred tax and goodwill in addition to the item valued. Depreciation andamortization of assets may be impacted should the value of property, plant and equipment or intangible assets, or theremaining useful life of such assets, be reconsidered in later periods. The final fair value assessment is required to be completedwithin 12 months from completion of the transaction, and may differ from these estimates.
FOURTH QUARTER REPORT 201727

Acquired assets and liabilities
NOK million
Cash and cash equivalents 892
Accounts receivables 8 775
Inventories 6 469
Other current assets 233
Total current assets 16 369
Property, plant and equipment 14 052
Intangible assets, including goodwill 7 016
Other non-current assets 1 969
Total non-current assets 23 037
Total assets acquired 39 405
Bank loans and other interest-bearing short-term debt 3 556
Other current liabilities 10 081
Total non-current liabilities 13 637
Long-term debt 64
Deferred tax liabilities 2 486
Other non-current liabilities 2 365
Total non-current liabilities 4 915
Net assets acquired 20 853
Non-controlling interests 40
Net assets acquired by Hydro 20 813
The results from January to September for Sapa are reported as result from the 50 percent owned joint venture accounted forunder the equity method, no results from the acquired businesses were included in Hydro’s consolidated income statement asresults from the Group's controlled business as of September 30, 2017. The result for the fourth quarter is included in theconsolidated income statement, including certain effects of the acquisition, such as the holding gain on the previously heldshares, depreciation and amortization of fair value adjustments related to long-lived assets, and the expensed mark-up oninventory values. The acquired business is reported as a separate segment, Extruded Solutions in the period after theacquisition. Revenue in the acquired business for the fourth quarter of 2017 amounted to NOK 14,153 million. Earningsbefore financial items and tax (EBIT) from the acquired business, including the expensed mark-up on inventory valuesamounted to a loss of NOK 449 million for the fourth quarter. Excluding the higher cost of goods sold, EBIT amounted to apositive NOK 258 million.
The following information represents pro forma financial information as if the acquisition was completed as of the beginningof 2017. The pro forma financial information is based on Hydro’s interim financial statements as of December 31, 2017, andSapa’s management reporting as of September 30, 2017. This pro forma financial information is based on the transactioncompleted by Hydro and Orkla as of October 2, 2017. Terms of the transaction may have been different had the acquisitionbeen completed at an earlier time. Items directly related to the transaction as such, including the holding gain on previouslyheld shares and the expensed mark-up on inventory values as of the transaction date has been excluded from the pro formainformation as those items are not considered illustrative for the result of the combined businesses on an ongoing basis. Proforma information has been prepared for information purposes only, and is not intended to indicate what the results ofoperations would have been if the transaction had occurred at the beginning of 2017.
FOURTH QUARTER REPORT 2017 28

Pro forma combined financial information Hydro
NOK million 2017
Revenue 148 920
Earnings before financial items and tax (EBIT) 11 927
Net income 8 090
Net income (loss) attributable to non-controlling interests 402
Net income (loss) attributable to Hydro shareholders 7 687
Hydro issued an information memorandum dated July 31, 2017 describing the acquisition. The document contains moredetailed information about the transaction, and is available at www.hydro.com.
FOURTH QUARTER REPORT 201729

Alternative performance measures (APMs)
Alternative performance measures, i.e. financial performance measures not within the applicable financial reportingframework, are used by Hydro to provide supplemental information, by excluding items that, in Hydro’s view, does not give anindication of the periodic operating results or cash flows of Hydro. Financial APMs are intended to enhance comparability ofthe results and cash flows from period to period, and it is Hydro’s experience that these are frequently used by analysts,investors and other parties. Management also uses these measures internally to drive performance in terms of long-term targetsetting and as basis for performance related pay. These measures are adjusted IFRS measures defined, calculated and used in aconsistent and transparent manner over the years and across the company where relevant. Operational measures such as, butnot limited to, volumes, prices per mt, production costs and improvement programs are not defined as financial APMs. Toprovide a better understanding of the company's underlying financial performance for the relevant period, Hydro focuses onunderlying EBIT in the discussions on periodic underlying financial and operating results and liquidity from the business areasand the group, while effects excluded from underlying EBIT and net income (loss) are discussed separately in the section onreported EBIT and net income. Financial APMs should not be considered as a substitute for measures of performance inaccordance with the IFRS. Disclosures of APMs are subject to established internal control procedures.
Hydro's financial APMs
• EBIT: Income (loss) before tax, financial income and expense.
• Underlying EBIT: EBIT +/- identified items to be excluded from underlying EBIT as described below.
• EBITDA: EBIT + depreciation, amortization and impairments, net of investment grants.
• Underlying EBITDA: EBITDA +/- identified items to be excluded from underlying EBIT as described below + impairments.
• Underlying net income (loss): Net income (loss) +/- items to be excluded from underlying income (loss) as described below.
• Underlying earnings per share: Underlying net income (loss) attributable to Hydro shareholders divided by a weighted averageof outstanding shares (ref.: the interim financial statements).
• Investments: Additions to property, plant and equipment (capital expenditures) plus long-term securities, intangible assets,long-term advances and investments in equity accounted investments, including amounts recognized in businesscombinations.
• Adjusted net cash (debt): Short- and long-term interest-bearing debt adjusted for Hydro's liquidity positions, and for liquiditypositions regarded unavailable for servicing debt, pension obligation and other obligations which are considered debt-like innature.
• (Underlying) RoaCE: (Underlying) RoaCE is defined as (underlying) "Earnings after tax" divided by average "Capitalemployed". (Underlying) "Earnings after tax" is defined as (underlying) "Earnings before financial items and tax" less"Adjusted income tax expense". Since RoaCE represents return to the capital providers before dividend and interestpayments, adjusted income tax expense excludes the tax effects of items reported as "Financial income (expense), net" and inaddition, for underlying figures, the tax effect of items excluded. "Capital Employed" is defined as "Shareholders' Equity",including non-controlling interest plus long-term and short-term interest-bearing debt less "Cash and cash equivalents" and"Short term investments". Capital Employed can be derived by deducting "Cash and cash equivalents, "Short-terminvestments" and "Short-term and long-term interest free liabilities" (including deferred tax liabilities) from "Total assets".The two different approaches yield the same value.
• Metal Markets specific adjustments to underlying EBIT:
• Currency effects include the effects of changes in currency rates on sales and purchase contracts denominated in foreigncurrencies (mainly US dollar and Euro for our European operations) and the effects of changes in currency rates on thefair valuation of derivative contracts (including LME futures) and inventories mainly translated into Norwegian kroner.Hydro manages its external currency exposure on a consolidated basis in order to take advantage of offsetting positions.
• Inventory valuation effects comprise hedging gains and losses relating to inventories. Increasing LME prices result inunrealized hedging losses, while the offsetting gains on physical inventories are not recognized until realized. In period ofdeclining prices, unrealized hedging gains are offset by write-downs of physical inventories.
FOURTH QUARTER REPORT 2017 30

Items excluded from underlying EBIT, EBITDA, net income (loss) and earnings per share
Hydro has defined two categories of items which are excluded from underlying results in all business areas, equity accountedinvestments and at group level. One category is the timing effects, which are unrealized changes to the market value of certainderivatives and the metal effect in Rolled Products. When realized, effects of changes in the market values since the inceptionare included in underlying EBIT. Changes in the market value of the trading portfolio are included in underlying results. Theother category includes material items which are not regarded as part of underlying business performance for the period, suchas major rationalization charges and closure costs, major impairments of property, plant and equipment, effects of disposals ofbusinesses and operating assets, as well as other major effects of a special nature. Materiality is defined as items with a valueabove NOK 20 million. All items excluded from underlying results are reflecting a reversal of transactions recognized in thefinancial statements for the current period, except for the metal effect. Part-owned entities have implemented similaradjustments.
Items excluded from underlying EBIT and net income 1)
NOK million
Fourth
quarter
2017
Third
quarter
2017
Fourth
quarter
2016
Year
2017
Year
2016
Unrealized derivative effects on LME related contracts 140 (30) (87) 220 (401)
Unrealized derivative effects on power and raw material contracts 91 7 (20) 246 (61)
Metal effect, Rolled Products (146) 151 (68) (419) (91)
Significant rationalization charges and closure costs 210 - - 210 192
Impairment charges - - 285 - 426
(Gains)/losses on divestments - - - - (314)
Other effects 212 - (223) 212 (223)
Transaction related effects (Sapa) (1 463) - - (1 463) -
Items excluded in equity accounted investments (Sapa) - (6) (23) 19 (113)
Items excluded from underlying EBIT (956) 123 (135) (974) (586)
Net foreign exchange (gain)/loss 696 (520) 26 875 (2 266)
Calculated income tax effect (523) 123 68 (564) 841
Other adjustments to net income - (125) - (125) (700)
Items excluded from underlying net income (783) (398) (40) (788) (2 712)
Income (loss) tax rate 4 % 22 % 45 % 17 % 28 %
Underlying income (loss) tax rate 19 % 26 % 44 % 24 % 38 %
1) Negative figures indicate reversal of a gain and positive figures indicate reversal of a loss.
• Unrealized derivative effects on LME related contracts include unrealized gains and losses on contracts measured at marketvalue, which are used for operational hedging purposes related to fixed-price customer and supplier contracts, where hedgeaccounting is not applied. Also includes elimination of changes in fair value of certain internal physical aluminium contracts.
• Unrealized derivative effects on power and raw material contracts include unrealized gains and losses on embedded derivativesin raw material and power contracts for Hydro's own use and for financial power contracts used for hedging purposes, aswell as elimination of changes in fair value of embedded derivatives within certain internal power contracts.
• Metal effect in Rolled Products is an effect of timing differences resulting from inventory adjustments due to changingaluminium prices during the production, sales and logistics process, lasting two to three months. As a result, margins areimpacted by timing differences resulting from the FIFO inventory valuation method (first in, first out), due to changingaluminium prices during the process. The effect of inventory write-downs is included. Decreasing aluminium prices in Euroresults in a negative metal effect on margins, while increasing prices have a positive effect.
• Significant rationalization charges and closure costs include costs related to specifically defined major projects, and notconsidered to reflect periodic performance in the individual plants or operations. Such costs involve termination benefits,dismantling of installations and buildings, clean-up activities that exceed legal liabilities, etc. Costs related to regular andcontinuous improvement initiatives are included in underlying results.
• Impairment charges (PP&E and equity accounted investments) relate to significant write-downs of assets or groups of assets toestimated recoverable amounts in the event of an identified loss in value. Gains from reversal of impairment charges aresimultaneously excluded from underlying results.
FOURTH QUARTER REPORT 201731

• (Gains) losses on divestments include a net gain or loss on divested businesses and/or individual major assets.
• Other effects include recognition of pension plan amendments and related curtailments and settlements, insurance proceedscovering asset damage, legal settlements, etc. Insurance proceeds covering lost income are included in underlying results.
• Transaction related effects (Sapa) reflect the net measurement gain relating to previously owned shares in Sapa and aninventory valuation expense related to the Sapa transaction.
• Items excluded in equity accounted investments reflects Hydro's share of items excluded from underlying net income in Sapa,until end of third quarter 2017, and Qatalum and are based on Hydro's definitions, including both timing effects andmaterial items not regarded as part of underlying business performance for the period.
• Net foreign exchange (gain) loss: Realized and unrealized gains and losses on foreign currency denominated accounts receivableand payable, funding and deposits, embedded currency derivatives in certain power contracts and forward currency contractspurchasing and selling currencies that hedge net future cash flows from operations, sales contracts and operating capital.
• Calculated income tax effect: In order to present underlying net income on a basis comparable with our underlying operatingperformance, the underlying income taxes are adjusted for the expected taxable effects on items excluded from underlyingincome before tax.
• Other adjustments to net income include other major financial and tax related effects not regarded as part of the underlyingbusiness performance of the period.
FOURTH QUARTER REPORT 2017 32

Items excluded from underlying EBIT per operating segment and for Other and
eliminations 1)
NOK million
Fourth
quarter
2017
Third
quarter
2017
Fourth
quarter
2016
Year
2017
Year
2016
Impairment charges - - 285 - 285
Other effects2)
- - (254) - (254)
Bauxite & Alumina - - 31 - 31
Unrealized derivative effects on LME related contracts 100 (20) (36) 101 (93)
Unrealized derivative effects on power contracts (16) 36 18 50 (125)
Significant rationalization charges and closure costs 181 - - 181 192
Primary Metal 265 16 (18) 331 (27)
Unrealized derivative effects on LME related contracts 27 31 (20) 58 (119)
Metal Markets 27 31 (20) 58 (119)
Unrealized derivative effects on LME related contracts (4) (35) (16) 41 (183)
Metal effect (146) 151 (68) (419) (91)
(Gains) losses on divestments - - - - 28
Other effects3)
245 - - 245 -
Rolled Products 95 116 (85) (132) (246)
Unrealized derivative effects on LME related contracts (4) (4)
Significant rationalization charges and closure costs 29 29
Transaction related effects (Sapa)4)
(1 463) (1 463)
Extruded Solutions (1 438) (1 438)
Unrealized derivative effects on power contracts - - (4) - -
Energy - - (4) - -
Unrealized derivative effects on power contracts5)
107 (29) (34) 197 64
Unrealized derivative effects on LME related contracts5)
21 (5) (14) 23 (6)
Impairment charges - - - - 140
(Gains)/losses on divestments - - - - (342)
Other effects6)
(33) - 32 (33) 32
Unrealized derivative effects (Sapa) (8) (41) 20 (166)
Significant rationalization charges and closure costs (Sapa) - 34 - 55
Net foreign exchange (gain) loss (Sapa) - (25) 5 (49)
Calculated income tax effect (Sapa) 2 10 (6) 48
Other and eliminations 95 (40) (39) 206 (225)
Items excluded from underlying EBIT (956) 123 (135) (974) (586)
1) Negative figures indicate reversal of a gain and positive figures indicate reversal of a loss.
2) Other effects in Bauxite & Alumina include a compensation relating to the completion of outstanding contractual arrangements with Vale.
3) Other effects in Rolled Products reflect a charge related to a customs case in Germany.
4) Transaction related effects include the revaluation gain of Hydro’s pre-transactional 50 percent share in Sapa, as well as the fair value allocated to inventory of finished goods and to thebacklog of contractual deliveries as of closure, sold during fourth quarter 2017.
5) Unrealized derivative effects on power contracts and LME related contracts result from elimination of changes in the valuation of embedded derivatives within certain internal powercontracts and in the valuation of certain internal aluminium contracts.
6) Other effects in Other and eliminations include the remeasurement of environmental liabilities related to closed business in Germany.
Underlying EBITDA
NOK million
Fourth
quarter
2017
Third
quarter
2017
Change
prior
quarter
Fourth
quarter
2016
Change
prior year
quarter
Year
2017
Year
2016
EBITDA 6 481 3 766 72 % 3 563 82 % 18 344 12 485
Items excluded from underlying EBIT (956) 123 >(100) % (135) >(100) % (974) (586)
Reversal of impairments - - - (285) 100 % - (426)
Underlying EBITDA 5 524 3 889 42 % 3 143 76 % 17 369 11 474
FOURTH QUARTER REPORT 201733
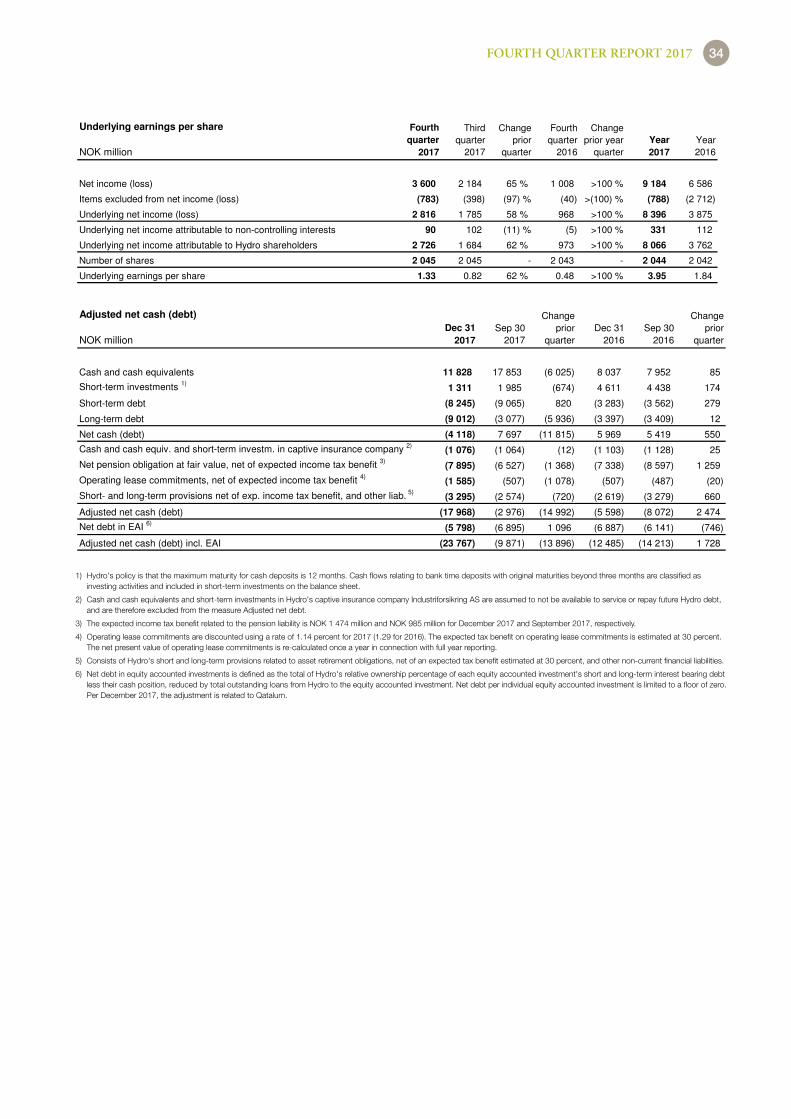
Underlying earnings per share
NOK million
Fourth
quarter
2017
Third
quarter
2017
Change
prior
quarter
Fourth
quarter
2016
Change
prior year
quarter
Year
2017
Year
2016
Net income (loss) 3 600 2 184 65 % 1 008 >100 % 9 184 6 586
Items excluded from net income (loss) (783) (398) (97) % (40) >(100) % (788) (2 712)
Underlying net income (loss) 2 816 1 785 58 % 968 >100 % 8 396 3 875
Underlying net income attributable to non-controlling interests 90 102 (11) % (5) >100 % 331 112
Underlying net income attributable to Hydro shareholders 2 726 1 684 62 % 973 >100 % 8 066 3 762
Number of shares 2 045 2 045 - 2 043 - 2 044 2 042
Underlying earnings per share 1.33 0.82 62 % 0.48 >100 % 3.95 1.84
Adjusted net cash (debt)
NOK million
Dec 31
2017
Sep 30
2017
Change
prior
quarter
Dec 31
2016
Sep 30
2016
Change
prior
quarter
Cash and cash equivalents 11 828 17 853 (6 025) 8 037 7 952 85
Short-term investments 1)
1 311 1 985 (674) 4 611 4 438 174
Short-term debt (8 245) (9 065) 820 (3 283) (3 562) 279
Long-term debt (9 012) (3 077) (5 936) (3 397) (3 409) 12
Net cash (debt) (4 118) 7 697 (11 815) 5 969 5 419 550
Cash and cash equiv. and short-term investm. in captive insurance company 2)
(1 076) (1 064) (12) (1 103) (1 128) 25
Net pension obligation at fair value, net of expected income tax benefit 3)
(7 895) (6 527) (1 368) (7 338) (8 597) 1 259
Operating lease commitments, net of expected income tax benefit 4)
(1 585) (507) (1 078) (507) (487) (20)
Short- and long-term provisions net of exp. income tax benefit, and other liab. 5)
(3 295) (2 574) (720) (2 619) (3 279) 660
Adjusted net cash (debt) (17 968) (2 976) (14 992) (5 598) (8 072) 2 474
Net debt in EAI 6)
(5 798) (6 895) 1 096 (6 887) (6 141) (746)
Adjusted net cash (debt) incl. EAI (23 767) (9 871) (13 896) (12 485) (14 213) 1 728
1) Hydro's policy is that the maximum maturity for cash deposits is 12 months. Cash flows relating to bank time deposits with original maturities beyond three months are classified asinvesting activities and included in short-term investments on the balance sheet.
2) Cash and cash equivalents and short-term investments in Hydro's captive insurance company Industriforsikring AS are assumed to not be available to service or repay future Hydro debt,and are therefore excluded from the measure Adjusted net debt.
3) The expected income tax benefit related to the pension liability is NOK 1 474 million and NOK 985 million for December 2017 and September 2017, respectively.
4) Operating lease commitments are discounted using a rate of 1.14 percent for 2017 (1.29 for 2016). The expected tax benefit on operating lease commitments is estimated at 30 percent.The net present value of operating lease commitments is re-calculated once a year in connection with full year reporting.
5) Consists of Hydro's short and long-term provisions related to asset retirement obligations, net of an expected tax benefit estimated at 30 percent, and other non-current financial liabilities.
6) Net debt in equity accounted investments is defined as the total of Hydro's relative ownership percentage of each equity accounted investment's short and long-term interest bearing debtless their cash position, reduced by total outstanding loans from Hydro to the equity accounted investment. Net debt per individual equity accounted investment is limited to a floor of zero.Per December 2017, the adjustment is related to Qatalum.
FOURTH QUARTER REPORT 2017 34

Underlying RoaCEHydro uses underlying RoaCE to measure the performance for the group as a whole and within its operating segments, both inabsolute terms and comparatively from period to period. Management views this measure as providing additionalunderstanding of the rate of return on investments over time in each of its capital intensive businesses and in the operatingresults of its business segments.
NOK million 2017 2016 2017 2016
EBIT 12 189 7 011 11 215 6 425
Adjusted Income tax expense 1)
(2 225) (1 913) (2 651) (2 452)
EBIT after tax 9 964 5 098 8 564 3 973
NOK million 2017 2016 2015
Current assets 2)
41 459 23 722 23 491
Property, plant and equipment 73 020 58 734 51 174
Other non-current assets 35 710 35 688 35 210
Current liabilities 3)
(25 081) (13 823) (13 837)
Non-current liabilities 4)
(28 737) (22 651) (21 847)
Capital Employed 96 370 81 670 74 191
Return on average Capital Employed (RoaCE) 2017 2016 2017 2016
Hydro 11.2 % 6.5 % 9.6 % 5.1 %
Reported Underlying
December 31
Reported Underlying
1) Adjusted income tax expense is based on reported and underlying tax expense adjusted for tax on financial items.
2) Excluding cash and cash equivalents and short-term investments.
3) Excluding bank loans and other interest-bearing short-term debt.
4) Excluding long-term debt.
FOURTH QUARTER REPORT 201735

Additional information
Financial calendar
March 23 Annual reportApril 25 First quarter resultsMay 7 Annual General MeetingJuly 24 Second quarter resultsOctober 24 Third quarter results
Financial calendar 2018
Hydro reserves the right to revise these dates.
Certain statements included in this announcement contain forward-looking information, including, without limitation,information relating to (a) forecasts, projections and estimates, (b) statements of Hydro management concerning plans,objectives and strategies, such as planned expansions, investments, divestments, curtailments or other projects, (c) targetedproduction volumes and costs, capacities or rates, start-up costs, cost reductions and profit objectives, (d) various expectationsabout future developments in Hydro’s markets, particularly prices, supply and demand and competition, (e) results ofoperations, (f ) margins, (g) growth rates, (h) risk management, and (i) qualified statements such as “expected”, “scheduled”,“targeted”, “planned”, “proposed”, “intended” or similar.
Cautionary note
Although we believe that the expectations reflected in such forward-looking statements are reasonable, these forward-lookingstatements are based on a number of assumptions and forecasts that, by their nature, involve risk and uncertainty. Variousfactors could cause our actual results to differ materially from those projected in a forward-looking statement or affect theextent to which a particular projection is realized. Factors that could cause these differences include, but are not limited to: ourcontinued ability to reposition and restructure our upstream and downstream businesses; changes in availability and cost ofenergy and raw materials; global supply and demand for aluminium and aluminium products; world economic growth,including rates of inflation and industrial production; changes in the relative value of currencies and the value of commoditycontracts; trends in Hydro’s key markets and competition; and legislative, regulatory and political factors.
No assurance can be given that such expectations will prove to have been correct. Hydro disclaims any obligation to update orrevise any forward-looking statements, whether as a result of new information, future events or otherwise.
FOURTH QUARTER REPORT 2017 36

Norsk Hydro ASANO-0240 Oslo Norway
Tel.: +47 22 53 81 00www.hydro.com
Design and production: Hydro/Artbox Print: Printbox © Hydro 2018
Hydro is a fully integrated aluminium company with 35,000 employees in 40 countries on all continents, combining local expertise, worldwide reach and unmatched capabilities in R&D. In addition to production of primary aluminium, rolled and extruded products and recycling, Hydro also extracts bauxite, refines alumina and generates energy to be the only 360° company of the global aluminium industry. Hydro is present within all market segments for aluminium, with sales and trading activities throughout the value chain serving more than 30,000 customers. Based in Norway and rooted in more than a century of experience in renewable energy, technology and innovation, Hydro is committed to strengthening the viability of its customers and communities, shaping a sustainable future through innovative aluminium solutions.