north american oil s/d dynamics - platts.com · north american oil s/d dynamics: ... 10,500 11,500...
TRANSCRIPT

North American Oil S/D Dynamics: In a Flexible Environment, Growth at High Prices Second Annual North American Crude Marketing Conference, 28 February 2013, Houston
Jan Stuart Head of Energy-Commodities Research +1 212 325 1013 [email protected] ANALYST CERTIFICATIONS AND IMPORTANT DISCLOSURES ARE IN THE DISCLOSURE APPENDIX. FOR OTHER IMPORTANT DISCLOSURES, PLEASE REFER TO https://firesearchdisclosure.credit-suisse.com.
CREDIT SUISSE SECURITIES RESEARCH & ANALYTICS BEYOND INFORMATION®
Client-Driven Solutions, Insights, and Access

Commodities Group - 1
Just one example of what we think is happening in the US
Source: Industry data and Credit Suisse estimates, PSX
Commodities Group - 2
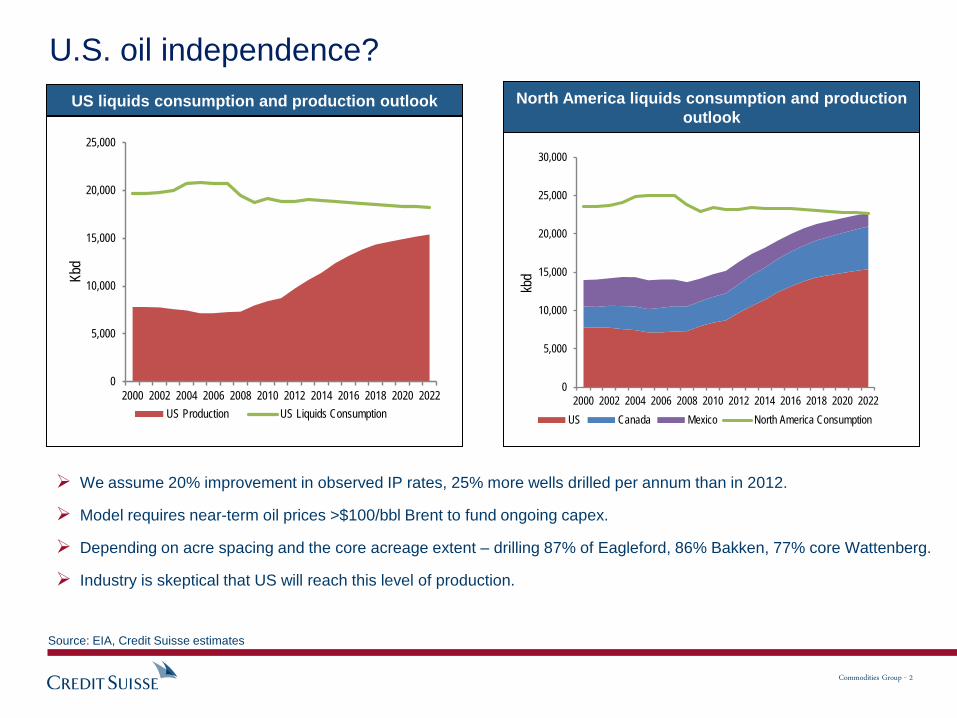
U.S. oil independence?
Source: EIA, Credit Suisse estimates
North America liquids consumption and production outlook
US liquids consumption and production outlook
We assume 20% improvement in observed IP rates, 25% more wells drilled per annum than in 2012.
Model requires near-term oil prices >$100/bbl Brent to fund ongoing capex.
Depending on acre spacing and the core acreage extent – drilling 87% of Eagleford, 86% Bakken, 77% core Wattenberg.
Industry is skeptical that US will reach this level of production.
0
5,000
10,000
15,000
20,000
25,000
2000 2002 2004 2006 2008 2010 2012 2014 2016 2018 2020 2022
Kbd
US Production US Liquids Consumption
0
5,000
10,000
15,000
20,000
25,000
30,000
2000 2002 2004 2006 2008 2010 2012 2014 2016 2018 2020 2022
kbd
US Canada Mexico North America Consumption

Commodities Group - 3
Our model’s sensitivities: Limited upside and price is key
4,500 5,500 6,500 7,500 8,500 9,500
10,500 11,500 12,500
KBO
EPD
Production Sensitivity to D&C Days
D&C Days -20% D&C Days -10% D&C Days -5%
D&C Days Current Historical
4,500
5,500
6,500
7,500
8,500
9,500
10,500
11,500
KBOE
PD
Production Sensitivity to IP Rates
IP Rate -20% IP Rate -10% IP Rate Current
IP Rate +10% IP Rate +20% Historical
4,500
5,500
6,500
7,500
8,500
9,500
10,500
11,500
KBO
EPD
Production Sensitivity to Decline Rates
Decline Rate -4% Decline Rate -2% Decline Rate Current
Decline Rate +2% Decline Rate +4% Historical
4,500 5,500 6,500 7,500 8,500 9,500
10,500 11,500 12,500
KBO
EPD
Production Sensitivity to Rig Count
Rig Count -20% Rig Count -10% Rig Count Current
Rig Count +10% Rig Count +20% Historical
Source: Credit Suisse estimates, Company Data

Commodities Group - 4
The upstream revolution is about gas more so than oil
Source: Credit Suisse, IEA, JODI, EIA, the BLOOMBERG PROFESSIONALTM service
0
20
40
60
80
100
120
140
World, Oil World, NaturalGas
World Oil andGas
North America,Natural Gas
BP Statistics Incl Shale
yrs
Shale has given a much bigger reserve
bump to gas than oil (years of supply)

Commodities Group - 5
Adding up the moving parts of our medium-term outlook
Waterfall of 2012 to 2019 productive capacity of the global oil-supply side
Source: Wood Mackenzie, Credit Suisse Research
0
10000
20000
30000
40000
50000
60000
70000
80000
90000
100000
2012 Less Decline Plus Growth onExisting Fields
Plus US shale Plus New Fields(incl Russia/Arg
Shale)
Other 2019
kboe
d
Equates to around 1.2Mb/d CAGR, i.e., the global s/d system remains “manageable”.
Commodities Group - 6
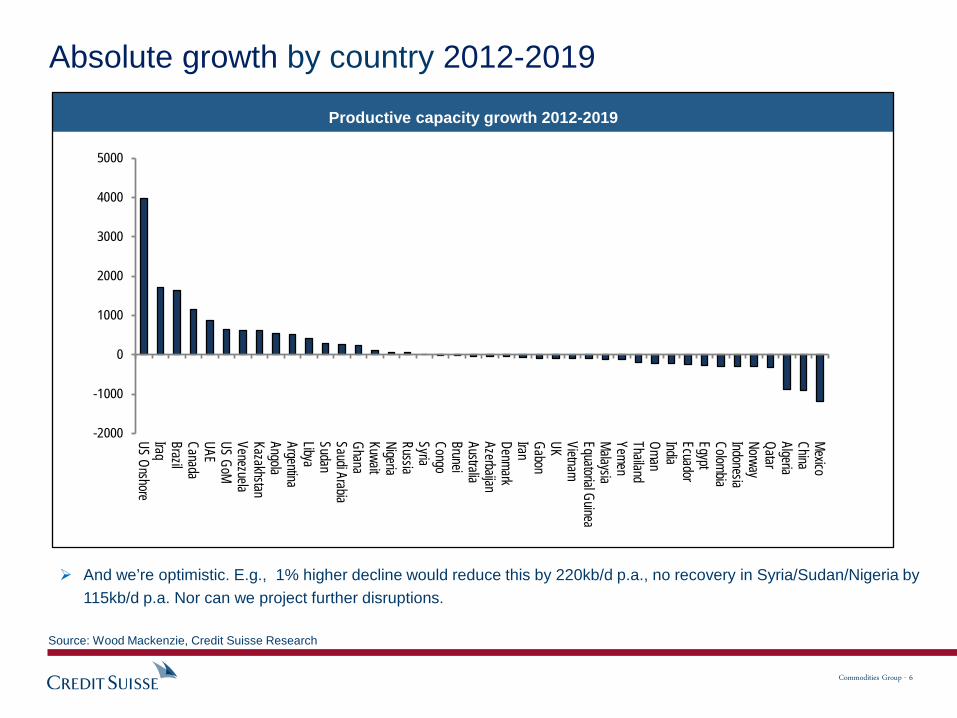
Absolute growth by country 2012-2019
Productive capacity growth 2012-2019
-2000
-1000
0
1000
2000
3000
4000
5000
US OnshoreIraqBrazilCanadaUAEUS GoMVenezuelaKazakhstanAngolaArgentinaLibyaSudanSaudi ArabiaGhanaKuwaitNigeriaRussiaSyriaCongoBruneiAustraliaAzerbaijanDenmarkIranGabonUK VietnamEquatorial GuineaMalaysiaYemenThailandOmanIndiaEcuadorEgyptColombiaIndonesiaNorwayQatarAlgeriaChinaMexico
And we’re optimistic. E.g., 1% higher decline would reduce this by 220kb/d p.a., no recovery in Syria/Sudan/Nigeria by 115kb/d p.a. Nor can we project further disruptions.
Source: Wood Mackenzie, Credit Suisse Research

Commodities Group - 7
Oil demand: Neat trends and a historic cross-over in 2013
Source: IEA, Credit Suisse Global Commodities Research
Global Oil Demand (Natural log, SA)
Oil demand in developed economies and across EM economies (Natural log, SA)
11.15
11.20
11.25
11.30
11.35
11.40
11.45
1995 1998 2001 2004 2007 2010
Global oil demand HP-filter trend
CAGR = 0.97%CAGR = 1.58%
10.1
10.2
10.3
10.4
10.5
10.6
10.7
10.8
10.9
1995 1997 1999 2001 2003 2005 2007 2009 2011
Non-OECD OECD
Non-OECD CAGR = 4.5% (2003 - end 2010)
OECD CAGR = 1.0%(1995 - 2005)
Non-OECD CAGR = 1.9% (1995 - 2002)
OECD CAGR = -1.4%(2005 - end 2010)
OECD CAGR = -0.7%(2011 - )
Non-OECD CAGR = 2.7%(2011 - )

Commodities Group - 8
Oil demand across EM has been growing at 4% pa
Source: IEA, Credit Suisse Global Commodities Research
Global primary energy demand by source
(average annual % growth)
EM oil demand (ex FSU), has no “super-cycle” (sa t-13 log scale, monthly data through Oct 2012)
0%
1%
2%
3%
4%
5%
6%
7%
1987-91 1992-96 1997-01 2002-06 2007-11
energy oil gas coal
9.8
9.9
10.0
10.1
10.2
10.3
10.4
10.5
10.6
10.7
1995 1997 1999 2001 2003 2005 2007 2009 2011
Non-OECD ex FSU
Non-OECD ex-FSU CAGR:(1995 - 2010) = 4.2 %(2011 - end 2012) = 3.0%

Commodities Group - 9
Global energy intensity Energy intensity of the global economy
(toe/$ ‘000,000 of GDP, 2011 current $)
Energy intensity of select economies, 2011 (toe/$ ‘000,000 of GDP, 2011 current $)
y = 1822.9e-0.053x
0
500
1000
1500
2000
2500
1965 1970 1975 1980 1985 1990 1995 2000 2005 2010
Energy intensity of the global economy: toe used per $ '000,000 of GDP (2011 current $)
050
100150200250300350400
Russ
ian
Fede
ratio
nCh
ina
Thai
land
Indi
aN
on-O
ECD
Vene
zuel
aAr
ab W
orld
Asia
Pac
ific
Sout
h Ko
rea
Cana
daW
orld
Indo
nesia
Nor
th A
mer
ica US
Mex
ico
Euro
pe &
Eur
asia
OEC
DS.
& C
ent.
Amer
ica
Braz
ilAu
stra
liaFr
ance
Ger
man
yJa
pan
Uni
ted
King
dom
Italy
Energy intensity: toe used per $ '000,000 of GDP (2011 current $)
Still, substantial differences remain between economies.
While it will be difficult to decrease energy intensity in the advanced industrial (i.e., services driven) economies.
There is a large scope for improving energy intensity in advanced developing economies (e.g., China).
Any reductions in a given country’s energy intensity is likely the result of the more energy intense industries moving to new markets.
As such, in aggregate there are likely to be only incremental reductions on a global level.
The energy intensity of the global economy has dramatically improved over the last 45 years.
Still, over the short and medium term, significant diminishing returns limit prospects for future improvements.
Source: Credit Suisse Global Commodities Research, BP, World Bank

Commodities Group - 10
Global oil intensity Oil intensity of the global economy
(toe/$ ‘000,000 of GDP, 2011 current $)
Oil intensity of select economies, 2011 (toe/$ ‘000,000 of GDP, 2011 current $) No surprise, large oil exporters tend to be the most
profligate.
Stripping away coal and it becomes clear that China’s economy is already significantly less oil intense than one might guess.
The continued dominance of oil as a transpiration fuel is clearly visible.
Since oil has been largely phased out of power generation, further declines of oil intensity have been only modest.
y = 862.72e-0.06x
0
100
200
300
400
500
600
700
800
900
1965 1970 1975 1980 1985 1990 1995 2000 2005 2010
Oil intensity of the global economy: toe used per $ '000,000 of GDP (2011 current $)
020406080
100120140160
Thai
land
Arab
Wor
ldVe
nezu
ela
Sout
h Ko
rea
Indi
aN
on-O
ECD
Mex
ico
Indo
nesia
Russ
ian
Fede
ratio
nAs
ia P
acifi
cCh
ina
Nor
th A
mer
ica
Cana
daW
orld US
S. &
Cen
t. Am
eric
aBr
azil
OEC
DEu
rope
& E
uras
iaJa
pan
Aust
ralia
Italy
Ger
man
yFr
ance
Uni
ted
King
dom
Oil intensity: toe used per $ '000,000 of GDP (2011 current $)
Source: Credit Suisse Global Commodities Research, BP, World Bank

Commodities Group - 11
Sovereign producers have concerns
Government spending: Break-even oil prices of select sovereigns
($/b of respective exports, i.e., corresponding Brent prices would be a few dollars higher)
Source: Credit Suisse Research
0
20
40
60
80
100
120
140
Venezuela(2012)
Iran (2010) UAE (2012) Russia(2012)
Algeria(2012)
SaudiArabia(2010)
SaudiArabia(2011)
SaudiArabia(2012)
SaudiArabia(2015)

Commodities Group - 12
Oil well economics differ enormously: e.g., the Eagleford
Well IP variability across the Eagleford
WTI oil price break-evens based on reported IP by County (Eagleford)
In fact, drilling for liquids elsewhere in the Eagleford is not very profitable, even at today’s high prices
Though improved infrastructure will lower discounts to benchmarks, while pw costs deflate and efficiencies improve…
… wells in counties away from the sweetspots will need enormous progress to become viable …
… or much higher prices
The bigger liquids wells in the Eagleford are concentrated in a narrow crescent shaped window
Source: Credit Suisse Research

Commodities Group - 13
Tight oil’s poster child: Bakken variability is no exception Well IP variability across the Bakken
WTI oil price break-evens based on reported IP by County (Bakken)
But the poorer 40% or lower two-quintiles need $100/b or WTI oil prices, or higher, to yield investable returns
… which is why the industry push-back on our modeling effort (which foresees rather more pedestrian volume growth than do some of our esteemed competitors) …
… is that we assume too many sweet-spots across the different basins, which are also too large
Outstanding in a positive way are Williams, Mountrail, McKenzie, Dunn and maybe Stark counties
$122
$73$134
$71
$61
$77
$125
$136
$80
Source: Credit Suisse Research
Commodities Group - 14
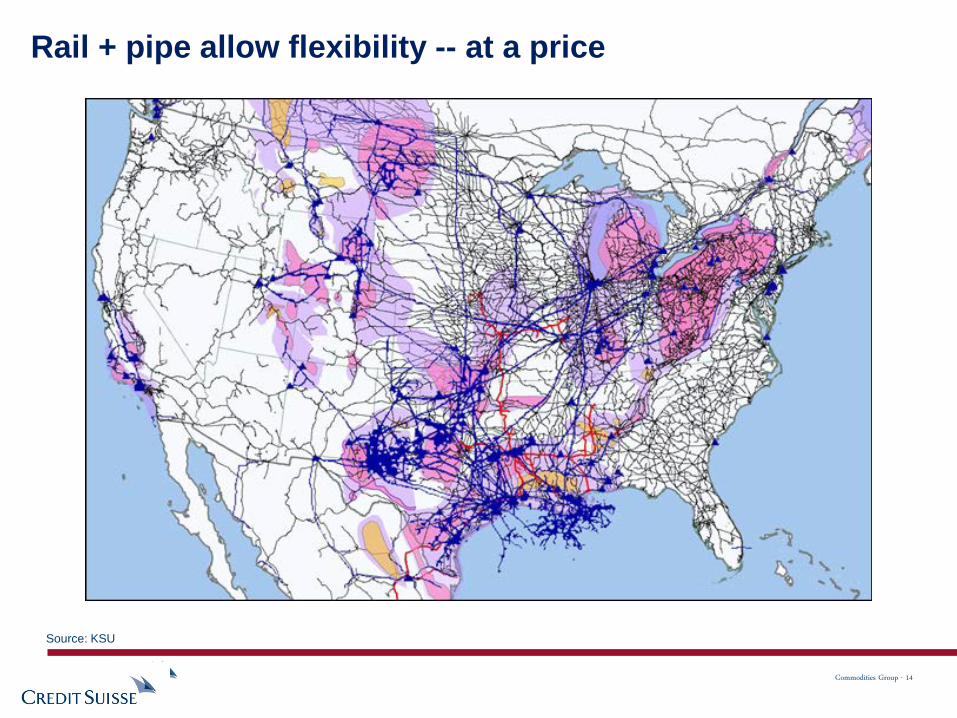
Rail + pipe allow flexibility -- at a price
Source: KSU

Commodities Group - 15
Central corridor supply-demand
$2/bbl shipping cost to East Coast Canada (750kbd).
$4.5/bbl to East Coast US (1100kbd).
$8/bbl to displace heavy crude imports.
Advantage migrating to the coast
Source: Industry Data, EIA and Credit Suisse estimates
< 20 20.1 - 25 25.1 - 30.0 30.1 - 35.0 35.1 - 40.0 40.1 - 45.0 > 45.0 Total Light/MedPadd 32011 1,006 1,237 336 1,453 518 266 92 4,908 2,3292012 td 964 1,110 359 1,351 465 181 39 4,469 2,036yoy (42) (127) 23 (102) (53) (85) (53) (439) (293)
Overall US2011 1,299 2,583 693 2,682 1,095 375 139 8,867 4,2912012 td 1,310 2,515 781 2,485 1,054 334 78 8,556 3,950yoy 11 (68) 87 (197) (42) (40) (61) (310) (340)
API Gravity

Disclosure Appendix Analyst Certification
The analysts identified in this report each certify, with respect to the companies or securities that the individual analyzes, that (1) the views expressed in this report accurately reflect his or her personal views about all of the subject companies and securities and (2) no part of his or her compensation was, is or will be directly or indirectly related to the specific
recommendations or views expressed in this report.
Important Disclosures
Credit Suisse's policy is only to publish investment research that is impartial, independent, clear, fair and not misleading. For more detail, please refer to Credit Suisse's Policies for Managing Conflicts of Interest in connection with Investment Research: http://www.csfb.com/research-and-analytics/disclaimer/managing_conflicts_disclaimer.html
Credit Suisse’s policy is to publish research reports as it deems appropriate, based on developments with the subject issuer, the sector or the market that may have a material impact on the research views or opinions stated herein.
The analyst(s) involved in the preparation of this research report received compensation that is based upon various factors, including Credit Suisse's total revenues, a portion of which are generated by Credit Suisse's Investment Banking and Fixed Income Divisions.
Credit Suisse may trade as principal in the securities or derivatives of the issuers that are the subject of this report.
At any point in time, Credit Suisse is likely to have significant holdings in the securities mentioned in this report.
As at the date of this report, Credit Suisse acts as a market maker or liquidity provider in the debt securities of the subject issuer(s) mentioned in this report.
For important disclosure information on securities recommended in this report, please visit the website at https://firesearchdisclosure.credit-suisse.com or call +1-212-538-7625.
For the history of any relative value trade ideas suggested by the Fixed Income research department as well as fundamental recommendations provided by the Emerging Markets Sovereign Strategy Group over the previous 12 months, please view the document at http://research-and-analytics.csfb.com/docpopup.asp?ctbdocid=330703_1_en. Credit Suisse clients with access
to the Locus website may refer to http://www.credit-suisse.com/locus.
For the history of recommendations provided by Technical Analysis, please visit the website at http://www.credit-suisse.com/techanalysis.
Credit Suisse does not provide any tax advice. Any statement herein regarding any US federal tax is not intended or written to be used, and cannot be used, by any taxpayer for the purposes of avoiding any penalties.
Emerging Markets Bond Recommendation Definitions
Buy: Indicates a recommended buy on our expectation that the issue will deliver a return higher than the risk-free rate.
Sell: Indicates a recommended sell on our expectation that the issue will deliver a return lower than the risk-free rate.
Corporate Bond Fundamental Recommendation Definitions
Buy: Indicates a recommended buy on our expectation that the issue will be a top performer in its sector.
Outperform: Indicates an above-average total return performer within its sector. Bonds in this category have stable or improving credit profiles and are undervalued, or they may be weaker credits that, we believe, are cheap relative to the sector and are expected to outperform on a total-return basis. These bonds may possess price risk in a volatile environment.
Market Perform: Indicates a bond that is expected to return average performance in its sector.
Underperform: Indicates a below-average total-return performer within its sector. Bonds in this category have weak or worsening credit trends, or they may be stable credits that, we believe, are overvalued or rich relative to the sector.
Sell: Indicates a recommended sell on the expectation that the issue will be among the poor performers in its sector.
Restricted: In certain circumstances, Credit Suisse policy and/or applicable law and regulations preclude certain types of communications, including an investment recommendation, during the course of Credit Suisse's engagement in an investment banking transaction and in certain other circumstances.
Not Rated: Credit Suisse Global Credit Research or Global Leveraged Finance Research covers the issuer but currently does not offer an investment view on the subject issue.
Not Covered: Neither Credit Suisse Global Credit Research nor Global Leveraged Finance Research covers the issuer or offers an investment view on the issuer or any securities related to it. Any communication from Research on securities or companies that Credit Suisse does not cover is factual or a reasonable, non-material deduction based on an analysis of publicly
available information.
Corporate Bond Risk Category Definitions
In addition to the recommendation, each issue may have a risk category indicating that it is an appropriate holding for an "average" high yield investor, designated as Market, or that it has a higher or lower risk profile, designated as Speculative and Conservative, respectively.
Credit Suisse Credit Rating Definitions
Credit Suisse may assign rating opinions to investment-grade and crossover issuers. Ratings are based on our assessment of a company's creditworthiness and are not recommendations to buy or sell a security. The ratings scale (AAA, AA, A, BBB, BB, B) is dependent on our assessment of an issuer's ability to meet its financial commitments in a timely manner. Within
each category, creditworthiness is further detailed with a scale of High, Mid, or Low – with High being the strongest sub-category rating: High AAA, Mid AAA, Low AAA – obligor's capacity to meet its financial commitments is extremely strong; High AA, Mid AA, Low AA – obligor's capacity to meet its financial commitments is very strong; High A, Mid A, Low A
– obligor's capacity to meet its financial commitments is strong; High BBB, Mid BBB, Low BBB – obligor's capacity to meet its financial commitments is adequate, but adverse economic/operating/financial circumstances are more likely to lead to a weakened capacity to meet its obligations; High BB, Mid BB, Low BB – obligations have speculative characteristics and
are subject to substantial credit risk; High B, Mid B, Low B – obligor's capacity to meet financial commitments is very weak and highly vulnerable to adverse economic, operating, and financial circumstances; High CCC, Mid CCC, Low CCC – obligor's capacity to meet its financial commitments is extremely weak and is dependent on favorable economic, operating,
and financial circumstances. Credit Suisse's rating opinions do not necessarily correlate with those of the rating agencies.
Credit Suisse’s Distribution of Global Credit Research Recommendations* (and Banking Clients)
Global Recommendation Distribution**
Buy 5% (of which 100% are banking clients)
Outperform 24% (of which 85% are banking clients)
Market Perform 53% (of which 85% are banking clients)
Underperform 16% (of which 80% are banking clients)
Sell <1% (of which 100% are banking clients)
*Data are as at the end of the previous calendar quarter.
**Percentages do not include securities on the firm’s Restricted List and might not total 100% as a result of rounding.

Disclosure Appendix cont’d Structured Securities, Derivatives, and Options Disclaimer Structured securities, derivatives, and options (including OTC derivatives and options) are complex instruments that are not suitable for every investor, may involve a high degree of risk, and may be appropriate investments only for sophisticated investors who are capable of understanding and assuming the risks involved. Supporting documentation for any claims, comparisons, recommendations, statistics or other technical data will be supplied upon request. Any trade information is preliminary and not intended as an official transaction confirmation. OTC derivative transactions are not highly liquid investments; before entering into any such transaction you should ensure that you fully understand its potential risks and rewards and independently determine that it is appropriate for you given your objectives, experience, financial and operational resources, and other relevant circumstances. You should consult with such tax, accounting, legal or other advisors as you deem necessary to assist you in making these determinations. In discussions of OTC options and other strategies, the results and risks are based solely on the hypothetical examples cited; actual results and risks will vary depending on specific circumstances. Investors are urged to consider carefully whether OTC options or option-related products, as well as the products or strategies discussed herein, are suitable to their needs. CS does not offer tax or accounting advice or act as a financial advisor or fiduciary (unless it has agreed specifically in writing to do so). Because of the importance of tax considerations to many option transactions, the investor considering options should consult with his/her tax advisor as to how taxes affect the outcome of contemplated options transactions. Use the following link to read the Options Clearing Corporation's disclosure document: http://www.theocc.com/publications/risks/riskstoc.pdf Transaction costs may be significant in option strategies calling for multiple purchases and sales of options, such as spreads and straddles. Commissions and transaction costs may be a factor in actual returns realized by the investor and should be taken into consideration. HOLT® With respect to the analysis in this report based on the Credit Suisse HOLT methodology, Credit Suisse certifies that (1) the views expressed in this report accurately reflect the Credit Suisse HOLT methodology and (2) no part of the Firm’s compensation was, is, or will be directly related to the specific views disclosed in this report. The Credit Suisse HOLT methodology does not assign recommendations to a security. It is an analytical tool that involves use of a set of proprietary quantitative algorithms and warranted value calculations, collectively called the Credit Suisse HOLT valuation model, that are consistently applied to all the companies included in its database. Third-party data (including consensus earnings estimates) are systematically translated into a number of default variables and incorporated into the algorithms available in the Credit Suisse HOLT valuation model. The source financial statement, pricing, and earnings data provided by outside data vendors are subject to quality control and may also be adjusted to more closely measure the underlying economics of firm performance. These adjustments provide consistency when analyzing a single company across time, or analyzing multiple companies across industries or national borders. The default scenario that is produced by the Credit Suisse HOLT valuation model establishes the baseline valuation for a security, and a user then may adjust the default variables to produce alternative scenarios, any of which could occur. Additional information about the Credit Suisse HOLT methodology is available on request. The Credit Suisse HOLT methodology does not assign a price target to a security. The default scenario that is produced by the Credit Suisse HOLT valuation model establishes a warranted price for a security, and as the third-party data are updated, the warranted price may also change. The default variables may also be adjusted to produce alternative warranted prices, any of which could occur. Additional information about the Credit Suisse HOLT methodology is available on request.

Disclosure Appendix cont’d References in this report to Credit Suisse include all of the subsidiaries and affiliates of Credit Suisse AG operating under its investment banking division. For more information on our structure, please use the following link: https://www.credit-suisse.com/who_we_are/en/. This report is not directed to, or intended for distribution to or use by, any person or entity who is a citizen or resident of or located in any locality, state, country or other jurisdiction where such distribution, publication, availability or use would be contrary to law or regulation or which would subject Credit Suisse AG or its affiliates (“CS”) to any registration or licensing requirement within such jurisdiction. All material presented in this report, unless specifically indicated otherwise, is under copyright to CS. None of the material, nor its content, nor any copy of it, may be altered in any way, transmitted to, copied or distributed to any other party, without the prior express written permission of CS. All trademarks, service marks and logos used in this report are trademarks or service marks or registered trademarks or service marks of CS or its affiliates. The information, tools and material presented in this report are provided to you for information purposes only and are not to be used or considered as an offer or the solicitation of an offer to sell or to buy or subscribe for securities or other financial instruments. CS may not have taken any steps to ensure that the securities referred to in this report are suitable for any particular investor. CS will not treat recipients of this report as its customers by virtue of their receiving this report. The investments and services contained or referred to in this report may not be suitable for you and it is recommended that you consult an independent investment advisor if you are in doubt about such investments or investment services. Nothing in this report constitutes investment, legal, accounting or tax advice, or a representation that any investment or strategy is suitable or appropriate to your individual circumstances, or otherwise constitutes a personal recommendation to you. CS does not advise on the tax consequences of investments and you are advised to contact an independent tax adviser. Please note in particular that the bases and levels of taxation may change. Information and opinions presented in this report have been obtained or derived from sources believed by CS to be reliable, but CS makes no representation as to their accuracy or completeness. CS accepts no liability for loss arising from the use of the material presented in this report, except that this exclusion of liability does not apply to the extent that such liability arises under specific statutes or regulations applicable to CS. This report is not to be relied upon in substitution for the exercise of independent judgment. CS may have issued, and may in the future issue, other reports that are inconsistent with, and reach different conclusions from, the information presented in this report. Those reports reflect the different assumptions, views and analytical methods of the analysts who prepared them and CS is under no obligation to ensure that such other reports are brought to the attention of any recipient of this report. CS may, to the extent permitted by law, participate or invest in financing transactions with the issuer(s) of the securities referred to in this report, perform services for or solicit business from such issuers, and/or have a position or holding, or other material interest, or effect transactions, in such securities or options thereon, or other investments related thereto. In addition, it may make markets in the securities mentioned in the material presented in this report. CS may have, within the last three years, served as manager or co-manager of a public offering of securities for, or currently may make a primary market in issues of, any or all of the entities mentioned in this report or may be providing, or have provided within the previous 12 months, significant advice or investment services in relation to the investment concerned or a related investment. Additional information is, subject to duties of confidentiality, available on request. Some investments referred to in this report will be offered solely by a single entity and in the case of some investments solely by CS, or an associate of CS or CS may be the only market maker in such investments. Past performance should not be taken as an indication or guarantee of future performance, and no representation or warranty, express or implied, is made regarding future performance. Information, opinions and estimates contained in this report reflect a judgement at its original date of publication by CS and are subject to change without notice. The price, value of and income from any of the securities or financial instruments mentioned in this report can fall as well as rise. The value of securities and financial instruments is subject to exchange rate fluctuation that may have a positive or adverse effect on the price or income of such securities or financial instruments. Investors in securities such as ADR’s, the values of which are influenced by currency volatility, effectively assume this risk. Structured securities are complex instruments, typically involve a high degree of risk and are intended for sale only to sophisticated investors who are capable of understanding and assuming the risks involved. The market value of any structured security may be affected by changes in economic, financial and political factors (including, but not limited to, spot and forward interest and exchange rates), time to maturity, market conditions and volatility, and the credit quality of any issuer or reference issuer. Any investor interested in purchasing a structured product should conduct their own investigation and analysis of the product and consult with their own professional advisers as to the risks involved in making such a purchase. Some investments discussed in this report may have a high level of volatility. High volatility investments may experience sudden and large falls in their value causing losses when that investment is realised. Those losses may equal your original investment. Indeed, in the case of some investments the potential losses may exceed the amount of initial investment and, in such circumstances, you may be required to pay more money to support those losses. Income yields from investments may fluctuate and, in consequence, initial capital paid to make the investment may be used as part of that income yield. Some investments may not be readily realisable and it may be difficult to sell or realise those investments, similarly it may prove difficult for you to obtain reliable information about the value, or risks, to which such an investment is exposed. This report may provide the addresses of, or contain hyperlinks to, websites. Except to the extent to which the report refers to website material of CS, CS has not reviewed any such site and takes no responsibility for the content contained therein. Such address or hyperlink (including addresses or hyperlinks to CS’s own website material) is provided solely for your convenience and information and the content of any such website does not in any way form part of this document. Accessing such website or following such link through this report or CS’s website shall be at your own risk. This report is issued and distributed in Europe (except Switzerland) by Credit Suisse Securities (Europe) Limited, One Cabot Square, London E14 4QJ, England, which is regulated in the United Kingdom by The Financial Services Authority (“FSA”). This report is being distributed in Germany by Credit Suisse Securities (Europe) Limited Niederlassung Frankfurt am Main regulated by the Bundesanstalt fuer Finanzdienstleistungsaufsicht ("BaFin"). This report is being distributed in the United States and Canada by Credit Suisse Securities (USA) LLC; in Switzerland by Credit Suisse AG; in Brazil by Banco de Investimentos Credit Suisse (Brasil) S.A; in Mexico by Banco Credit Suisse (México), S.A. (transactions related to the securities mentioned in this report will only be effected in compliance with applicable regulation); in Japan by Credit Suisse Securities (Japan) Limited, Financial Instruments Firm, Director-General of Kanto Local Finance Bureau (Kinsho) No. 66, a member of Japan Securities Dealers Association, The Financial Futures Association of Japan, Japan Securities Investment Advisers Association, Type II Financial Instruments Firms Association; elsewhere in Asia/ Pacific by whichever of the following is the appropriately authorised entity in the relevant jurisdiction: Credit Suisse (Hong Kong) Limited, Credit Suisse Equities (Australia) Limited, Credit Suisse Securities (Thailand) Limited, Credit Suisse Securities (Malaysia) Sdn Bhd, Credit Suisse AG, Singapore Branch, and elsewhere in the world by the relevant authorised affiliate of the above. Research on Taiwanese securities produced by Credit Suisse AG, Taipei Branch has been prepared by a registered Senior Business Person. Research provided to residents of Malaysia is authorised by the Head of Research for Credit Suisse Securities (Malaysia) Sdn Bhd, to whom they should direct any queries on +603 2723 2020. This research may not conform to Canadian disclosure requirements. In jurisdictions where CS is not already registered or licensed to trade in securities, transactions will only be effected in accordance with applicable securities legislation, which will vary from jurisdiction to jurisdiction and may require that the trade be made in accordance with applicable exemptions from registration or licensing requirements. Non-U.S. customers wishing to effect a transaction should contact a CS entity in their local jurisdiction unless governing law permits otherwise. U.S. customers wishing to effect a transaction should do so only by contacting a representative at Credit Suisse Securities (USA) LLC in the U.S. Please note that this research was originally prepared and issued by CS for distribution to their market professional and institutional investor customers. Recipients who are not market professional or institutional investor customers of CS should seek the advice of their independent financial advisor prior to taking any investment decision based on this report or for any necessary explanation of its contents. This research may relate to investments or services of a person outside of the UK or to other matters which are not regulated by the FSA or in respect of which the protections of the FSA for private customers and/or the UK compensation scheme may not be available, and further details as to where this may be the case are available upon request in respect of this report. CS may provide various services to US municipal entities or obligated persons ("municipalities"), including suggesting individual transactions or trades and entering into such transactions. Any services CS provides to municipalities are not viewed as “advice” within the meaning of Section 975 of the Dodd-Frank Wall Street Reform and Consumer Protection Act. CS is providing any such services and related information solely on an arm’s length basis and not as an advisor or fiduciary to the municipality. In connection with the provision of the any such services, there is no agreement, direct or indirect, between any municipality (including the officials, management, employees or agents thereof) and CS for CS to provide advice to the municipality. Municipalities should consult with their financial, accounting and legal advisors regarding any such services provided by CS. In addition, CS is not acting for direct or indirect compensation to solicit the municipality on behalf of an unaffiliated broker, dealer, municipal securities dealer, municipal advisor, or investment adviser for the purpose of obtaining or retaining an engagement by the municipality for or in connection with Municipal Financial Products, the issuance of municipal securities, or of an investment adviser to provide investment advisory services to or on behalf of the municipality. Copyright © 2013 CREDIT SUISSE GROUP AG and/or its affiliates. All rights reserved.
Investment principal on bonds can be eroded depending on sale price or market price. In addition, there are bonds on which investment principal can be eroded due to changes in redemption amounts. Care is required when investing in such instruments. When you purchase non-listed Japanese fixed income securities (Japanese government bonds, Japanese municipal bonds, Japanese government guaranteed bonds, Japanese corporate bonds) from CS as a seller, you will be requested to pay purchase price only.