north carolina supplemental retirement plans · equities portfolio management 50 research analysis...
TRANSCRIPT
A
A 2000704170/390738_0/388605/388605
North Carolina Supplemental Retirement Plans
Wellington Management Company LLP
19 February 2015
Copyright © 2015 All Rights Reserved2000704171/390738_0/388605/388605A
A
AgendaTitle Line 2
Section one ����������������������������� Wellington Management Company llp update and relationship review
Section two ����������������������������� Opportunistic Growth portfolio review
Section three �������������������������� Appendix A: Quality Value
Section four ���������������������������� Appendix B: Global Opportunities
A North Carolina SupplementalRetirement Plans A19 February 2015 A1 2

1
Copyright © 2015 All Rights Reserved2000635967/388605_0/G1039/G1039
A North Carolina SupplementalRetirement Plans A19 February 2015
Wellington Management todayTitle Line 2
As of 31 December 2014
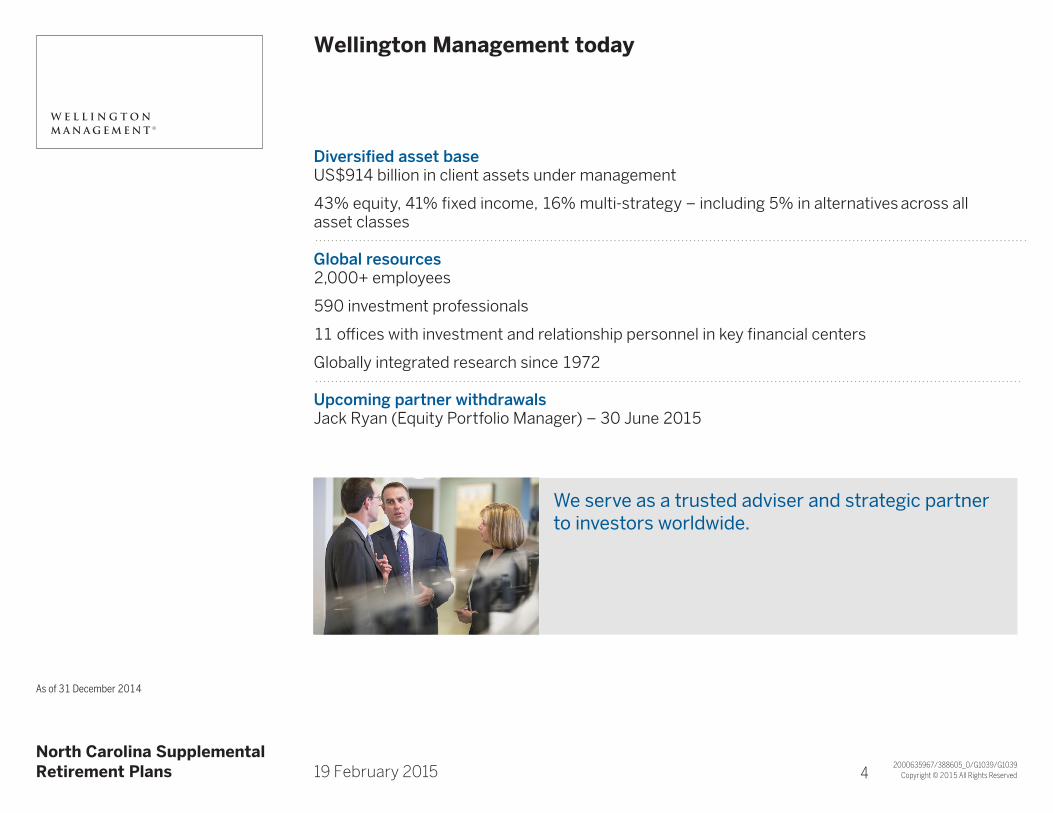
Diversified asset baseUS$914 billion in client assets under management
43% equity, 41% fixed income, 16% multi-strategy – including 5% in alternatives across all asset classes
Global resources2,000+ employees
590 investment professionals
11 offices with investment and relationship personnel in key financial centers
Globally integrated research since 1972
Upcoming partner withdrawalsJack Ryan (Equity Portfolio Manager) – 30 June 2015
We serve as a trusted adviser and strategic partner to investors worldwide.
A1 4
Copyright © 2015 All Rights Reserved2000003966/370019_11/G1039/G1039
A North Carolina SupplementalRetirement Plans A19 February 2015
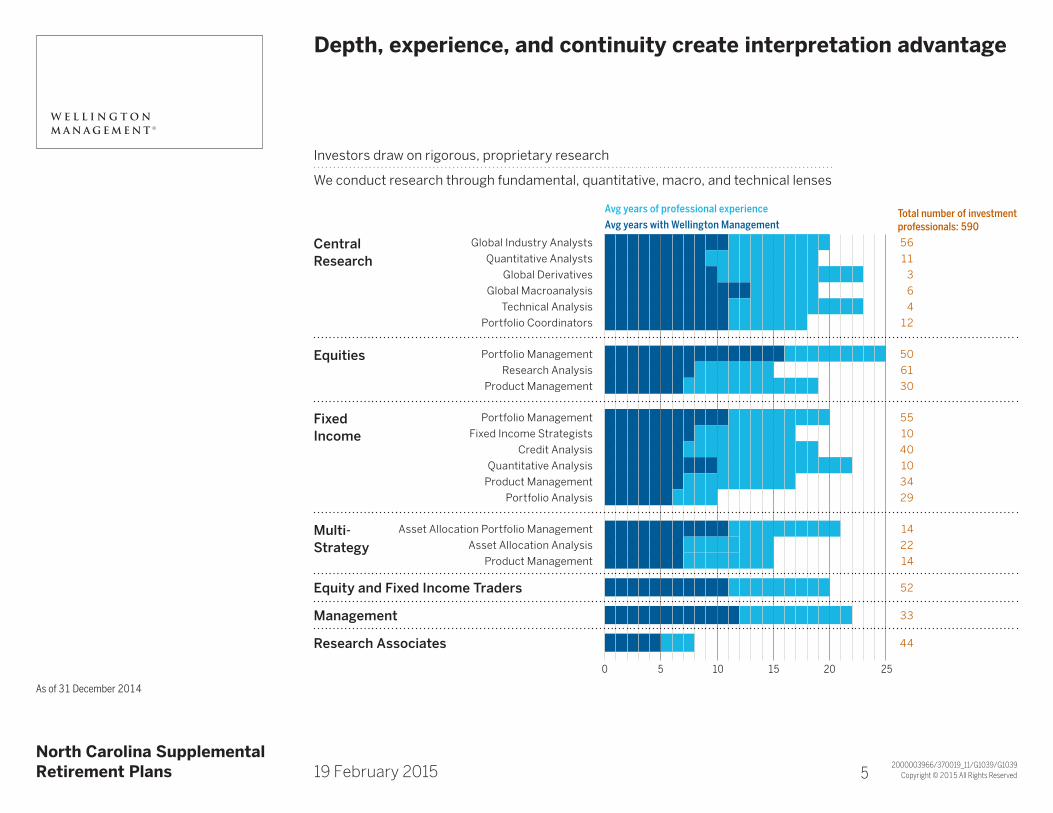
Depth, experience, and continuity create interpretation advantageTitle Line 2
As of 31 December 2014
Avg years of professional experience Total number of investment professionals: 590Avg years with Wellington Management
Central Research
Global Industry Analysts 56Quantitative Analysts 11
Global Derivatives 3Global Macroanalysis 6
Technical Analysis 4Portfolio Coordinators 12
Equities Portfolio Management 50Research Analysis 61
Product Management 30
Fixed Income
Portfolio Management 55Fixed Income Strategists 10
Credit Analysis 40Quantitative Analysis 10
Product Management 34Portfolio Analysis 29
Multi-Strategy
Asset Allocation Portfolio Management 14Asset Allocation Analysis 22
Product Management 14
Equity and Fixed Income Traders 52
Management 33
Research Associates 44
0 5 10 15 20 25
Investors draw on rigorous, proprietary research
We conduct research through fundamental, quantitative, macro, and technical lenses
A1 5
Copyright © 2014 All Rights Reserved2000003970/370019_11/G1039/G1039
A North Carolina SupplementalRetirement Plans A19 February 2015
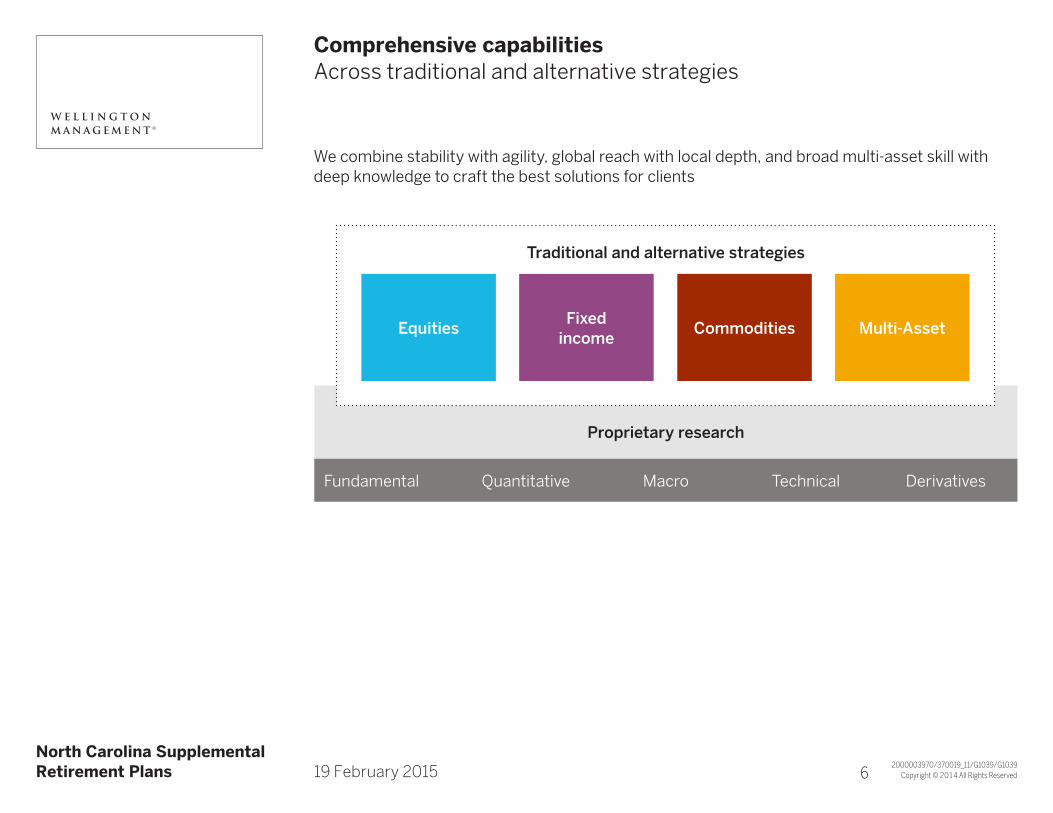
Comprehensive capabilitiesTitle Line 2Across traditional and alternative strategies
We combine stability with agility, global reach with local depth, and broad multi-asset skill with deep knowledge to craft the best solutions for clients
Proprietary research
Traditional and alternative strategies
Equities Fixed income Commodities Multi-Asset
Fundamental Quantitative Macro Technical Derivatives
A1 6
Copyright © 2014 All Rights Reserved2000003974/370019_8/G1039/G1039
A North Carolina SupplementalRetirement Plans A19 February 2015
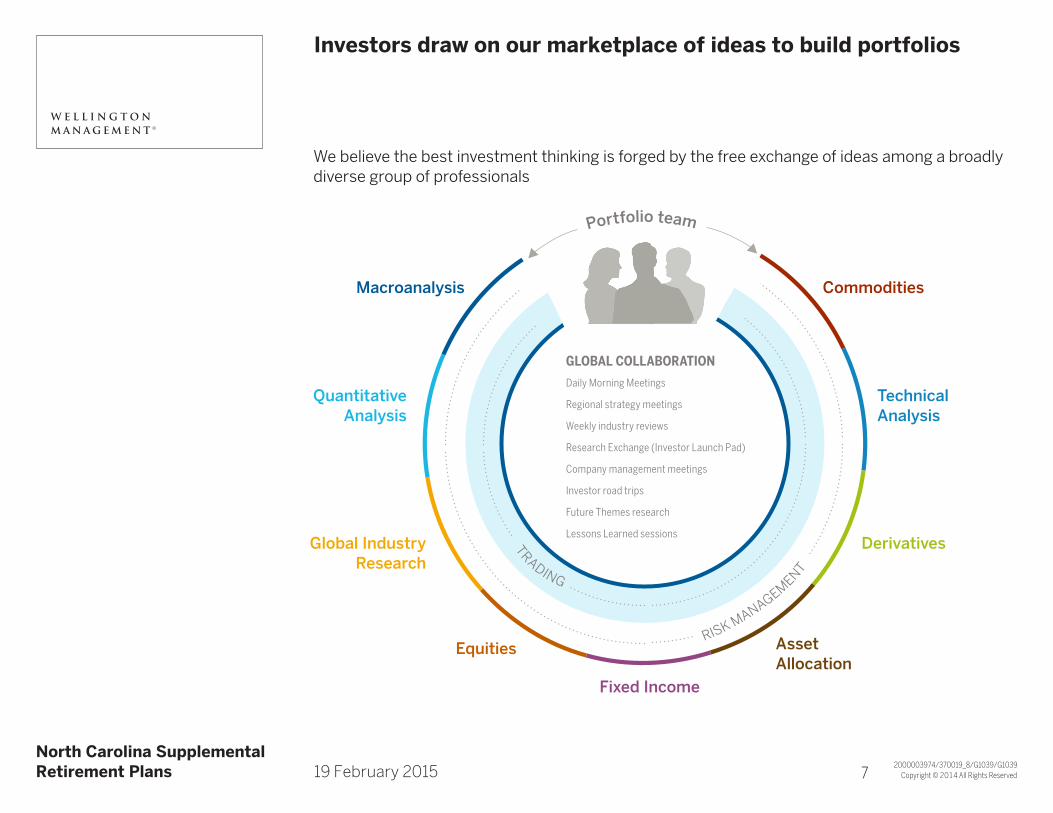
Investors draw on our marketplace of ideas to build portfoliosTitle Line 2
Macroanalysis Commodities
Technical Analysis
Equities
Fixed Income
QuantitativeAnalysis
DerivativesGlobal Industry Research
Asset Allocation
We believe the best investment thinking is forged by the free exchange of ideas among a broadly diverse group of professionals
Portfolio team
GLOBAL COLLABORATIONDaily Morning Meetings
Company management meetings
Regional strategy meetings
Investor road trips
Weekly industry reviews
Future Themes research
Research Exchange (Investor Launch Pad)
Lessons Learned sessions TRADING
R
ISK MANAGEMENTA1 7
Copyright © 2015 All Rights Reserved2000704174/390738_0/388605/361319A
A
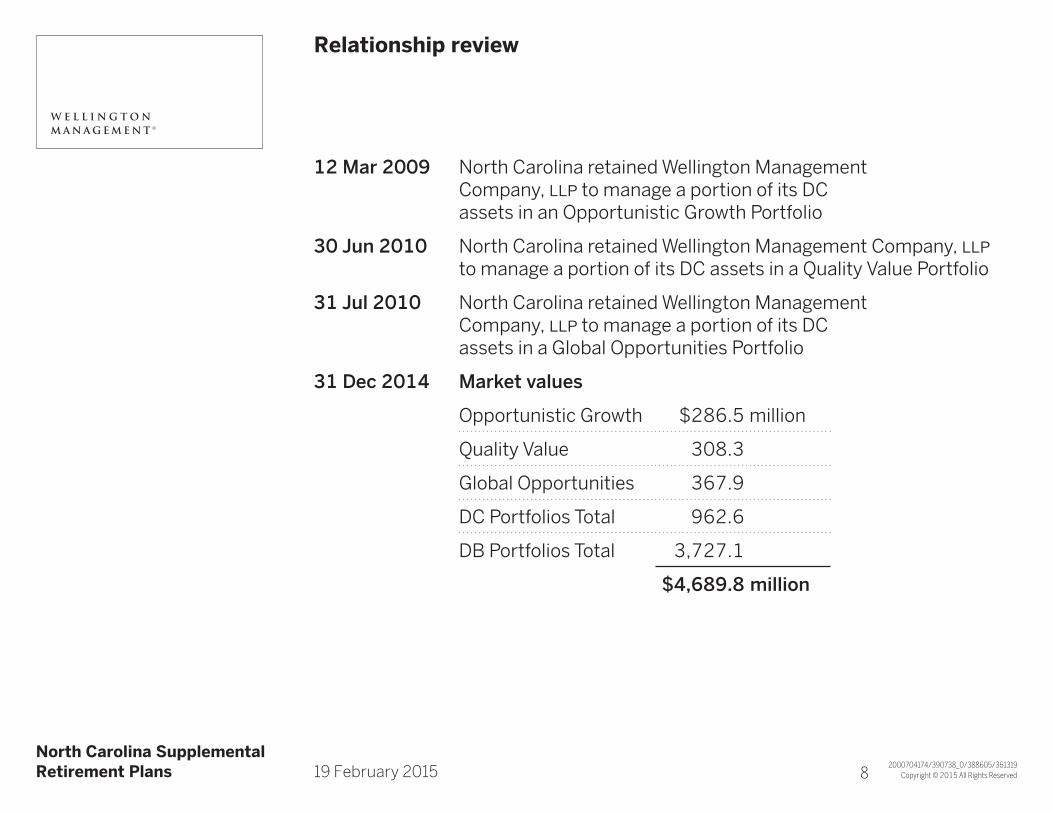
Relationship reviewTitle Line 2
12 Mar 2009 North Carolina retained Wellington Management Company, llp to manage a portion of its DC assets in an Opportunistic Growth Portfolio
30 Jun 2010 North Carolina retained Wellington Management Company, llp to manage a portion of its DC assets in a Quality Value Portfolio
31 Jul 2010 North Carolina retained Wellington Management Company, llp to manage a portion of its DC assets in a Global Opportunities Portfolio
31 Dec 2014 Market values
Opportunistic Growth $286.5 million
Quality Value 308.3
Global Opportunities 367.9
DC Portfolios Total 962.6
DB Portfolios Total 3,727.1
$4,689.8 million
A North Carolina SupplementalRetirement Plans A19 February 2015 A1 8

2
Copyright © 2015 All Rights Reserved2000567630/388605_0/G2932/G2932
A North Carolina SupplementalRetirement Plans A19 February 2015
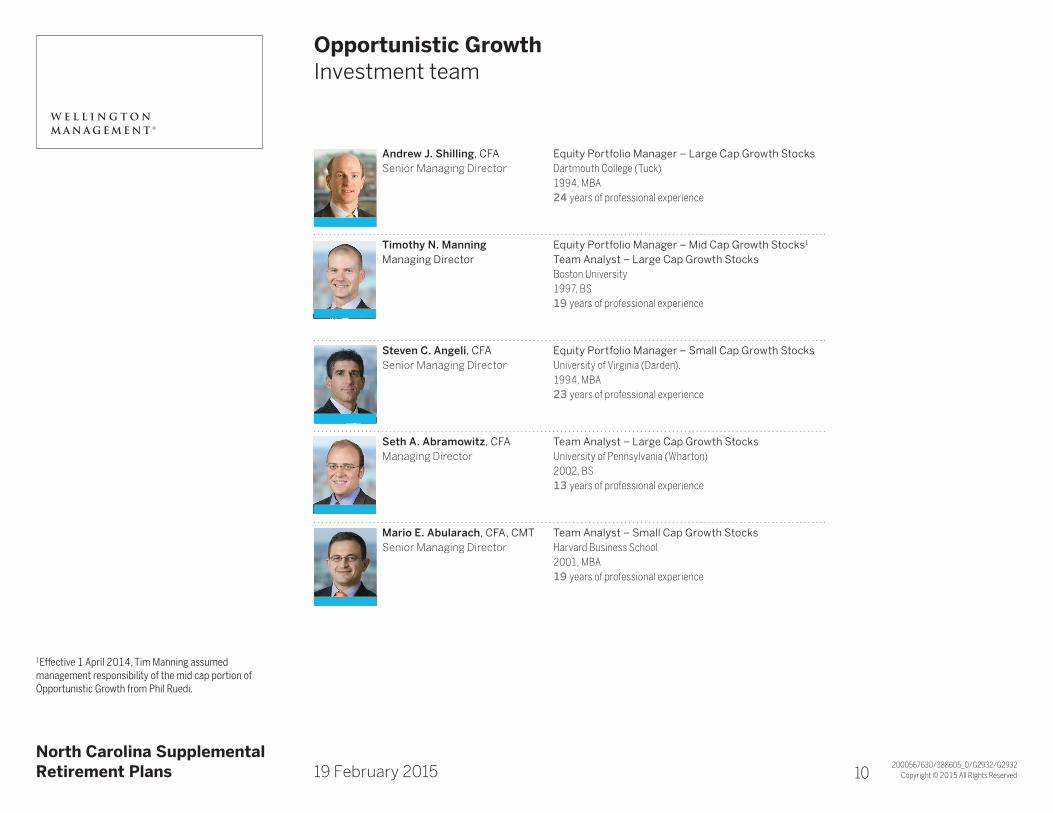
Opportunistic GrowthTitle Line 2Investment team
1Effective 1 April 2014, Tim Manning assumed management responsibility of the mid cap portion of Opportunistic Growth from Phil Ruedi.
Andrew J. Shilling, CFA Equity Portfolio Manager – Large Cap Growth StocksSenior Managing Director Dartmouth College (Tuck) 1994, MBA 24 years of professional experience
Timothy N. Manning Equity Portfolio Manager – Mid Cap Growth Stocks1
Managing Director Team Analyst – Large Cap Growth Stocks Boston University 1997, BS 19 years of professional experience
Steven C. Angeli, CFA Equity Portfolio Manager – Small Cap Growth StocksSenior Managing Director University of Virginia (Darden), 1994, MBA 23 years of professional experience
Seth A. Abramowitz, CFA Team Analyst – Large Cap Growth StocksManaging Director University of Pennsylvania (Wharton) 2002, BS 13 years of professional experience
Mario E. Abularach, CFA, CMT Team Analyst – Small Cap Growth StocksSenior Managing Director Harvard Business School 2001, MBA 19 years of professional experience
A1 10
Copyright © 2015 All Rights Reserved2000567631/388605_0/G2932/G2932
A North Carolina SupplementalRetirement Plans A19 February 2015
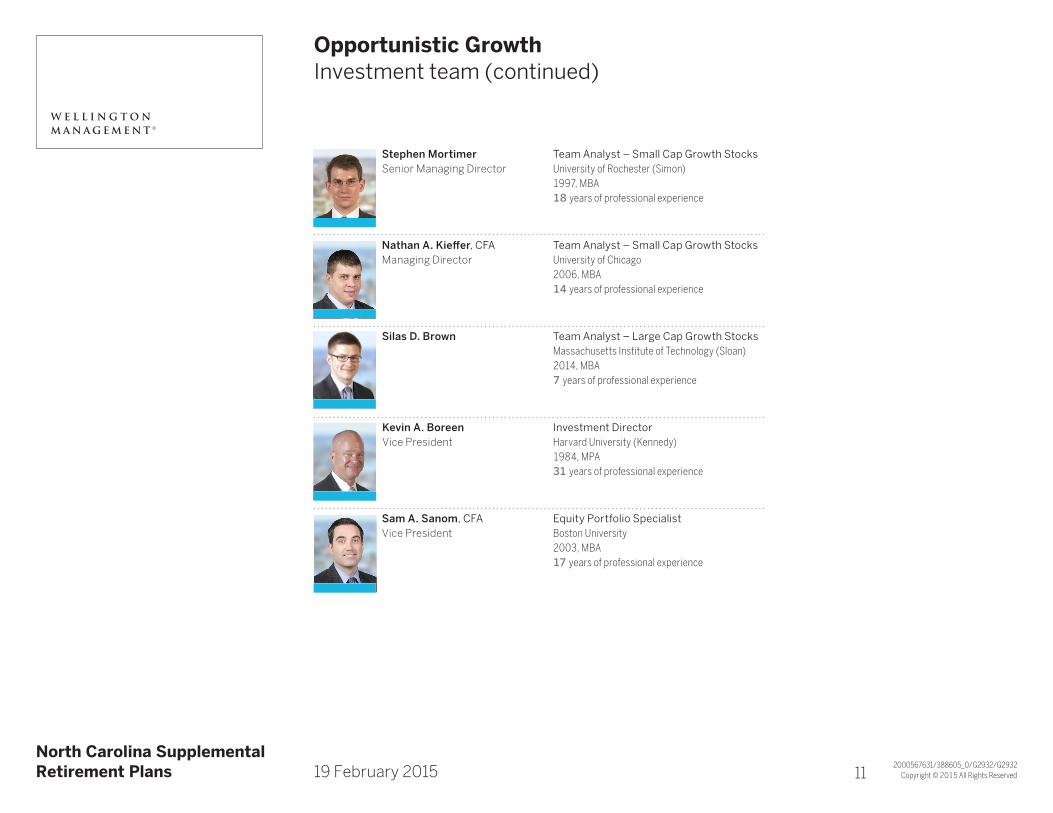
Opportunistic GrowthTitle Line 2Investment team (continued)
Stephen Mortimer Team Analyst – Small Cap Growth StocksSenior Managing Director University of Rochester (Simon) 1997, MBA 18 years of professional experience
Nathan A. Kieffer, CFA Team Analyst – Small Cap Growth StocksManaging Director University of Chicago 2006, MBA 14 years of professional experience
Silas D. Brown Team Analyst – Large Cap Growth Stocks Massachusetts Institute of Technology (Sloan) 2014, MBA 7 years of professional experience
Kevin A. Boreen Investment DirectorVice President Harvard University (Kennedy)
1984, MPA 31 years of professional experience
Sam A. Sanom, CFA Equity Portfolio SpecialistVice President Boston University 2003, MBA 17 years of professional experience
A1 11
Copyright © 2015 All Rights Reserved2000567632/388605_0/G2932/G2932
A North Carolina SupplementalRetirement Plans A19 February 2015
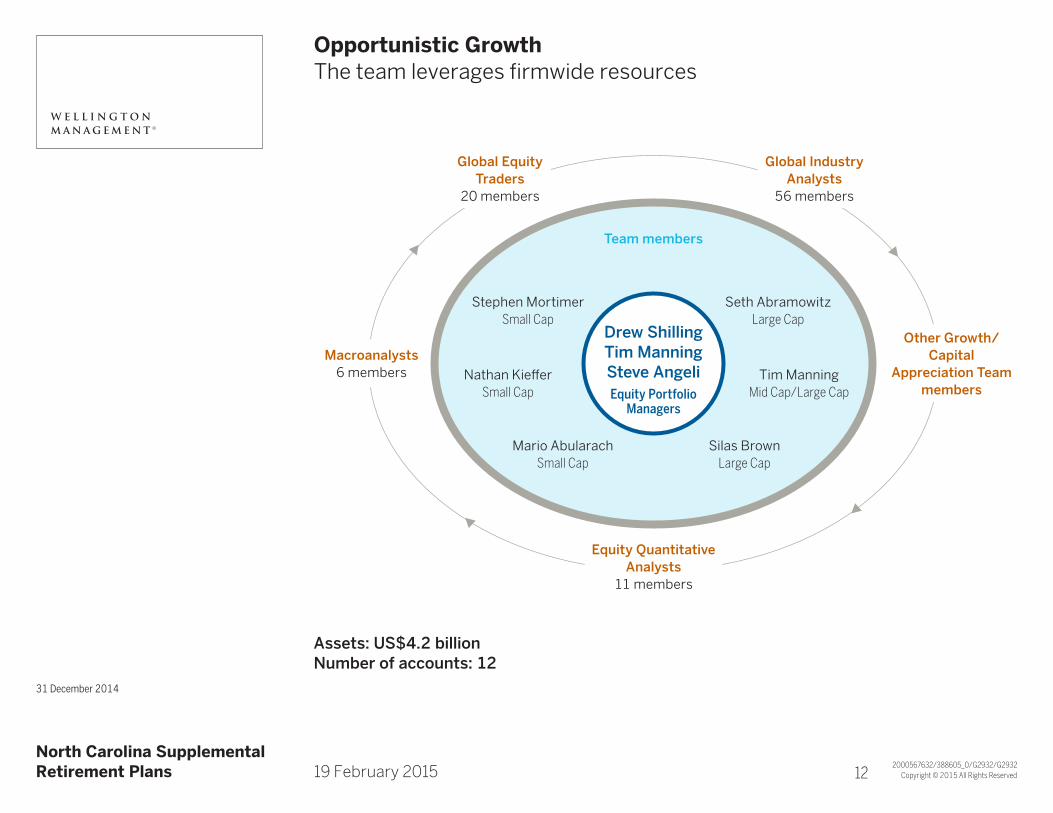
Opportunistic GrowthTitle Line 2The team leverages firmwide resources
31 December 2014
Assets: US$4.2 billionNumber of accounts: 12
Drew ShillingTim ManningSteve AngeliEquity Portfolio
Managers
Team members
Seth AbramowitzLarge Cap
Global Industry Analysts
56 members
Other Growth/Capital
Appreciation Team members
Equity Quantitative Analysts
11 members
Macroanalysts6 members
Global Equity Traders
20 members
Tim ManningMid Cap/Large Cap
Mario AbularachSmall Cap
Silas BrownLarge Cap
Nathan KiefferSmall Cap
Stephen MortimerSmall Cap
A1 12
Copyright © 2014 All Rights Reserved2000551847/388605_0/G2927/G2927A
A
Opportunistic GrowthTitle Line 2Investment philosophy
We believeCompetitive forces create significant hurdles for companies to sustain above average growth for long periods of time.
Companies with high barriers to entry are best positioned to sustain growth and reward shareholders over time, since stock prices are driven by earnings growth and increasing return on invested capital.
Investors often underestimate a company’s ability to grow. As a result, the duration and consistency of above-average returns for high-quality businesses is frequently misjudged by the market.
The market is overly focused on the short term, which creates opportunities for timeframe arbitrage. In other words, we can add value by taking a longer-term view.
A North Carolina SupplementalRetirement Plans A19 February 2015 A1 13
Copyright © 2014 All Rights Reserved2000551855/390738_0/G2927/G2927A
A
Opportunistic GrowthTitle Line 2Investment objective and approach
Investment objectiveSeeks to consistently outperform the growth indexes and, longer term, the broader market
Investment approachBottom-up stock selection based on rigorous fundamental research and access to corporate decision makers
We create a portfolio based on three principles• Sustainablegrowthfocus• Identifiablecompetitivebarrierstoentry• Superiorbusinessmodels
A North Carolina SupplementalRetirement Plans A19 February 2015 A1 14
Copyright © 2014 All Rights Reserved
A North Carolina SupplementalRetirement Plans A19 February 2015
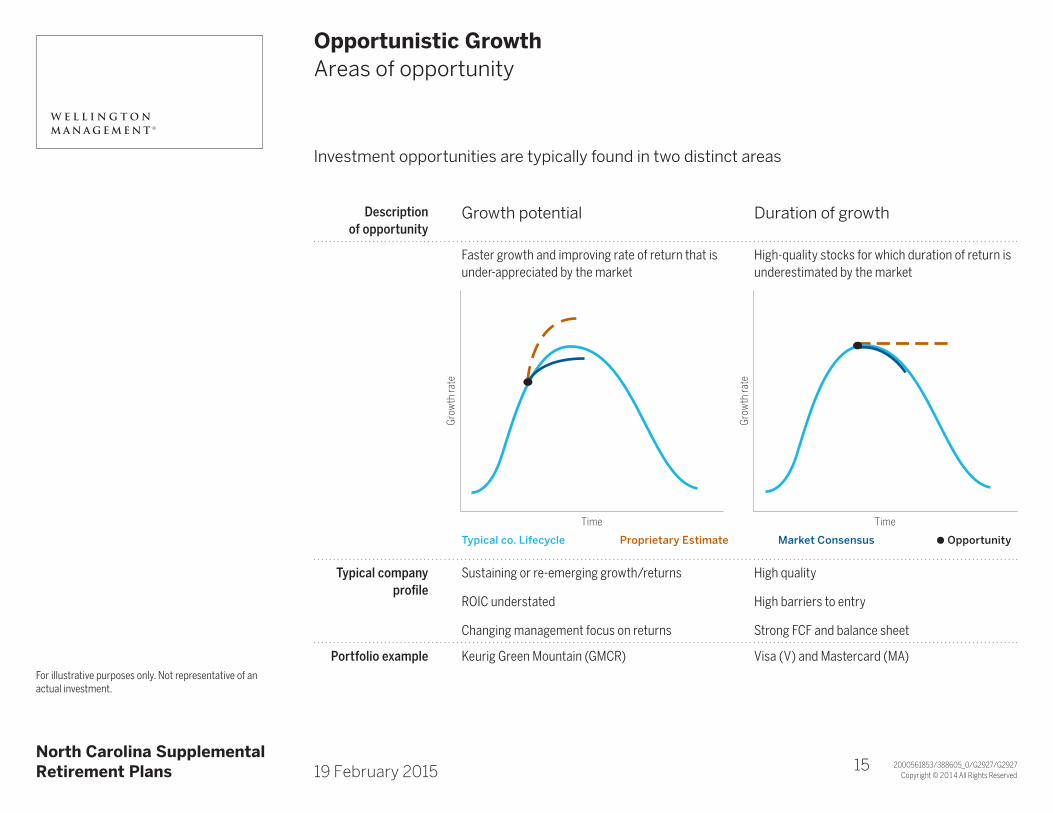
Opportunistic GrowthTitle Line 2Areas of opportunity
For illustrative purposes only. Not representative of an actual investment.
Investment opportunities are typically found in two distinct areas
Typical co. Lifecycle
2000561853/388605_0/G2927/G2927
Proprietary Estimate Market Consensus J Opportunity
Gro
wth
rate
Time Time
Gro
wth
rate
Description of opportunity
Growth potential Duration of growth
Faster growth and improving rate of return that is under-appreciated by the market
High-quality stocks for which duration of return is underestimated by the market
Typical company profile
Sustaining or re-emerging growth/returns
ROIC understated
Changing management focus on returns
High quality
High barriers to entry
Strong FCF and balance sheet
Portfolio example Keurig Green Mountain (GMCR) Visa (V) and Mastercard (MA)
p 15age 1
Copyright © 2014 All Rights Reserved2000567633/390738_0/G2932/G2932
A North Carolina SupplementalRetirement Plans A19 February 2015
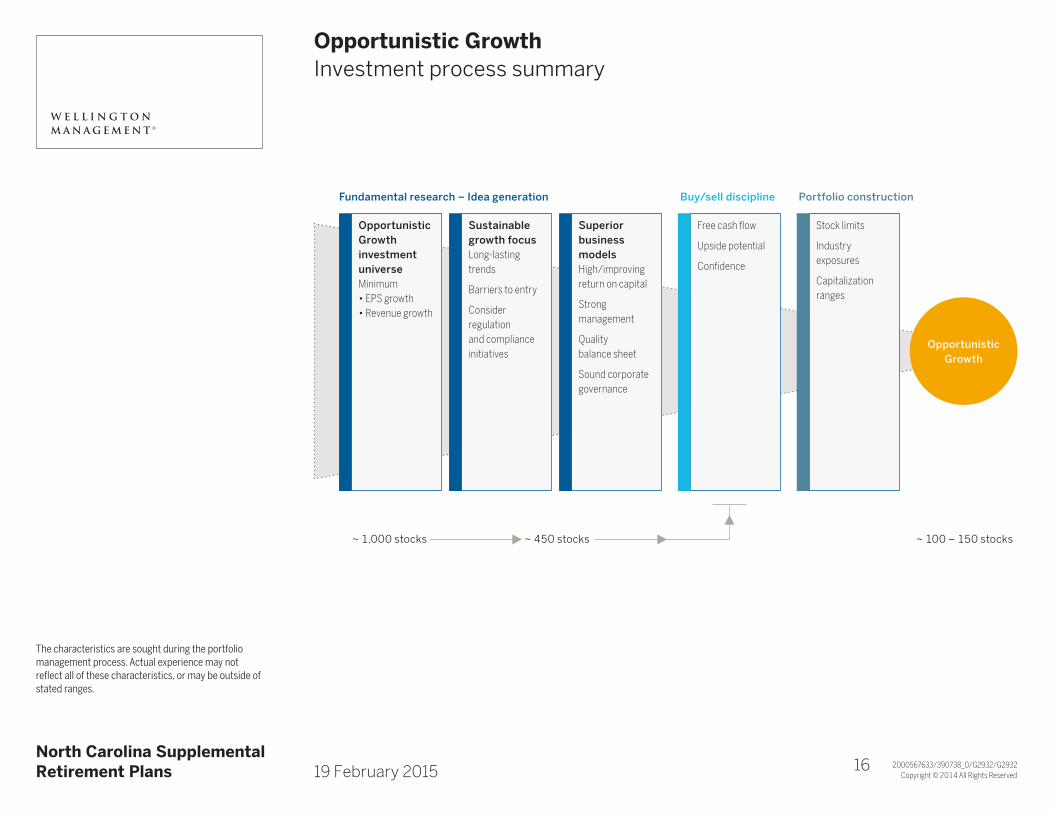
Opportunistic GrowthTitle Line 2Investment process summary
The characteristics are sought during the portfolio management process. Actual experience may not reflect all of these characteristics, or may be outside of stated ranges.
Fundamental research – Idea generation Buy/sell discipline Portfolio construction
Opportunistic Growth
Opportunistic Growth investment universe Minimum• EPS growth• Revenue growth
Sustainable growth focus Long-lasting trends
Barriers to entry
Consider regulationand complianceinitiatives
Superior business models High/improving return on capital
Strong management
Quality balance sheet
Sound corporate governance
Free cash flow
Upside potential
Confidence
Stock limits
Industry exposures
Capitalizationranges
~ 1,000 stocks ~ 450 stocks ~ 100 – 150 stocks
p 16age 1
Copyright © 2015 All Rights Reserved2000704175/388605_0/388605/G2927
A North Carolina SupplementalRetirement Plans A19 February 2015
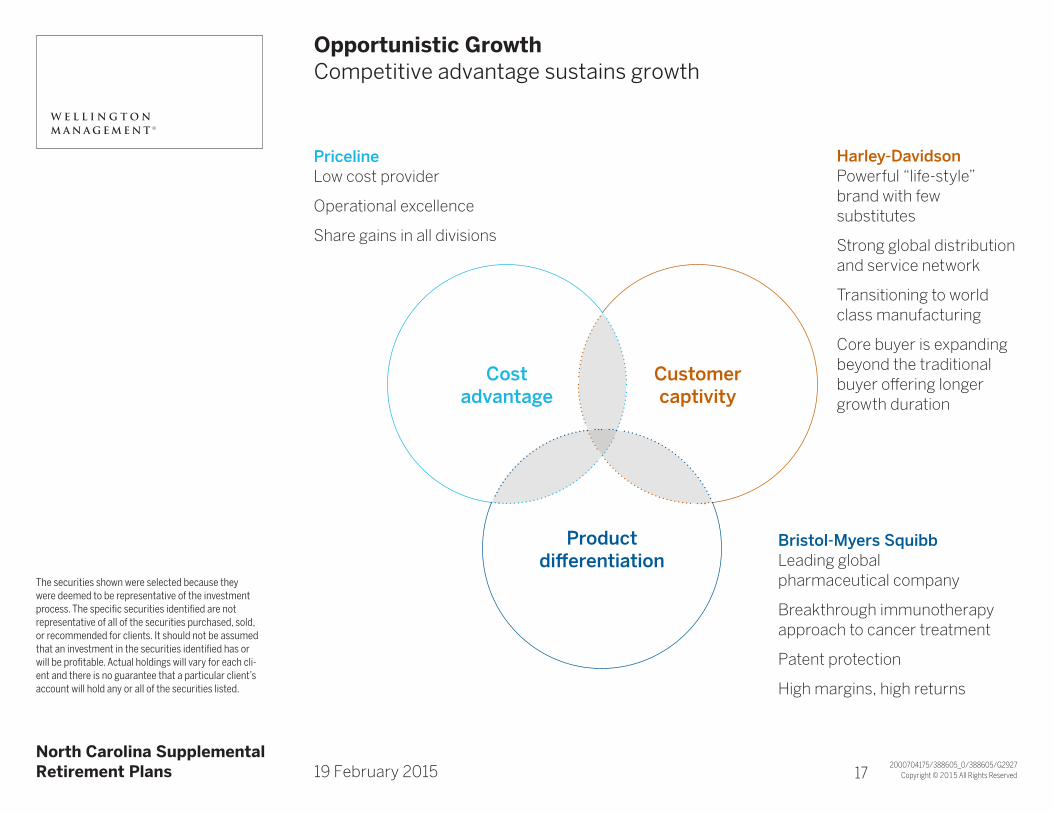
Opportunistic GrowthTitle Line 2Competitive advantage sustains growth
The securities shown were selected because they were deemed to be representative of the investment process. The specific securities identified are not representative of all of the securities purchased, sold, or recommended for clients. It should not be assumed that an investment in the securities identified has or will be profitable. Actual holdings will vary for each cli-ent and there is no guarantee that a particular client’s account will hold any or all of the securities listed.
Priceline Low cost provider
Operational excellence
Share gains in all divisions
Bristol-Myers Squibb Leading global pharmaceutical company
Breakthrough immunotherapy approach to cancer treatment
Patent protection
High margins, high returns
Harley-Davidson Powerful “life-style” brand with few substitutes
Strong global distribution and service network
Transitioning to world class manufacturing
Core buyer is expanding beyond the traditional buyer offering longer growth duration
Customer captivity
Cost advantage
Product differentiation
A1 17
Copyright © 2014 All Rights Reserved2000561909/388605_0/G2927/G2927
A North Carolina SupplementalRetirement Plans A19 February 2015
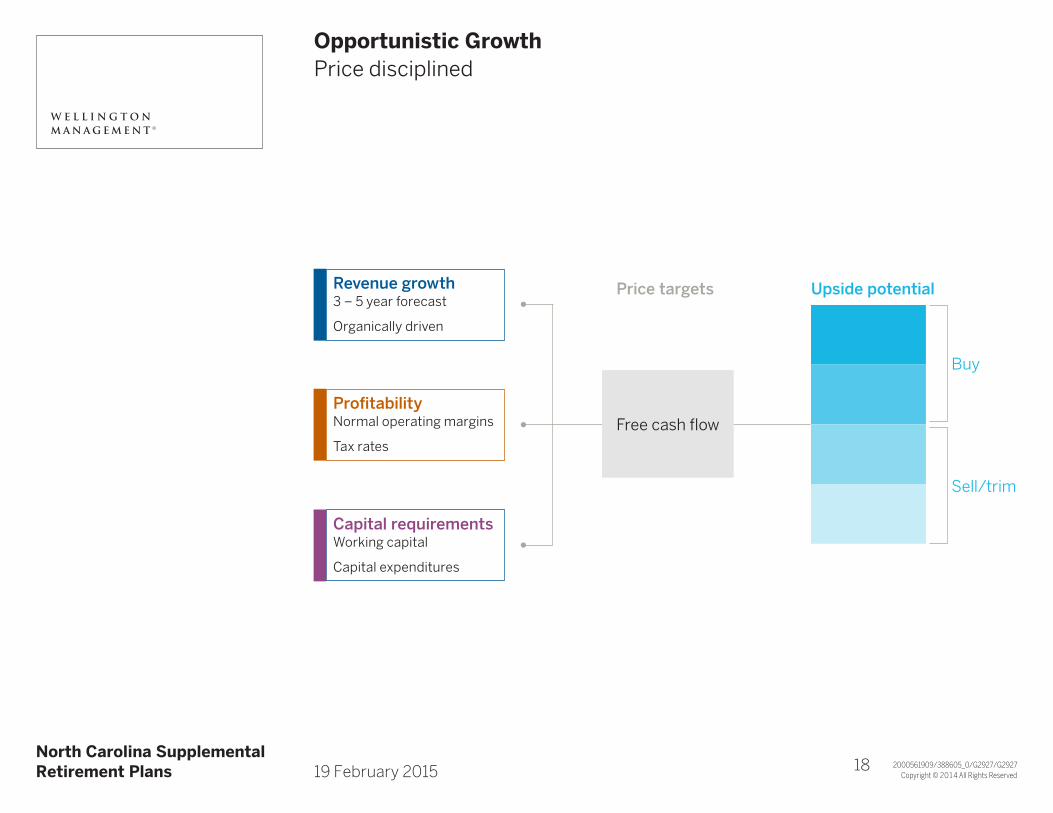
Opportunistic GrowthTitle Line 2Price disciplined
Upside potentialPrice targets
Buy
Sell/trim
Free cash flow
Revenue growth3 – 5 year forecast
Organically driven
ProfitabilityNormal operating margins
Tax rates
Capital requirementsWorking capital
Capital expenditures
p 18age 1
Copyright © 2015 All Rights Reserved2000704176/390738_0/388605/G2932
A North Carolina SupplementalRetirement Plans A19 February 2015
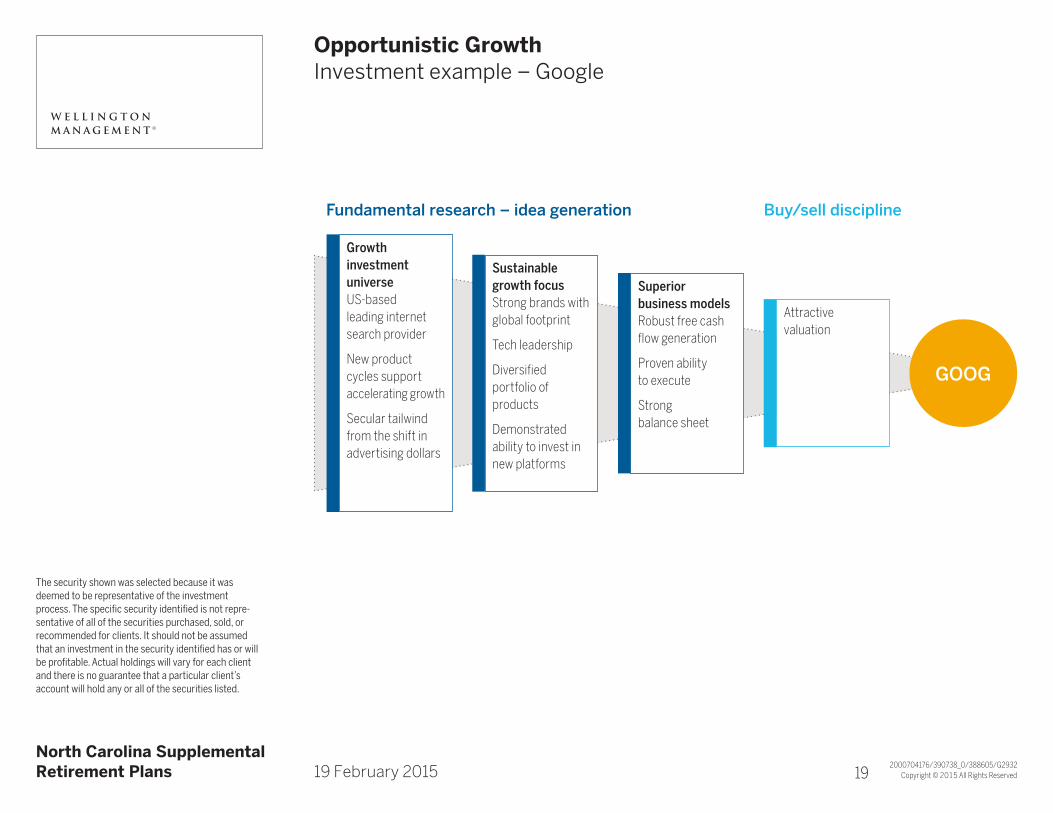
Opportunistic GrowthTitle Line 2Investment example – Google
The security shown was selected because it was deemed to be representative of the investment process. The specific security identified is not repre-sentative of all of the securities purchased, sold, or recommended for clients. It should not be assumed that an investment in the security identified has or will be profitable. Actual holdings will vary for each client and there is no guarantee that a particular client’s account will hold any or all of the securities listed.
GOOG
Fundamental research – idea generation
Superior business modelsRobust free cash flow generation
Proven ability to execute
Strong balance sheet
Sustainable growth focusStrong brands with global footprint
Tech leadership
Diversified portfolio of products
Demonstrated ability to invest in new platforms
Growth investment universeUS-based leading internet search provider
New product cycles support accelerating growth
Secular tailwind from the shift in advertising dollars
Buy/sell discipline
Attractive valuation
A1 19
Copyright © 2015 All Rights Reserved2000704177/388605_0/388605/G2932
A North Carolina SupplementalRetirement Plans A19 February 2015
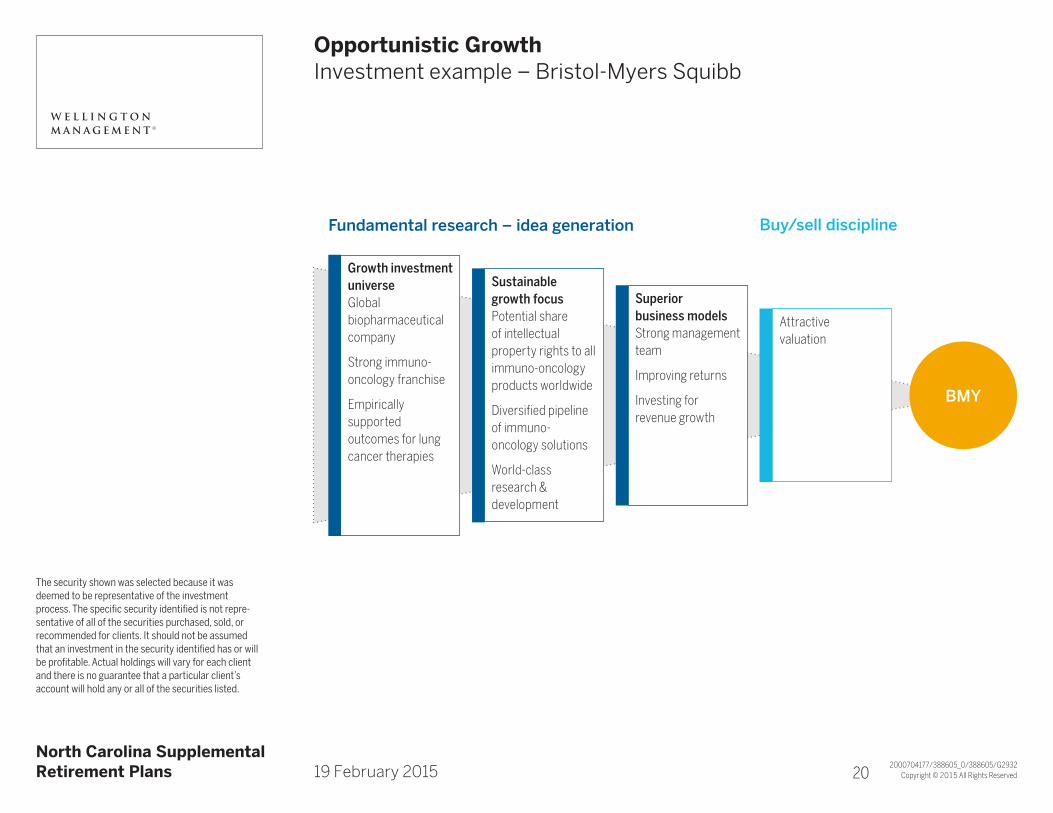
Opportunistic GrowthTitle Line 2Investment example – Bristol-Myers Squibb
The security shown was selected because it was deemed to be representative of the investment process. The specific security identified is not repre-sentative of all of the securities purchased, sold, or recommended for clients. It should not be assumed that an investment in the security identified has or will be profitable. Actual holdings will vary for each client and there is no guarantee that a particular client’s account will hold any or all of the securities listed.
BMY
Buy/sell discipline
Attractive valuation
Fundamental research – idea generation
Superior business models Strong management team
Improving returns
Investing for revenue growth
Sustainable growth focus Potential share of intellectual property rights to all immuno-oncology products worldwide
Diversified pipeline of immuno-oncology solutions
World-class research & development
Growth investment universe Global biopharmaceutical company
Strong immuno-oncology franchise
Empirically supported outcomes for lung cancer therapies
A1 20
Copyright © 2015 All Rights Reserved2000704178/390738_0/388605/G2927
A North Carolina SupplementalRetirement Plans A19 February 2015
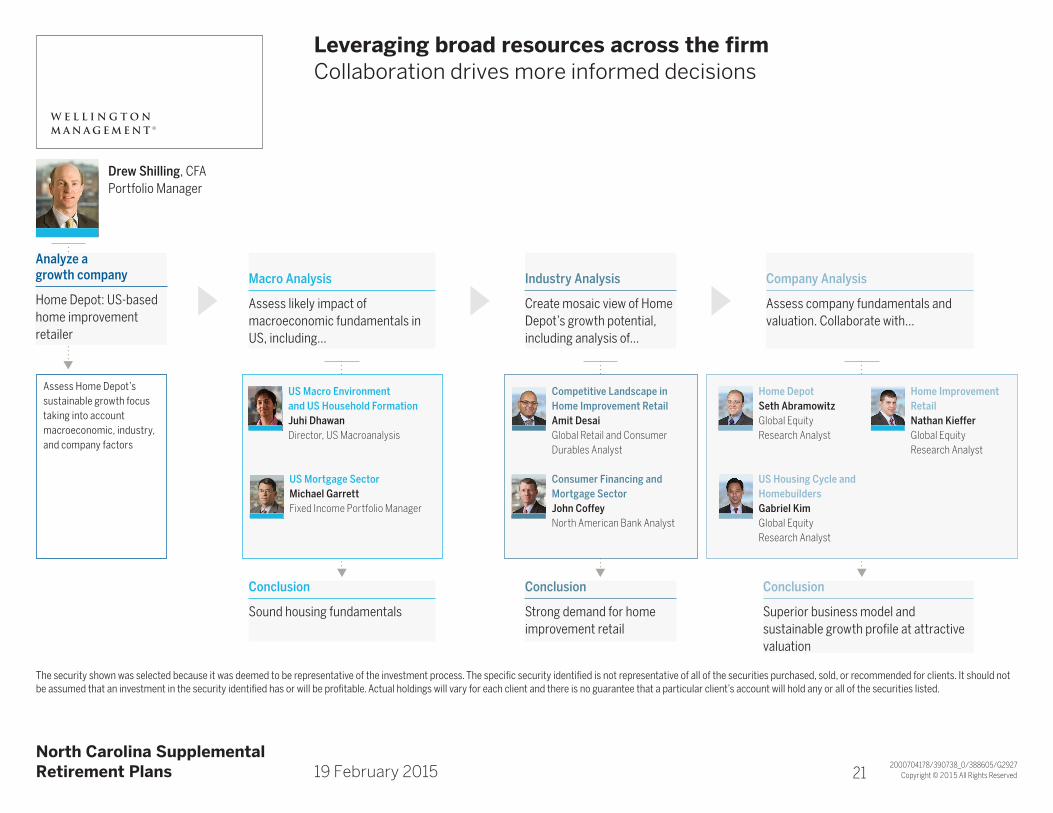
Leveraging broad resources across the firmTitle Line 2Collaboration drives more informed decisions
The security shown was selected because it was deemed to be representative of the investment process. The specific security identified is not representative of all of the securities purchased, sold, or recommended for clients. It should not be assumed that an investment in the security identified has or will be profitable. Actual holdings will vary for each client and there is no guarantee that a particular client’s account will hold any or all of the securities listed.
Home DepotSeth AbramowitzGlobal Equity Research Analyst
US Housing Cycle and HomebuildersGabriel KimGlobal Equity Research Analyst
Home Improvement RetailNathan KiefferGlobal Equity Research Analyst
Drew Shilling, CFAPortfolio Manager
Analyze a growth company
Home Depot: US-based home improvement retailer
Macro Analysis
Assess likely impact of macroeconomic fundamentals in US, including…
Industry Analysis
Create mosaic view of Home Depot’s growth potential, including analysis of…
Conclusion
Strong demand for home improvement retail
Conclusion
Superior business model and sustainable growth profile at attractive valuation
Conclusion
Sound housing fundamentals
Company Analysis
Assess company fundamentals and valuation. Collaborate with…
US Macro Environment and US Household FormationJuhi DhawanDirector, US Macroanalysis
US Mortgage SectorMichael GarrettFixed Income Portfolio Manager
Competitive Landscape in Home Improvement RetailAmit DesaiGlobal Retail and Consumer Durables Analyst
Consumer Financing and Mortgage SectorJohn CoffeyNorth American Bank Analyst
Assess Home Depot’s sustainable growth focus taking into account macroeconomic, industry, and company factors
A1 21
Copyright © 2015 All Rights Reserved2000705539/390738_0/388605/G2932A
A
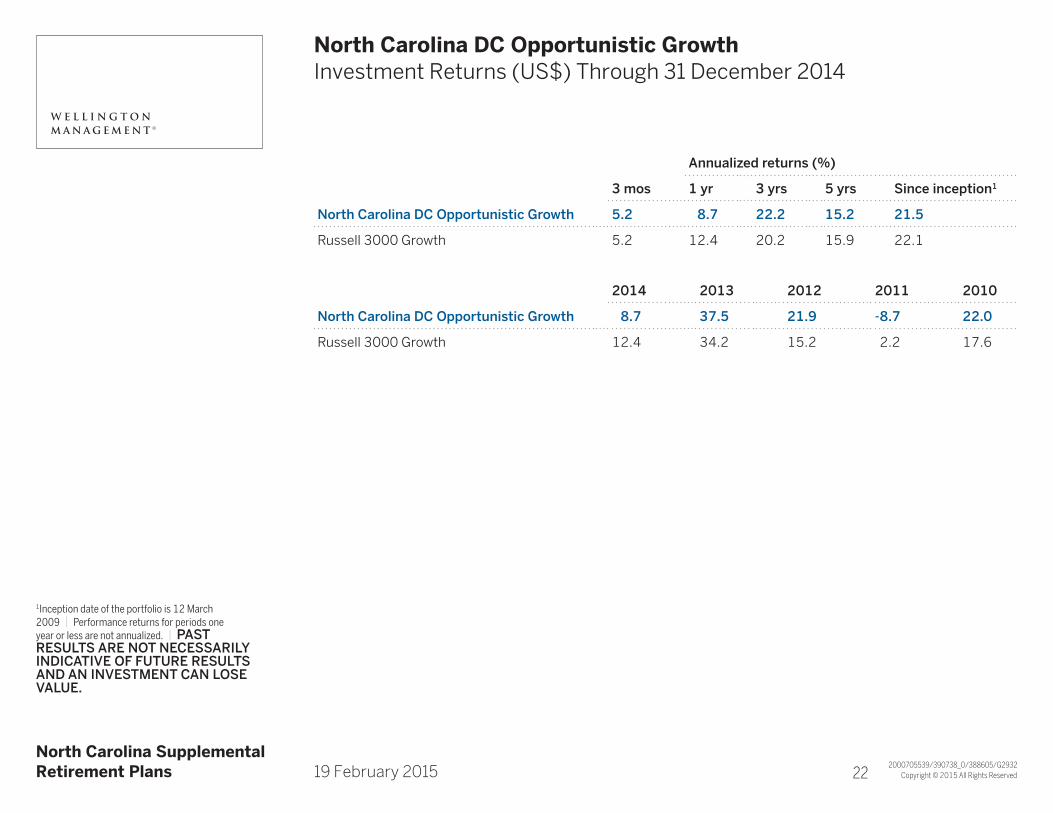
North Carolina DC Opportunistic GrowthTitle Line 2Investment Returns (US$) Through 31 December 2014
Annualized returns (%)
3 mos 1 yr 3 yrs 5 yrs Since inception1
North Carolina DC Opportunistic Growth 5.2 8.7 22.2 15.2 21.5
Russell 3000 Growth 5.2 12.4 20.2 15.9 22.1
2014 2013 2012 2011 2010
North Carolina DC Opportunistic Growth 8.7 37.5 21.9 -8.7 22.0
Russell 3000 Growth 12.4 34.2 15.2 2.2 17.6
A North Carolina SupplementalRetirement Plans A19 February 2015
1Inception date of the portfolio is 12 March 2009 | Performance returns for periods one year or less are not annualized. | PAST RESULTS ARE NOT NECESSARILY INDICATIVE OF FUTURE RESULTS AND AN INVESTMENT CAN LOSE VALUE.
A1 22
Copyright © 2015 All Rights Reserved2000705540/390738_0/388605/G2932A
A
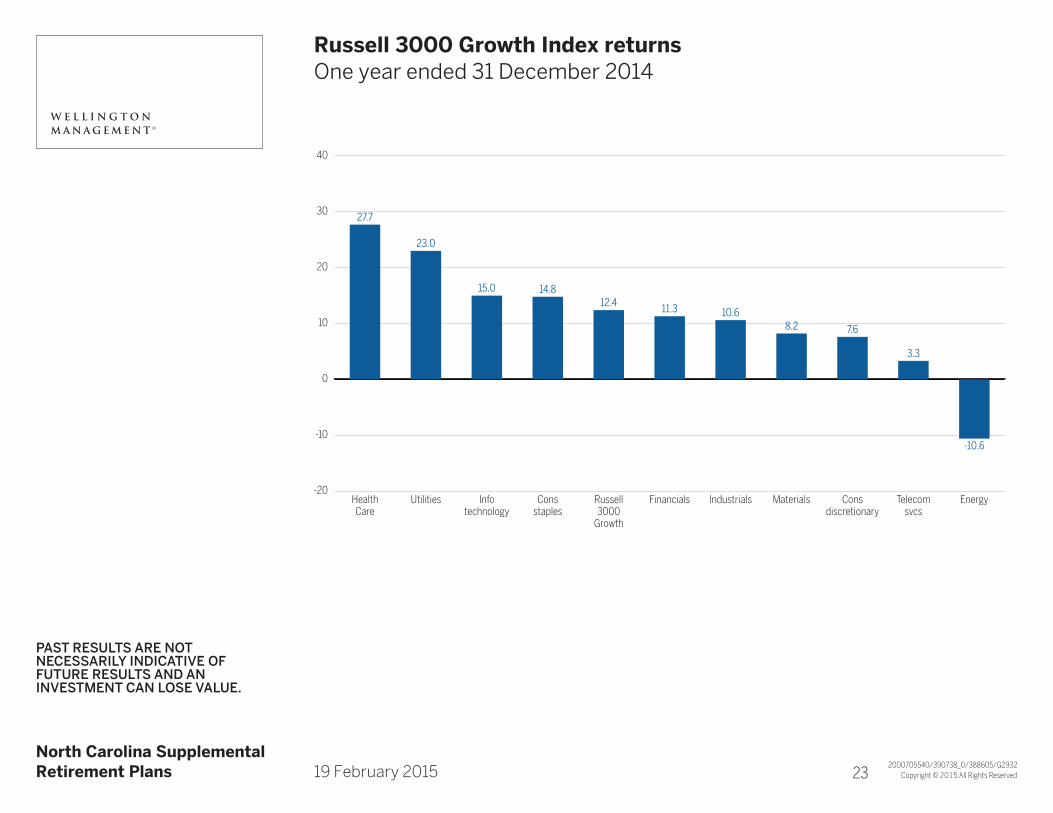
Russell 3000 Growth Index returnsTitle Line 2One year ended 31 December 2014
A North Carolina SupplementalRetirement Plans A19 February 2015
PAST RESULTS ARE NOT NECESSARILY INDICATIVE OF FUTURE RESULTS AND AN INVESTMENT CAN LOSE VALUE.
40
30
20
10
0
-10
-20
27.7
HealthCare
23.0
Utilities
15.0
Infotechnology
14.8
Consstaples
12.4
Russell3000Growth
11.3
Financials
10.6
Industrials
8.2
Materials
7.6
Consdiscretionary
3.3
Telecomsvcs
-10.6
Energy
A1 23
Copyright © 2015 All Rights Reserved2000705547/390738_0/388605/G2932A
A
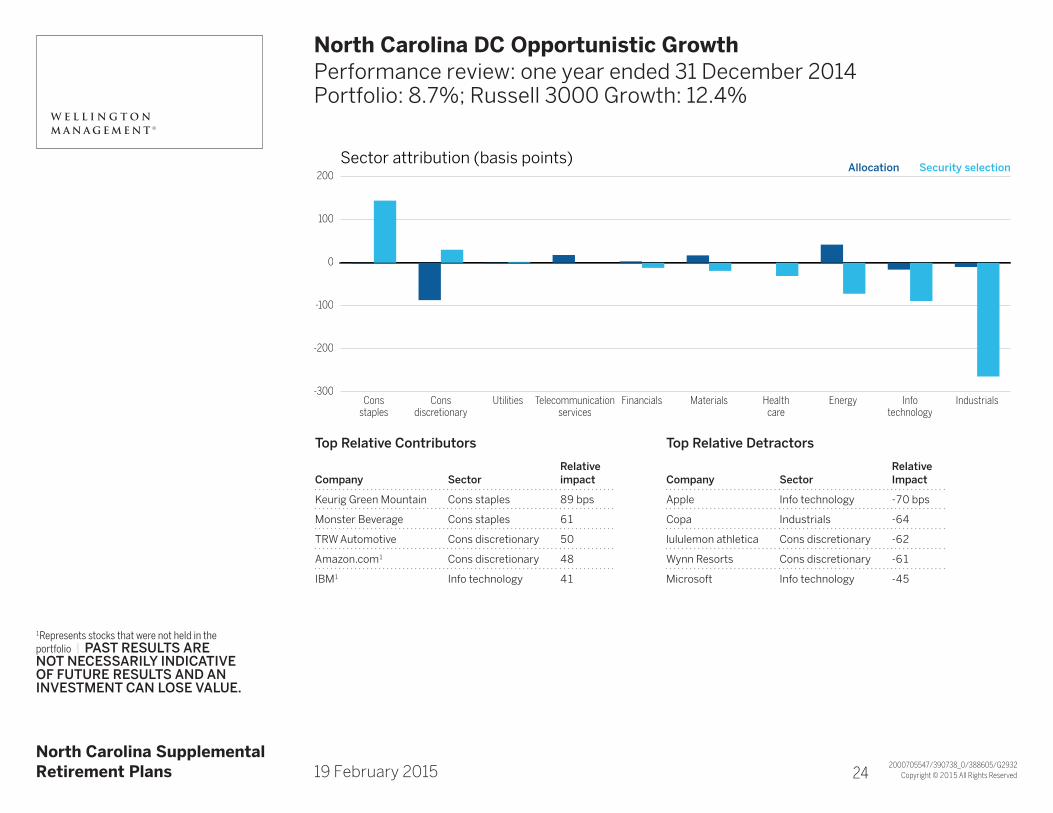
North Carolina DC Opportunistic GrowthTitle Line 2Performance review: one year ended 31 December 2014Portfolio: 8.7%; Russell 3000 Growth: 12.4%
A North Carolina SupplementalRetirement Plans A19 February 2015
1Represents stocks that were not held in the portfolio | PAST RESULTS ARE NOT NECESSARILY INDICATIVE OF FUTURE RESULTS AND AN INVESTMENT CAN LOSE VALUE.
Allocation Security selection200
100
0
-100
-200
-300
Sector attribution (basis points)
Consstaples
Consdiscretionary
Utilities Telecommunicationservices
Financials Materials Healthcare
Energy Infotechnology
Industrials
Top Relative Contributors
Company SectorRelative impact
Keurig Green Mountain Cons staples 89 bps
Monster Beverage Cons staples 61
TRW Automotive Cons discretionary 50
Amazon.com1 Cons discretionary 48
IBM1 Info technology 41
Top Relative Detractors
Company SectorRelative Impact
Apple Info technology -70 bps
Copa Industrials -64
lululemon athletica Cons discretionary -62
Wynn Resorts Cons discretionary -61
Microsoft Info technology -45
A1 24
Copyright © 2015 All Rights Reserved2000705541/390738_0/388605/G2932A
A
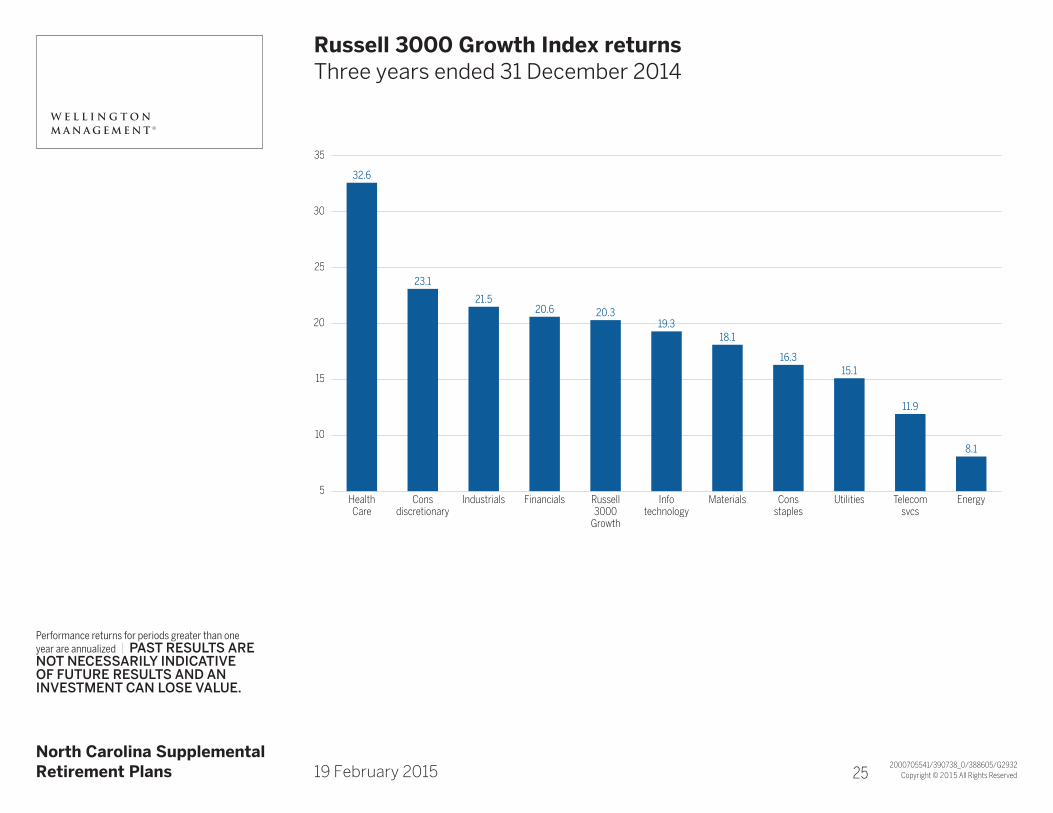
Russell 3000 Growth Index returnsTitle Line 2Three years ended 31 December 2014
A North Carolina SupplementalRetirement Plans A19 February 2015
Performance returns for periods greater than one year are annualized | PAST RESULTS ARE NOT NECESSARILY INDICATIVE OF FUTURE RESULTS AND AN INVESTMENT CAN LOSE VALUE.
35
30
25
20
15
10
5
32.6
HealthCare
23.1
Consdiscretionary
21.5
Industrials
20.6
Financials
20.3
Russell3000Growth
19.3
Infotechnology
18.1
Materials
16.3
Consstaples
15.1
Utilities
11.9
Telecomsvcs
8.1
Energy
A1 25
Copyright © 2015 All Rights Reserved2000705608/390738_0/388605/G2932A
A
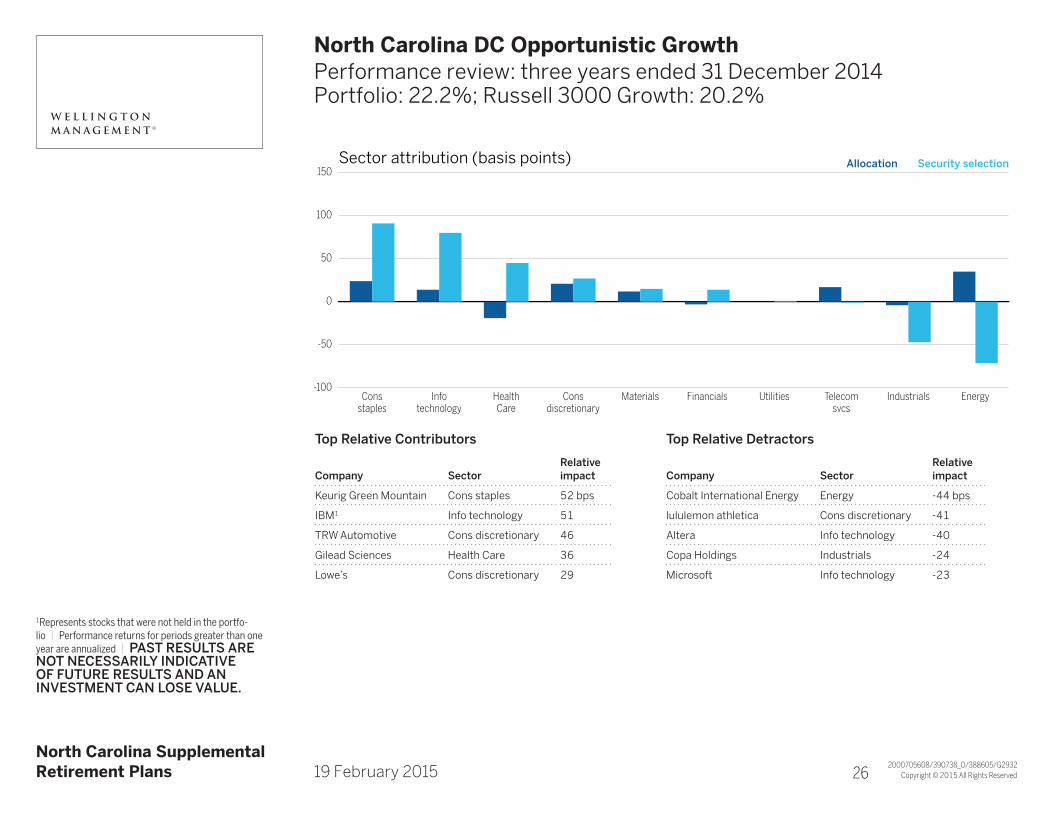
North Carolina DC Opportunistic GrowthTitle Line 2Performance review: three years ended 31 December 2014Portfolio: 22.2%; Russell 3000 Growth: 20.2%
A North Carolina SupplementalRetirement Plans A19 February 2015
1Represents stocks that were not held in the portfo-lio | Performance returns for periods greater than one year are annualized | PAST RESULTS ARE NOT NECESSARILY INDICATIVE OF FUTURE RESULTS AND AN INVESTMENT CAN LOSE VALUE.
Allocation Security selection150
100
50
0
-50
-100
Sector attribution (basis points)
Consstaples
Infotechnology
HealthCare
Consdiscretionary
Materials Financials Utilities Telecomsvcs
Industrials Energy
Top Relative Contributors
Company SectorRelativeimpact
Keurig Green Mountain Cons staples 52 bps
IBM1 Info technology 51
TRW Automotive Cons discretionary 46
Gilead Sciences Health Care 36
Lowe’s Cons discretionary 29
Top Relative Detractors
Company SectorRelative impact
Cobalt International Energy Energy -44 bps
lululemon athletica Cons discretionary -41
Altera Info technology -40
Copa Holdings Industrials -24
Microsoft Info technology -23
A1 26
Copyright © 2015 All Rights Reserved2000705626/388605_0/388605/G2932A
A
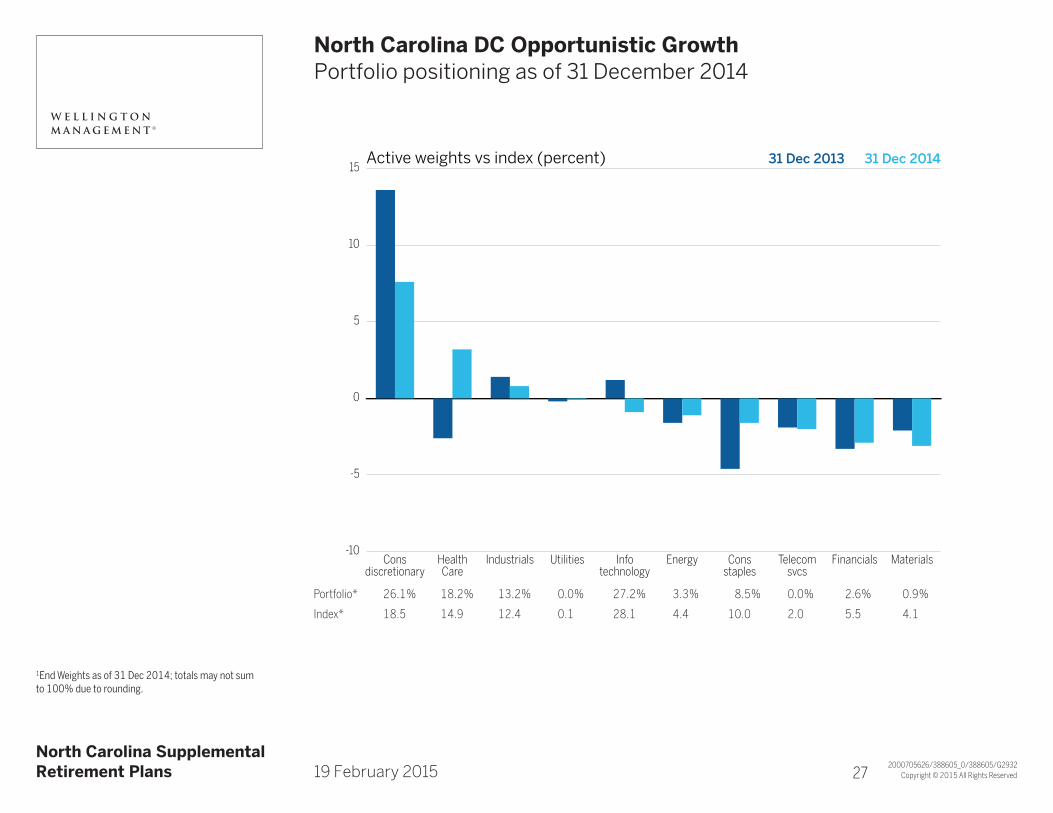
North Carolina DC Opportunistic GrowthTitle Line 2Portfolio positioning as of 31 December 2014
A North Carolina SupplementalRetirement Plans A19 February 2015
1End Weights as of 31 Dec 2014; totals may not sum to 100% due to rounding.
31 Dec 2013 31 Dec 201415
10
5
0
-5
-10
Active weights vs index (percent)
Consdiscretionary
HealthCare
Industrials Utilities Infotechnology
Energy Consstaples
Telecomsvcs
Financials Materials
Portfolio* 26.1% 18.2% 13.2% 0.0% 27.2% 3.3% 8.5% 0.0% 2.6% 0.9%
Index* 18.5 14.9 12.4 0.1 28.1 4.4 10.0 2.0 5.5 4.1
A1 27
Copyright © 2015 All Rights Reserved2000705544/388605_0/388605/G2932A
A
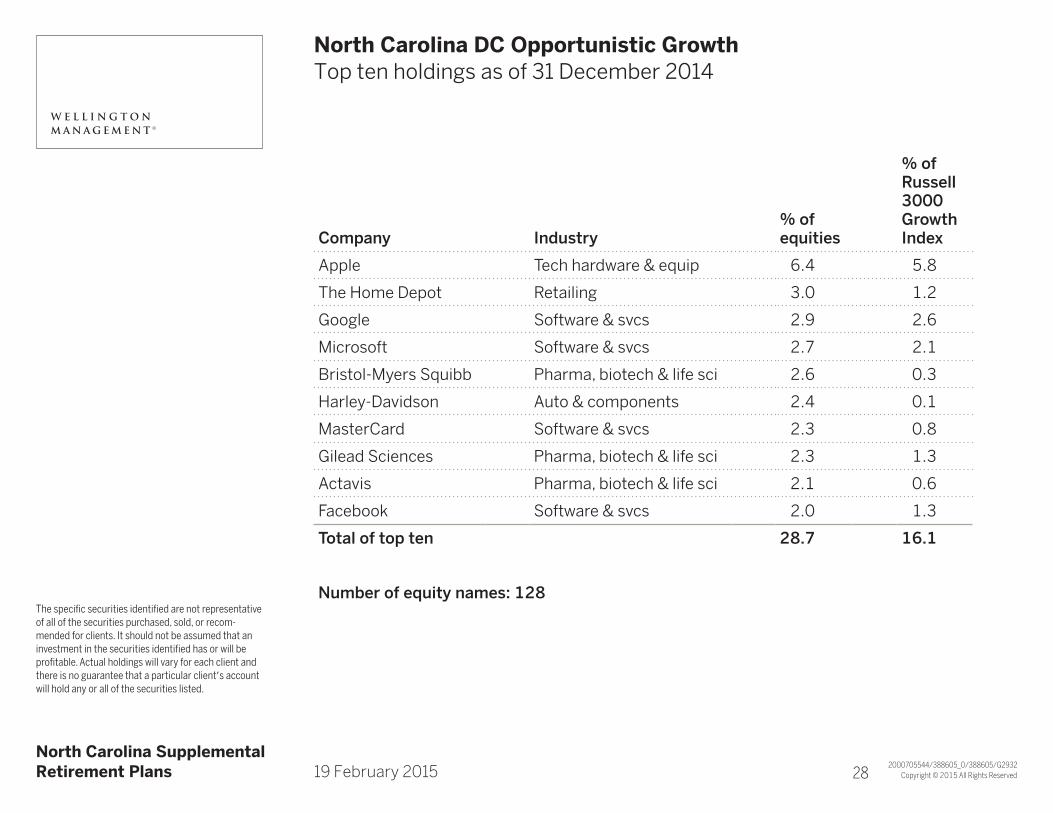
North Carolina DC Opportunistic GrowthTitle Line 2Top ten holdings as of 31 December 2014
Company Industry% of equities
% of Russell 3000 Growth Index
Apple Tech hardware & equip 6.4 5.8
The Home Depot Retailing 3.0 1.2
Google Software & svcs 2.9 2.6
Microsoft Software & svcs 2.7 2.1
Bristol-Myers Squibb Pharma, biotech & life sci 2.6 0.3
Harley-Davidson Auto & components 2.4 0.1
MasterCard Software & svcs 2.3 0.8
Gilead Sciences Pharma, biotech & life sci 2.3 1.3
Actavis Pharma, biotech & life sci 2.1 0.6
Facebook Software & svcs 2.0 1.3
Total of top ten 28.7 16.1
Number of equity names: 128
A North Carolina SupplementalRetirement Plans A19 February 2015
The specific securities identified are not representative of all of the securities purchased, sold, or recom-mended for clients. It should not be assumed that an investment in the securities identified has or will be profitable. Actual holdings will vary for each client and there is no guarantee that a particular client’s account will hold any or all of the securities listed.
A1 28
Copyright © 2015 All Rights Reserved2000705546/388605_0/388605/G2932A
A
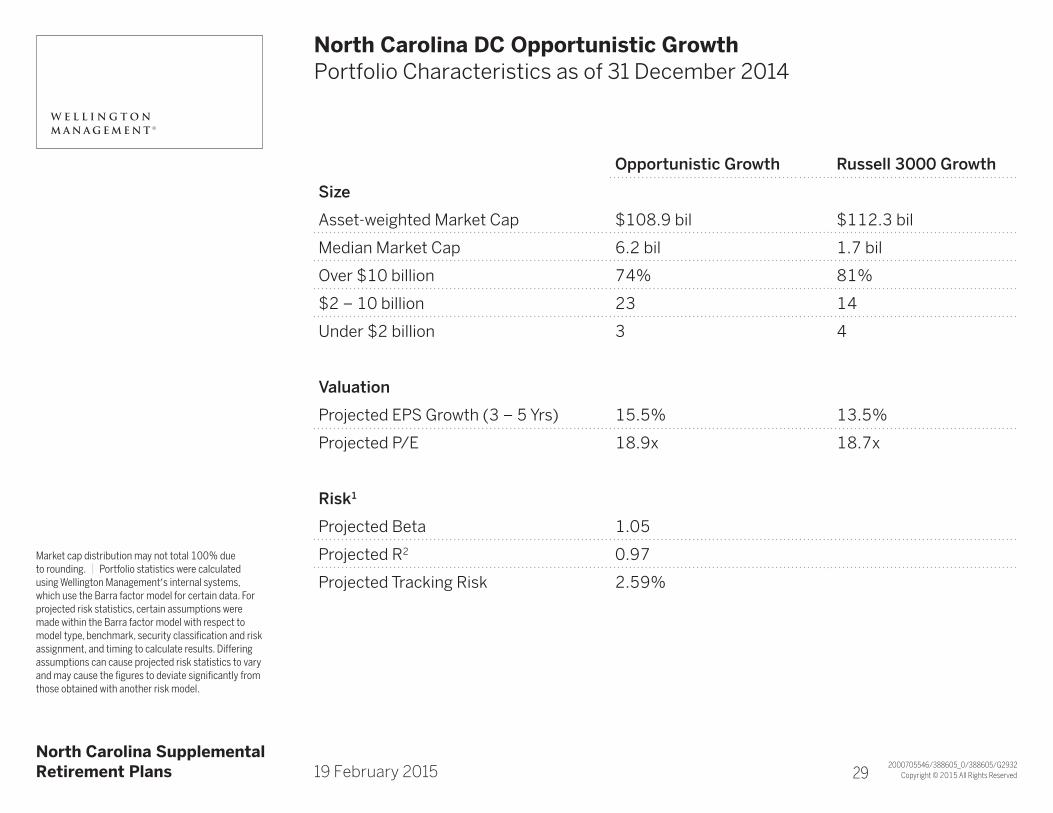
North Carolina DC Opportunistic GrowthTitle Line 2Portfolio Characteristics as of 31 December 2014
Opportunistic Growth Russell 3000 Growth
Size
Asset-weighted Market Cap $108.9 bil $112.3 bil
Median Market Cap 6.2 bil 1.7 bil
Over $10 billion 74% 81%
$2 – 10 billion 23 14
Under $2 billion 3 4
Valuation
Projected EPS Growth (3 – 5 Yrs) 15.5% 13.5%
Projected P/E 18.9x 18.7x
Risk1
Projected Beta 1.05
Projected R2 0.97
Projected Tracking Risk 2.59%
A North Carolina SupplementalRetirement Plans A19 February 2015
Market cap distribution may not total 100% due to rounding. | Portfolio statistics were calculated using Wellington Management’s internal systems, which use the Barra factor model for certain data. For projected risk statistics, certain assumptions were made within the Barra factor model with respect to model type, benchmark, security classification and risk assignment, and timing to calculate results. Differing assumptions can cause projected risk statistics to vary and may cause the figures to deviate significantly from those obtained with another risk model.
A1 29
Copyright © 2015 All Rights Reserved
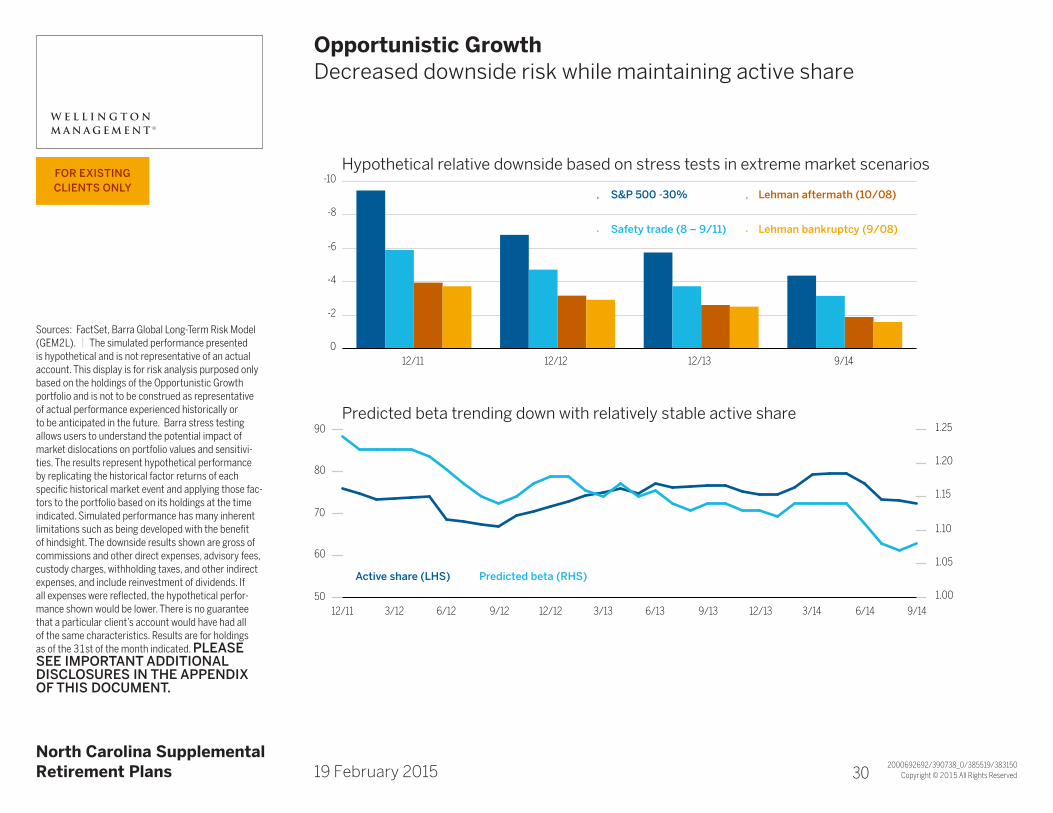
Sources: FactSet, Barra Global Long-Term Risk Model (GEM2L). | The simulated performance presented is hypothetical and is not representative of an actual account. This display is for risk analysis purposed only based on the holdings of the Opportunistic Growth portfolio and is not to be construed as representative of actual performance experienced historically or to be anticipated in the future. Barra stress testing allows users to understand the potential impact of market dislocations on portfolio values and sensitivi-ties. The results represent hypothetical performance by replicating the historical factor returns of each specific historical market event and applying those fac-tors to the portfolio based on its holdings at the time indicated. Simulated performance has many inherent limitations such as being developed with the benefit of hindsight. The downside results shown are gross of commissions and other direct expenses, advisory fees, custody charges, withholding taxes, and other indirect expenses, and include reinvestment of dividends. If all expenses were reflected, the hypothetical perfor-mance shown would be lower. There is no guarantee that a particular client’s account would have had all of the same characteristics. Results are for holdings as of the 31st of the month indicated. PLEASE SEE IMPORTANT ADDITIONAL DISCLOSURES IN THE APPENDIX OF THIS DOCUMENT.
2000692692/390738_0/385519/383150
12/11 12/12 12/13 9/140
-2
-4
-6
-8
-10
S&P 500 -30%
Safety trade (8 – 9/11)
Lehman aftermath (10/08)
Lehman bankruptcy (9/08)
12/11 3/12 6/12 9/12 12/12 3/13 6/13 9/13 12/13 3/14 6/14 9/1450
60
70
80
90
1.00
1.05
1.10
1.15
1.20
1.25
Active share (LHS) Predicted beta (RHS)
A North Carolina SupplementalRetirement Plans A19 February 2015
Opportunistic GrowthTitle Line 2Decreased downside risk while maintaining active share
Hypothetical relative downside based on stress tests in extreme market scenarios
Predicted beta trending down with relatively stable active share
FOR EXISTINg CLIENTS ONLy
A1 30

3
Copyright © 2015 All Rights Reserved2000706457/390738_0/388605/G2934A
A
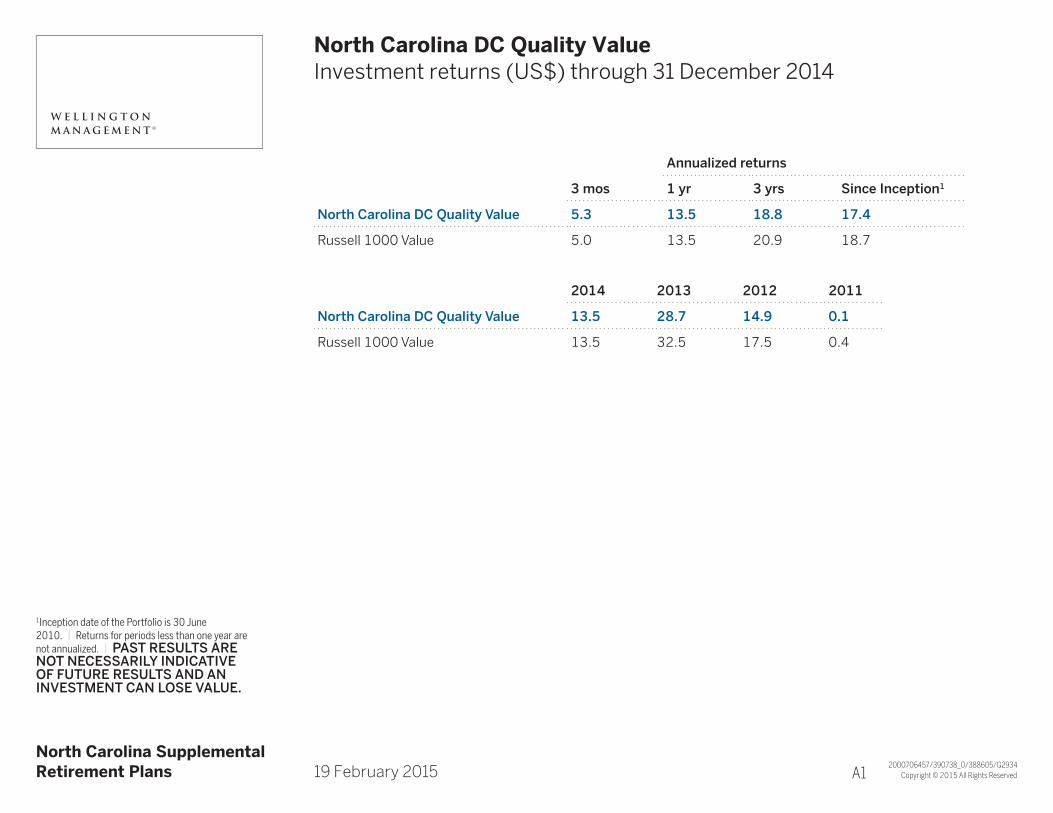
North Carolina DC Quality ValueTitle Line 2Investment returns (US$) through 31 December 2014
Annualized returns
3 mos 1 yr 3 yrs Since Inception1
North Carolina DC Quality Value 5.3 13.5 18.8 17.4
Russell 1000 Value 5.0 13.5 20.9 18.7
2014 2013 2012 2011
North Carolina DC Quality Value 13.5 28.7 14.9 0.1
Russell 1000 Value 13.5 32.5 17.5 0.4
A North Carolina SupplementalRetirement Plans A19 February 2015
1Inception date of the Portfolio is 30 June 2010. | Returns for periods less than one year are not annualized. | PAST RESULTS ARE NOT NECESSARILY INDICATIVE OF FUTURE RESULTS AND AN INVESTMENT CAN LOSE VALUE.
A1 A1
Copyright © 2015 All Rights Reserved2000706480/388605_0/388605/G2934A
A
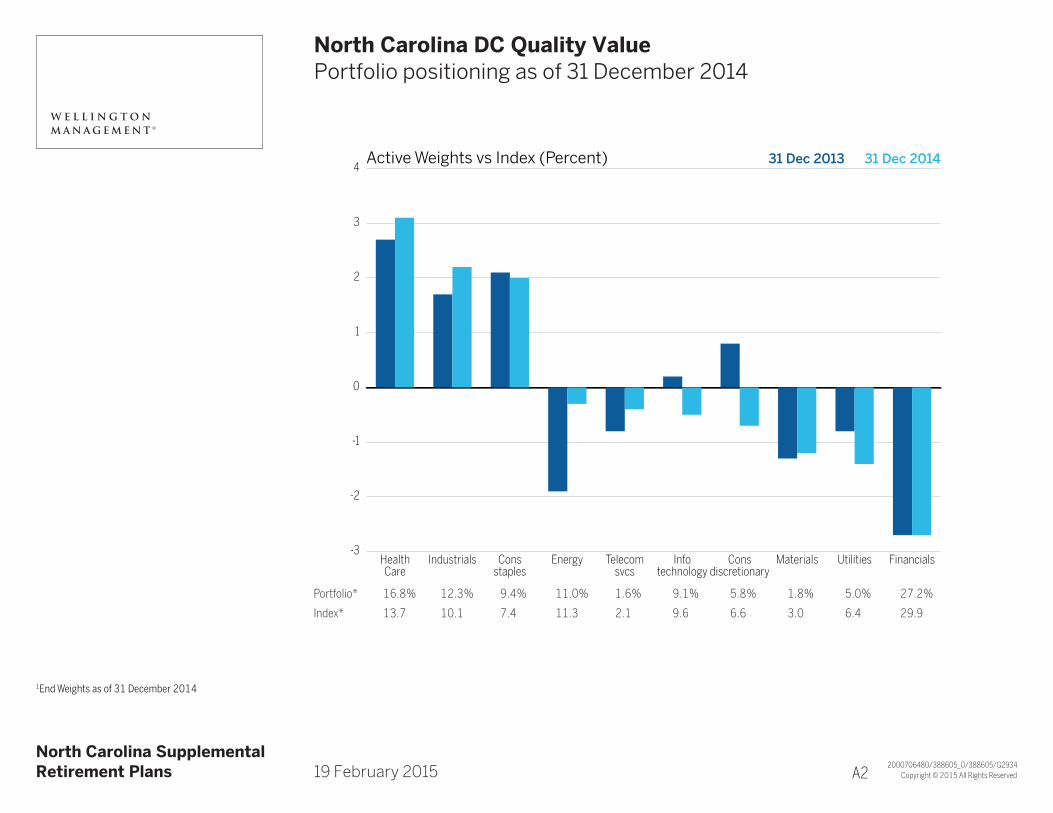
North Carolina DC Quality ValueTitle Line 2Portfolio positioning as of 31 December 2014
A North Carolina SupplementalRetirement Plans A19 February 2015
1End Weights as of 31 December 2014
31 Dec 2013 31 Dec 20144
3
2
1
0
-1
-2
-3
Active Weights vs Index (Percent)
HealthCare
Industrials Consstaples
Energy Telecomsvcs
Infotechnology
Consdiscretionary
Materials Utilities Financials
Portfolio* 16.8% 12.3% 9.4% 11.0% 1.6% 9.1% 5.8% 1.8% 5.0% 27.2%
Index* 13.7 10.1 7.4 11.3 2.1 9.6 6.6 3.0 6.4 29.9
A1 A2
Copyright © 2015 All Rights Reserved2000706484/390738_0/388605/G2934A
A
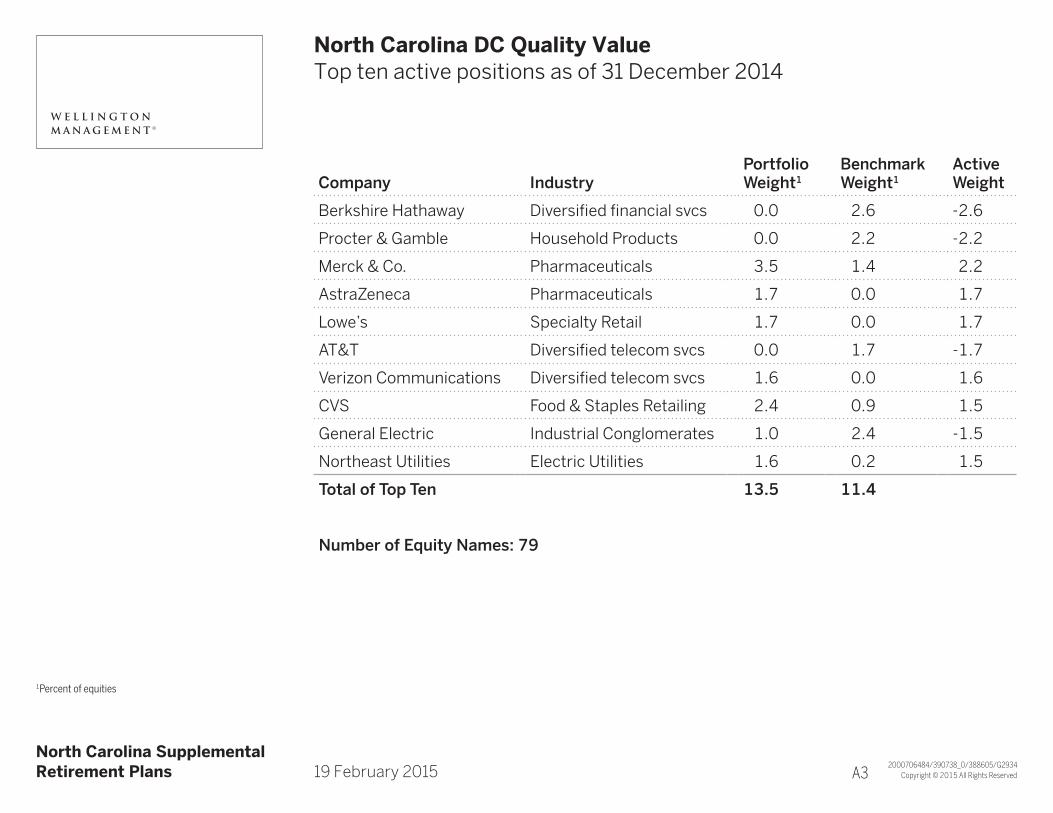
North Carolina DC Quality ValueTitle Line 2Top ten active positions as of 31 December 2014
Company IndustryPortfolio Weight1
Benchmark Weight1
Active Weight
Berkshire Hathaway Diversified financial svcs 0.0 2.6 -2.6
Procter & Gamble Household Products 0.0 2.2 -2.2
Merck & Co. Pharmaceuticals 3.5 1.4 2.2
AstraZeneca Pharmaceuticals 1.7 0.0 1.7
Lowe’s Specialty Retail 1.7 0.0 1.7
AT&T Diversified telecom svcs 0.0 1.7 -1.7
Verizon Communications Diversified telecom svcs 1.6 0.0 1.6
CVS Food & Staples Retailing 2.4 0.9 1.5
General Electric Industrial Conglomerates 1.0 2.4 -1.5
Northeast Utilities Electric Utilities 1.6 0.2 1.5
Total of Top Ten 13.5 11.4
Number of Equity Names: 79
A North Carolina SupplementalRetirement Plans A19 February 2015
1Percent of equities
A1 A3
Copyright © 2015 All Rights Reserved2000706487/388605_0/388605/G2934A
A
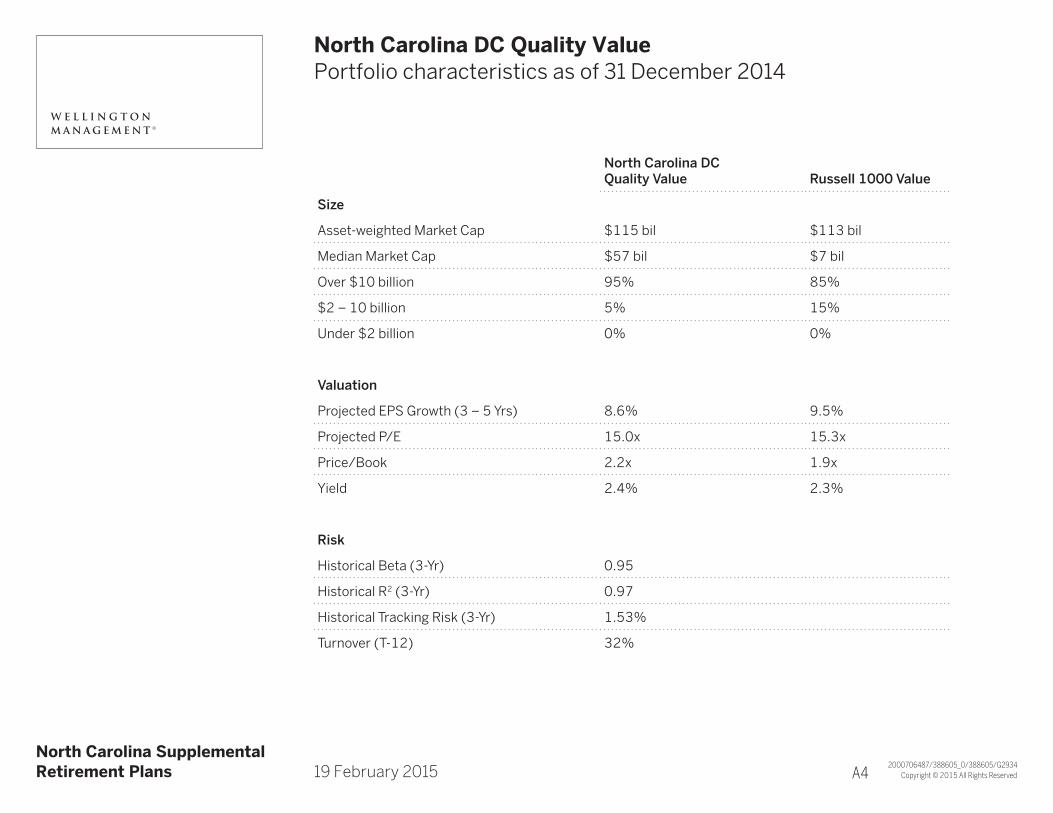
North Carolina DC Quality ValueTitle Line 2Portfolio characteristics as of 31 December 2014
North Carolina DCQuality Value Russell 1000 Value
Size
Asset-weighted Market Cap $115 bil $113 bil
Median Market Cap $57 bil $7 bil
Over $10 billion 95% 85%
$2 – 10 billion 5% 15%
Under $2 billion 0% 0%
Valuation
Projected EPS Growth (3 – 5 Yrs) 8.6% 9.5%
Projected P/E 15.0x 15.3x
Price/Book 2.2x 1.9x
Yield 2.4% 2.3%
Risk
Historical Beta (3-Yr) 0.95
Historical R2 (3-Yr) 0.97
Historical Tracking Risk (3-Yr) 1.53%
Turnover (T-12) 32%
A North Carolina SupplementalRetirement Plans A19 February 2015 A1 A4

4
Copyright © 2015 All Rights Reserved2000706924/388605_0/388605/G2746A
A
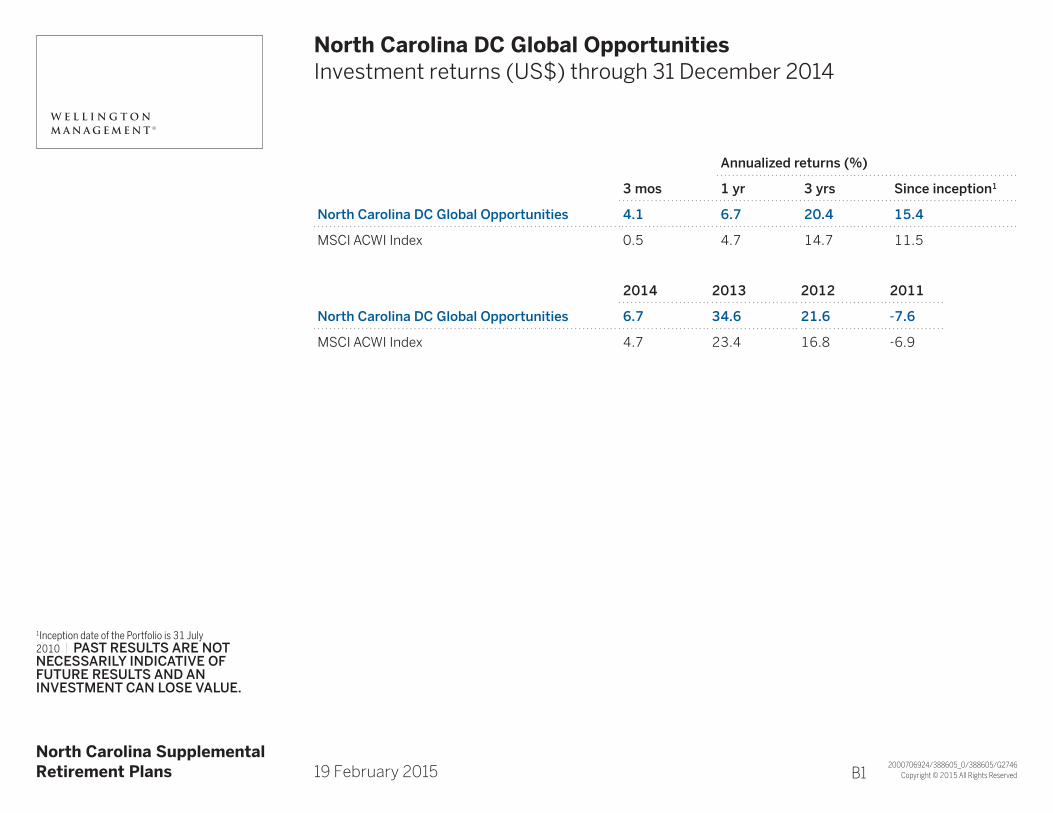
North Carolina DC Global OpportunitiesTitle Line 2Investment returns (US$) through 31 December 2014
Annualized returns (%)
3 mos 1 yr 3 yrs Since inception1
North Carolina DC Global Opportunities 4.1 6.7 20.4 15.4
MSCI ACWI Index 0.5 4.7 14.7 11.5
2014 2013 2012 2011
North Carolina DC Global Opportunities 6.7 34.6 21.6 -7.6
MSCI ACWI Index 4.7 23.4 16.8 -6.9
A North Carolina SupplementalRetirement Plans A19 February 2015
1Inception date of the Portfolio is 31 July 2010 | PAST RESULTS ARE NOT NECESSARILY INDICATIVE OF FUTURE RESULTS AND AN INVESTMENT CAN LOSE VALUE.
A1 B1
Copyright © 2015 All Rights Reserved2000706945/388605_0/388605/G2934A
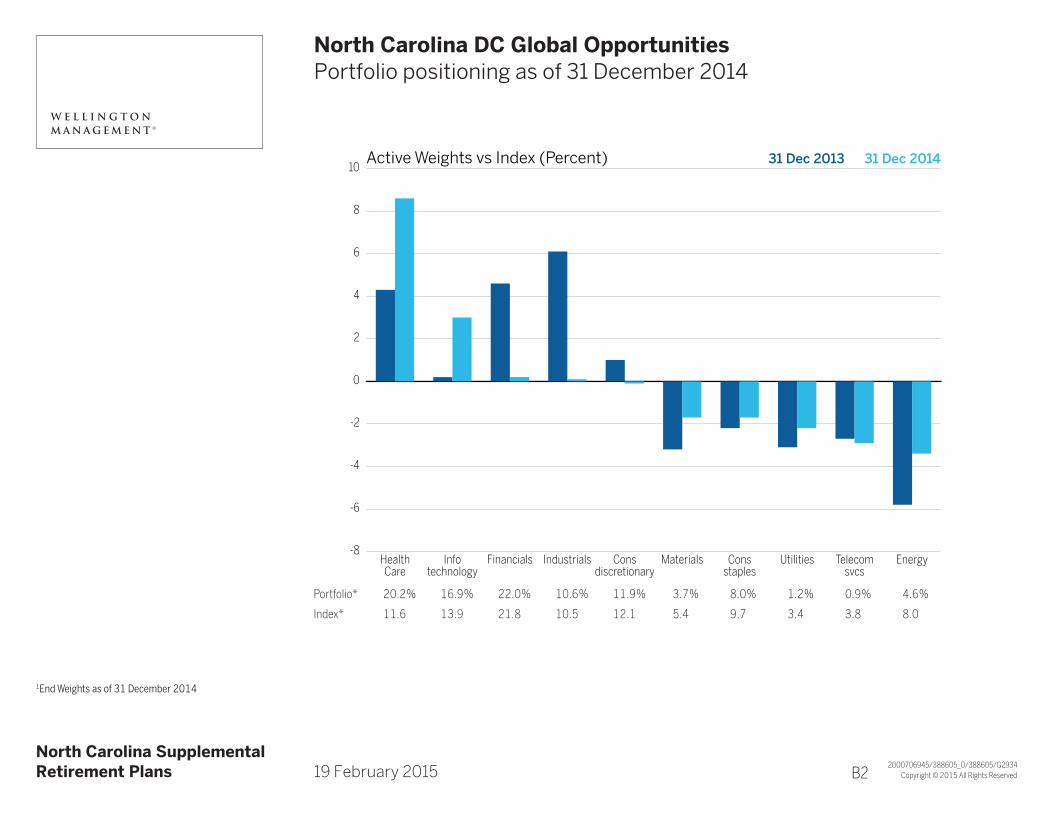
A
North Carolina DC Global OpportunitiesTitle Line 2Portfolio positioning as of 31 December 2014
A North Carolina SupplementalRetirement Plans A19 February 2015
1End Weights as of 31 December 2014
31 Dec 2013 31 Dec 201410
8
6
4
2
0
-2
-4
-6
-8
Active Weights vs Index (Percent)
HealthCare
Infotechnology
Financials Industrials Consdiscretionary
Materials Consstaples
Utilities Telecomsvcs
Energy
Portfolio* 20.2% 16.9% 22.0% 10.6% 11.9% 3.7% 8.0% 1.2% 0.9% 4.6%
Index* 11.6 13.9 21.8 10.5 12.1 5.4 9.7 3.4 3.8 8.0
A1 B2
Copyright © 2015 All Rights Reserved2000706622/390738_0/388605/G2746A
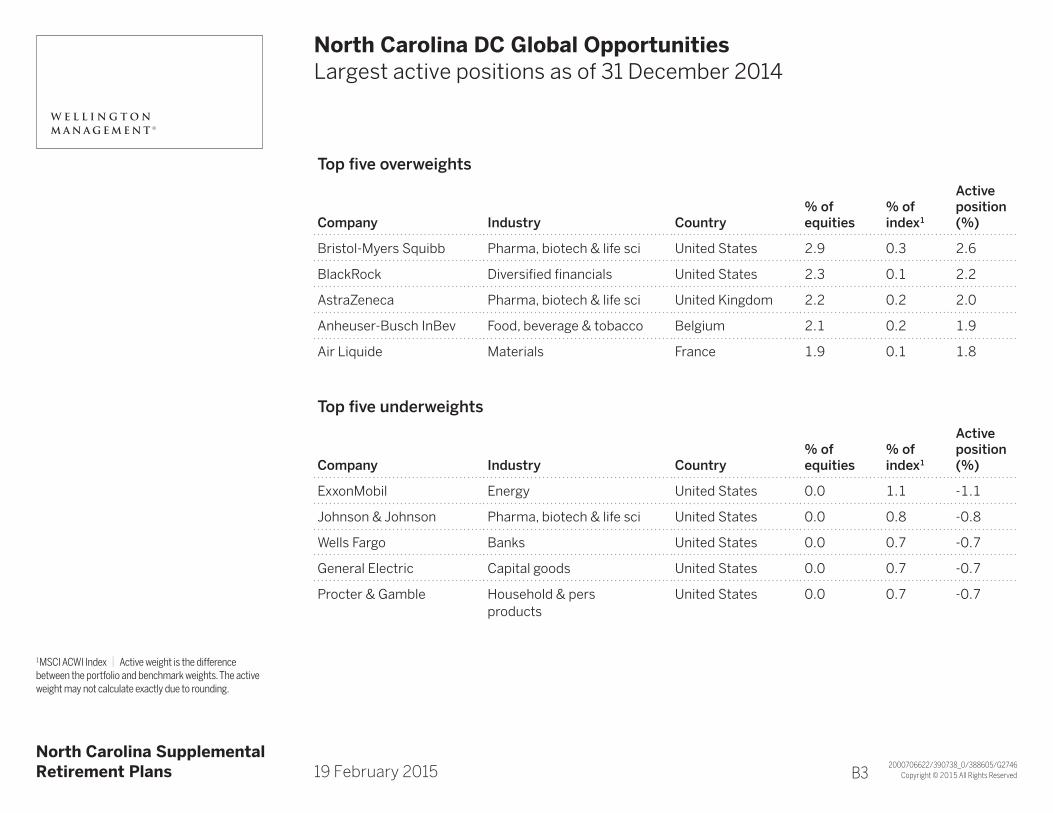
A
North Carolina DC Global OpportunitiesTitle Line 2Largest active positions as of 31 December 2014
Top five overweights
Company Industry Country% of equities
% of index1
Active position (%)
Bristol-Myers Squibb Pharma, biotech & life sci United States 2.9 0.3 2.6
BlackRock Diversified financials United States 2.3 0.1 2.2
AstraZeneca Pharma, biotech & life sci United Kingdom 2.2 0.2 2.0
Anheuser-Busch InBev Food, beverage & tobacco Belgium 2.1 0.2 1.9
Air Liquide Materials France 1.9 0.1 1.8
Top five underweights
Company Industry Country% of equities
% of index1
Active position (%)
ExxonMobil Energy United States 0.0 1.1 -1.1
Johnson & Johnson Pharma, biotech & life sci United States 0.0 0.8 -0.8
Wells Fargo Banks United States 0.0 0.7 -0.7
General Electric Capital goods United States 0.0 0.7 -0.7
Procter & Gamble Household & pers products
United States 0.0 0.7 -0.7
A North Carolina SupplementalRetirement Plans A19 February 2015
1MSCI ACWI Index | Active weight is the difference between the portfolio and benchmark weights. The active weight may not calculate exactly due to rounding.
A1 B3
Copyright © 2015 All Rights Reserved2000706620/390738_0/388605/G2746A
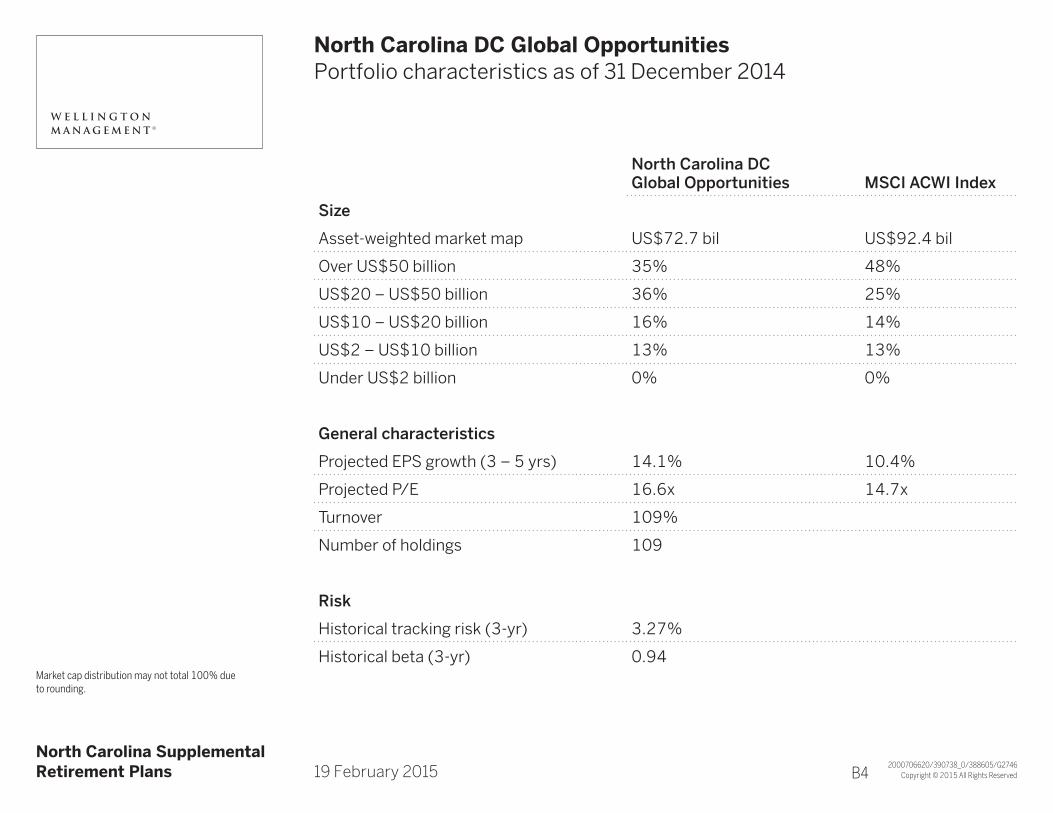
A
North Carolina DC Global OpportunitiesTitle Line 2Portfolio characteristics as of 31 December 2014
North Carolina DCGlobal Opportunities MSCI ACWI Index
Size
Asset-weighted market map US$72.7 bil US$92.4 bil
Over US$50 billion 35% 48%
US$20 – US$50 billion 36% 25%
US$10 – US$20 billion 16% 14%
US$2 – US$10 billion 13% 13%
Under US$2 billion 0% 0%
General characteristics
Projected EPS growth (3 – 5 yrs) 14.1% 10.4%
Projected P/E 16.6x 14.7x
Turnover 109%
Number of holdings 109
Risk
Historical tracking risk (3-yr) 3.27%
Historical beta (3-yr) 0.94
A North Carolina SupplementalRetirement Plans A19 February 2015
Market cap distribution may not total 100% due to rounding.
A1 B4
Copyright © 2014 All Rights Reserved
A North Carolina SupplementalRetirement Plans A19 February 2015
Opportunistic GrowthTitle Line 2Additional disclosures
FURTHER DISCLOSURES REGARDING THE USE AND INTERPRETATION OF STRESS TESTS
Hypothetical results are gross of commissions and other direct expenses, and (gross of) advisory fees, custody charges, withholding taxes, and other indirect expenses, and include reinvestment of dividends. If all expenses were reflected, the performance shown would be lower. Actual fees will vary depending on, among other things, the applicable fee schedule and account size. For example, if US$100,000 was invested and experienced a 10% annual return compounded monthly for ten years, its ending value, without giving effect to the deduction of advisory fees, would be US$270,704 with an annualized compounded return of 10.47%. If an advisory fee of 0.95% of average net assets per year were deducted monthly for the ten-year period, the annualized compounded return would be 9.43% and the ending dollar value would be US$246,355. Information regarding the firm’s advisory fees is available upon request. Composite returns have the potential to be adjusted until reviewed and finalized 30 days following each calendar quarter end period. For use in one-on-one presentations only. This supplemental information complements the GIPS® compliant presentation provided in the attachment.
Holdings are based on a representative account which was selected by the firm because it was deemed to best represent this investment approach. As the designated representative account may change over time, different accounts may be reflected for the time period shown. Each client account is individually managed; actual holdings will vary for each client and there is no guarantee that a particular client’s account will have the same characteristics as described above. Representative account information is supplemental to the GIPS® compliant presentation which is provided in the attachment. For use in one-on-one presentations only.
HYPOTHETICAL RESULTS ARE SUBJECT TO NUMEROUS LIMITATIONS AND IS NO GUARANTEE OF FUTURE RESULTS. ACTUAL PERFORMANCE WILL VARY, PERHAPS SIGNIFICANTLY. CERTAIN ASSUMPTIONS HAVE BEEN MADE FOR MODELING PURPOSES BY BARRA AND MAY NOT BE REPEATED.
Some additional limitations include: Historical factor returns are modeled by Barra and are based on numerous assumptions. Market environments and extreme events can be unique and may not re-occur.
2000694544/390738_0/385519/385519
FOR ExISTING CLIENTS ONLY
page 1
Copyright © 2014 All Rights Reserved2000347204/388605_0/G2932/G2932A
A
Opportunistic GrowthTitle Line 2Investment risks
A North Carolina SupplementalRetirement Plans A19 February 2015
Principal risksEquity market risks – Equity markets are subject to many factors, including economic conditions, government regulations, market sentiment, local and international political events, and environmental and technological issues.
Manager risk – Investment performance depends on the portfolio management team and the team’s investment strategies. If the investment strategies do not perform as expected, if opportunities to implement those strategies do not arise, or if the team does not implement its investment strategies successfully, an investment portfolio may underperform or suffer significant losses.
Additional risksForeign market risks (includes emerging markets) – Investments in foreign markets may present risks not typically associated with domestic markets. These risks may include changes in currency exchange rates; less-liquid markets and less available information; less government supervision of exchanges, brokers, and issuers; increased social, economic, and political uncertainty; and greater price volatility. These risks may be greater in emerging markets, which may also entail different risks from developed markets.
Issuer specific risk – A security issued by a particular issuer may be impacted by factors that are unique to that issuer and thus may cause that security’s return to differ from that of the market.
Risks of derivative instruments – Derivatives can be volatile and involve various degrees of risk. The value of derivative instruments may be affected by changes in overall market movements, the business or financial condition of specific companies, index volatility, changes in interest rates, or factors affecting a particular industry or region. Other relevant risks include the possible default of the counterparty to the transaction and the potential liquidity risk with respect to particular derivative instruments. Moreover, because many derivative instruments provide significantly more market exposure than the money paid or deposited when the transaction is entered into, a relatively small adverse market movement can not only result in the loss of the entire investment, but may also expose a portfolio to the possibility of a loss exceeding the original amount invested.
Risks of investment in other pools – Investors in a fund that has invested in another fund will be subject to the same risks, in direct proportion to the amount of assets the first fund has invested in the second, as direct investors in that second fund.
Smaller capitalization stock risk – The share prices of small and mid-cap companies may exhibit greater volatility than the share prices of larger capitalization companies. In addition, shares of small and mid-cap companies are often less liquid than larger capitalization companies.
Past results are not necessarily indicative of future resultsThere can be no assurance nor should it be assumed that future investment performance of any strategy will conform to any performance examples set forth in this material or that the portfolio’s underlying investments will be able to avoid losses. The investment results and any portfolio compositions set forth in this material are provided for illustrative purposes only and may not be indicative of the future investment results or future portfolio composition. The composition, size of, and risks associated with an investment in the strategy may differ substantially from the examples set forth in this material. An investment can lose value.
page 1
Copyright © 2014 All Rights Reserved2000347743/386286_0/G2934/G2934A
A
Quality ValueTitle Line 2Investment risks
A North Carolina SupplementalRetirement Plans A19 February 2015
Principal RisksEquity Market Risks – Equity markets are subject to many factors, including economic conditions, government regulations, market sentiment, local and international political events, and environmental and technological issues.
Manager Risk – Investment performance depends on the portfolio management team and the team’s investment strategies. If the investment strategies do not perform as expected, if opportunities to implement those strategies do not arise, or if the team does not implement its investment strategies successfully, an investment portfolio may underperform or suffer significant losses.
Additional RisksCurrency Risk – Investments in currencies, currency futures contracts, forward currency exchange contracts or similar instruments, as well as in securities that are denominated in foreign currency, are subject to the risk that the value of a particular currency will change in relation to one or more other currencies.
Foreign Market Risks (includes Emerging Markets) – Investments in foreign markets may present risks not typically associated with domestic markets. These risks may include changes in currency exchange rates; less-liquid markets and less available information; less government supervision of exchanges, brokers, and issuers; increased social, economic, and political uncertainty; and greater price volatility. These risks may be greater in emerging markets, which may also entail different risks from developed markets.
Issuer Specific Risk – A security issued by a particular issuer may be impacted by factors that are unique to that issuer and thus may cause that security’s return to differ from that of the market.
Risks of Derivative Instruments – Derivatives can be volatile and involve various degrees of risk. The value of derivative instruments may be affected by changes in overall market movements, the business or financial condition of specific companies, index volatility, changes in interest rates, or factors affecting a particular industry or region. Other relevant risks include the possible default of the counter-party to the transaction and the potential liquidity risk with respect to particular derivative instruments. Moreover, because many derivative instruments provide significantly more market exposure than the money paid or deposited when the transaction is entered into, a relatively small adverse market movement can not only result in the loss of the entire investment, but may also expose a portfolio to the possibility of a loss exceeding the original amount invested.
Risks of Investment in Other Pools – Investors in a fund that has invested in another fund will be subject to the same risks, in direct proportion to the amount of assets the first fund has invested in the second, as direct investors in that second fund.
Past results are not necessarily indicative of future resultsThere can be no assurance nor should it be assumed that future investment performance of any strategy will conform to any performance examples set forth in this material or that the portfolio’s underlying investments will be able to avoid losses. The investment results and any portfolio compositions set forth in this material are provided for illustrative purposes only and may not be indicative of the future investment results or future portfolio composition. The composition, size of, and risks associated with an investment in the strategy may differ substantially from the examples set forth in this material. An investment can lose value.
page 1
Copyright © 2014 All Rights Reserved2000583418/360177_0/G2746/G2746
A
A
Global OpportunitiesTitle Line 2Investment risks
A North Carolina SupplementalRetirement Plans A19 February 2015
Principal RisksCurrency Risk – Investments in currencies, currency futures contracts, forward currency exchange contracts or similar instruments, as well as in securities that are denominated in foreign currency, are subject to the risk that the value of a particular currency will change in relation to one or more other currencies.
Equity Market Risks – Equity markets are subject to many factors, including economic conditions, government regulations, market sentiment, local and international political events, and environmental and technological issues.
Foreign Market Risks (includes Emerging Markets) – Investments in foreign markets may present risks not typically associated with domestic markets. These risks may include changes in currency exchange rates; less-liquid markets and less available information; less government supervision of exchanges, brokers, and issuers; increased social, economic, and political uncertainty; and greater price volatility. These risks may be greater in emerging markets, which may also entail different risks from developed markets.
Issuer Specific Risk – A security issued by a particular issuer may be impacted by factors that are unique to that issuer and thus may cause that security’s return to differ from that of the market.
Manager Risk – Investment performance depends on the portfolio management team and the team’s investment strategies. If the investment strategies do not perform as expected, if opportunities to implement those strategies do not arise, or if the team does not implement its investment strategies successfully, an investment portfolio may underperform or suffer significant losses.
Additional RisksLiquidity Risk – Investments with low liquidity can have significant changes in market value, and there is no guarantee that these securities could be sold at fair value.
Real Estate Securities Risk – Risks associated with investing in the securities of companies principally engaged in the real estate industry such as Real Estate Investment Trust (“REIT”) securities include: the cyclical nature of real estate values; risk related to general and local economic conditions; overbuilding and increased competition; demographic trends; and increases in interest rates and other real estate capital market influences.
Risks of Derivative Instruments – Derivatives can be volatile and involve various degrees of risk. The value of derivative instruments may be affected by changes in overall market movements, the business or financial condition of specific companies, index volatility, changes in interest rates, or factors affecting a particular industry or region. Other relevant risks include the possible default of the counterparty to the transaction and the potential liquidity risk with respect to particular derivative instruments. Moreover, because many derivative instruments provide significantly more market exposure than the money paid or deposited when the transaction is entered into, a relatively small adverse market movement can not only result in the loss of the entire investment, but may also expose a portfolio to the possibility of a loss exceeding the original amount invested.
Risks of Investment in Other Pools – Investors in a fund that has invested in another fund will be subject to the same risks, in direct proportion to the amount of assets the first fund has invested in the second, as direct investors in that second fund.
Smaller Capitalization Stock Risk – The share prices of small and mid-cap companies may exhibit greater volatility than the share prices of larger capitalization companies. In addition, shares of small and mid-cap companies are often less liquid than larger capitalization companies.
Past results are not necessarily indicative of future resultsThere can be no assurance nor should it be assumed that future investment performance of any strategy will conform to any performance examples set forth in this material or that the portfolio’s underlying investments will be able to avoid losses. The investment results and any portfolio compositions set forth in this material are provided for illustrative purposes only and may not be indicative of the future investment results or future portfolio composition. The composition, size of, and risks associated with an investment in the strategy may differ substantially from the examples set forth in this material. An investment can lose value.
page 1
Copyright © 2014 All Rights Reserved2000000298/390738_0/G1422/G1422
A North Carolina SupplementalRetirement Plans A19 February 2015
Important NoticeTitle Line 2
©2015 Wellington Management. All rights reserved. | As of January 2015
Wellington Management Company llp (WMC) is an independently owned investment adviser registered with the US Securities and Exchange Commission (SEC). WMC is also a commodity trading advisor (CTA) registered with the US Commodity Futures Trading Commission. In certain circumstances, WMC provides commodity trading advice to clients in reliance on exemptions from CTA registration. WMC, along with its affiliates (collectively, Wellington Management), provides investment management and investment advisory services to institutions around the world. Located in Boston, Massachusetts, Wellington Management also has offices in Chicago, Illinois; Radnor, Pennsylvania; San Francisco, California; Beijing; Frankfurt; Hong Kong; London; Singapore; Sydney; Tokyo; and Zurich. This material is prepared for, and authorized for internal use by, designated institutional and professional investors and their consultants or for such other use as may be authorized by Wellington Management. This material and/or its contents are current at the time of writing and may not be reproduced or distributed in whole or in part, for any purpose, without the express written consent of Wellington Management. This material is not intended to constitute investment advice or an offer to sell, or the solicitation of an offer to purchase shares or other securities. Investors should always obtain and read an up-to-date investment services description or prospectus before deciding whether to appoint an investment manager or to invest in a fund. Any views expressed herein are those of the author(s), are based on available information, and are subject to change without notice. Individual portfolio management teams may hold different views and may make different investment decisions for different clients.
In Canada, this material is provided by Wellington Management Canada llc, a US SEC-registered investment adviser also registered in the provinces of Alberta, British Columbia, Manitoba, New Brunswick, Newfoundland and Labrador, Nova Scotia, Ontario, Quebec, and Saskatchewan in the categories of Portfolio Manager and Exempt Market Dealer. In the UK, this material is provided by Wellington Management International Limited (WMIL), a firm authorized and regulated by the Financial Conduct Authority (FCA). This material is directed only at persons (Relevant Persons) who are classified as eligible counterparties or professional clients under the rules of the FCA. This material must not be acted on or relied on by persons who are not Relevant Persons. Any investment or investment service to which this material relates is available only to Relevant Persons and will be engaged in only with Relevant Persons. In Germany, this material is provided by Wellington Management International Limited, Niederlassung Deutschland, the German branch of WMIL, which is authorized and regulated by the FCA and in respect of certain aspects of its activities by the Bundesanstalt für Finanzdienstleistungsaufsicht (BaFin). This material is directed only at persons (Relevant Persons) who are classified as eligible counterparties or professional clients under the German Securities Trading Act. This material does not constitute investment advice, a solicitation to invest in financial instruments or financial analysis within the meaning of Section 34b of the German Securities Trading Act. It does not meet all legal requirements designed to guarantee the independence of financial analyses and is not subject to any prohibition on dealing ahead of the publication of financial analyses. This material does not constitute a prospectus for the purposes of the German Capital Investment Code, the German Securities Sales Prospectus Act or the German Securities Prospectus Act. In Hong Kong, this material is provided to you by Wellington Management Hong Kong Limited (WM Hong Kong), a corporation licensed by the Securities and Futures Commission to conduct Type 1 (dealing in securities), Type 2 (dealing in futures contracts), Type 4 (advising on securities), and Type 9 (asset management) regulated activities, on the basis that you are a Professional Investor as defined in the Securities and Futures Ordinance. By accepting this material you acknowledge and agree that this material is provided for your use only and that you will not distribute or otherwise make this material available to any person. In Singapore, this material is provided for your use only by Wellington Management Singapore Pte Ltd (WM Singapore) (Registration Number 201415544E). WM Singapore is regulated by the Monetary Authority of Singapore under a Capital Markets Services Licence to conduct fund management activities and is an exempt financial adviser. By accepting this material you represent that you are a non-retail investor and that you will not copy, distribute or otherwise make this material available to any person. In Australia, Wellington Management Australia Pty Ltd (WM Australia) (ABN19 167 091 090) has authorized the issue of this material for use solely by wholesale clients (as defined in the Corporations Act 2001). By accepting this material, you acknowledge and agree that this material is provided for your use only and that you will not distribute or otherwise make this material available to any person. Wellington Management Company llp is exempt from the requirement to hold an Australian financial services licence (AFSL) under the Corporations Act 2001 in respect of financial services, in reliance on class order 03/1100, a copy of which may be obtained at the web site of the Australian Securities and Investments Commission, http://www.asic.gov.au. The class order exempts a registered investment adviser regulated by the SEC, among others, from the need to hold an AFSL for financial services provided to Australian wholesale clients on certain conditions. Financial services provided by Wellington Management Company llp are regulated by the SEC under the laws and regulatory requirements of the United States, which are different from the laws applying in Australia. In Japan, Wellington Management Japan Pte Ltd (WM Japan) (Registration Number 199504987R) has been registered as a Financial Instruments Firm with registered number: Director General of Kanto Local Finance Bureau (Kin-Sho) Number 428. WM Japan is a member of the Japan Investment Advisers Association (JIAA) and the Investment Trusts Association, Japan (ITA). WMIL, WM Hong Kong, WM Japan, and WM Singapore are also registered as investment advisers with the SEC; however, they will comply with the substantive provisions of the US Investment Advisers Act only with respect to their US clients.
A1