third quarter 2019 fixed-income outlook · 2 fixed-income outlook third uarter 2019 anne b. walsh,...
TRANSCRIPT

Third Quarter 2019
Fixed-Income Outlook Looking Past the Liquidity-Driven Rally

Federal Reserve (Fed) Chairman Jerome Powell’s message was loud and clear this quarter: Sustaining the expansion is of utmost importance. Unsurprisingly, the Fed’s “pivot” to accommodation pushed stocks to new highs, drove yields and spreads lower, and supported prices for real estate, commodities, and cryptocurrencies.
On July 31, the Federal Open Market Committee (FOMC) followed through on Powell’s commitment with a 25 basis-point cut to the federal funds target rate. Painted as just a mid-cycle policy adjustment, the market perceived the cut to be hawkish. Less than 24 hours later the preemptive ease, which was intended to immunize the U.S. economy against weak global growth, was put to the test with the announcement of 10 percent tariffs on Chinese goods beginning Sept. 1. This pushed the S&P 500 lower and credit spreads wider, an early sign that the rate cut failed its objective.
Given the market’s vulnerability to such exogenous factors, to keep the expansion going the Fed has boxed itself in to deliver more rate cuts this year. This may drive a rally in risk assets based on the market’s perception that liquidity will be plentiful during this period of Fed easing. Plentiful liquidity means that sellers have confidence they will always find buyers at reasonable and relatively predictable prices. The Indian Summer for risk assets that I have been writing about continues as complacency around liquidity fuels speculative behavior.
Long-term investors need to listen for the rhyme of history. When the Fed similarly pivoted from tightening to easing in 1998 in response to the Asian financial crisis, the easy money inflated risk assets, most notably tech stocks. The tech boom drove the U.S. economy into overdrive, putting the Fed back in hiking mode less than a year later. The bubble burst: The Nasdaq collapsed about 80 percent peak to trough, and high-yield credit spreads widened by over 600 basis points as the tech bubble burst.
While our intermediate-term outlook is that the Fed will succeed in reflating the economy, and rates on the 10-year Treasury will move towards 2.5 percent, ultimately when the next recession arrives the implications are ominous. Clients and readers know that we are prudent risk managers. We will take investing risks when we believe we are being adequately compensated for them, but now is not one of those times. We dialed up our appetite for risk in 2008 and 2009, when the financial crisis hammered prices for risk assets, and in 2016, when the credit market’s over-reaction to the oil market collapse offered up tremendous value.
From the Desk of the Global CIO
Looking Past the Liquidity-Driven Rally

Scott MinerdChairman of Investments and Global Chief Investment Officer
Contents
From the Desk of the Global CIO ........... 1 Looking Past the Liquidity-Driven Rally
Portfolio Management Outlook ...........2 Avoiding the Fate of '98
Macroeconomic Outlook .................... 4 Fed Cuts Rates as Downside Risks Build
Portfolio Strategies and Allocations ..... 6
Sector-Specific Outlooks
Investment-Grade Corporate Bonds ......8 Limited Upside
High-Yield Corporate Bonds ................. 10 The Rally That Lacks Conviction
Bank Loans ............................................12 Favorable Technicals Lift Prices
Asset-Backed Securities (ABS) and Collateralized Loan Obligations (CLOs) .. 14 Aircraft ABS Is Flying Off the Shelves
Non-Agency Residential Mortgage-Backed Securities (RMBS) ... 16 Credit Tailwinds Remain in Place
Commercial Mortgage-Backed Securities (CMBS) ................................. 18 CRE-CLO Evolution
Commercial Real Estate Debt (CRE) ..... 20 The Rising Cost of Housing
Municipal Bonds ...................................22 Unwavering Demand
Agency Mortgage-Backed Securities (MBS) ...................................................24 Prepayment Risks Rise as Mortgage Rates Drop
Rates ....................................................26 When Doves Cry
Now we are dialing it down. As the Fed begins its easing campaign to try to extend an already long-in-the-tooth expansion, credit spreads are already tight across the fixed-income spectrum. Credit spreads could get tighter in this liquidity-driven rally, but history has shown that the potential for widening from here is much greater.
This time around the bubble is not in tech stocks or even equities more broadly. While commercial real estate may be somewhat overpriced, residential real estate remains reasonably priced relative to incomes and mortgage rates.
So where is the bubble today? I hate to admit the ugly truth, but it may well be in bonds, and in particular the sovereign debt of governments around the world. The category of supposed “risk-free” assets has risen to prices which guarantee a loss to investors in many countries around the world. Like all bubbles, the end is not easily discerned and will often reach extremes as investors choose ludicrous prices in the hope that tomorrow’s price will be more ludicrous.
I doubt the end is near. To quote Winston Churchill, “This is not the end, it is not even the beginning of the end. But it is perhaps the end of the beginning.” The curse of negative rates will be with us for a while, and eventually may reach the shores of the United States.
1Fixed-Income Outlook | Third Quarter 2019

2 Fixed-Income Outlook | Third Quarter 2019
Anne B. Walsh, JD, CFAChief Investment Officer, Fixed Income
Portfolio Management Outlook
Avoiding the Fate of '98
We do not think the rally in risk assets is sustainable.
There are key historical lessons that investors must bear in mind with regards to an overheating economy. The first is that these are periods when bubbles form. Our Global CIO draws parallels to the experience in 1998, when the Fed cut interest rates by 75 basis points and prolonged the expansion. The period that followed saw technology stocks inflate and disconnect from fundamentals. It ultimately ended in a dramatic decline in tech stocks that spilled over into the broader equity and credit markets.
The second lesson about overheating economies is from John Maynard Keynes, who reminded us that the market can remain irrational longer than you can stay solvent. Fed easing this year could bring about the same fate to risk assets as in the late 1990s. When the Fed eased in 1998, investment-grade corporate bonds tightened by 40 basis points over a brief six-month rally, though spreads never revisited the 1997 tights of 51 basis points. To this day, the 1997 tights remain the tightest level for the index on record. Today, the Bloomberg Barclays Corporate Bond index sits at a spread of 108 basis points, tighter than when the Fed eased in 1998, despite being of lower average credit quality. The Fed’s pivot could bring about new record tights for corporates. But this rally would be doomed to end painfully, similar to 1998, when spreads entered a multi-year widening trend six months after the Fed eased. Further, history shows that spreads tend to widen when the Fed is easing, not tighten.
The rally in credit is not being supported by fundamentals, and we cannot ignore the overwhelming technical variable which results in negative-yielding sovereign debt overseas. As our investment-grade sector team highlights on page 8, there is now over $1 trillion in negative-yielding corporate debt globally, which is attracting non-U.S. investors to positive-yielding U.S. corporates. Just as credit spreads widened in Europe before the last round of quantitative easing (QE), so, too, credit spreads in the U.S. will likely widen before the Fed moves to restart QE, which ultimately may prove to be the impetus that pushes U.S. rates below zero.
The likelihood is that we are only seeing the beginning of negative-yielding global corporate debt. In the Bloomberg Barclays Euro Aggregate Corporate Index, AAA and AA bonds are yielding -0.09 percent and -0.21 percent, respectively, but are trading at average spreads of 66 and 65 basis points, which is only in the middle of their historical trading range. As sovereign yields plummet further into negative territory, the added room for spread compression combined with a possible renewal of the European Central Bank’s corporate bond purchase program means that corporates could also sink deeper into negative yields. If Treasury rates ultimately fall below zero in the next recession, the probability is high that spreads on U.S. corporate debt will submerge to new historic lows while yields on select issues may well probe negative territory.
Steve Brown, CFAPortfolio Manager
Adam BlochPortfolio Manager

3Fixed-Income Outlook | Third Quarter 2019
Source: Guggenheim Investments, Credit Suisse, Bloomberg, Citi. Data as of 7.25.2019. Representative indexes: BB loans: Credit Suisse Leveraged Loan Index (BB subset); BB Corps: Bloomberg Barclays High-Yield Corporate Bond Index (BB subset); AA, A and BBB Corporate Bonds: Bloomberg Barclays Corporate Bond index (AA, A, and BBB subsets); Agency RMBS and Agency CMBS: Bloomberg Barclays U.S. Aggregate Index (RMBS and CMBS subsets); CLOs: JPM CLOIE Index (AAA, AA, and A subsets); CMBS 2.0 AA: Bloomberg Barclays CMBS 2.0 Index (AA subset), legacy floating non-Agency RMBS, BBB-rated Whole Business and A-rated Fixed-Rate Aircraft ABS: Based on the Guggenheim’s sector desk indicative levels.
Structured Credit Has Offered Better Relative Value by Ratings Category Yield and spread duration are two metrics that help assess relative value. Spread duration is the percent change in prices for a 100 basis-point move in spreads. If BBB corporate bond spreads widen by 100 basis points, for example, BBB corporates lose between 7–8 percent in market price, while BBB-rated whole business ABS offers comparable yield and lower spread durations. Thus for the same spread widening, you lose less in price.
AAA CLO
BB CorporatesBB Loans
Legacy Floating NA RMBS
Investment-Grade CreditGovernment High-Yield Credit
Spread Duration
AgencyRMBS Agency CMBS
(8.5Yr+)Agency CMBS(3.5-6yr)
AA Corporates
A Corporates
BBB Corporates
CMBS 2.0 AA
AA CLO
A CLO
BloombergBarclays Agg
A-Rated Fixed-Rate Aircraft ABS
BBB-Rated Whole Business ABS
2.0%
2.5%
3.0%
3.5%
4.0%
4.5%
5.0%
2 3 4 5 6 7 8 9
Yiel
d
As a result, our portfolios continue to prioritize capital preservation with a preference for asset categories that we believe are credit-loss remote. In Core-Plus, this includes government guaranteed securities, senior CLOs and non-Agency RMBS. The fundamentals in non-Agency RMBS are underpinned by a more prudent, de-levered mortgage borrower and attractive LTVs, both of which support long term credit performance. We continue to have a low weighting in investment-grade corporate bonds versus the benchmark, particularly further out the curve, which is consistent with our capital preservation strategy.
Our decision outlined in the last Fixed-Income Outlook to move some duration from the long end to the front end has been beneficial as the curve has steepened. Treasury securities may be overbought in the near term, however, as the July FOMC meeting showed that the Fed is not planning to cut rates as much as the market is pricing in. Thus there may be more opportune times to lengthen duration.
Regardless of the near-term direction of interest rates, we expect the curve to steepen. The two-year/10-year Treasury swap curve, currently at about 3 basis points, is flat on a historical basis. If the Fed eases significantly more than the market is pricing in, the 2s/10s curve would steepen as the front-end rallies more than the long-end. If economic data are strong and the Fed doesn’t deliver the expected rate cuts, the curve would steepen as long-end rates rise more than short-end rates. Both the Core-Plus and Multi-Credit strategies are positioned to potentially benefit from a steepening of the yield curve.

4 Fixed-Income Outlook | Third Quarter 2019
Macroeconomic Outlook
Fed Cuts Rates as Downside Risks Build
The U.S. economy is strong, but soft inflation and downside risks to growth prompted the first Fed rate cut since 2008.
U.S. economic growth slowed to 2.1 percent annualized in the second quarter from 3.1 percent in the first quarter. Personal consumption expenditures (PCE) rebounded sharply, as expected, while government spending contributed an outsized 0.9 percentage point to growth, the most since mid-2009. However, negative contributions were seen from housing, business capital expenditure, inventory investment, and net exports. Looking ahead, we expect the economy to grow at a 1.5–2.0 percent pace in the third quarter.
The second-quarter gross domestic product (GDP) release also featured annual revisions to the five prior years of data, which showed that growth peaked in year-over-year terms in the second quarter of 2018, earlier than previously thought (see chart, top right). An upwardly revised personal saving rate gives consumption room to run, but downwardly revised and shrinking corporate profits will continue to pressure investment spending and could begin to weigh more heavily on hiring.
With growth in the first half of the year coming in somewhat above potential, the labor market continued to strengthen, albeit at a slower pace than the year before. Net monthly payroll gains averaged 141,000 in the six months through July, down from 236,000 during the same period in 2018. This was enough to push the unemployment rate down by 0.2 percentage point to 3.7 percent. While the labor market remains strong, we believe the sharp slowdown in aggregate hours worked— a component of our U.S. Recession Dashboard—foreshadows a deterioration in labor market conditions in 2020.
After a weak start to the year, core inflation picked up in the second quarter but remained below the Fed’s 2 percent target at 1.8 percent annualized. We expect inflation to firm a bit further in the second half of 2019.
Although the U.S. economy is in good shape overall, on July 31 the Fed announced its first rate cut since 2008 amid growing downside risks to policymakers’ baseline growth and inflation forecasts (see chart, bottom right). Key among these are slowing global growth, the threat of additional U.S.-China tariffs, and a possible hard Brexit, the odds of which have increased with the ascendance of Boris Johnson as prime minister of the United Kingdom. While a possible U.S. fiscal contraction in 2020 was averted by the recently signed budget deal, we expect two more Fed rate cuts in 2019 as Chair Jay Powell seeks to sustain the expansion. In our view, this could serve to embolden the White House to impose new tariffs on China and Europe later this year, which would in turn further cloud the outlook for global growth.
Maria Giraldo, CFAManaging Director
Brian SmedleyHead of Macroeconomic and Investment Research
Matt Bush, CFA, CBEDirector

5Fixed-Income Outlook | Third Quarter 2019
The second-quarter GDP release featured annual revisions to the five prior years of data, which showed that growth peaked in year-over-year terms in the second quarter of 2018, earlier than previously thought.
Source: Guggenheim Investments, Haver Analytics. Data as of 6.30.2019.
Latest GDP Data Shows Growth Peaked Earlier Than ThoughtReal GDP, YoY% Change
Although the U.S. economy is in good shape overall, on July 31 the Fed announced its first rate cut since 2008 amid growing downside risks to policymakers’ baseline growth and inflation forecasts.
Source: Guggenheim Investments, Federal Reserve. Data as of 6.19.2019.
Mounting Downside Risks Drive the Fed into Easing ModeNet Upside/Down Risk to SEP Projections: % of FOMC Participants
Pre-RevisionLatest Release
0.5%
1.0%
1.5%
2.0%
2.5%
3.0%
3.5%
4.0%
4.5%
2011 2012 2013 2014 2015 2016 2017 2018 2019
Core PCE Real GDP
-100%
-80%
-60%
-40%
-20%
0%
20%
40%
2010 2012 2013 2014 2015 2016 2017 2018 20192011
6 Fixed-Income Outlook | Third Quarter 2019
Portfolio Strategies and Allocations Guggenheim Fixed-Income Strategies
Guggenheim Core Fixed Income2
35%43%
22%
Bloomberg Barclays U.S. Aggregate Index1
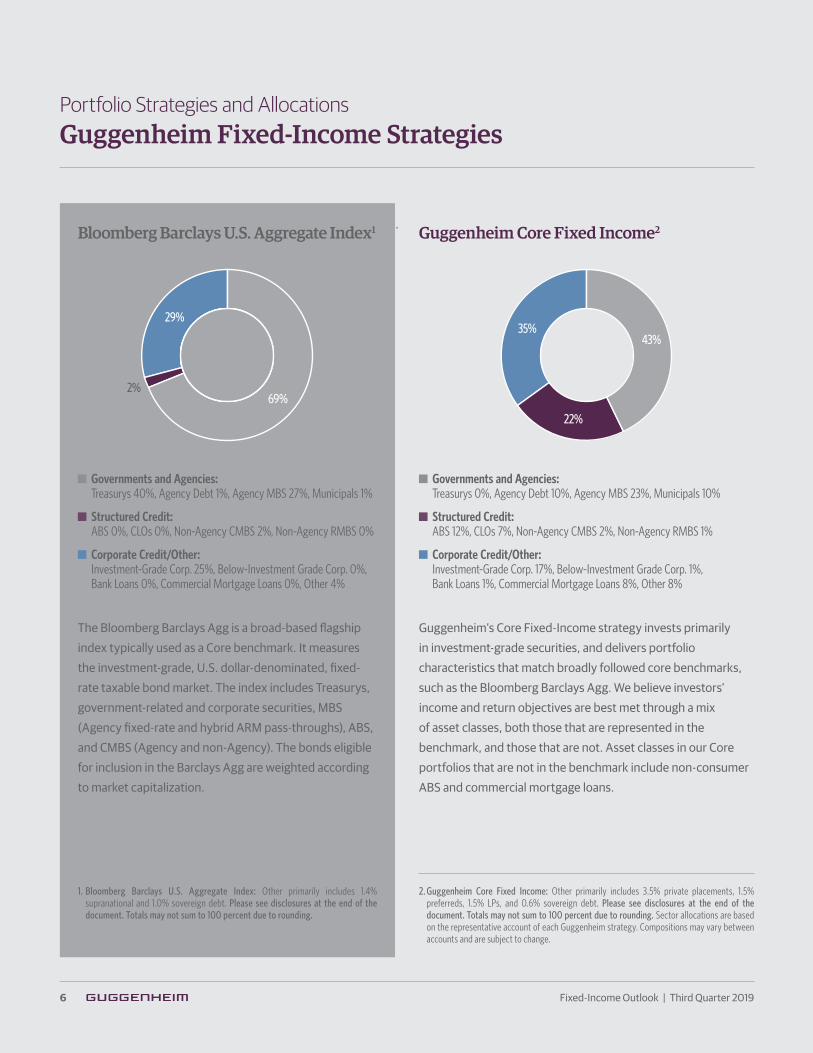
Guggenheim’s Core Fixed-Income strategy invests primarily in investment-grade securities, and delivers portfolio characteristics that match broadly followed core benchmarks, such as the Bloomberg Barclays Agg. We believe investors’ income and return objectives are best met through a mix of asset classes, both those that are represented in the benchmark, and those that are not. Asset classes in our Core portfolios that are not in the benchmark include non-consumer ABS and commercial mortgage loans.
The Bloomberg Barclays Agg is a broad-based flagship index typically used as a Core benchmark. It measures the investment-grade, U.S. dollar-denominated, fixed-rate taxable bond market. The index includes Treasurys, government-related and corporate securities, MBS (Agency fixed-rate and hybrid ARM pass-throughs), ABS, and CMBS (Agency and non-Agency). The bonds eligible for inclusion in the Barclays Agg are weighted according to market capitalization.
Governments and Agencies: Treasurys 0%, Agency Debt 10%, Agency MBS 23%, Municipals 10%
Structured Credit: ABS 12%, CLOs 7%, Non-Agency CMBS 2%, Non-Agency RMBS 1%
Corporate Credit/Other: Investment-Grade Corp. 17%, Below-Investment Grade Corp. 1%, Bank Loans 1%, Commercial Mortgage Loans 8%, Other 8%
Governments and Agencies: Treasurys 40%, Agency Debt 1%, Agency MBS 27%, Municipals 1%
Structured Credit: ABS 0%, CLOs 0%, Non-Agency CMBS 2%, Non-Agency RMBS 0%
Corporate Credit/Other: Investment-Grade Corp. 25%, Below-Investment Grade Corp. 0%, Bank Loans 0%, Commercial Mortgage Loans 0%, Other 4%
1. Bloomberg Barclays U.S. Aggregate Index: Other primarily includes 1.4% supranational and 1.0% sovereign debt. Please see disclosures at the end of the document. Totals may not sum to 100 percent due to rounding.
2. Guggenheim Core Fixed Income: Other primarily includes 3.5% private placements, 1.5% preferreds, 1.5% LPs, and 0.6% sovereign debt. Please see disclosures at the end of the document. Totals may not sum to 100 percent due to rounding. Sector allocations are based on the representative account of each Guggenheim strategy. Compositions may vary between accounts and are subject to change.
69%
29%
2%
7Fixed-Income Outlook | Third Quarter 2019
Guggenheim Core Plus Fixed Income3
50%
28%
22%
Guggenheim Multi-Credit Fixed Income4
48%
48%
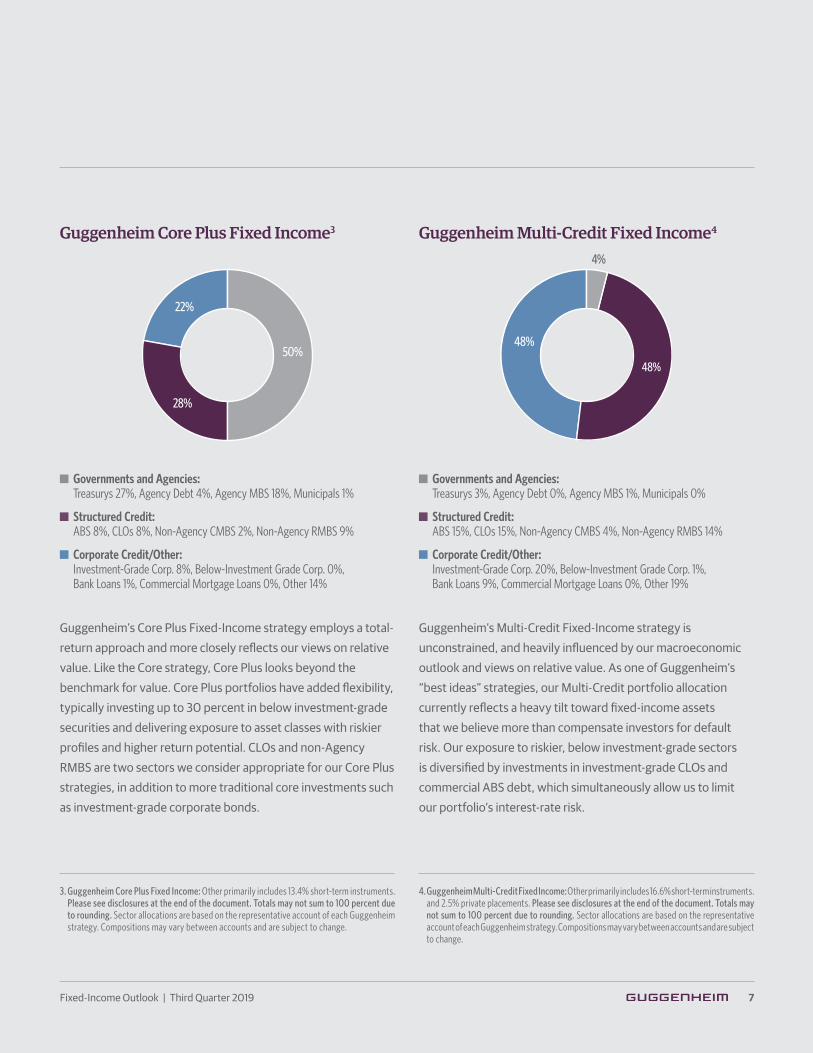
Guggenheim’s Core Plus Fixed-Income strategy employs a total-return approach and more closely reflects our views on relative value. Like the Core strategy, Core Plus looks beyond the benchmark for value. Core Plus portfolios have added flexibility, typically investing up to 30 percent in below investment-grade securities and delivering exposure to asset classes with riskier profiles and higher return potential. CLOs and non-Agency RMBS are two sectors we consider appropriate for our Core Plus strategies, in addition to more traditional core investments such as investment-grade corporate bonds.
Guggenheim’s Multi-Credit Fixed-Income strategy is unconstrained, and heavily influenced by our macroeconomic outlook and views on relative value. As one of Guggenheim’s “best ideas” strategies, our Multi-Credit portfolio allocation currently reflects a heavy tilt toward fixed-income assets that we believe more than compensate investors for default risk. Our exposure to riskier, below investment-grade sectors is diversified by investments in investment-grade CLOs and commercial ABS debt, which simultaneously allow us to limit our portfolio’s interest-rate risk.
Governments and Agencies: Treasurys 27%, Agency Debt 4%, Agency MBS 18%, Municipals 1%
Structured Credit: ABS 8%, CLOs 8%, Non-Agency CMBS 2%, Non-Agency RMBS 9%
Corporate Credit/Other: Investment-Grade Corp. 8%, Below-Investment Grade Corp. 0%, Bank Loans 1%, Commercial Mortgage Loans 0%, Other 14%
Governments and Agencies: Treasurys 3%, Agency Debt 0%, Agency MBS 1%, Municipals 0%
Structured Credit: ABS 15%, CLOs 15%, Non-Agency CMBS 4%, Non-Agency RMBS 14%
Corporate Credit/Other: Investment-Grade Corp. 20%, Below-Investment Grade Corp. 1%, Bank Loans 9%, Commercial Mortgage Loans 0%, Other 19%
3. Guggenheim Core Plus Fixed Income: Other primarily includes 13.4% short-term instruments. Please see disclosures at the end of the document. Totals may not sum to 100 percent due to rounding. Sector allocations are based on the representative account of each Guggenheim strategy. Compositions may vary between accounts and are subject to change.
4. Guggenheim Multi-Credit Fixed Income: Other primarily includes 16.6% short-term instruments. and 2.5% private placements. Please see disclosures at the end of the document. Totals may not sum to 100 percent due to rounding. Sector allocations are based on the representative account of each Guggenheim strategy. Compositions may vary between accounts and are subject to change.
4%

Portfolio allocation as of 6.30.2019
8 Fixed-Income Outlook | Third Quarter 2019
17%
20%
8%
25%
GuggenheimCore
GuggenheimCore Plus
GuggenheimMulti-Credit
Bloomberg BarclaysU.S. Aggregate
Jeffrey Carefoot, CFASenior Managing Director
Justin TakataManaging Director
Investment-Grade Corporate Bonds
Limited Upside
Positive performance could be tempered by any number of disruptive events in the third quarter.
Investment-grade corporate spreads experienced another strong quarter of
performance despite heightened trade war fears and increased geopolitical
tensions. The technical backdrop of low supply and continued inflows, coupled
with accommodative shifts in global monetary policy, remain the drivers of the
strong corporate bond market.
The underlying technical environment remains robust. Gross and net issuance
continue to slide into negative territory with gross issuance down 8.6 percent
and net issuance down 29.6 percent year to date. Healthy investment-grade fund
inflows to the tune of $70 billion over the last six months (see chart, top right)
resulted in steady net buying of credit. Furthermore, with a record $15 trillion in
global debt yielding below zero, and over $1 trillion of negative-yielding corporate
debt (see chart, bottom right), positive-yielding U.S. dollar-denominated credit
should remain attractive to domestic and foreign investors alike. Additionally, the
European Central Bank continues to make overtures of monetary easing, which
may include restarting its corporate bond purchasing program.
The Fed’s pivot from rate hikes to rate cuts created additional tailwinds for risk
assets, with the lowest-rated investment-grade sector, BBB, benefitting most.
The market’s concerns about over-levered BBB corporates in the fourth quarter
have eased in anticipation of Fed rate cuts and a general risk-on tone. Additionally,
some of the larger M&A names over the past two years—such as Comcast, AT&T,
and Keurig Dr. Pepper—have continued to hit deleveraging targets.
Going into the third quarter, the market has been largely supportive of further
spread compression in investment-grade corporates given the strong technical
and generally accommodative monetary policy, but we caution that with year-
to-date total return of around 9 percent, the upside may be limited. September
and October in particular are slated to experience myriad pivotal macro events
including trade war meetings and a potential no-deal Brexit resolution. Given the
extraordinary year-to-date performance, combined with the liquidity fire drill we
experienced in the fourth quarter of last year, some amount of risk reduction by
asset managers and dealers should be expected. A prolonged bout of volatility and
modest outflows could create a collapse in liquidity. We do not believe long-term
investors are being compensated for risk given where we are in the credit cycle.

9Fixed-Income Outlook | Third Quarter 2019
Source: Guggenheim Investments, Bloomberg. Data as of 8.9.2019.
A Record $15 Trillion in Global Debt Is Yielding Below Zero
Healthy investment-grade fund inflows to the tune of $70 billion over the last six months resulted in steady net buying of credit.
Source: Guggenheim Investments, Investment Company Institute. Data as of 7.31.2019. June and July based on estimated weekly fund flows.
Investment-Grade Fund Inflows Supported Net Buying of CreditInvestment-Grade Mutual Fund Flows, Six-Month Rolling Total
With a record $15 trillion in global debt yielding below zero, and over $1 trillion of negative-yielding corporate debt, positive-yielding U.S. dollar-denominated credit should remain attractive to domestic and foreign investors alike.
-$40bn
-$20bn
$0bn
$20bn
$40bn
$60bn
$80bn
June 2018
July 2018
Aug. 2018
Sept. 2018
Oct. 2018
Nov. 2018
Dec. 2018
Jan.2018
Feb.2018
March 2019
April 2019
May2019
June 2019
July 2019
Bloomberg Barclays Global Aggregate Negative Yielding Debt (LHS)
$0bn
$200bn
$400bn
$600bn
$800bn
$1000bn
$1200bn
$2tn
$0tn
$4tn
$6tn
$8tn
$10tn
$12tn
$14tn
$18tn
Bloomberg Barclays Global Aggregate Negative Yielding Debt: Corporates (RHS)
2014 2015 2016 2017 2018 2019
$16tn

Portfolio allocation as of 6.30.2019
10 Fixed-Income Outlook | Third Quarter 2019
1%
0%
0%
GuggenheimCore
GuggenheimCore Plus
GuggenheimMulti-Credit
Bloomberg BarclaysU.S. Aggregate
1%
High-Yield Corporate Bonds
The Rally That Lacks Conviction
Not all prices in a strong first half were lifted equally by this Fed-induced rally.
Several themes emerged in the first half of 2019. Chief among them was the desire
to extend duration as Treasury yields fell across the curve with the market pricing
in Fed easing over the next 18 months. Since peaking above 3 percent in 2018,
five-year and 10-year Treasury yields have fallen to near 1.8 percent and 2.0
percent, respectively, as of late July. But not all of the performance was rate-driven
in high-yield corporates, since spreads have compressed meaningfully since
the beginning of the year. Other features of this rally included a preference for
liquidity offered by large capital structures. BB and B bonds in issues of larger than
$1 billion delivered excess returns over Treasurys of 6.8 percent and 7.0 percent,
respectively, compared to excess returns of 5.5 percent and 5.1 percent for BB and B
bonds sized between $250 million and $500 million.
Total return through the first half of 2019 for the ICE BofA Merrill Lynch High-
Yield Constrained index was 10.2 percent, with excess return over Treasurys
representing 5.9 percent of that. The increased attractiveness of high-yield
corporates due to their fixed-rate nature gave the market a meaningful boost in
performance over similarly rated floating-rate sectors. For example, BB corporates
have outperformed BB loans by 4 percentage points year to date through July 24,
and they outperformed BB CLOs by 3 percentage points (see chart, top right).
In the first quarter, we noted some signs that this rally lacks conviction, which
continued through the second quarter. CCCs are lagging in performance, with the
category’s excess returns over Treasurys at 4.5 percent year to date, compared to
6.8 percent in BBs and 6.0 percent in single-Bs. Since the beginning of June, when
the Fed sent clearer signals about a possible rate cut in July, CCC excess returns
have been largely flat while BBs and Bs earned positive returns over Treasurys
(see chart, bottom right). We forecast that the 12-month trailing par-weighted
default rate will climb to about 3 percent by year end, up from less than 1 percent
currently, and will ease in early 2020. But the gap in excess return between higher
beta CCCs and lower beta BBs points to brewing market concerns over credit risk.
Even as the Fed's stance has become more accommodative, this rally is more driven
by liquidity than fundamentals and may leave the riskiest borrowers exposed.
Thomas HauserSenior Managing Director
Rich de WetDirector

11Fixed-Income Outlook | Third Quarter 2019
Source: Guggenheim Investments, ICE BofA Merrill Lynch, JP Morgan, Credit Suisse. Data as of 7.24.2019.
High-Yield Corporates Outperformed Similarly Rated Floating Rate Sectors BB corporates have outperformed BB loans by 4 percentage points year to date through July 24, and they have outperformed BB CLOs by 3 percentage points.
Source: Guggenheim Investments, ICE BofA Merrill Lynch. Data as of 7.24.2019.
CCC Excess Return Divergence from BB and B Signals Credit Concerns Since the beginning of June when the Fed sent clearer signals about a possible rate cut in July, CCC excess returns over Treasurys have been largely flat while BBs and Bs earned positive returns over Treasurys.
BB-Rated, High Yield – Lev Loan BB-Rated, High Yield – CLO
-2%
-1%
0%
1%
2%
3%
4%
5%
Dec. 2018 Jan. 2019 Feb. 2019 March 2019 April 2019 May 2019 June 2019
Year
-to-
Date
Tot
al R
etur
n
-2%
0%
2%
4%
6%
8%
10%
BB Corp CCC CorpB Corp
Jan. 2019 Feb. 2019 March 2019 April 2019 May 2019 June 2019 July 2019

Portfolio allocation as of 6.30.2019
12 Fixed-Income Outlook | Third Quarter 2019
1%
9%
1%
0%
GuggenheimCore
GuggenheimCore Plus
GuggenheimMulti-Credit
Bloomberg BarclaysU.S. Aggregate
Bank Loans
Favorable Technicals Lift Prices
Secondary loan prices rose in the second quarter on the back of robust CLO demand.
As of the end of the second quarter, bank loan mutual funds and exchange-traded
funds have witnessed nine straight months of net redemptions, shrinking their
share of the loan market down to approximately 10 percent from 17 percent in
June of last year. Robust demand from a high volume of CLO originations,
on the other hand, overwhelmed the supply of loans in the second quarter.
Visible demand in the second quarter was almost $11 billion greater than the
change in loans outstanding, according to S&P LCD, solely due to weak loan
issuance against heavy CLO originations in April (see chart, top right). This helped
lift secondary loan prices and tighten spreads on new issue B-rated loans, which
represented the majority of loan issuance this year.
The Credit Suisse Leveraged Loan index gained 1.6 percent in the second quarter,
boosting the year-to-date return to 5.4 percent. This represents the index’s best
first-half performance since 2009. Performance across all rating categories was
positive in the second quarter, with BBs gaining 1.7 percent, Bs gaining 1.6 percent,
and CCCs gaining 0.6 percent.
Over the next few months, investors should expect to see a reduction in loan
coupons as the Fed delivers rate cuts. The index performance attributed to interest
returns since January already reflects some decline in the one-month and three-
month London inter-bank offered rate (Libor) since the market began to price in
Fed easing. We do not expect this to have an impact on CLO demand for loans
given that they will also see liability costs decline. We may see some pickup in
loan supply in the third quarter, but August tends to be a quiet month for primary
markets so any pickup in issuance would likely come in September (see chart,
bottom right).
Thomas HauserSenior Managing Director
Christopher KeyworkManaging Director

13Fixed-Income Outlook | Third Quarter 2019
Mutual fund outflows have continued for nine consecutive months, but robust CLO volume in the second quarter more than offset visible net outflows and helped tighten discount margins. Although not the sole driver, the balance between net visible flows and loan issuance can drive spreads wider or tighter.
Source: Guggenheim Investments, S&P LCD. Data as of 6.30.2019. Based on institutional loan issuance only.
We may see some pickup in loan supply in the third quarter, but August tends to be a quiet month for primary markets so any pickup in issuance would likely come in September.
Late Summer Loan Issuance Tends to be Muted
Source: Guggenheim Investments, S&P LCD, Credit Suisse. Data as of 6.30.2019.
Bank Loan Technical Dynamics Help Drive Valuations
Net Visible Inflows / (Outflows) Bank Loan Discount Margins (3-Month Average)
350 bps
390 bps
430 bps
470 bps
510 bps
550 bps
590 bps
630 bps
670 bps
710 bps
-$50bn
-$40bn
-$30bn
-$20bn
-$10bn
$0bn
$10bn
$20bn
$30bn
$40bn
June 2014
Sept. 2014
Dec. 2014
March 2015
June 2015
Sept. 2015
Dec. 2015
March 2016
June 2016
Sept. 2016
Dec. 2016
March 2017
June 2017
Sept. 2017
Dec. 2017
March 2018
June 2018
Sept. 2018
Dec. 2018
March 2019
June 2019
June 2013
Sept. 2013
Dec. 2013
March 2014
2016 2017 2018 2019
$0bn
$10bn
$20bn
$30bn
$40bn
$50bn
$60bn
$70bn
$80bn
January
FebruaryMarch April May
June JulyAugust
September
October
November
December

Portfolio allocation as of 6.30.2019
14 Fixed-Income Outlook | Third Quarter 2019
20%
30%
16%
0%
GuggenheimCore
GuggenheimCore Plus
GuggenheimMulti-Credit
Bloomberg BarclaysU.S. Aggregate
Asset-Backed Securities and CLOs
Aircraft ABS Is Flying Off the Shelves
Investor demand for investment-grade credit is increasing competition for aircraft ABS.
Investor demand for CLOs regained its footing in the second quarter of 2019,
causing pricing spreads to tighten and new issuance to match prior volume
records. Investors shrugged off negative press relating to the growth and evolution
of the CLO and leveraged loan markets, and investment-grade CLO spreads
tightened 10–20 basis points throughout the second quarter. Refinance and reset
activity increased marginally as pricing spreads improved, but they still only
amount to 30 percent of 2018 volumes. New issuance volumes remained strong
in the second quarter, however, and are on pace to match 2018’s record. We remain
constructive on short maturity, senior tranches of middle-market CLOs, where we
have been able to uncover compelling risk-adjusted value.
Issuance in esoteric ABS varied greatly by subsector in the first half of 2018, but
unsecured consumer loans, aircraft, and whole business ABS accounted for two
thirds of all esoteric ABS issuance (see chart, top right). We previously highlighted
the strength in the whole business ABS market, and here we will focus on the
growth in the aircraft ABS market. Aircraft ABS issuance year to date in 2019 has
already almost reached the total issuance volume of 2018, one of the strongest
years of issuance on record for aircraft ABS (see chart, bottom right). Ongoing
strength in air traffic growth, continued good credit performance, and syndicated
equity transaction structures have increased investor sponsorship of aircraft ABS.
While we remain skeptical about the marketed economics of syndicated equity
investments, investor enthusiasm for the space is undeniable and has contributed
to the growth in the aircraft ABS market.
We expect our investment focus to remain on bespoke opportunities, middle-
market CLOs, commercial ABS, and aircraft ABS.
Peter Van GelderenManaging Director

15Fixed-Income Outlook | Third Quarter 2019
Source: Guggenheim Investments. Data as of 7.15.2019.
The number of lessors accessing the aircraft ABS market and the issuance of aircraft ABS has surged in recent years. Ongoing strength in air traffic growth, continued credit performance and syndicated equity transaction structures has increased investor sponsorship of aircraft ABS.
2019 Sets Record for Aircraft ABSIssuance in $millions
1,000
0
2,000
3,000
4,000
5,000
6,000
7,000
8,000
4,652 4,479
2,032
5,808
3,306
1,864
815
4,690
1,370
5,049
1,896
1,287
3,303 3,659
4,889
6,716
5,809
5,165
0 0 0 000
1996
1997
1998
1999
2000
2001
2002
2003
2004
2005
2006
2007
2008
2009
2010
2011
2012
2013
2014
2015
2016
2017
2018
2019
YTD
Unsecured consumer loans, aircraft, and whole business ABS accounted for two thirds of all esoteric ABS issuance in the first half of 2019.
Esoteric ABS Centers on Consumer Loans, Aircraft, and Whole Business ABSIssuance in $millions, YTD 2019
Source: Guggenheim Investments, Bloomberg, Citi. Data as of 7.16.2019.
1,000
0
2,000
3,000
4,000
5,000
6,000
7,000
8,000
Structured Settle
ment
Tax Lien
Triple Net Le
ase
Insurance
WirelessPACE
Cell Tower
Container Lease
Data Center
Small Busin
essSolar
TimeshareDPPAircr
aftWBS
Consumer Loan
Home Improvement

Portfolio allocation as of 6.30.2019
16 Fixed-Income Outlook | Third Quarter 2019
1%
14%
9%
0%
GuggenheimCore
GuggenheimCore Plus
GuggenheimMulti-Credit
Bloomberg BarclaysU.S. Aggregate
Non-Agency Residential Mortgage-Backed Securities
Credit Tailwinds Remain in Place
Favorable fundamentals should improve cash flows in select subsectors.
Non-Agency RMBS generated positive performance so far in 2019, returning 2.3 percent in the second quarter and 5.0 percent year to date. Although performance was directionally positive, the sector’s moderate interest rate sensitivity and spread volatility resulted in weaker performance than the Bloomberg Barclays U.S. Aggregate index and other credit sectors.
Dealer inventories remained historically low in the second quarter, and investor participation and overall secondary trading volumes were light. New issuance has trended above 2018 with year-to-date issuance of $35 billion and second quarter issuance of $18 billion. After 10 years of negative net issuance, 2019 issuance is expected to exceed paydowns from the outstanding securities in the market, resulting in positive net supply. Newly issued securities have received steady demand from investors in the second quarter. Notably, sponsorship for deeply subordinated tranches increased over the quarter as risk-seeking investors repositioned into high beta and higher yielding RMBS tranches in response to expectations of a more accommodative Fed and an extended economic cycle.
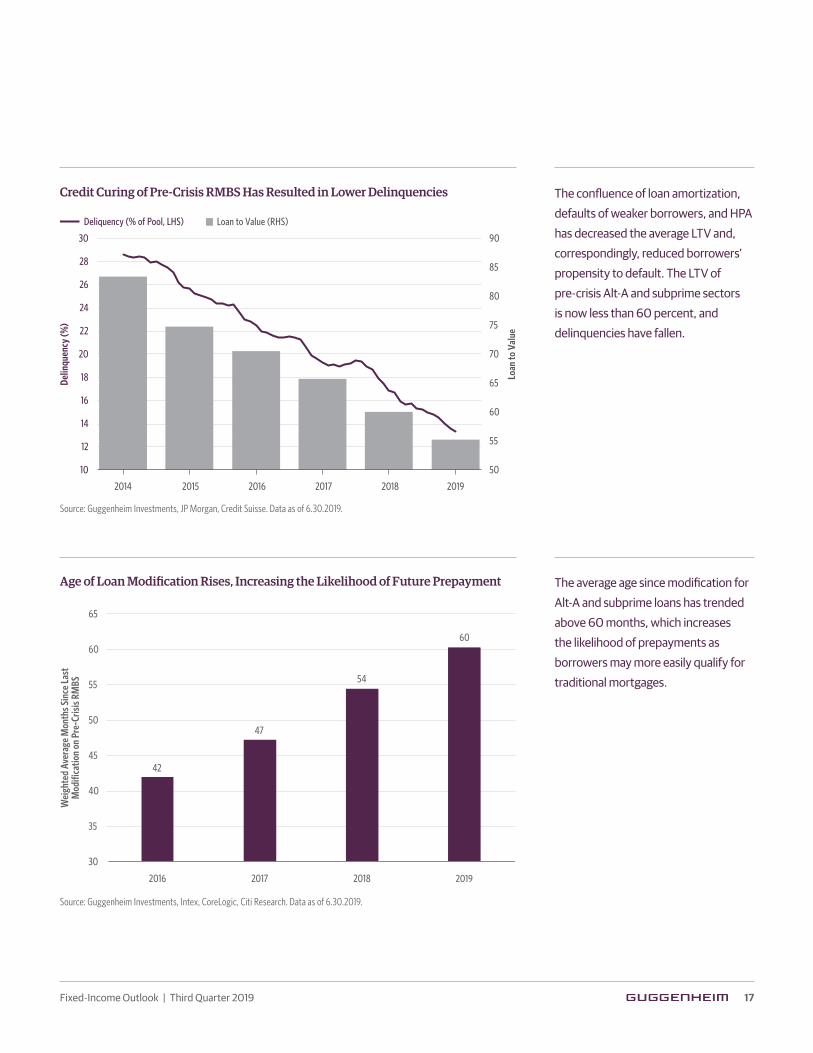
The high default rates and depressed home prices experienced in 2009–2012 are a distant memory, as home prices have recovered and significant credit curing has occurred among pre-crisis loans in the non-Agency RMBS market. At present, pre-crisis Alt-A and subprime deals comprise a $375 billion market. The confluence of loan amortization, defaults of weaker borrowers, and home price appreciation (HPA) has decreased the average ratio of mortgage loan balance to property value (LTV) and, correspondingly, reduced borrowers’ propensity to default. The LTV of these sectors is now less than 60 percent, and delinquencies have fallen (see chart, top right). The average age since modification for Alt-A and subprime loans has trended above 60 months (see chart, bottom right), which increases the likelihood of prepayments as borrowers may more easily qualify for traditional mortgages. As expectations for future losses decline, recoveries on previous forbearance modifications, which are not well-researched or priced consistently in the market, begin to contribute materially to future bond cash flows on selected deals.
We remain constructive on the performance prospects for non-Agency RMBS as borrowers continue to benefit from the favorable consumer-credit and housing fundamentals, which should translate to improvements in bond cashflows over time. We continue to favor senior, shorter maturity classes for their lower price volatility as well as selected credit-sensitive, pre-crisis passthroughs that should benefit from the credit improvements described above.
Karthik Narayanan, CFAManaging Director
Roy ParkDirector
17Fixed-Income Outlook | Third Quarter 2019
Age of Loan Modification Rises, Increasing the Likelihood of Future Prepayment
Source: Guggenheim Investments, Intex, CoreLogic, Citi Research. Data as of 6.30.2019.
The average age since modification for Alt-A and subprime loans has trended above 60 months, which increases the likelihood of prepayments as borrowers may more easily qualify for traditional mortgages.
Source: Guggenheim Investments, JP Morgan, Credit Suisse. Data as of 6.30.2019.
The confluence of loan amortization, defaults of weaker borrowers, and HPA has decreased the average LTV and, correspondingly, reduced borrowers’ propensity to default. The LTV of pre-crisis Alt-A and subprime sectors is now less than 60 percent, and delinquencies have fallen.
Credit Curing of Pre-Crisis RMBS Has Resulted in Lower Delinquencies
Deliquency (% of Pool, LHS)
50
55
60
65
70
75
80
85
90
10
12
14
16
18
20
22
24
26
28
30
2014 2015 2016 2017 2018 2019
Loan
to V
alue
Delin
quen
cy (%
)
Loan to Value (RHS)
42
47
54
60
30
35
40
45
50
55
60
65
2016 2017 2018 2019
Wei
ghte
d Av
erag
e M
onth
s Sin
ce L
ast
Mod
ifica
tion
on P
re-C
risis
RMBS

Portfolio allocation as of 6.30.2019
18 Fixed-Income Outlook | Third Quarter 2019
2%
4%
2%
2%
GuggenheimCore
GuggenheimCore Plus
GuggenheimMulti-Credit
Bloomberg BarclaysU.S. Aggregate
Commercial Mortgage-Backed Securities
CRE-CLO Evolution
The CRE-CLO product is in its early years while conduit is showing its age.
Collateralized loan obligations backed by commercial real estate loans (CRE-CLO)
in their current form was born in 2013. Up until 2018, the market was still figuring
out what type of personality the product would have, or what its structural
features would be. In the last year or so, the traits that have emerged are deals
with two-year reinvestment terms, maximum pool-weighted average life (WAL)
of 5.5 years, and highest concentrations in multifamily properties.
As the market is maturing for CRE-CLOs, we are seeing 2019 as a breakout year
in terms of liquidity with more market-makers establishing themselves. For the
majority of 2018, there were only three to four dealers making daily markets on
the entire capital stack of select deals. Today, seven or eight dealers are actively
making markets on a larger number of bonds, with an additional three to four
regional dealers actively trading the product. Bid wanted in competition (BWIC)
volumes have been steadily increasing, showing more signs of a healthy secondary
market (see chart, top right). While liquidity has improved, the deal structures
are still undergoing a few growing pains. For example, a few recent deals have
had their structure terms retroactively changed in deal documents after market
consensus grew that this was the right course of action.
Beyond these few growing pains, however, borrowers, issuers, and investors find
CRE-CLOs attractive versus CMBS conduits due to their greater flexibility and
shorter WAL. Conduit issuance has been declining slowly, and we expect that
trend to continue as the product offering is not able to compete with insurance
companies, banks, and CRE-CLOs (see chart, bottom right). One of the main
headwinds conduit financing faces is the borrower experience with conduit
servicers. Borrowers need to go through servicers to release reserve funds, approve
new tenants, and in times of stress, obtain modifications. It has been notoriously
difficult for borrowers to get anything done with efficiency. In CRE-CLO structures,
the issuer is intimately involved in these types of requests as they manage the
loans and retain them on their balance sheet.
As the CRE-CLO product continues to grow, we believe its structural advantages,
along with the increased liquidity, will continue to make it an attractive investment.
Shannon ErdmannDirector
Phil HoehnVice President

19Fixed-Income Outlook | Third Quarter 2019
Source: Guggenheim Investments, JP Morgan. Data as of 6.30.2019.
Bid-wanted-in-competition volumes have been steadily increasing, showing more signs of a healthy secondary market.
Source: Guggenheim Investments, JP Morgan. Data as of 6.30.2019.
Conduit issuance has been declining slowly and we expect that trend to continue as the product offering is not able to compete against with insurance companies, banks, and CRE-CLOs.
Increasing BWIC Volumes Indicate Secondary Market StrengthCRE-CLO Bid List Volume ($millions)
Conduit Issuance Wanes in the Face of Competition from CRE-CLOsNew Issuance ($billions)
0
10
20
30
40
50
60
70
2013 2014 2015 2016 2017 2018 2019*
Conduit CRE CLO
0
20
40
60
80
100
120
140
160
180
January 2017
November 2016
September 2016
July 2016
May 2016
March 2016
November 2017
September 2017
July 2017
May 2017
March 2017
January 2018
November 2018
September 2018
July 2018
May 2018
March 2018
January 2019
May 2019
March 2019

Portfolio allocation as of 6.30.2019
20 Fixed-Income Outlook | Third Quarter 2019
8%
0%
0%
0%
GuggenheimCore
GuggenheimCore Plus
GuggenheimMulti-Credit
Bloomberg BarclaysU.S. Aggregate
Commercial Real Estate Debt
The Rising Cost of Housing
Real estate investors mull the ramifications of rent control.
Over the last 10 years, the multifamily sector has had an impressive run, with
asset prices increasing over 100 percent and cap rates falling nearly 2 percentage
points (see chart, top right). As multifamily investors evaluate when the current
growth cycle for the sector may close, they have another concern beyond the
market: rent control initiatives.
Oregon recently became the first state to mandate statewide rent control, capping
owners’ ability to increase rents annually at inflation plus 7 percent. California,
Maryland, New Jersey, New York, and the District of Columbia all mandate some
level of state or local rent restrictions, and industry experts predict that other
jurisdictions will follow suit. Although many states have laws that prohibit
municipalities from controlling rents (see map, bottom right), there is increasing
pressure to address the demand for more affordable housing by restricting
investors’ ability to increase market rents.
In addition to restrictions on increasing rents, some jurisdictions such as New
York, which recently made its sweeping rent control provisions permanent, are
closing loopholes. In the past, these loopholes allowed a multifamily property
owner to bring rents up to market rents when a unit became vacant (vacancy
de-control) when the owner invested equity to make improvements to the
property, or when a tenant’s income rose to a designated “high-income” level.
With these changes, the Real Estate Board of New York predicts that owners will
no longer have an incentive to invest in rent-regulated units. With uncertainty
around how the new restrictions will impact property values, S&P Global
Market Intelligence noted that multifamily loan originations in New York
declined by nearly 30 percent year-over-year in early 2019. Access to affordable
rental housing has become a rallying cry for a number of the 2020 presidential
hopefuls, thus rent control is expected to remain a risk factor for multifamily
investors. It is also a mandate that is unlikely to solve the fundamental market
disconnect when the demand for housing exceeds the existing supply.
William BennettManaging Director
Ted JungDirector
Jennifer A. MarlerSenior Managing Director

21Fixed-Income Outlook | Third Quarter 2019
Source: National Multifamily Housing Council. Data as of 3.13.2019.
Although many states have laws that prohibit municipalities from controlling rents, there is increasing pressure to address the demand for more affordable housing by restricting investors’ ability to increase market rents.
Demand for More Affordable Housing Is Leading to More Rent Control Legislation
Source: Real Capital Analytics. Data as of 4.30.2019. CPPI: Commercial Property Price Index.
Over the last 10 years, the multifamily sector has had an impressive run, with asset prices increasing over 100 percent and cap rates falling nearly 2 percentage points.
Multifamily Sector Asset Prices Have Doubled in 10 Years
Apartment CPPI (LHS) Apartment Cap Rate (RHS)
2001 2005 2006 2007 2008 2009 2010 2011 2012 2013 2014 2015 2016 2017 20182002 2003 2004
4%
5%
6%
7%
8%
9%
10%
3%60
80
100
120
140
160
180
200
2019
Has Statewide Rent Control Has Rent Control Preempts Rent Control
Dillon Rule State With No Rent Control Nor PreemptionsPreempts Mandatory Inclusionary Zoning and Rental Control Has No Rent Control Nor Reemptions
NHMA
CTRI
NJDE
DCMD
OR
MT
CA
NV
IDWY
CO
NM
TX
OK
KS
NE
SD
NDMN
WIMI
IN OH
KYWV
PA
NY
VA
NC
SC
MEVT
IA
MOIL
AR
LA
MS
TN
AL GA
UT
AZ
WA
AK
HI
FL

Portfolio allocation as of 6.30.2019
22 Fixed-Income Outlook | Third Quarter 2019
Municipal Bonds
Unwavering Demand
Negative credit headlines did not diminish investor appetite for municipal bonds.
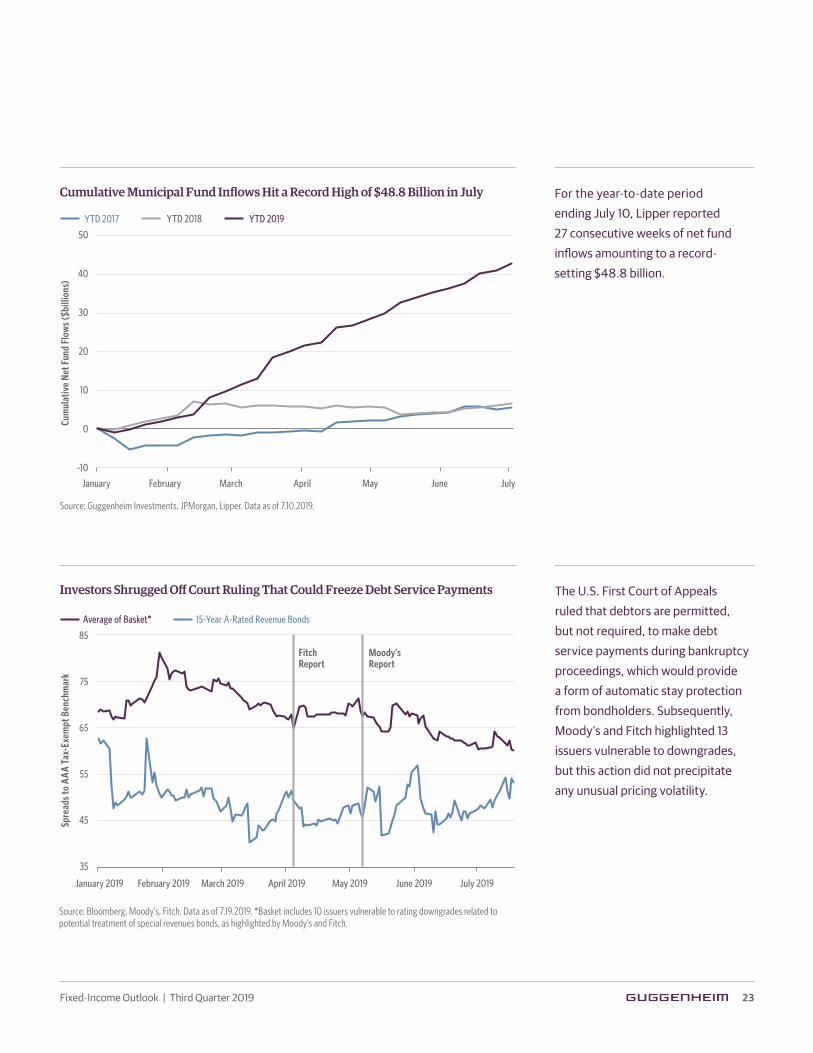
Municipals performed well as a safe-haven asset class amid geopolitical and trade tensions, modest economic data, and dovish Fed policy expectations. In the second quarter of 2019, tax-exempt municipal bond yields rallied, prompting spreads and municipal-to-Treasury yield ratios to reach new multi-decade rich levels. In the second quarter, 10-year and 30-year municipal-to-Treasury ratios averaged 76 percent and 89 percent, respectively, below the previous quarter’s averages of 80 percent and 98 percent. For the year-to-date period ending July 10, Lipper reported 27 consecutive weeks of net fund inflows amounting to a record-setting $48.8 billion (see chart, top right).
We expect this year’s theme of supportive supply-demand dynamics to continue through the summer as the municipal market experiences seasonal negative net supply. According to Citigroup, investors can expect an influx of $185 billion of returned capital (i.e., coupon payments, calls, and bond maturities), which would surpass the three-year trailing average of approximately $167 billion. At the current pace of only $28 billion of monthly new issue supply, municipal investors may face a challenging reinvestment environment. Issuers continue to enjoy favorable borrowing conditions in terms of costs, covenant provisions, and even coupon structures. For example, issuance of sub-5 percent coupon bonds increased to a record high of 46 percent of total supply, up from 38 percent in 2018; these lower coupon bonds offer much less liquidity because of possible negative tax consequences, unique to tax-exempt bonds, in a rising rate environment.
Meanwhile, investors’ unwavering demand was epitomized by idle reactions to negative credit headlines. Most notably, the U.S. First Court of Appeals upheld a ruling that upended a key structural protection of special revenue bonds, which account for roughly two-fifths of the outstanding municipal bond market. The Court ruled that debtors are permitted, but not required, to make debt service payments during bankruptcy proceedings, which would provide a form of automatic stay protection from bondholders. Subsequently, Moody’s and Fitch highlighted 13 issuers vulnerable to downgrades, but this action did not precipitate any unusual pricing volatility (see chart, bottom right). Although low volatility has permeated most asset classes including municipals, we did not envision that such highly visible tail risks would be largely ignored. While municipal buyers’ risk tolerance continues to grow, investors should take the opportunity to shift portfolios to higher quality when possible.
James PassSenior Managing Director
Allen Li, CFAManaging Director
Michael ParkVice President
10%
0%
1%
1%
GuggenheimCore
GuggenheimCore Plus
GuggenheimMulti-Credit
Bloomberg BarclaysU.S. Aggregate
23Fixed-Income Outlook | Third Quarter 2019
For the year-to-date period ending July 10, Lipper reported 27 consecutive weeks of net fund inflows amounting to a record-setting $48.8 billion.
Source: Guggenheim Investments, JPMorgan, Lipper. Data as of 7.10.2019.
Cumulative Municipal Fund Inflows Hit a Record High of $48.8 Billion in July
Source: Bloomberg, Moody's, Fitch. Data as of 7.19.2019. *Basket includes 10 issuers vulnerable to rating downgrades related to potential treatment of special revenues bonds, as highlighted by Moody's and Fitch.
The U.S. First Court of Appeals ruled that debtors are permitted, but not required, to make debt service payments during bankruptcy proceedings, which would provide a form of automatic stay protection from bondholders. Subsequently, Moody’s and Fitch highlighted 13 issuers vulnerable to downgrades, but this action did not precipitate any unusual pricing volatility.
Investors Shrugged Off Court Ruling That Could Freeze Debt Service Payments
YTD 2017 YTD 2018
-10
0
10
20
30
40
50
January February March April May June July
Cum
ulat
ive
Net F
und
Flow
s ($b
illio
ns)
YTD 2019
Average of Basket*
Fitch Report
Moody’s Report
15-Year A-Rated Revenue Bonds
35
45
55
65
75
85
January 2019 February 2019 March 2019 April 2019 May 2019 June 2019 July 2019
Spre
ads t
o AA
A Ta
x-Ex
empt
Ben
chm
ark

Portfolio allocation as of 6.30.2019
24 Fixed-Income Outlook | Third Quarter 2019
23%
1%
18%
27%
GuggenheimCore
GuggenheimCore Plus
GuggenheimMulti-Credit
Bloomberg BarclaysU.S. Aggregate
Prepayment risk for recently originated mortgages is high.
Agency MBS underperformed risk assets in the second quarter due to lower
mortgage rates and a pickup in interest rate volatility. The Bloomberg Barclays U.S.
MBS index posted a 2.0 percent total return for the quarter. Both option-adjusted
and nominal spreads were wider over the quarter and are currently near the widest
levels of the year.
The Mortgage Bankers Association Refinancing Index, a leading indicator of
prepayment volumes, breached its first-quarter high (see chart, top right) as
30-year mortgage rates broke through and sustained sub-4 percent levels.
While currently about 45 percent of 30-year mortgages are in the refinance zone,
most of this prepayment risk remains concentrated in mortgages originated
since 2018. This fast-paying subset of the mortgage universe, the rollout of
single-security in June (a common single mortgage-backed security backed by
issuance from both Fannie Mae and Freddie Mac), and the continued reduction
in the Fed’s balance sheet holdings have all led to worsening performance of
cheapest-to-deliver collateral and widening residential MBS valuations (RMBS).
Conversely, less-negatively convex options, such as Agency multifamily bonds
and better call-protected pools, have benefited. Looking ahead, the near-term
technical picture remains challenging as supply picks up over the summer and
incremental prepayment risk remains elevated (see chart, bottom right). Despite
these concerns, a dovish Fed and RMBS valuations near the widest levels of the
year may provide a positive backdrop for the sector.
We continue to favor investments where either the collateral or structure offers
some cash flow stability at reasonable spreads. Accordingly, we find select
subsectors attractively priced in the current environment, including longer-
maturity Agency multifamily, better call-protected pools, and some collateralized
mortgage obligation structures. These investments have performed well, and
we expect them to continue their performance in scenarios where interest rate
volatility rises, interest rates decline sharply, or the Fed continues down the path
of reducing its MBS holdings.
Agency Mortgage-Backed Securities
Prepayment Risks Rise as Mortgage Rates Drop
Aditya Agrawal, CFADirector
Louis Pacilio, CFAVice President

25Fixed-Income Outlook | Third Quarter 2019
The near-term technical picture remains challenging as supply picks up over the summer and incremental prepayment risk remains elevated. About 45 percent of 30-year mortgages are currently in the refinance zone.
The Mortgage Bankers Association Refinancing Index, a leading indicator of prepayment volumes, rose as 30-year mortgage rates broke through and sustained sub-4 percent levels.
Source: Guggenheim Investments, Credit Suisse. Data as of 6.28.2019. Assumes 50 basis-point rate incentive. Includes 15-year and 30-year MBS.
Mortgage Refinancing Risk Is Likely to Remain Elevated in the Near Term
Mortgage Refi Exposure in Rate Shifts, Cumulative (LHS)
0%
2%
4%
6%
8%
10%
12%
0%
10%
20%
30%
40%
50%
60%
70%
80%
90%
100%
-1.2 -1.1 -1.0 -0.9 -0.8 -0.7 -0.6 -0.5 -0.4 -0.3 -0.2 -0.1 0.0 0.1 0.2 0.3 0.4 0.5 0.6 0.7 0.8 0.9 1.0 1.1 1.2
Rate Shift (%)
Mortgage Refi Exposure in Rate Shifts, Incremental (RHS)
0%
1%
0%
1%
5%
8%
5% 5%
4%
9%
10%
7%
3%
6% 6%
5% 5%
3%
4%
3%
1%2%
1% 1%
0%
Source: Guggenheim Investments, Bloomberg, Mortgage Bankers Association. Data as of 6.30.2019.
Prepayment Risk Rose as 30-Year Mortgage Rates Dipped Below 4 PercentMortgage Bankers Association Refinancing Index
Inde
x Lev
el
0
2000
4000
8000
6000
12000
10000
April 2002
Oct. 2004
Jan. 2006
April 2007
July 2008
Oct. 2009
Jan. 2011
April 2012
July 2013
Oct. 2014
Jan. 2016
April 2017
July 2018
July 2003
Portfolio allocation as of 6.30.2019
26 Fixed-Income Outlook | Third Quarter 2019
10%
3%
32%
41%
GuggenheimCore
GuggenheimCore Plus
GuggenheimMulti-Credit
Bloomberg BarclaysU.S. Aggregate
Tad Nygren, CFAManaging Director
Connie FischerSenior Managing Director
Kris DorrManaging Director
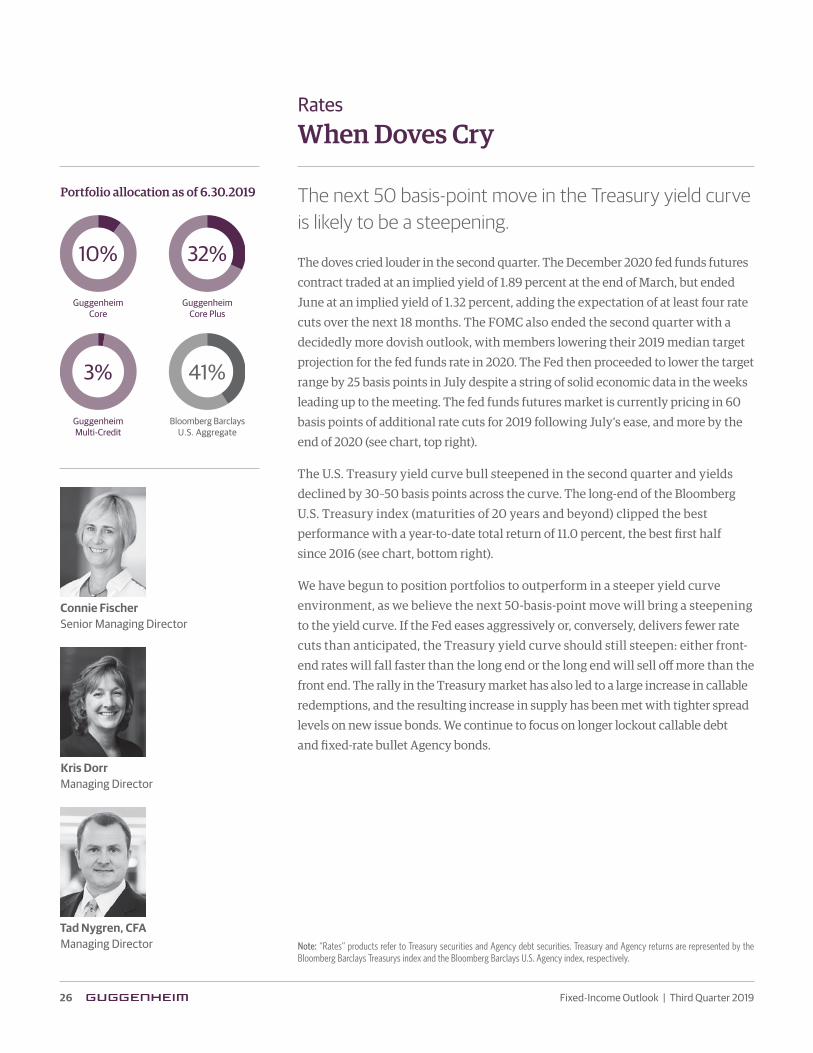
Rates
When Doves Cry
The next 50 basis-point move in the Treasury yield curve is likely to be a steepening.
The doves cried louder in the second quarter. The December 2020 fed funds futures
contract traded at an implied yield of 1.89 percent at the end of March, but ended
June at an implied yield of 1.32 percent, adding the expectation of at least four rate
cuts over the next 18 months. The FOMC also ended the second quarter with a
decidedly more dovish outlook, with members lowering their 2019 median target
projection for the fed funds rate in 2020. The Fed then proceeded to lower the target
range by 25 basis points in July despite a string of solid economic data in the weeks
leading up to the meeting. The fed funds futures market is currently pricing in 60
basis points of additional rate cuts for 2019 following July’s ease, and more by the
end of 2020 (see chart, top right).
The U.S. Treasury yield curve bull steepened in the second quarter and yields
declined by 30–50 basis points across the curve. The long-end of the Bloomberg
U.S. Treasury index (maturities of 20 years and beyond) clipped the best
performance with a year-to-date total return of 11.0 percent, the best first half
since 2016 (see chart, bottom right).
We have begun to position portfolios to outperform in a steeper yield curve
environment, as we believe the next 50-basis-point move will bring a steepening
to the yield curve. If the Fed eases aggressively or, conversely, delivers fewer rate
cuts than anticipated, the Treasury yield curve should still steepen: either front-
end rates will fall faster than the long end or the long end will sell off more than the
front end. The rally in the Treasury market has also led to a large increase in callable
redemptions, and the resulting increase in supply has been met with tighter spread
levels on new issue bonds. We continue to focus on longer lockout callable debt
and fixed-rate bullet Agency bonds.
Note: “Rates” products refer to Treasury securities and Agency debt securities. Treasury and Agency returns are represented by the Bloomberg Barclays Treasurys index and the Bloomberg Barclays U.S. Agency index, respectively.

27Fixed-Income Outlook | Third Quarter 2019
Source: Guggenheim Investments, Bloomberg. Data as of 6.30.2019.
The long end of the Bloomberg U.S. Treasury index (maturities of 20 years and beyond) clipped the best performance with a year-to-date total return of 11.0 percent, the best first half since 2016. This performance may be difficult to repeat in the second half because yields at the long end would have to decline from about 2.5 percent to 2.0 percent by year-end to return another 11 percent.
Strong First-Half Performance at the Long End of the CurveBloomberg Barclays Treasury Index, 20+ Year Maturities
Total Return, Trailing 6 Months (LHS) Index Yield (RHS)
2.0%
2.2%
2.4%
2.6%
2.8%
3.0%
3.2%
3.4%
3.6%
3.8%
4.0%
-25%
-20%
-15%
-10%
-5%
0%
5%
10%
20%
20%
25%
Dec. 2013
June 2014
Dec. 2014
June 2015
Dec. 2015
June 2016
Dec. 2016
June 2017
Dec. 2017
June 2018
Dec. 2018
June 2019
The fed funds futures market is currently pricing in 60 basis points of additional rate cuts in 2019 following July’s ease, and more by the end of 2020.
Source: Guggenheim Investments, Bloomberg. Data as of 8.15.2019.
Market Is Pricing in Sharp Cuts for 2019 and 2020Cuts Priced in by Calendar Year in Basis Points
2019 2020
-120
-80
-60
-40
-20
60
40
20
0
June 2018 September 2018 December 2018 March 2019 June 2019
-100

28 Fixed-Income Outlook | Third Quarter 2019
Important Notices and Disclosures
This material is distributed or presented for informational or educational purposes only and should not be considered a recommendation of any particular security, strategy or investment product, or as investing advice of any kind. This material is not provided in a fiduciary capacity, may not be relied upon for or in connection with the making of investment decisions, and does not constitute a solicitation of an offer to buy or sell securities. The content contained herein is not intended to be and should not be construed as legal or tax advice and/or a legal opinion. Always consult a financial, tax and/or legal professional regarding your specific situation. This material contains opinions of the author or speaker, but not necessarily those of Guggenheim Partners, LLC or its subsidiaries. The opinions contained herein are subject to change without notice. Forward looking statements, estimates, and certain information contained herein are based upon proprietary and non-proprietary research and other sources. Information contained herein has been obtained from sources believed to be reliable, but are not assured as to accuracy. Past performance is not indicative of future results. There is neither representation nor warranty as to the current accuracy of, nor liability for, decisions based on such information. No part of this material may be reproduced or referred to in any form, without express written permission of Guggenheim Partners, LLC.Past performance is not indicative of future results. There is neither representation nor warranty as to the current accuracy or, nor liability for, decisions based on such information. Investing involves risk, including the possible loss of principal. Investments in bonds and other fixed-income instruments are subject to the possibility that interest rates could rise, causing their value to decline. Investors in asset-backed securities, including mortgage-backed securities, collateralized loan obligations (CLOs), and other structured finance investments generally receive payments that are part interest and part return of principal. These payments may vary based on the rate at which the underlying borrowers pay off their loans. Some asset-backed securities, including mortgage-backed securities, may have structures that make their reaction to interest rates and other factors difficult to predict, causing their prices to be volatile. These instruments are particularly subject to interest rate, credit and liquidity and valuation risks. High-yield bonds may present additional risks because these securities may be less liquid, and therefore more difficult to value accurately and sell at an advantageous price or time, and present more credit risk than investment grade bonds. The price of high yield securities tends to be subject to greater volatility due to issuer-specific operating results and outlook and to real or perceived adverse economic and competitive industry conditions. Bank loans, including loan syndicates and other direct lending opportunities, involve special types of risks, including credit risk, interest rate risk, counterparty risk and prepayment risk. Loans may offer a fixed or floating interest rate. Loans are often generally below investment grade, may be unrated, and can be difficult to value accurately and may be more susceptible to liquidity risk than fixed-income instruments of similar credit quality and/or maturity. Municipal bonds may be subject to credit, interest, prepayment, liquidity, and valuation risks. In addition, municipal securities can be affected by unfavorable legislative or political developments and adverse changes in the economic and fiscal conditions of state and municipal issuers or the federal government in case it provides financial support to such issuers. A company’s preferred stock generally pays dividends only after the company makes required payments to holders of its bonds and other debt. For this reason, the value of preferred stock will usually react more strongly than bonds and other debt to actual or perceived changes in the company’s financial condition or prospects. Basis point: One basis point is equal to 0.01 percent. Likewise, 100 basis points equals 1 percent. Applicable to Middle East investors: Contents of this report prepared by Guggenheim Partners Investment Management, LLC, a registered entity in their respective jurisdiction, and affiliate of Guggenheim KBBO Partners Limited, the Authorised Firm regulated by the Dubai Financial Services Authority. This report is intended for qualified investor use only as defined in the DFSA Conduct of Business Module.
1. Guggenheim Investments assets under management are as of 6.30.2019. The assets include leverage of $11.2bn for assets under management. Guggenheim Investments represents the following affiliated investment management businesses of Guggenheim Partners, LLC: Guggenheim Partners Investment Management, LLC, Security Investors, LLC, Guggenheim Funds Investment Advisors, LLC, Guggenheim Funds Distributors, LLC, GS GAMMA Advisors, LLC, Guggenheim Partners Europe Limited, and Guggenheim Partners India Management.
2. Guggenheim Partners assets under management are as of 6.30.2019 and include consulting services for clients whose assets are valued at approximately $65bn.
©2019, Guggenheim Partners, LLC. No part of this article may be reproduced in any form, or referred to in any other publication, without express written permission of Guggenheim Partners, LLC.
39681

Guggenheim’s Investment ProcessGuggenheim’s fixed-income portfolios are managed by a systematic, disciplined investment process designed to mitigate behavioral biases and lead to better decision making. Our investment process is structured to allow our best research and ideas across specialized teams to be brought together and expressed in actively managed portfolios. We disaggregated fixed-income investment management into four primary and independent functions—Macroeconomic Research, Sector Teams, Portfolio Construction, and Portfolio Management—that work together to deliver a predictable, scalable, and repeatable process. Our pursuit of compelling risk-adjusted return opportunities typically results in asset allocations that differ significantly from broadly followed benchmarks.
About Guggenheim InvestmentsGuggenheim Investments is the global asset management and investment advisory division of Guggenheim Partners, with more than $209 billion1 in total assets across fixed income, equity, and alternative strategies. We focus on the return and risk needs of insurance companies, corporate and public pension funds, sovereign wealth funds, endowments and foundations, consultants, wealth managers, and high-net-worth investors. Our 300+ investment professionals perform rigorous research to understand market trends and identify undervalued opportunities in areas that are often complex and underfollowed. This approach to investment management has enabled us to deliver innovative strategies providing diversification opportunities and attractive long-term results.
About Guggenheim PartnersGuggenheim Partners is a global investment and advisory firm with more than $270 billion2 in assets under management. Across our three primary businesses of investment management, investment banking, and insurance services, we have a track record of delivering results through innovative solutions. With 2,400+ professionals worldwide, our commitment is to advance the strategic interests of our clients and to deliver long-term results with excellence and integrity. We invite you to learn more about our expertise and values by visiting GuggenheimPartners.com and following us on Twitter at twitter.com/guggenheimptnrs.
Contact usNew York
330 Madison Avenue New York, NY 10017 212 739 0700
Chicago
227 W Monroe Street Chicago, IL 60606 312 827 0100
Santa Monica
100 Wilshire Boulevard Santa Monica, CA 90401 310 576 1270
London
5th Floor, The Peak 5 Wilton Road London, SW1V 1LG +44 20 3059 6600
Tokyo
Otemachi First Square, West Tower 1-5-1, Otemachi, Chiyoda-ku Tokyo 100-0004 +03 4577 7880