stability investment solutions diligence economic assessment and fixed income outlook presented by:...
TRANSCRIPT

Stability Investment Solutions Diligence
Economic Assessment and Fixed Income Outlook
Presented by:
Bill Ehling, CFA
Vice President
Fixed Income Market Strategist
Client Portfolio Manager
Federated Investment Management Company
12-43418 (4/12)
For Institutional /Investment Professional Use Only. Not for Distribution to the Public. Federated Securities Corp., Distributor
Fund Not FDIC Insured May Lose Value No Bank Guarantee

Federated Knows…
*As of 3/31/12
STABILITYRanks as a leading global investment manager, managing approximately $360 billion* in assets, delivering competitive and consistent results since 1955 and fostering growth by reinvesting in the company.
INVESTMENT SOLUTIONSOffers broad product lines spanning domestic and international equity, fixed income, alternative and money market strategies with the goal of long-term consistent, competitive performance.
DILIGENCETakes the long view, believing that doing business the right way over time will present opportunity for future growth.
2For Institutional/Investment Professional Use Only. Not for Distribution to the Public.

Economic Assessment
For Institutional /Investment Professional Use Only. Not for Distribution to the Public.
3
“The budget should be balanced. Public debt should be reduced. The arrogance of officialdom should be tempered, and assistance to foreign lands should be curtailed lest Rome become bankrupt.”
Cicero 106 BC- 43 BC
“Those who cannot remember the past are condemned to repeat it.”
George Santayana 1863-1962
3

Domestic Economic Environment
For Institutional /Investment Professional Use Only. Not for Distribution to the Public.
4
I. Domestic Economic Picture: Partly Sunny but…
A. Political Gridlock
1. Debt ceiling debacle
2. S&P downgrade
B. Economic malaise
1. Weak GDP relative to prior recoveries
2. Weak employment growth relative to prior recoveries
3. Policy uncertainty as a causative factor?
C. Monetary policy: increasingly ineffective?
1. QE1
2. QE2
3. QE3?
a. Reduce rates on reserves to increase lending?
b. Operation Twist through June 2012
c. Expand the balance sheet further?
4

U.S. Unemployment Rate 1/31/48 – 3/31/12
For Institutional /Investment Professional Use Only. Not for Distribution to the Public.
5Source: Bloomberg

Pushing on a String?
For Institutional /Investment Professional Use Only. Not for Distribution to the Public.
6
Monthly Data 3/31/1948 - 2/28/2013
(E840)
Smoothed UnemploymentRate8/31/2011 = 9.1%
Scale Right ( )
Correlation Coefficient = 0.50
2.6 2.8 3.0 3.2 3.4 3.6 3.8 4.0 4.2 4.4 4.6 4.8 5.0 5.2 5.4 5.6 5.8 6.0 6.2 6.4 6.6 6.8 7.0 7.2 7.4 7.6 7.8 8.0 8.2 8.4 8.6 8.8 9.0 9.2 9.4 9.6 9.8
10.010.210.410.610.8
T-Bill YieldsMoved Ahead 18-Months
2/28/2013 = 0.0%Scale Left( )
T-Bill Implied Unemployment Ratefor 9/30/2011 = 4.52% 1
2
3
4
5
6
7
8
9
10
11
12
13
14
15
1950 1955 1960 1965 1970 1975 1980 1985 1990 1995 2000 2005 2010
Unemployment Rate vs T-Bill Yields
© Copyright 2011 Ned Davis Research, Inc. Further distribution prohibited without prior permission. All Rights Reserved. www.ndr.com/vendorinfo/. . For data vendor disclaimers refer to www.ndr.com/copyright.htmlSee NDR Disclaimer at

U.S. Capacity Utilization % of Total Capacity Seasonally Adjusted 1/31/67- 2/29/12
For Institutional /Investment Professional Use Only. Not for Distribution to the Public.
7
Source: Bloomberg

A/O 9/12/11
For Institutional /Investment Professional Use Only. Not for Distribution to the Public.
8
Generational Memory Loss?
8
U.S. Debt/GDP

For Institutional /Investment Professional Use Only. Not for Distribution to the Public.
9
Global Economic Environment
9
II. Global Macro Economic Picture
A. U.S. the best house in a bad neighborhood
B. Developed versus Emerging
C. Re-Coupled World from a policy perspective
1. Developed
– stagnant growth
– increased savings
– deflation risk
2. Emerging
– Slowing growth
– Easing cycle
D. Currency perspective
1. Normally, own the tightening monetary entities, sell the easing monetary entities
2. Current uncertainty/flights to quality favor the USD

Memory loss a global phenomenon?
A/O 9/12/11
For Institutional /Investment Professional Use Only. Not for Distribution to the Public.
10
Government Plus Financial Debt to GDP for Select Countries/Regions

For Institutional /Investment Professional Use Only. Not for Distribution to the Public.
11
Economic Environment
11
III. U.S. Fixed Income Considerations
A. Domestic economy growing
1. Seemingly sustainable
2. Growth in a de-leveraging environment?
a. Weight of history says slowly
b. Fiscal backdrop suggests carefully
B. Challenges: old, new & developing
1. Continued housing weakness; when will housing be positive for growth?
2. Duration of unemployment
3. European sovereign debt issues
C. Inflation considerations
1. Core vs. headline
2. Fed views as “transitory”
– no wage growth
3. Watch retail sales

For Institutional /Investment Professional Use Only. Not for Distribution to the Public.
1212
Economic Environment
12
D. Stimulus fading
1. QE3?
2. New fiscal package politically passable?
3. State and local cut-backs

Economic Environment
For Institutional /Investment Professional Use Only. Not for Distribution to the Public.
13
V. 2011 – 2012 Expectations
A. Rogoff and Rheinhart: Recoveries from Banking Crises are long, hard slogs
B. Growth slowdown: uneven sub-par U.S. growth
C. Bond sector returns relative vs. absolute
D. Rates gradually trend higher: 2 reasons
1. Better conditions and/or
2. Credit concerns: S&P downgrade watch

Bond Sector Opportunities In Post-Recession Years
15
For Institutional /Investment Professional Use Only. Not for Distribution to the Public.
Barclays Capital Index Returns
Treasury Mortgage Corporate Baa-Corporate High Yield Emerging
1990 8.55% 10.73% 7.06% 5.28% -9.59% N/A1991 15.31% 15.71% 18.52% 19.50% 46.19% N/A1992 7.21% 6.96% 8.69% 9.40% 15.75% N/A1993 10.68% 6.84% 12.16% 10.29% 17.12% 38.84%1994 -3.38% -1.61% -3.93% -3.02% -1.03% -13.74%
2002 11.79% 8.75% 10.12% 8.58% -1.41% 13.86%2003 2.24% 3.07% 8.24% 11.81% 28.97% 30.13%2004 3.54% 4.70% 5.39% 6.25% 11.13% 13.66%2005 2.79% 2.61% 1.68% 1.37% 2.74% 12.07%2006 3.08% 5.22% 4.30% 4.46% 11.85% 12.18%
2008 13.74% 8.34% -4.94% -8.67% -26.16% -16.16%2009 -3.57% 5.89% 16.04% 27.49% 58.21% 34.23%2010 5.87% 5.37% 9.00% 10.90% 15.12% 14.91%2011 9.81% 6.23% 8.15% 9.36% 4.98% 4.79%
Source: Barclays Capital
Past performance is no guarantee of future results. For illustrative purposes only and not representative of performance for any specific investment. A/O 12/31/2011.

Despite LTRO2, Europe is still mired in macroeconomic difficulties. U.S. growth and technical factors favor the dollar.
Overweight Investment Grade Corps, High Yield, CMBS and Emerging/International
Neutral MBS
Underweight Agencies and Treasuries
Valuations and carry are attractive in a world of low nominal yields.
Government policies could exacerbate prepayment risk. Historical returns for government bonds at low nominal yields are poor.
85% of index duration
Overweight select large banks, non-bank financials and industrials
Overweight USD
Slight Steepener
Current Positioning (Core Broad Portfolios)
Current positioning as of April 4, 2012
Historically, regimes of low rates have signaled prolonged periods of low, slow growth. Low rates and time eventually cure the patient. Emphasis on broad diversification.
Steepening likely without European contagion and higher U.S rates with Fed on hold.
Better than expected U.S. employment growth and other data points suggest worst-case scenarios are off the table, in the near term.
Rationale
YIELD CURVE ANALYSIS
CURRENCY MANAGEMENT
SECURITY SELECTION
SECTOR ALLOCATION
DURATION MANAGEMENT
Taxable Fixed Income Decision Tools
For Institutional/Investment Professional Use Only. Not for Distribution to the Public.
Shaded areas indicate change in positioning from previous month.
15
For Institutional /Investment Professional Use Only. Not for Distribution to the Public.
16
Federated Total Return Bond Fund
.
16
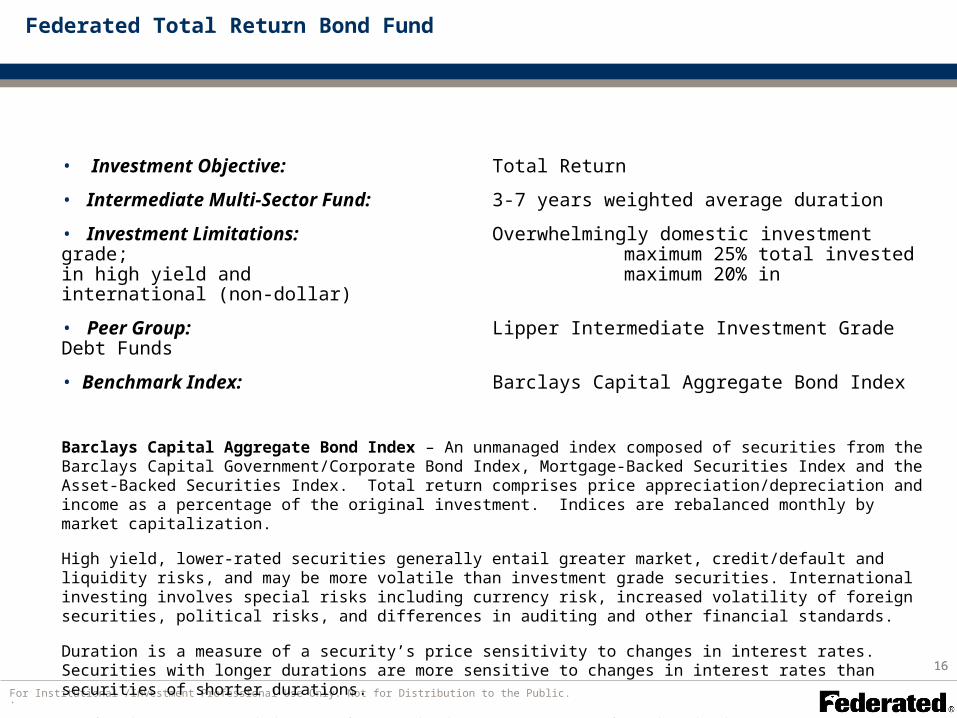
• Investment Objective: Total Return
• Intermediate Multi-Sector Fund: 3-7 years weighted average duration
• Investment Limitations: Overwhelmingly domestic investment grade; maximum 25% total invested in high yield and maximum 20% in international (non-dollar)
• Peer Group: Lipper Intermediate Investment Grade Debt Funds
• Benchmark Index: Barclays Capital Aggregate Bond Index
Barclays Capital Aggregate Bond Index – An unmanaged index composed of securities from the Barclays Capital Government/Corporate Bond Index, Mortgage-Backed Securities Index and the Asset-Backed Securities Index. Total return comprises price appreciation/depreciation and income as a percentage of the original investment. Indices are rebalanced monthly by market capitalization.
High yield, lower-rated securities generally entail greater market, credit/default and liquidity risks, and may be more volatile than investment grade securities. International investing involves special risks including currency risk, increased volatility of foreign securities, political risks, and differences in auditing and other financial standards.
Duration is a measure of a security’s price sensitivity to changes in interest rates. Securities with longer durations are more sensitive to changes in interest rates than securities of shorter durations.
Bond prices are sensitive to changes in interest rates and a rise in interest rates can cause a decline in their prices.

For Institutional/Investment Professional Use Only. Not for Distribution to the Public.
17
Federated Total Return Bond Fund Performance History as of 3/31/2012
1 YearReturn
1 YearRank
3 YearReturn
3 Year Rank
5 YearReturn
5 Year Rank
10 Year Return
10 Year Rank
Federated Total Return Bond Fund -Institutional Shares
7.45% 183 8.63% 325 6.68% 105 6.14% 55
Federated Total Return Bond Fund -A Shares NAV
6.86% 313 8.05% 363 6.11% 184 5.58% 135
Federated Total Return Bond Fund -A Shares Load
2.09% N/A 6.41% N/A 5.13% N/A 5.09% N/A
Lipper Intermediate Investment Grade Debt Average/Total Number of Funds (Ranking Based on Total Returns*)
6.88% 594 9.53% 512 5.61% 427 5.31% 301
Barclays Capital U.S. Aggregate Index 7.71% N/A 6.83% N/A 6.25% N/A 5.80% N/A
Rankings are based on total return and do not take sales charges into account.
Performance data quoted represents past performance which is no guarantee of future results. Investment return and principal value will fluctuate, so that an investor’s shares, when redeemed, may be worth more or less than their original cost. Mutual fund performance changes over time and current performance may be lower or higher than what is stated. For current to the most recent month-end performance and after-tax returns or for more information on Federated Funds, visit FederatedInvestors.com. Maximum offering price figures reflect the maximum sales charge of 4.5% for Class A Shares.
Returns quoted are average annual returns. Total return represents the change in the value of an investment after reinvesting all income and capital gains. Total return would have been lower in the absence of temporary expense waivers or reimbursements.
*Source: Lipper Inc. Lipper figures represent the average of the total returns reported by all of the mutual funds designated by Lipper Inc. as falling into the respective categories indicated. Lipper figures do not reflect sales charges. Lipper rankings are based on total return. Performance and rankings for other classes of shares will vary due to differences in charges and expenses.
For the 1 year, 3 year, 5 year and 10 year, the fund’s Service Shares returned 7.13%, 8.31%, 6.37% and 5.83%, respectively.
Performance shown is before-tax.

For Institutional /Investment Professional Use Only. Not for Distribution to the Public.
18
Federated Bond Fund Portfolio Management Policies
18
• Investment Grade Corporate Bond Fund
• Minimum 65% Investment Grade Securities*
• Ratings BBB/Baa and higher
• Portfolio Management Flexibility
• Interest rate exposure
• Quality/credit exposure
*Credit ratings pertain only to the securities in the portfolio and do not protect fund shares against market risk Securities rated below investment grade generally entail greater market, credit, and liquidity risks than investment grade securities and may include higher volatility and higher risk of default.
Bond prices are sensitive to changes in interest rates and a rise in interest rates can cause a decline in their prices.

For Institutional/Investment Professional Use Only. Not for Distribution to the Public.
19
Federated Bond Fund Performance History as of 3/31/2012
1 YearReturn
1 YearRank
3 YearReturn
3 Year Rank
5 YearReturn
5 Year Rank
10 Year Return
10 Year Rank
Federated Bond Fund – Institutional Shares 7.58% 65 15.33% 39 7.48% N/A 7.27% N/A
Federated Bond Fund – A Shares NAV 7.50% 69 15.12% 42 7.32% 36 7.20% 16
Federated Bond Fund – A Shares Load 2.70% N/A 13.39% N/A 6.33% N/A 6.71% N/A
Lipper Corporate BBB Debt Average/ Total Number of Funds (Ranking Based on Total Returns*)
8.14% 160 12.82% 142 6.47% 123 6.45% 77
Rankings are based on total return and do not take sales charges into account.
Performance data quoted represents past performance which is no guarantee of future results. Investment return and principal value will fluctuate, so that an investor’s shares, when redeemed, may be worth more or less than their original cost. Mutual fund performance changes over time and current performance may be lower or higher than what is stated. For current to the most recent month-end performance and after-tax returns or for more information on Federated Funds, visit FederatedInvestors.com. Maximum offering price figures reflect the maximum sales charge of 4.5% for Class A Shares.
Returns quoted are average annual returns. Total return represents the change in the value of an investment after reinvesting all income and capital gains. Total return would have been lower in the absence of temporary expense waivers or reimbursements.
*Source: Lipper Inc. Lipper figures represent the average of the total returns reported by all of the mutual funds designated by Lipper Inc. as falling into the respective categories indicated. Lipper figures do not reflect sales charges. Lipper rankings are based on total return. Performance and rankings for other classes of shares will vary due to differences in charges and expenses.
Performance shown is before-tax.

For Institutional /Investment Professional Use Only. Not for Distribution to the Public.
20
Federated Strategic Income Fund
20
3 Asset Classes
• High Yield Corporates
• Domestic High Quality
• International/Foreign
Bond prices are sensitive to changes in interest rates and a rise in interest rates can cause a decline in their prices.
High yield, lower-rated securities generally entail greater market, credit/default and liquidity risks, and may be more volatile than investment grade securities.
International investing involves special risks including currency risk, increased volatility, political risks, and differences in auditing and other financial standards.

For Institutional/Investment Professional Use Only. Not for Distribution to the Public.
21
Federated Strategic Income FundPerformance History as of 3/31/2012
1 YearReturn
1 YearRank
3 YearReturn
3 Year Rank
5 YearReturn
5 Year Rank
10 Year Return
10 Year Rank
Federated Strategic Income Fund – A Shares NAV 7.18% 31 15.94% 47 7.42% 23 8.33% 11
Federated Strategic Income Fund – A Shares Load 2.37% N/A 14.15% N/A 6.43% N/A 7.83% N/A
Lipper Multi-Sector Income Debt Average/ Total Number of Funds (Ranking Based on Total Returns*)
5.07% 181 14.42% 134 6.05% 105 7.26% 69
Rankings are based on total return and do not take sales charges into account.
Performance data quoted represents past performance which does not guarantee future results. Investment return and principal value will fluctuate, so that an investor’s shares, when redeemed, may be worth more or less than their original cost. Mutual fund performance changes over time and current performance may be lower or higher than what is stated. For current to the most recent month-end performance and after-tax returns, visit FederatedInvestors.com or call 1-800-341-7400. Offering price figures reflect the maximum sales charge of 4.5% for Class A Shares. See the prospectus for other fees and expenses that apply to a continued investment in the fund. Total return represents the change in value after reinvesting all income and capital gains. Total return would have been lower in the absence of certain fund expense waivers or reimbursements. Returns quoted are average annual returns.
*Source: Lipper Inc. Lipper figures represent the average of the total returns reported by all of the mutual funds designated by Lipper Inc. as falling into the respective categories indicated. Lipper figures do not reflect sales charges. Lipper rankings are based on total return. Performance and Lipper rankings are for the A shares. Performance and rankings for other classes of shares will vary due to differences in charges and expenses.
Performance shown is before-tax.

For Institutional /Investment Professional Use Only. Not for Distribution to the Public.
22
22
New Product Introductions“Absolute Return” Orientation
December 2010
A. Federated Floating Rate Strategic Income Fund
1. Short Duration
2. Managed in High Yield group
– leveraged bank loan focus
B. Federated Unconstrained Bond Fund
1. High total return objective
2. Concentrated approach to highest conviction ideas
3. Active/higher portfolio turnover

For Institutional/Investment Professional Use Only. Not for Distribution to the Public.
23
• High Total Return Objective
• More Concentrated; High Conviction Approach
• Inception Date December 13, 2010 IS Shares
• Morningstar Non-Traditional Bond Category
Federated Unconstrained Bond Fund
Bond prices are sensitive to changes in interest rates and a rise in interest rates can cause a decline in their prices. In addition to the risks generally associated with debt instruments, such as credit, market, interest rate, liquidity and derivatives risks, bank loans are also subject to the risk that the value of the collateral securing a loan may decline, be insufficient to meet the obligations of the borrower or be difficult to liquidate.International investing involves special risks including currency risk, increased volatility, political risks and differences in auditing and other financial standards. Prices of emerging –markets securities can be significantly more volatile than the prices of securities in developed countries , and currency risk and political risks are accentuated in emerging markets.High –yield, lower rate securities generally entail greater market, credit/default and liquidity risk and may be more volatile than investment-grade securities.

For Institutional/Investment Professional Use Only. Not for Distribution to the Public.
24
Federated Unconstrained Bond Fund Performance History as of 3/31/2012
3 MonthReturn
1 YearReturn
Since Inception
Federated Unconstrained Bond Fund – Institutional Shares (12/31/10 Inception)
3.53% 5.99% 8.68%
Federated Unconstrained Bond Fund – A Shares NAV (7/1/11 Inception)
3.49% N/A 4.95%
Federated Unconstrained Bond Fund –A Shares Load (7/1/11 Inception)
-1.18% N/A 0.19%
Lipper Multi-Sector Income Debt Average 3.96% 5.07% N/A
Performance data quoted represents past performance which does not guarantee future results. Investment return and principal value will fluctuate, so that an investor’s shares, when redeemed, may be worth more or less than their original cost. Mutual fund performance changes over time and current performance may be lower or higher than what is stated. For current to the most recent month-end performance and after-tax returns, visit FederatedInvestors.com or call 1-800-341-7400. Maximum Offering Price returns reflect the maximum sales charge of 4.5% for A shares. See the prospectus for other fees and expenses that apply to a continued investment in the fund. Total return represents the change in value after reinvesting all income and capital gains. Total return would have been lower in the absence of certain fund expense waivers or reimbursements. Returns quoted are average annual returns.
*Source: Lipper Inc. Lipper figures represent the average of the total returns reported by all of the mutual funds designated by Lipper Inc. as falling into the respective categories indicated. Lipper figures do not reflect sales charges. Performance for other classes of shares will vary due to difference in charges and expenses.
Performance shown is before-tax.

For Institutional/Investment Professional Use Only. Not for Distribution to the Public.
25
Federated Unconstrained Bond Fund – Institutional Shares
Federated Unconstrained Bond FundPrice Chart Since Inception
12/13/10 – 12/31/11
Source: Bloomberg
Past performance is no guarantee of future results.

For Institutional /Investment Professional Use Only. Not for Distribution to the Public.
26
There is no guarantee that the funds will achieve their investment objectives.Investors should carefully consider the fund’s investment objectives, risks, charges and expenses before investing. To obtain a summary prospectus or prospectus containing this and other information, contact us or visit FederatedInvestors.com. Please carefully read the summary prospectus or prospectus before investing.