bbva fixed income
TRANSCRIPT

1 BBVAFinance
BBVA, a unique growth proposition 3rd BBVA Iberian Fixed Income Conference
2
BBVA, a unique
growth proposition Erik Schotkamp, Capital & Funding Management Director
BBVA Iberian Fixed Income Conference
London, June 9th, 2015
3
Disclaimer
This document is only provided for information purposes and does not constitute, nor must it be interpreted as, an offer to sell or exchange or acquire,
or an invitation for offers to buy securities issued by any of the aforementioned companies. Any decision to buy or invest in securities in relation to a
specific issue must be made solely and exclusively on the basis of the information set out in the pertinent prospectus filed by the company in relation to
such specific issue. Nobody who becomes aware of the information contained in this report must regard it as definitive, because it is subject to changes
and modifications.
This document contains or may contain forward looking statements (in the usual meaning and within the meaning of the US Private Securities Litigation
Act of 1995) regarding intentions, expectations or projections of BBVA or of its management on the date thereof, that refer to miscellaneous aspects,
including projections about the future earnings of the business. The statements contained herein are based on our current projections, although the said
earnings may be substantially modified in the future by certain risks, uncertainty and other factors relevant that may cause the results or final decisions to
differ from such intentions, projections or estimates. These factors include, without limitation, (1) the market situation, macroeconomic factors,
regulatory, political or government guidelines, (2) domestic and international stock market movements, exchange rates and interest rates, (3) competitive
pressures, (4) technological changes, (5) alterations in the financial situation, creditworthiness or solvency of our customers, debtors or counterparts.
These factors could condition and result in actual events differing from the information and intentions stated, projected or forecast in this document and
other past or future documents. BBVA does not undertake to publicly revise the contents of this or any other document, either if the events are not
exactly as described herein, or if such events lead to changes in the information of this document.
This document may contain summarised information or information that has not been audited, and its recipients are invited to consult the
documentation and public information filed by BBVA with stock market supervisory bodies, in particular, the prospectuses and periodical information filed
with the Spanish Securities Exchange Commission (CNMV) and the Annual Report on form 20-F and information on form 6-K that are disclosed to the
US Securities and Exchange Commission.
Distribution of this document in other jurisdictions may be prohibited, and recipients into whose possession this document comes shall be solely
responsible for informing themselves about, and observing any such restrictions. By accepting this document you agree to be bound by the foregoing
restrictions.
4 4
Spain
USA Mexico
South America
Turkey
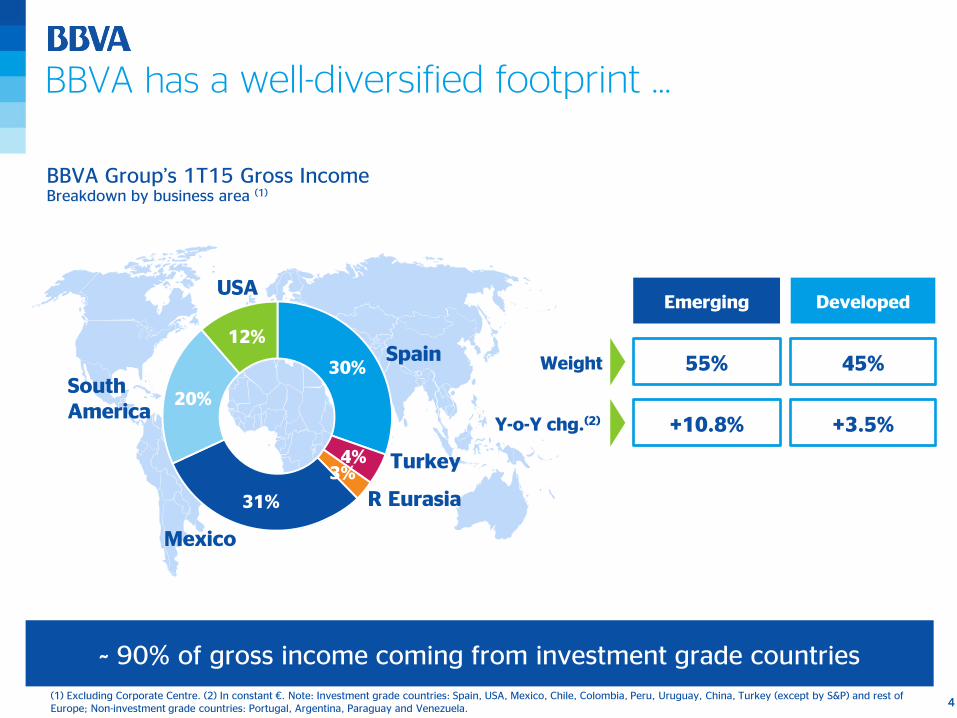
BBVA has a well-diversified footprint …
USA
(1) Excluding Corporate Centre. (2) In constant €. Note: Investment grade countries: Spain, USA, Mexico, Chile, Colombia, Peru, Uruguay, China, Turkey (except by S&P) and rest of Europe; Non-investment grade countries: Portugal, Argentina, Paraguay and Venezuela.
BBVA Group’s 1T15 Gross Income Breakdown by business area (1)
~ 90% of gross income coming from investment grade countries
Emerging Developed
Weight
Y-o-Y chg.(2)
55% 45%
+3.5% +10.8%
R Eurasia
30%
4% 3%
31%
20%
12%
5
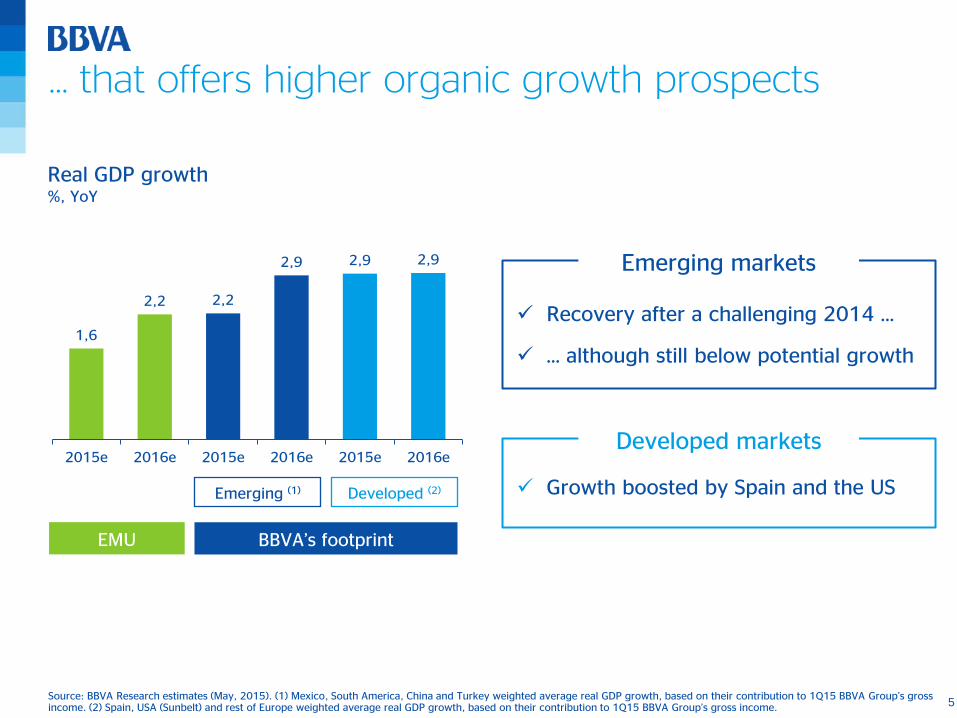
… that offers higher organic growth prospects
Real GDP growth %, YoY
Source: BBVA Research estimates (May, 2015). (1) Mexico, South America, China and Turkey weighted average real GDP growth, based on their contribution to 1Q15 BBVA Group’s gross income. (2) Spain, USA (Sunbelt) and rest of Europe weighted average real GDP growth, based on their contribution to 1Q15 BBVA Group’s gross income.
Recovery after a challenging 2014 …
… although still below potential growth
Growth boosted by Spain and the US
BBVA’s footprint
Emerging (1) Developed (2)
Emerging markets
Developed markets
EMU
1,6
2,2 2,2
2,9 2,9 2,9
2015e 2016e 2015e 2016e 2015e 2016e
6
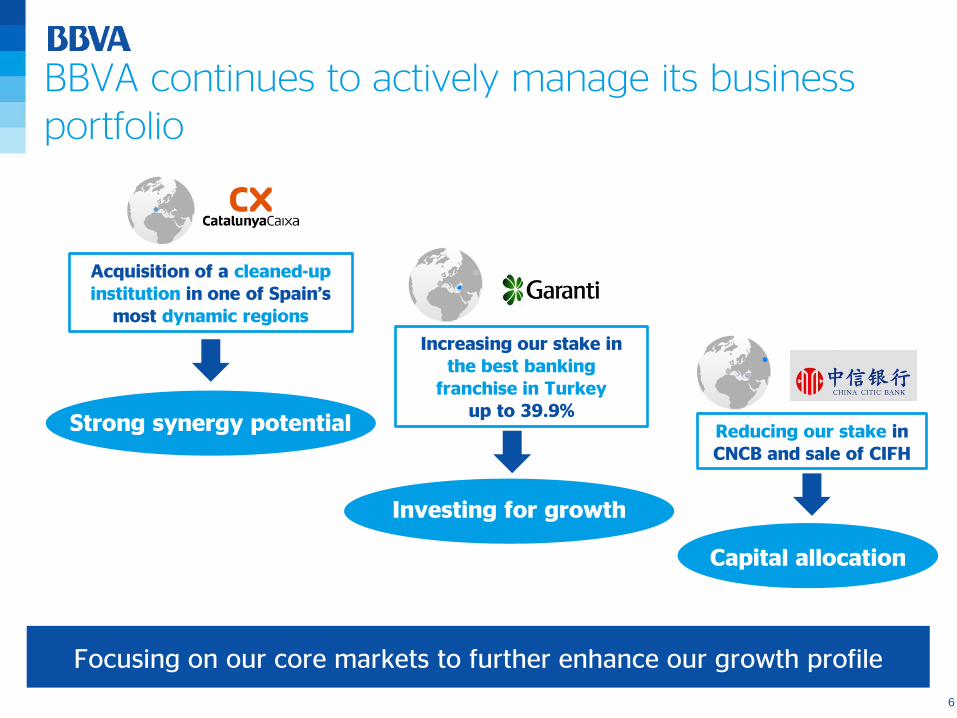
BBVA continues to actively manage its business portfolio
Reducing our stake in CNCB and sale of CIFH
Capital allocation
Increasing our stake in the best banking
franchise in Turkey up to 39.9%
Investing for growth
Acquisition of a cleaned-up institution in one of Spain’s
most dynamic regions
Strong synergy potential
Focusing on our core markets to further enhance our growth profile
7
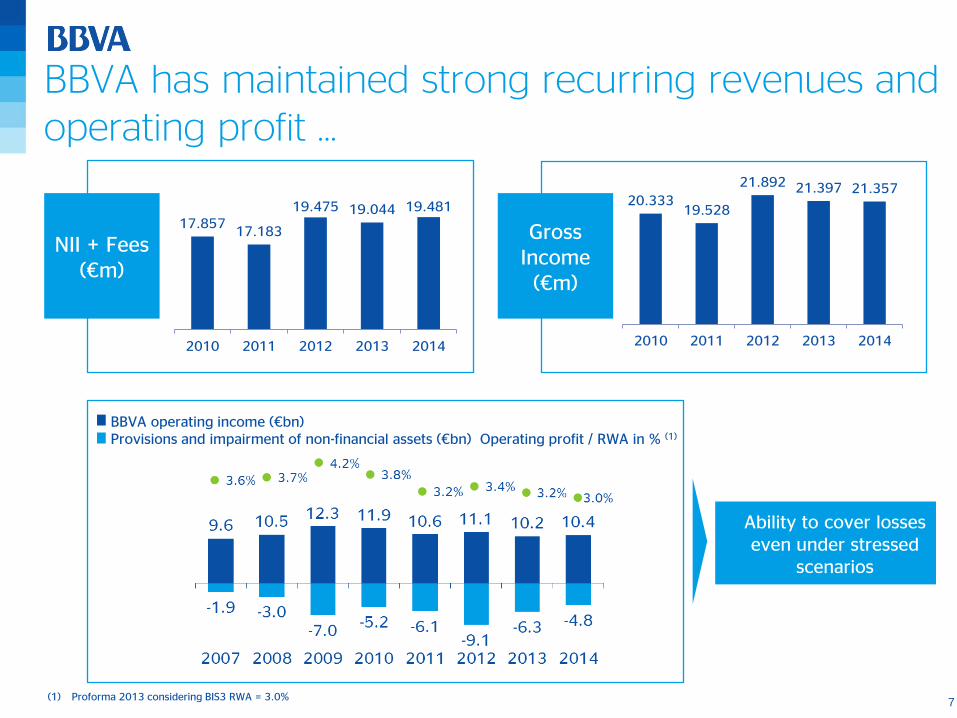
BBVA has maintained strong recurring revenues and operating profit …
NII + Fees (€m)
Gross Income (€m)
17.857 17.183
19.475 19.044 19.481
2010 2011 2012 2013 2014
20.333 19.528
21.892 21.397 21.357
2010 2011 2012 2013 2014
BBVA operating income (€bn) Provisions and impairment of non-financial assets (€bn) Operating profit / RWA in % (1)
Ability to cover losses even under stressed
scenarios
(1) Proforma 2013 considering BIS3 RWA = 3.0%
8
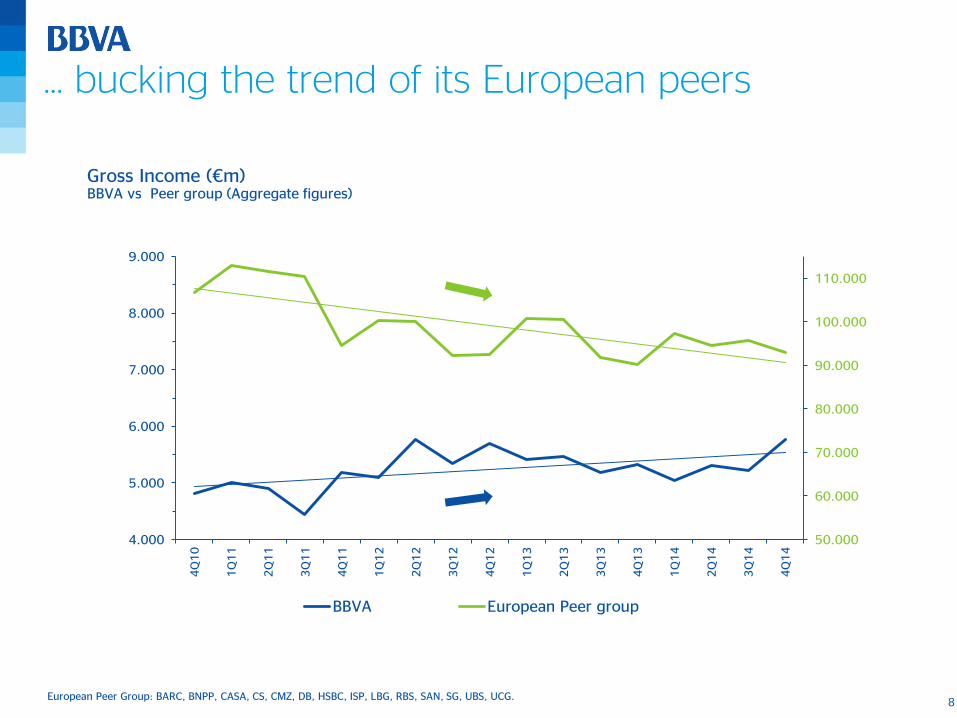
… bucking the trend of its European peers
Gross Income (€m) BBVA vs Peer group (Aggregate figures)
50.000
60.000
70.000
80.000
90.000
100.000
110.000
4.000
5.000
6.000
7.000
8.000
9.000
4Q
10
1Q
11
2Q
11
3Q
11
4Q
11
1Q
12
2Q
12
3Q
12
4Q
12
1Q
13
2Q
13
3Q
13
4Q
13
1Q
14
2Q
14
3Q
14
4Q
14
BBVA European Peer group
European Peer Group: BARC, BNPP, CASA, CS, CMZ, DB, HSBC, ISP, LBG, RBS, SAN, SG, UBS, UCG.
9
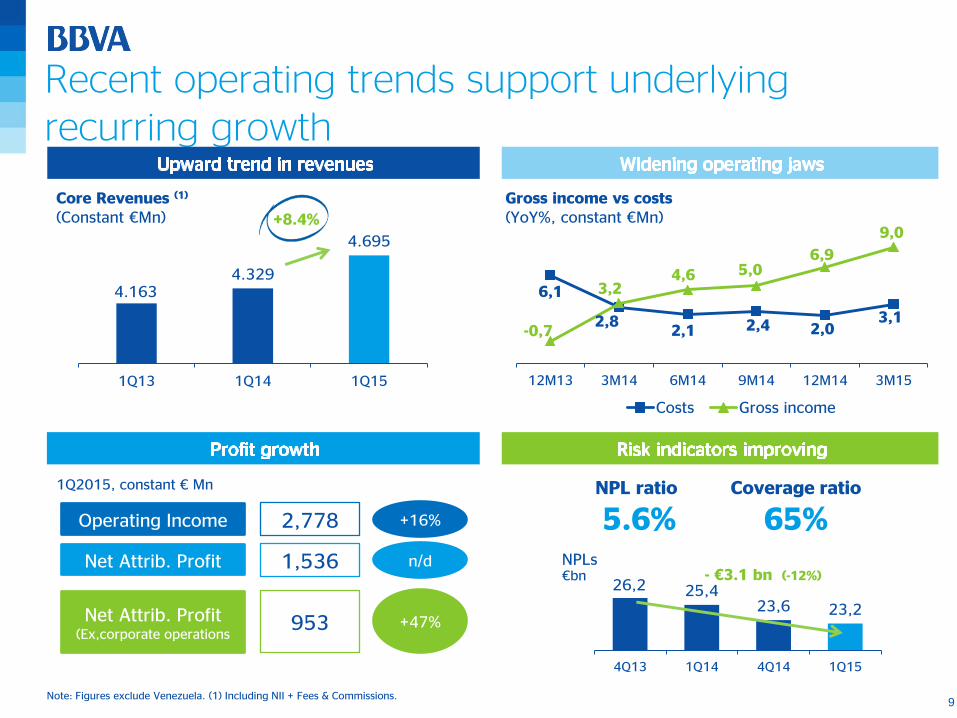
6,1
2,8 2,1 2,4 2,0
3,1 -0,7
3,2 4,6 5,0
6,9
9,0
12M13 3M14 6M14 9M14 12M14 3M15
Costs Gross income
Recent operating trends support underlying recurring growth
Note: Figures exclude Venezuela. (1) Including NII + Fees & Commissions.
4.163 4.329
4.695
1Q13 1Q14 1Q15
Core Revenues (1)
(Constant €Mn) +8.4%
Gross income vs costs
(YoY%, constant €Mn)
NPL ratio
5.6% Coverage ratio
65%
26,2 25,4 23,6 23,2
4Q13 1Q14 4Q14 1Q15
NPLs €bn - €3.1 bn (-12%)
2,778 Operating Income +16%
1,536 Net Attrib. Profit n/d
953 Net Attrib. Profit (Ex,corporate operations
+47%
1Q2015, constant € Mn
10
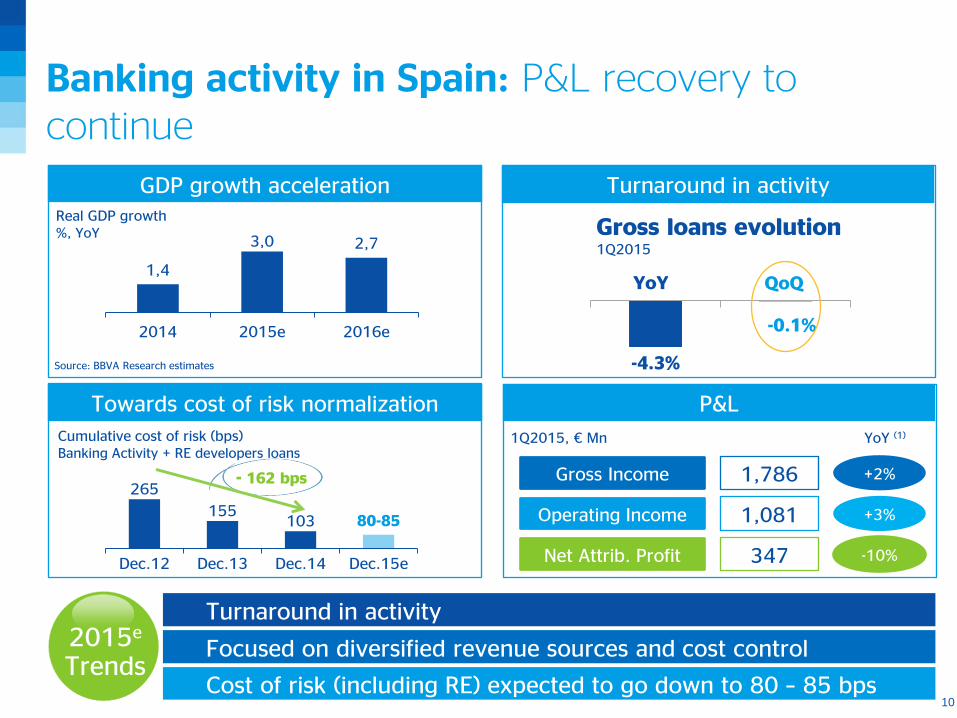
Banking activity in Spain: P&L recovery to continue
Towards cost of risk normalization
GDP growth acceleration Turnaround in activity Real GDP growth %, YoY
1,4
3,0 2,7
2014 2015e 2016e
Gross loans evolution 1Q2015
Cumulative cost of risk (bps) Banking Activity + RE developers loans
265
155 103 80-85
Dec.12 Dec.13 Dec.14 Dec.15e
- 162 bps
Turnaround in activity
Focused on diversified revenue sources and cost control
Cost of risk (including RE) expected to go down to 80 – 85 bps
Source: BBVA Research estimates
1,786 Gross Income +2%
1,081 Operating Income +3%
347 Net Attrib. Profit -10%
1Q2015, € Mn YoY (1)
-4.3%
-0.1%
YoY QoQ
P&L
2015e
Trends
11
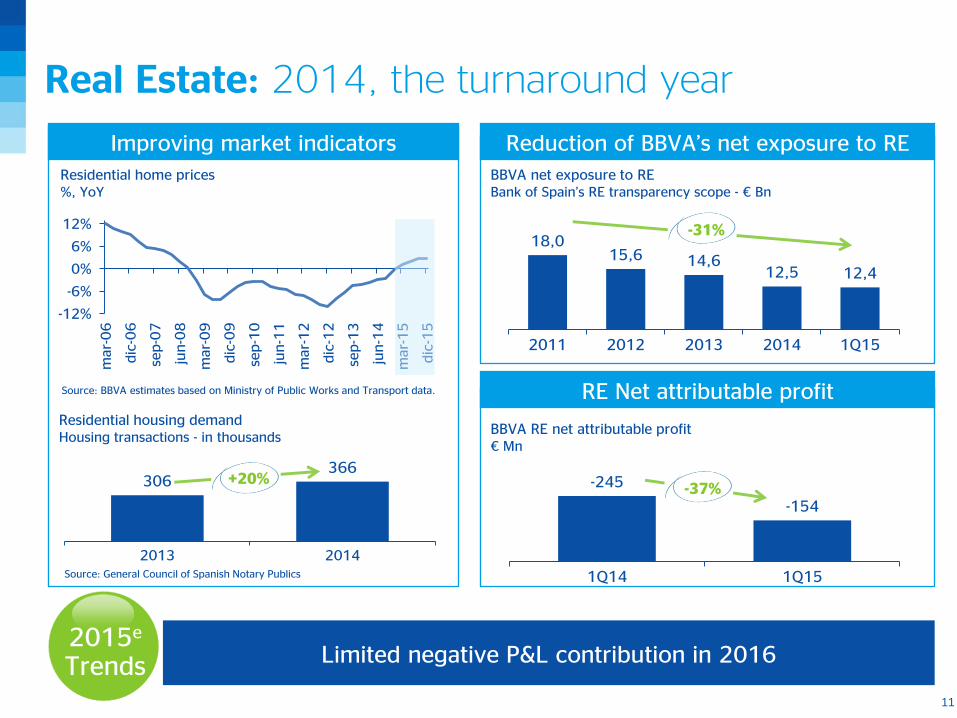
Real Estate: 2014, the turnaround year
Reduction of BBVA’s net exposure to RE Improving market indicators
Residential housing demand Housing transactions - in thousands
RE Net attributable profit
BBVA RE net attributable profit € Mn
306 366
2013 2014Source: General Council of Spanish Notary Publics
+20%
Source: BBVA estimates based on Ministry of Public Works and Transport data.
BBVA net exposure to RE Bank of Spain’s RE transparency scope - € Bn
18,0 15,6 14,6
12,5 12,4
2011 2012 2013 2014 1Q15
-31%
-245
-154
1Q14 1Q15
Residential home prices %, YoY
Limited negative P&L contribution in 2016
-37%
-12%
-6%
0%
6%
12%
mar-
06
dic
-06
sep-0
7
jun-0
8
mar-
09
dic
-09
sep-1
0
jun-1
1
mar-
12
dic
-12
sep-1
3
jun-1
4
mar-
15
dic
-15
2015e
Trends
12
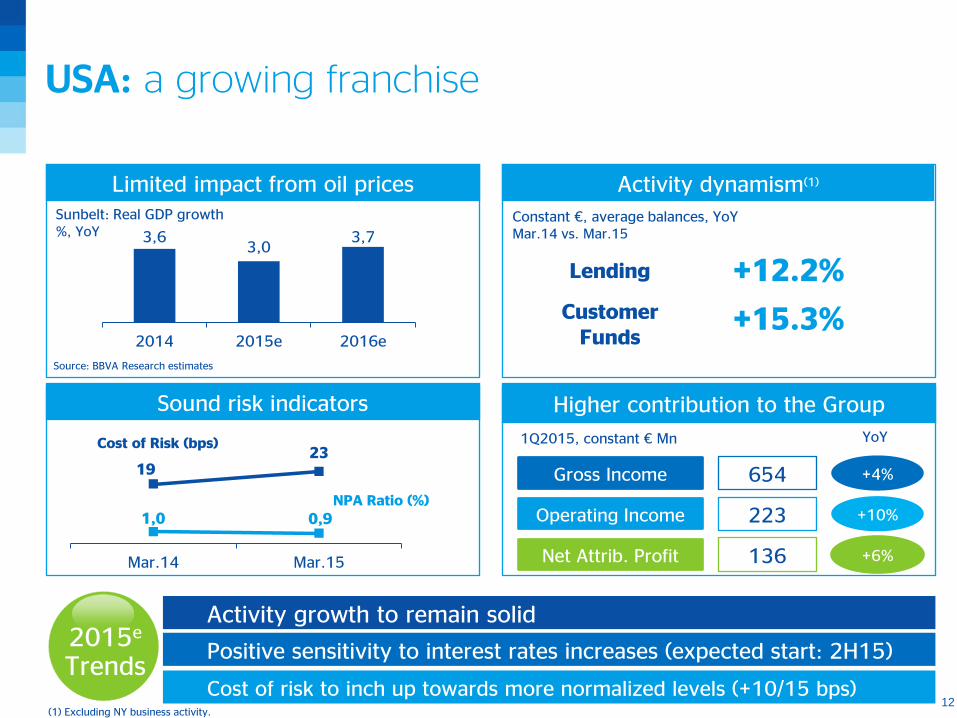
USA: a growing franchise
Sound risk indicators
Limited impact from oil prices
Lending +12.2%
+15.3% Customer Funds
Higher contribution to the Group
Activity dynamism(1)
Constant €, average balances, YoY Mar.14 vs. Mar.15
Sunbelt: Real GDP growth %, YoY 3,6
3,0 3,7
2014 2015e 2016e
(1) Excluding NY business activity.
Source: BBVA Research estimates
654 Gross Income +4%
223 Operating Income +10%
136 Net Attrib. Profit +6%
YoY
Activity growth to remain solid
Positive sensitivity to interest rates increases (expected start: 2H15)
Cost of risk to inch up towards more normalized levels (+10/15 bps)
1Q2015, constant € Mn
1,0 0,9
19 23
0
10
20
30
0
2
4
6
8
Mar.14 Mar.15
NPA Ratio (%)
Cost of Risk (bps)
2015e
Trends
13
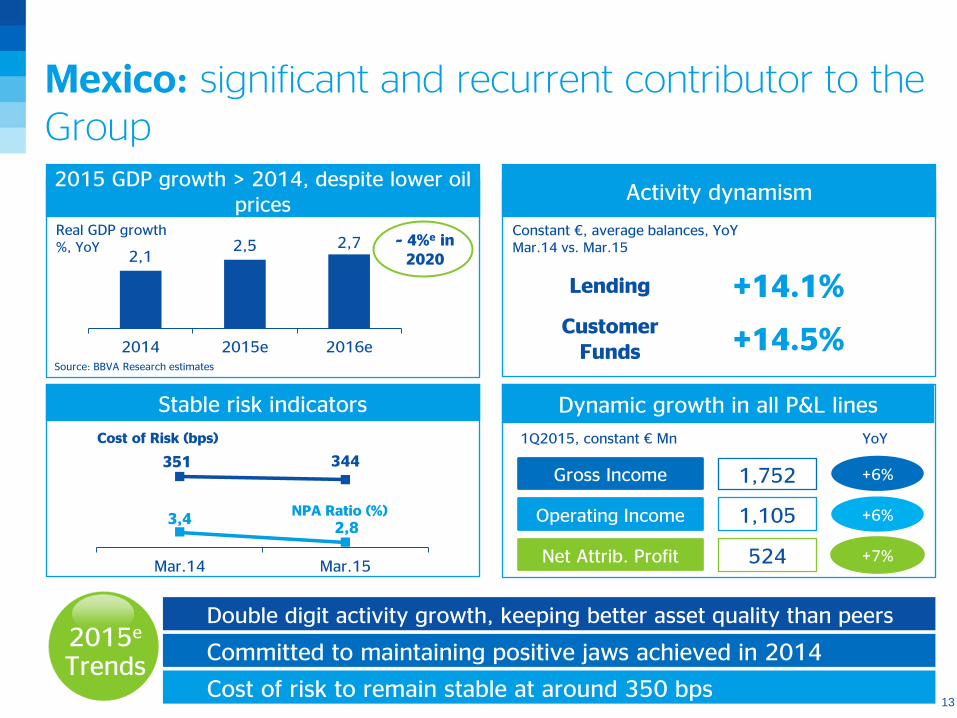
3,4 2,8
351 344
200
250
300
350
400
2,5
4,5
6,5
Mar.14 Mar.15
Mexico: significant and recurrent contributor to the Group
NPA Ratio (%)
Cost of Risk (bps)
Stable risk indicators
2015 GDP growth > 2014, despite lower oil prices
Double digit activity growth, keeping better asset quality than peers
Committed to maintaining positive jaws achieved in 2014
Cost of risk to remain stable at around 350 bps
Lending +14.1%
+14.5% Customer
Funds
Dynamic growth in all P&L lines
Activity dynamism
Constant €, average balances, YoY Mar.14 vs. Mar.15
1,752 Gross Income +6%
1,105 Operating Income +6%
524 Net Attrib. Profit +7%
1Q2015, constant € Mn YoY
Real GDP growth %, YoY
2,1 2,5 2,7
2014 2015e 2016e
~ 4%e in 2020
Source: BBVA Research estimates
2015e
Trends
14
2,2 2,3
123 121
0
50
100
150
200
1,8
2,3
2,8
3,3
Mar.14 Mar.15
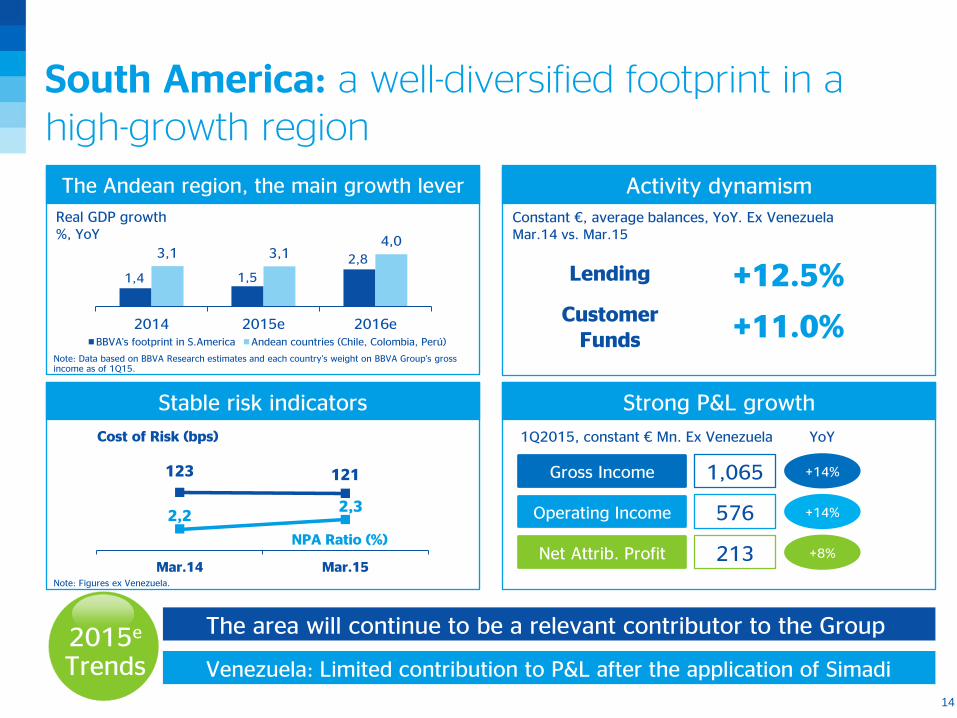
South America: a well-diversified footprint in a high-growth region
NPA Ratio (%)
Cost of Risk (bps)
Stable risk indicators
The Andean region, the main growth lever
The area will continue to be a relevant contributor to the Group
Venezuela: Limited contribution to P&L after the application of Simadi
Lending +12.5%
+11.0% Customer Funds
Strong P&L growth
Activity dynamism
Constant €, average balances, YoY. Ex Venezuela Mar.14 vs. Mar.15
1Q2015, constant € Mn. Ex Venezuela YoY
Real GDP growth %, YoY
1,4 1,5
2,8 3,1 3,1 4,0
2014 2015e 2016eBBVA's footprint in S.America Andean countries (Chile, Colombia, Perú)
1,065 Gross Income +14%
576 Operating Income +14%
213 Net Attrib. Profit +8%
Note: Data based on BBVA Research estimates and each country’s weight on BBVA Group’s gross income as of 1Q15.
Note: Figures ex Venezuela.
2015e
Trends
15
2,4 2,3
89 88
-401060110
Mar.14 Mar.15
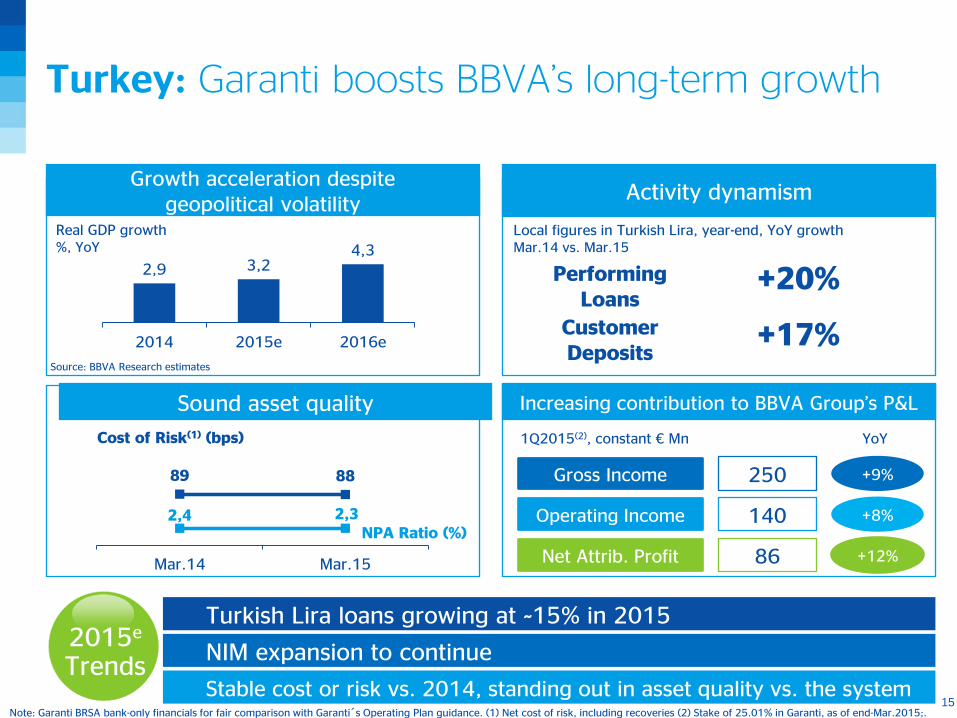
Turkey: Garanti boosts BBVA’s long-term growth
NPA Ratio (%)
Cost of Risk(1) (bps)
Sound asset quality
Turkish Lira loans growing at ~15% in 2015
NIM expansion to continue
Stable cost or risk vs. 2014, standing out in asset quality vs. the system
Performing Loans
+20%
+17%
Customer Deposits
Increasing contribution to BBVA Group’s P&L
Activity dynamism
250 Gross Income +9%
140 Operating Income +8%
86 Net Attrib. Profit +12%
1Q2015(2), constant € Mn YoY
Real GDP growth %, YoY
2,9 3,2 4,3
2014 2015e 2016e
Note: Garanti BRSA bank-only financials for fair comparison with Garanti´s Operating Plan guidance. (1) Net cost of risk, including recoveries (2) Stake of 25.01% in Garanti, as of end-Mar.2015;.
Source: BBVA Research estimates
Growth acceleration despite geopolitical volatility
Local figures in Turkish Lira, year-end, YoY growth Mar.14 vs. Mar.15
2015e
Trends
16
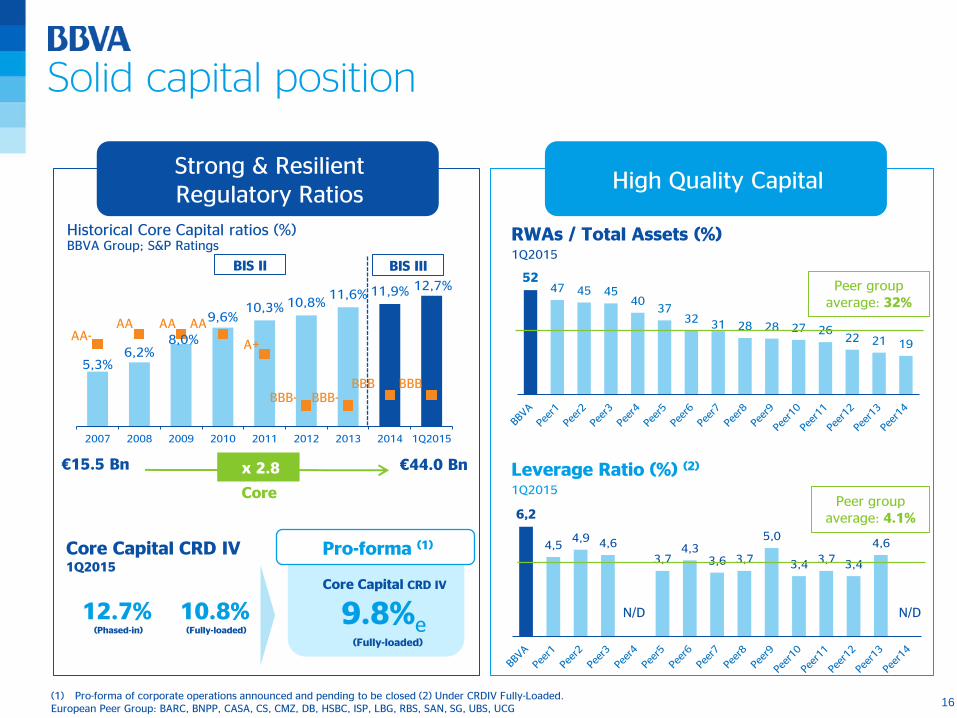
Solid capital position
10.8% (Fully-loaded)
Core Capital CRD IV
Pro-forma (1)
Strong & Resilient Regulatory Ratios
Core Capital CRD IV 1Q2015
(Fully-loaded)
9.8%e
(1) Pro-forma of corporate operations announced and pending to be closed (2) Under CRDIV Fully-Loaded. European Peer Group: BARC, BNPP, CASA, CS, CMZ, DB, HSBC, ISP, LBG, RBS, SAN, SG, UBS, UCG
RWAs / Total Assets (%)
1Q2015
High Quality Capital
52 47 45 45
40 37
32 31 28 28 27 26 22 21 19
6,2
4,5 4,9 4,6
3,7 4,3
3,6 3,7
5,0
3,4 3,7 3,4
4,6
N/D N/D
Peer group average: 32%
Peer group average: 4.1%
Leverage Ratio (%) (2)
1Q2015
5,3% 6,2%
8,0%
9,6% 10,3% 10,8%
11,6% 11,9% 12,7%
2007 2008 2009 2010 2011 2012 2013 2014 1Q2015
AA- AA
A+
BBB- BBB- BBB BBB
Core
€15.5 Bn €44.0 Bn x 2.8
BIS III BIS II
AA AA
12.7% (Phased-in)
Historical Core Capital ratios (%) BBVA Group; S&P Ratings
17
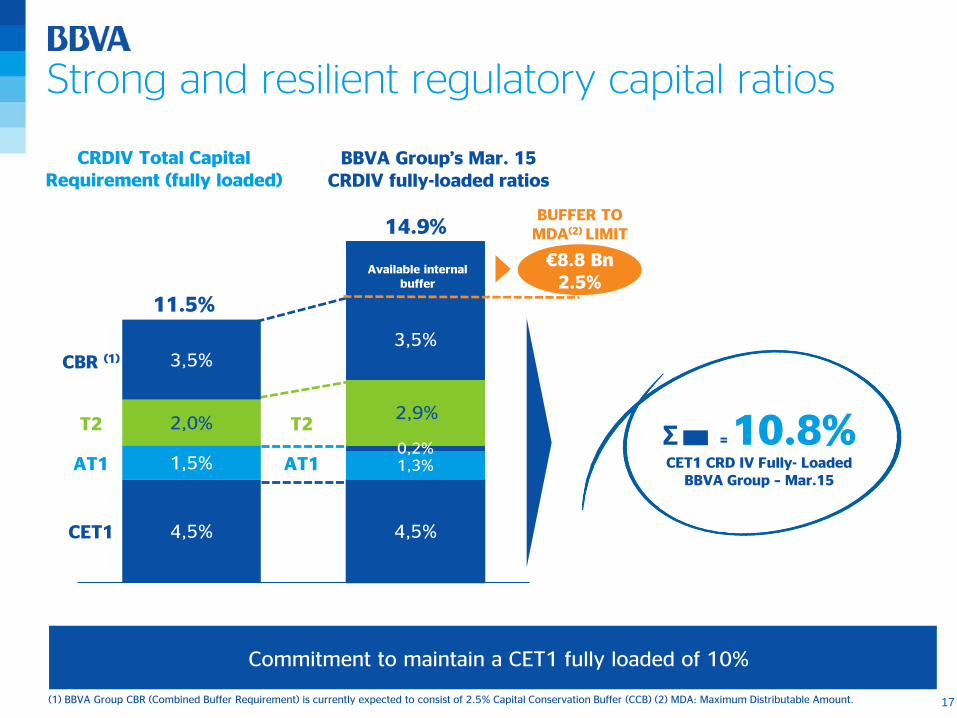
Commitment to maintain a CET1 fully loaded of 10%
Strong and resilient regulatory capital ratios
Σ = 10.8% CET1 CRD IV Fully- Loaded
BBVA Group – Mar.15
CRDIV Total Capital Requirement (fully loaded)
BBVA Group’s Mar. 15 CRDIV fully-loaded ratios
4,5%
1,3% 0,2%
2,9%
3,5%
0%
2%
4%
6%
8%
10%
12%
14%
4,5%
1,5%
2,0%
3,5%
0%
2%
4%
6%
8%
10%
12%
14%
CET1
AT1
T2
CBR (1)
11.5%
BUFFER TO MDA(2) LIMIT
€8.8 Bn 2.5%
Available internal buffer
AT1
T2
14.9%
(1) BBVA Group CBR (Combined Buffer Requirement) is currently expected to consist of 2.5% Capital Conservation Buffer (CCB) (2) MDA: Maximum Distributable Amount.
18
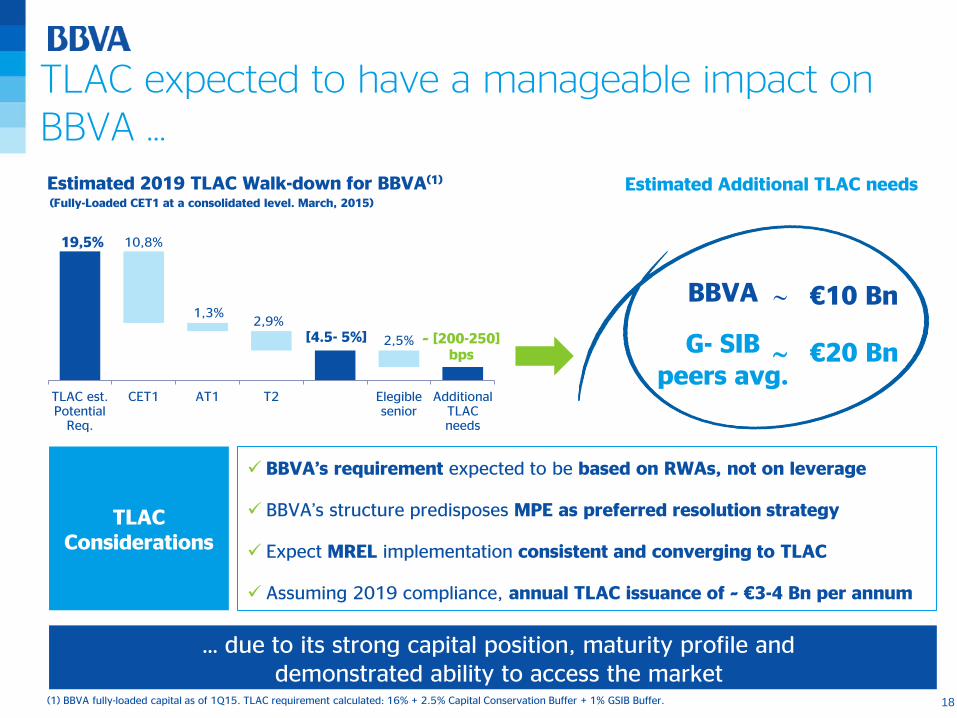
TLAC expected to have a manageable impact on BBVA … Estimated 2019 TLAC Walk-down for BBVA(1)
(Fully-Loaded CET1 at a consolidated level. March, 2015)
Estimated Additional TLAC needs
… due to its strong capital position, maturity profile and demonstrated ability to access the market
BBVA
G- SIB peers avg.
TLAC Considerations
BBVA’s requirement expected to be based on RWAs, not on leverage
BBVA’s structure predisposes MPE as preferred resolution strategy
Expect MREL implementation consistent and converging to TLAC
Assuming 2019 compliance, annual TLAC issuance of ~ €3-4 Bn per annum
(1) BBVA fully-loaded capital as of 1Q15. TLAC requirement calculated: 16% + 2.5% Capital Conservation Buffer + 1% GSIB Buffer.
€10 Bn
€20 Bn
19,5%
[4.5- 5%] ~ [200-250] bps
10,8%
1,3% 2,9%
2,5%
TLAC est.Potential
Req.
CET1 AT1 T2 Elegiblesenior
AdditionalTLACneeds
19
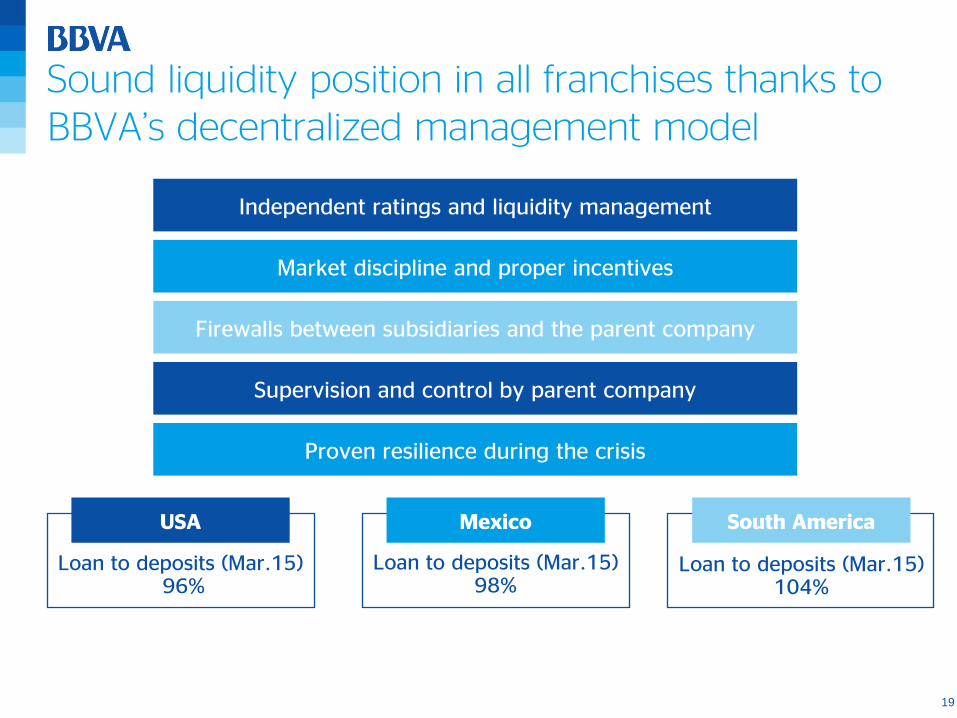
Sound liquidity position in all franchises thanks to BBVA’s decentralized management model
Supervision and control by parent company
Independent ratings and liquidity management
Market discipline and proper incentives
Firewalls between subsidiaries and the parent company
Proven resilience during the crisis
USA
Loan to deposits (Mar.15) 96%
Loan to deposits (Mar.15) 98%
South America
Loan to deposits (Mar.15) 104%
Mexico
20
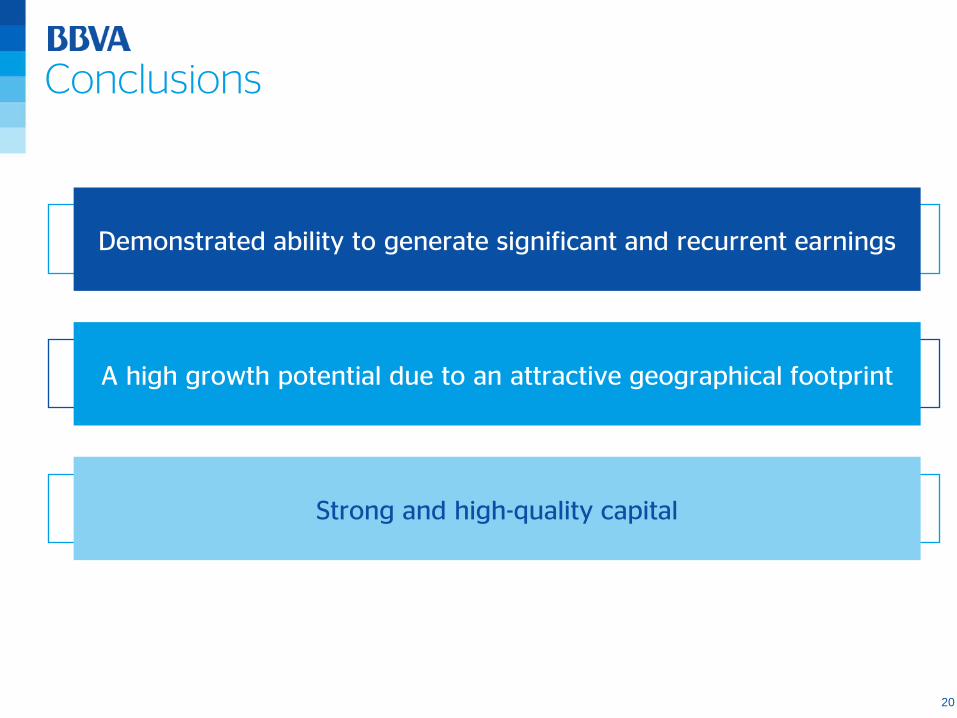
Conclusions
Strong and high-quality capital
A high growth potential due to an attractive geographical footprint
Demonstrated ability to generate significant and recurrent earnings
21
BBVA, a unique
growth proposition Erik Schotkamp, Capital & Funding Management Director
BBVA Iberian Fixed Income Conference
London, June 9th, 2015
22
Appendix
23
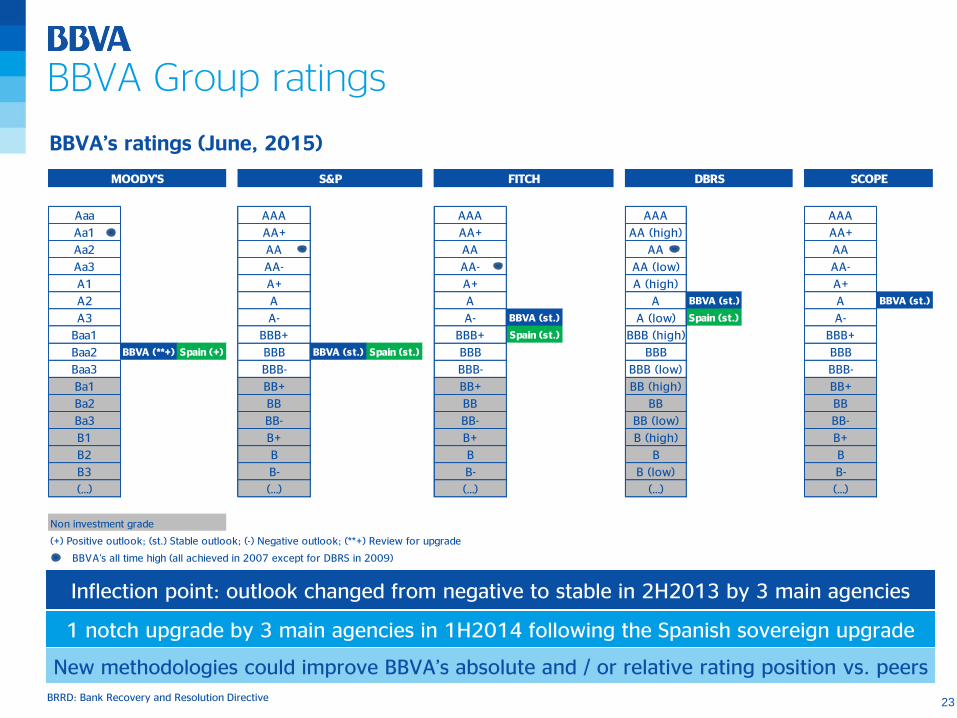
BBVA Group ratings
Inflection point: outlook changed from negative to stable in 2H2013 by 3 main agencies
1 notch upgrade by 3 main agencies in 1H2014 following the Spanish sovereign upgrade
New methodologies could improve BBVA’s absolute and / or relative rating position vs. peers
Aaa AAA AAA AAA AAA
Aa1 AA+ AA+ AA (high) AA+
Aa2 AA AA AA AA
Aa3 AA- AA- AA (low) AA-
A1 A+ A+ A (high) A+
A2 A A A BBVA (st.) A BBVA (st.)
A3 A- A- BBVA (st.) A (low) Spain (st.) A-
Baa1 BBB+ BBB+ Spain (st.) BBB (high) BBB+
Baa2 BBVA (**+) Spain (+) BBB BBVA (st.) Spain (st.) BBB BBB BBB
Baa3 BBB- BBB- BBB (low) BBB-
Ba1 BB+ BB+ BB (high) BB+
Ba2 BB BB BB BB
Ba3 BB- BB- BB (low) BB-
B1 B+ B+ B (high) B+
B2 B B B B
B3 B- B- B (low) B-
(…) (…) (…) (…) (…)
(+) Positive outlook; (st.) Stable outlook; (-) Negative outlook; (**+) Review for upgrade
BBVA's all time high (all achieved in 2007 except for DBRS in 2009)
MOODY'S S&P FITCH DBRS SCOPE
Non investment grade
BBVA’s ratings (June, 2015)
BRRD: Bank Recovery and Resolution Directive