north carolina’s disruptive demographics: … carolina’s disruptive demographics: implications...
TRANSCRIPT

North Carolina’s Disruptive Demographics: Implications for K-12 and Higher Education
May 2016
James H. Johnson, Jr. Frank Hawkins Kenan Institute of Private Enterprise
Kenan-Flagler Business School University of North Carolina at Chapel Hill
388/492

6 DISRUPTIVE TRENDS
• The South Rises – Again• The Browning of America• Marrying Out is “In”• The Silver Tsunami is About Hit • The End of Men?• Cooling Water from Grandma’s Well…
and Grandpa’s Too!2389/492

OVERVIEW
• Two colorful demographic processes
• The Triple Whammy of Geographic Disadvantage
• Responding to the Challenges
• Discussion 390/492

Two ‘colorful’ demographic processes are drivers of change
Browning & Graying of America
391/492

The “Browning” of America
Immigration-driven population change
392/492

U.S. Immigrant Population, 1900-2014
10.313.5 13.9 14.2
11.6 10.3 9.7 9.6
14.1
19.8
31.135.2
42.2
0
5
10
15
20
25
30
35
40
45
1900 1910 1920 1930 1940 1950 1960 1970 1980 1990 2000 2005 2014
Num
ber o
f Im
mig
rant
s (in
mill
ions
)
Year
393/492

U.S. Foreign Born Population by Race/Ethnicity, 2014
Race/Ethnicity Foreign Population Share of Total (%)
Total 42,235,749 100.0Hispanic 19,300,947 45.7White Alone, not Hispanic
7,655,008 18.1
Black Alone, not Hispanic
3,377,733 8.0
Asian Alone, not Hispanic
11,036,059 26.1
Other Alone, not Hispanic
866,002 2.1
7394/492

INTERMARRIAGE TREND, 1980-2008 % Married Someone of a Different Race/Ethnicity
May 2016 8395/492

INTERMARRIAGE TYPESNewly Married Couples in 2008
May 2016 9396/492

NON-WHITE AND HISPANIC SHARES OF POPULATION GROWTH, 2000-2010
Area
AbsolutePopulation
ChangeNon-White
ShareHispanic
ShareUS 27,323,632 91.7 55.5
South 14,318,924 79.6 46.4
Texas 4,293,741 89.2 65.0
Florida 2,818,932 84.9 54.7
Georgia 1,501,206 81.0 27.9
NC 1,486,170 61.2 28.3
397/492

MEDIAN AGE OF U.S. POPULATION BY RACE, HISPANIC ORIGIN & GENDER, 2014
Race Total Male FemaleUnited States 37.7 36.3 39.0White Alone 40.4 39.0 39.6White, Non-Hispanic 43.1 41.7 41.8Black Alone 33.4 31.6 35.1AI/AN Alone 32.5 31.1 33.6Asian Alone 36.5 35.3 37.7NH/PI Alone 30.8 30.3 31.6Two or More Races 19.6 19.1 20.2Hispanic 28.4 27.9 29.1
September 2014 11398/492

RELATIVE DISTRIBUTION OF U.S. BIRTHS BY RACE / ETHNICITYRace/Ethnicity 1990 2008 2011
White 66% 50% 49.6%
Blacks 17% 16% 15.0%
Hispanics 15% 26% 26.0%
Other 2% 8% 9.4%
Source: Johnson and Lichter (2010); Tavernise (2011).
399/492

RELATIVE DISTRIBUTION OF U.S. POPULATION BY RACE / ETHNICITY
Race/Ethnicity 2005 2050
White 67% 47%
Blacks 12.8% 13%
Hispanics 14% 29%
Asian 5% 9%
Source: Pew Research Center, 2008 *projected.
400/492

The “Graying” of America
The Silver Tsunami is about to hit
401/492

Key Drivers
• Changes in Longevity
• Declining Fertility
• Aging of Boomer Cohort
402/492

Average Life Expectancy through History
Period Life ExpectancyCro-Magnon Era 18The Renaissance 30America in 1850 43America Today 78Developed World in 2030
101
Source: Arrison (2011)
403/492

TOTAL FERTILITY RATES FOR U.S. WOMEN BY RACE/ETHNICITY, 2012
Race/Ethnicity Total Fertility Rate
All Races 1.88
Hispanic 2.18
Non-Hispanic White 1.76
Blacks 1.90
Asian 1.77
Native American 1.35404/492

U.S. POPULATION CHANGE BY AGE, 2000-2010
Age 2010
Absolute Change
2000 - 2010
Percentage Change
2000 - 2010
<25 104,853,555 5,416,289 5.4%
25-44 82,134,554 -2,905,697 -3.4%
45-64 81,489,445 19,536,809 31.5%
65+ 40,267,984 5,276,231 15.1%
TOTAL 308,745,538 27,323,632 9.7%405/492

U.S. POPULATION TURNING 50, 55, 62, AND 65 YEARS OF AGE, (2007-2015)
Age 50
Age 55
Age 62
Age 65
Average Number/Day 12,344 11,541 9,221 8,032
Average Number/Minute 8.6 8.0 6.4 5.6
May 2016 19406/492

Absolute and Percent PopulationChange by Age, 2000-2010
Age
All Ages
<25
United States
27,323,632(9.7%)5,416,292(5.4%)
North Carolina
1,486,170 (18.5%)449,385 (16.2%)
25-44
45-64
65+
-2,905,697(-3.4%)19,536,809(31.5%)5,276,231(15.1%)
73,209 (2.9%)698,545 (38.6% )265,031 (27.3% )
407/492

The Triple Whammy of Geographical Disadvantage
The Human Capital Challenge
408/492

Racial Typology of U.S. Counties
409/492

Racial Typology of U.S. Counties
410/492

Racial Typology of U.S. Counties
411/492

U.S. Racial Segregation by Census Tract
412/492

U.S. Racial Segregation by Census Tract
413/492
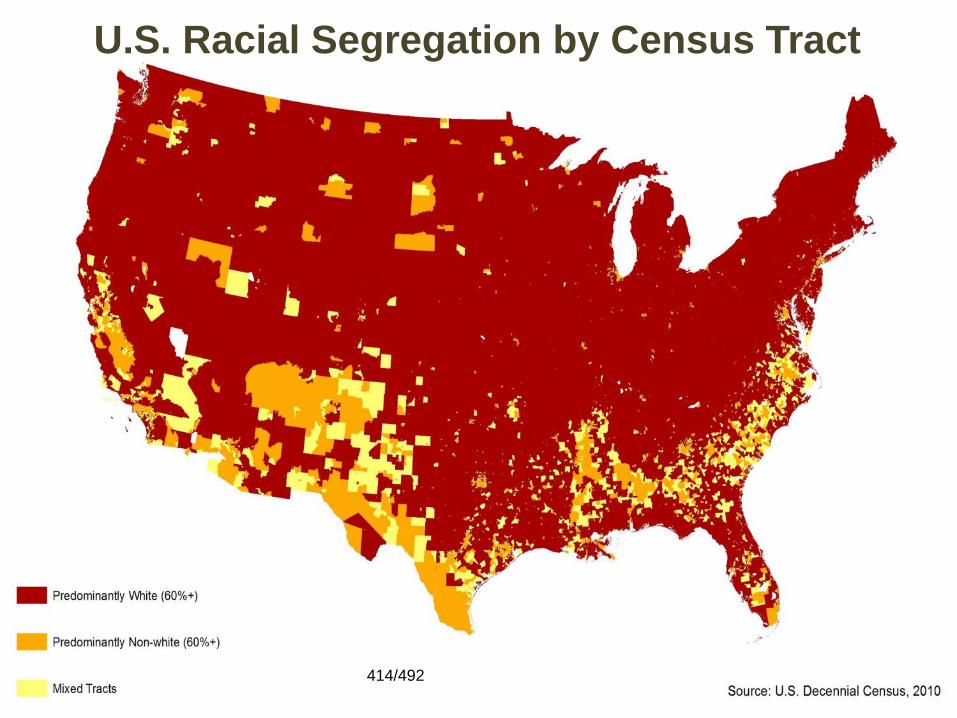
U.S. Racial Segregation by Census Tract
414/492

U.S. School Age Poverty by Census Tract
415/492

U.S. School Age Poverty by Census Tract
416/492

U.S. School Age Poverty by Census Tract
417/492

The Triple Whammy of Geographic Disadvantage
418/492

Summary Indicators of Exposure
Level of Vulnerability
Number of Youth Percent Non-White
Triple Whammy 9.8 million 93Double Whammy
12.2 million 81
Single Whammy 20.0 million 39No Whammy 32.1 million 24
419/492

420/492

421/492

422/492

NC’s Triple Whammy of Geographical Disadvantage
The Human Capital Challenge
423/492

Absolute and Percent Population Change, 2000-2010
Area 2010 Population
Absolute Change2000-2010
Percent Change2000-2010
U.S. 308,745,538 27,323,632 9.7%South 114,555,744 14,318,924 14.3%North Carolina
9,335,483 1,46,120 18.5%
424/492

425/492

NORTH CAROLINA POPULATION GROWTH BY NATIVITY, RACE, AND
ETHNICITY, 1990-2007
129%
547%
127% 133%
829%
332%
182%
Native Immigrant White Black Hispanic Asian PacificIslander
426/492

Median Age and Fertility Rates for Females inNorth Carolina, 2010-2014
Demographic GroupAll FemalesWhite, Not HispanicBlackAmerican Indian & Alaskan NativeAsianNative Hawaiian & Pacific IslanderSome other raceTwo or more racesHispanicNative BornForeign BornSource: www.census.gov*Women 15 to 50 with births in past12 months.
Median Age39.243.636.235.733.227.323.917.223.939.438.0
Fertility/1000women*
5447566563818169845083
427/492
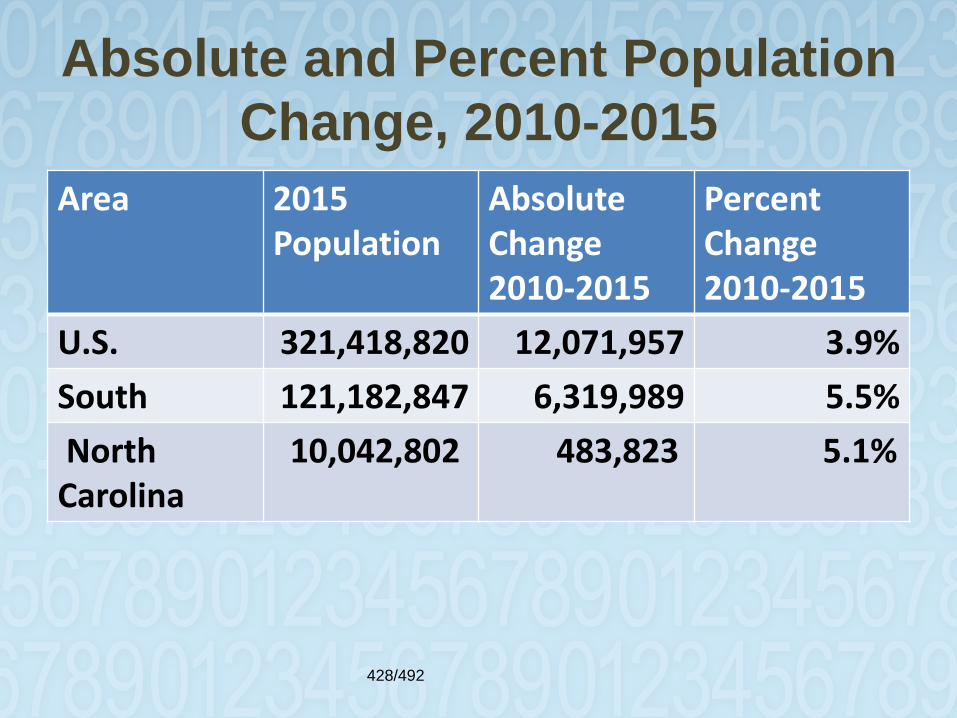
Absolute and Percent Population Change, 2010-2015
Area 2015 Population
Absolute Change 2010-2015
Percent Change2010-2015
U.S. 321,418,820 12,071,957 3.9%South 121,182,847 6,319,989 5.5%North
Carolina 10,042,802 483,823 5.1%
428/492

NON-WHITE AND HISPANIC SHARES OF POPULATION GROWTH, 2010-2014
Area
AbsolutePopulation
ChangeNon-White
ShareHispanic
ShareNC 408,481 67.3 23.1
429/492

NC Absolute Population Growth by County, 2010 - 2015
430/492

NC Absolute Population Growth by County, 2010 - 2015
431/492

NC Absolute Population Growth by County, 2010 - 2015
432/492

NC Absolute Population Growth by County, 2010 - 2015
433/492

Demographic Change Typology, NC Counties, 2010 - 2014
434/492

435/492

CHANGE IN THE RACE/ETHNIC COMPOSITION OF NC PUBLIC
SCHOOLS, 2000-2016
Group2015-16
Enrollment 2000-01
Enrollment Absolute
Change PercentChange
Total 1,443,471 1,268,422 175,049 13.8 AI/AN 19,347 18,651 696 3.7 Black 370,872 393,712 -22,840 -5.8 Asian 43,108 23,576 19,532 82.8 Hispanic 238,837 56,232 182,605 324.7White 714,459 776,251 -61,792 -8.0
.
Source: DPI, The Statistical Profile Online436/492

Changes in NC Public School Enrollment by Race & Gender, 2007-2016
Race/Ethnicity 2015-16 Enrollment
2007-08 Enrollment
Absolute Change Percent Change
Males
American Indian 10,157 10,879 -322 -3.1
Asian 23,239 16,609 6,630 39.9
Hispanic 125,688 74,339 51,349 69.1
Black 200,311 229,586 -29,275 -12.8
White 392,895 410,585 -17,690 -4.3
Female
American Indian 9,846 10,205 -359 -3.5
Asian 22,652 16,693 5,595 35.7
Hispanic 119,989 70,935 49,054 69.2
Black 192,331 225,492 -33,161 -14.7
White 367,897 389,798 -21,901 -5.6437/492

Race/Ethnic Profile of NC Public Schools, 2015-16
Race/Ethnicity Absolute Number Share of Total All Students 1,443,471 100.0American Indian 19,347 1.3Asian 43,108 3.0Hispanic 238,837 16.5Black 370,872 25.7White 714,459 49.5Two or more races 55,049 3.8Pacific Islander 1,799 0.1
438/492

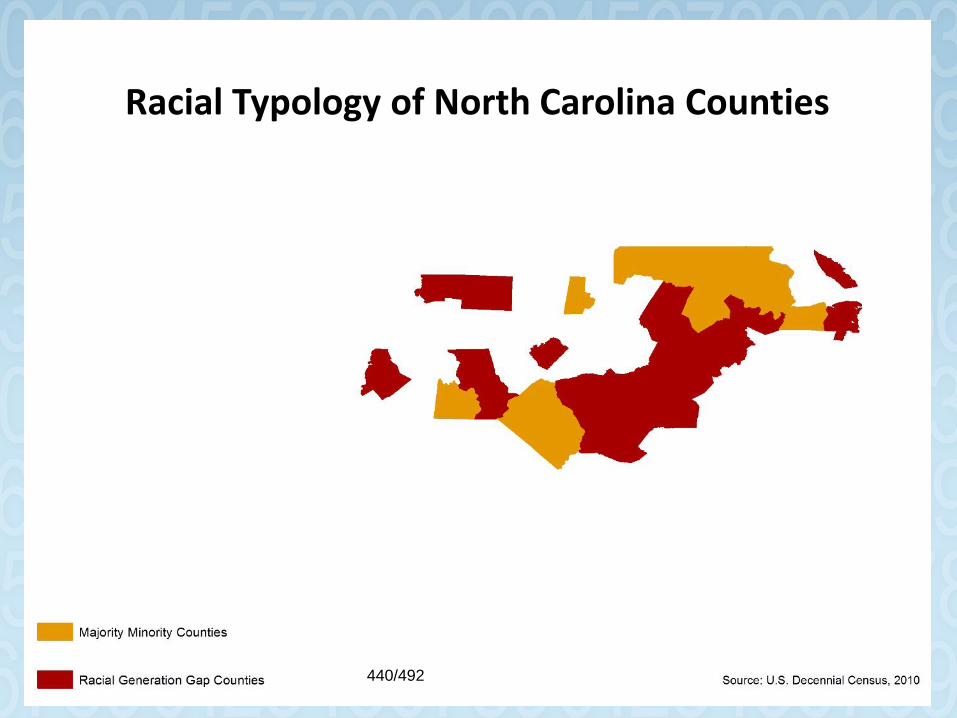
Racial Typology of North Carolina Counties
439/492
Racial Typology of North Carolina Counties
440/492

Racial Typology of North Carolina Counties
441/492

Racial Typology of North Carolina Counties
442/492

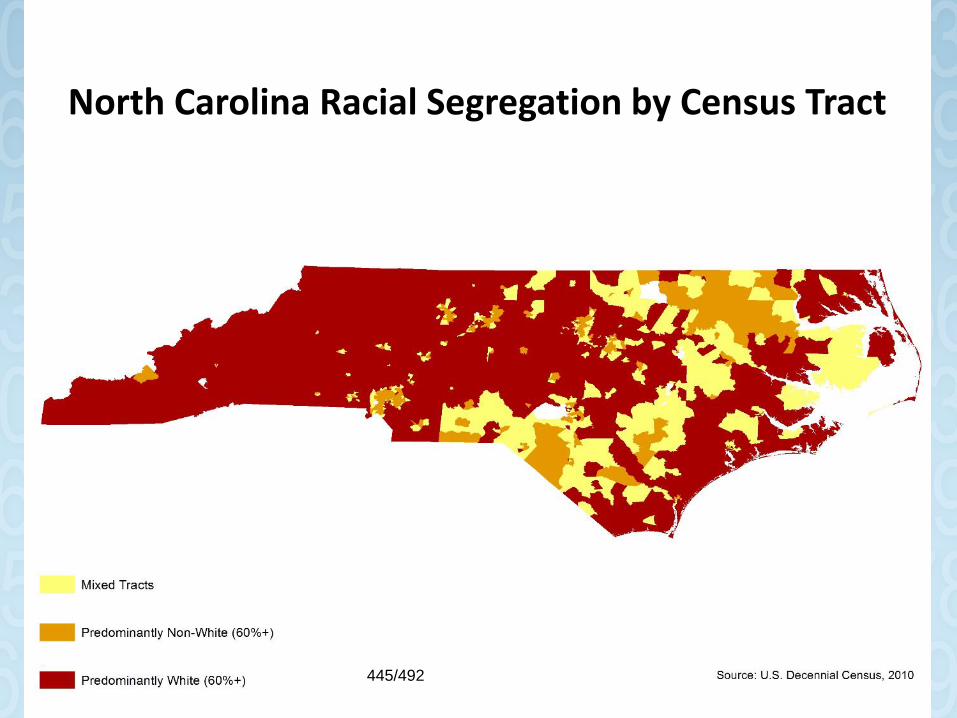
North Carolina Racial Segregation by Census Tract
443/492

North Carolina Racial Segregation by Census Tract
444/492
North Carolina Racial Segregation by Census Tract
445/492

North Carolina Racial Segregation by Census Tract
446/492

North Carolina Poverty by Census Tract
447/492

North Carolina Poverty by Census Tract
448/492

North Carolina Poverty by Census Tract
449/492

North Carolina Poverty by Census Tract
450/492

The Triple Whammy of Geographic Disadvantage
451/492

Suspension Rates by County Type, Grades 9-13, 2014-15
County Type Average Daily Membership
Number of Suspensions
Suspensions/100 Students
Range of rates
Majority-Majority
263,910 40,309 15.3 2.4 – 62.3
Racial Generation Gap
136,535 33,645 24.6 8.0 – 65.4
Majority-Minority
30,885 11,480 37.1 11.4 – 76.1
452/492

Reportable Crimes by County Type, Grades 9-13, 2014-15
County Type Average Daily Membership
Reportable Crimes
Reportable Crimes/1000Students
Range of Rates/1000 students
Majority-Majority
253,793 3,299 13.0 1.0 – 33.0
Racial GenerationGap
135,706 1,885 13.7 0 – 25.8
Majority-Minority
30,885 500 16.2 0 – 19.8
453/492

Male-Female Presence Disparity
4600
4800
5000
5200
5400
5600
5800
6000
6200
6400
2007/2008 2008/2009 2009/2010 2010/2011
Num
ber o
f Tes
t Tak
ers
Year
Total Number of EOC Test Takers
males
females
Graph shows total number of male and female students tested of 6 LEAs (Bertie, Bladen, Duplin, Halifax, Northampton, and Pamlico)
454/492

Percent of High School Graduates Requiring Remedial Course Work
28.7
25.6
23.8
24
26.8
23.3
19.2
20.2
20.8
19.2
48
55.2
55.9
55.2
54
0 10 20 30 40 50 60 70 80 90 100
2006
2007
2008
2009
2010
None One Two or MoreHS GradsPercent of HS Grads
1,047
1,725
1,587
1,534
1,261
Two or more
455/492

Gender Composition of Student Head Count Enrollment in NC Colleges & Universities, Fall 2014
Type of Institution Total Enrollment Male Enrollment Percent Male Enrollment
All Institutions 554,505 230,672 41.6
Bible Colleges 3,880 2,720 70.1
Public Institutions 459,651 189,749 41.3
UNC System 220,121 95,435 43.3
PWIs 181,246 81,304 44.9
MSIs 38,875 14,131 36.3
HBUs 32,653 11,835 36.2
Community Colleges 239,530 104,313 43.5
Private Institutions 90,974 38,204 42.0
Senior Colleges &Universities
90,296 37,755 41.8
Junior Colleges 678 449 66.2456/492

Student Voices
Non-academic & Academic Challenges
457/492

Non-academic Challenges—Student #1
I feel like I've . . . been kind of on a roller coaster . . . I feel like there's always something going on back home, and part of me getting away from that was having to cut off my parents, not in like an "I'm not going to talk to you anymore" kind of way, but for the first couple years my mom would call me needing money and all this kind of stuff. And I'm like, "Look, I know I get this refund check, but it's not for you, it's for me. I'm sorry. I need that money for my own purposes. You can't be calling me for money anymore." I think me doing that really took a lot of stress and made it easier for me to focus on what was happening here instead of worrying about what was happening back home. (Female 1).
458/492

Non-Academic Challenges—Student #2
I've had a lot of issues with home, so it's really stressful for me because my parents are kind of in between homes right now, so it's not like I can just go home and be like "Oh, I'm just gonna go home and chill with my parents for a while." I haven't even been able to go home for the summer. I have to stay here and pay for summer school and all that stuff. I mean for me it's been more of a hinder[ance] than anything.
459/492

Non-Academic Challenges—Student #4
[M]y first year here was really hard because . . . my mom . . .would literally call me almost every other day, eithercomplaining about my little cousin who has behavioral issues . . .or complaining about money or other people in the family. Itreally started to stress me out my freshman year . . . I wouldn'teven study I would be so stressed out. I would go home and justgo to bed 'cause I did not wanna hear any of that . . . I justwanted to come here and have a good time, forget about thatstuff . . . [O]ver the years I talked to my mom and [explained toher]–it's not that I don't care, but . . . I have problems of my own,maybe not as serious as yours, but I have to deal with those too.I'm here to support you, but at the same time I'm here for apurpose, and that [she] was kind of pulling me back . . . I feel likejust being open with her [helped], and now every once in a whilesomething will happen, but for the most part, she's just beenencouraging. She wants me to finish 'cause she didn't finish, sonow it's just like, "You're almost there. A year left. You got this."(Female 2)
460/492

Academic Challenges—Student #1
Most of [my high school AP courses] were actually offered online . . . We didn't really have the capacity or the teaching ability to offer them [at my school] Oh, I forgot to add that . . . I took AP U.S. and War History. The professor I had . . . would . . . go to sleep in class . . . But . . . the science [classes], . . . were okay, but I don't think they were good like preparing me for college science classes (Male 1).
461/492

Academic Challenges—Student #2
We had AP classes at my high school, but the teachers were garbage, so that didn't really help me. I didn't pass not one of my AP tests, but I passed all the classes with . . . A's and B's, but I didn’t do well on the tests.(Female 1)
462/492

Academic Challenges—Student # 3
I was able to build relationships with professors andadvisors [at my community college], so it was helpful inthat part of the transition, but . . . [a]cademic-wise Idon't think I was prepared for Carolina. I felt like it wasalmost like high school 2.0 . . . It was small classes andeverything, but . . . looking back I think professors just .. . babied and fed me the workload, and I think it'sbecause maybe the mindset was like, oh, you at leastmade it this far. . . . It was kind of weird. There weresome great professors and I did sometimes feel like Iwas engaging and learning the material but nothingcompared to this. My first semester here was very[a]wakening in that department.
463/492

Academic Challenges—Student #4
My story is a lot similar to yours. To give a [sense] how easy mycommunity college experience was, I took 24 hours worth ofcredits, which is ridiculous. It's unheard of here at least, and Iworked 40 hours a week and still got eight hours of sleep at night. . . I mean that's how incredibly easy my college was, 'cause theyhanded you a study guide. It literally had everything on the teston it and I have a really good memory. Just had to read it twicebefore bed and the next day face the exam. But the part I willsay where they did help me was they did allow me to really buildmy resume for college. I mean I was student body vice presidentthere. I was involved in a lot of clubs, did a lot of volunteering,so that part helped me on the character building aspect of it, butwhen it comes to the challenge that this place [i.e., Carolina]gives you, they did absolutely very little for me (male 1).
464/492

Academic Challenges—Student #5
My first semester here was like the enlightenment for me. Igot here, was really naïve, and honestly my academic advisorled me down a terrible path because I came here as achemistry major and I went to my academic advisor and I waslike, "Is it okay if I take physics, chemistry, and biology all inone semester?" It was like, "Yeah, sure, you got it, you got it."That semester I was up all night. [I began to question] . . . do Ieven belong here? I mean the amount of studying I wasdoing, the lack of results. I really started questioning myability as a student. I definitely knew at that point I shouldlisten to my dad who was screaming saying, "No, do not takethree sciences in one semester." (Male 1)
465/492

Moving Forward • Higher education must become more actively engaged in K-12 education for reasons of
enlightened self interest.
• Leverage expertise to develop evidenced-based strategies and to beta- test innovationsaimed at improving college readiness for an increasingly diverse pool of public schoolstudents—an AHEC type system for K-12 education reform.
• Make college success courses a mandatory requirement for both high school graduation &college admission.
• Expand the Carolina Covenant Model of Access, Accommodation, & Affordabilitythroughout the UNC System.
• Succession planning for an impending wave of faculty & staff retirements.
• Help aging empty nesters to understand that they do have a dog in the K-12 educationfight—it called the future competitiveness of our state and nation.
466/492

Share of State Budget Spent on K-12 Education
Year Percent 1970-71 52.52012-13 37.3
467/492
Responding to the Crisis
Leveraging the Power of Collective Ambition!
468/492

BUILDING COLLECTIVE AMBITION
North Carolina
Government
Education Community
PhilanthropicCommunity
Private Sector
469/492

Bridges2Success K-12 Education Reform Idea Lab
83
Demonstration Projects
Promoting Academic Success for Boys of Color
Culture of SuccessCommunity College Project
Turnaround School Strategy
Teacher Professional Development
College Preparatory Academies
Felix HarveyCoaches Pilot
College Retention and Completion
Research Fellows Initiative for
emerging scholars and practitioners
Learning NetworkServe as a national
clearinghouse providing evidence-based research,
analysis, technical assistance, professional development and
training for the field.
Scholars PanelDr. Tawannah AllenDr. Aminifu HarveyDr. Wizdom PowellDr. Micah GilmerDr. Claire Baker
Dr. Iheoma Iruka
Evaluation & Research
Building the evidence base.
Economic Imperative for improving
outcomes for men and boys of color
Kenan Institute for Private Enterprise
UNC Center for Community Capital
Leadership TeamDr. James Johnson Mark McDaniel Dr. Donna-Marie Winn
470/492

A Strategic Approach
84
Deficit Models
Successful Pathways ✔
471/492

Brand Promise Entering and Exiting NC Public Schools
Collaborative Engagement
•Agility & Flexibility•Entrepreneurial
Acumen•Contextual Intelligence•Soft Skills/Cultural
Elasticity•Analytical Reasoning
• Protection• Affection• Correction• Connections
Disciplined Execution of
Strategy
85
Successful Pathways
Collective Ambition
472/492

Core Values Undergirding Brand Promise
Protection– Safe, healthy, harm-free
environments– Knowledge & the habit of
learning– Cultural competence, self-
confidence & a positive “counter-narrative”
Affection– Nurturance, kindness, &
compassion– Dependability &
consistency– Love and care
affirmation
Connections– Sense of belonging, “we-
ness,” & unity of purpose– Linked to networks of people
and opportunities to develop– Civic engagement
Correction – High expectations; attention
to doing what is right; encouragement
– Resilience, self-discipline, & restitution when wrong
– Constructive challenges
86473/492

87474/492

Bridges2Success Professional Development Program
School Administrators, Teachers, & Other Key Influencers in the
Lives of Vulnerable Youth
475/492

Theme Purpose/Goals WorkshopsModule 1: Building the Substructure
Maintaining Competitiveness in the 21st Century Marketplace
Understanding National Context Geopolitical, Economic, & Demographic Trends • “Browning” of School Age Population • Triple Whammy of Geographic Disadvantage
Understanding Local Context Key Informant Interviews • Focus Groups with Teachers • Assessment of School Climate • Classroom Observations • Years to Parity Diagnostic Assessment
Module 2: Laying the Surface
Creating a Culture of Success Building Collective Ambition
Collaborative Engagement • Strategy Development • Disciplined Execution of Strategy
Rebranding School Culture Organizational Development • Self-Assessment & Reflection •Team Building • Capstone
Module 3: Erecting the Superstructure
Building Skills & Competencies Managing Classroom Behavior
Implementing Positive Behavior Interventions • Cultivating a Learning Mindset in Males • Understanding Diverse Learning Styles
Building Social & Cultural Capital Student-Teacher-Parent Relationships • Parental Involvement • Facilitating Positive Peer Group Interactions • Creating Bridging Social Capital
Developing a Positive Narrative Developing & Affirming Positive Identities in Males • Media Messages, Masculinity & Identity • Leveraging History & Heritage to Build Resilient Identities
Module 4: Dealing with the Details
Facilitating Student Success Tools & Strategies
Creating Culturally Competent Learning Environments • Building Soft Skills • Developing Contextual Intelligence • Creating Entrepreneurial Acumen • Mindfulness Mediation Techniques • Building Blocks for STEAM
476/492

A System of K-12 Education Innovation Labs
477/492

THE END
478/492