northborough childhood obesity needs assessment …€¦ · northborough childhood obesity needs...
TRANSCRIPT

Town of
Northborough
Childhood Obesity
Needs Assessment
2008-2009

I. OVERVIEW
Overweight and Obesity Defined
Overweight and obesity are complex issues associated with genes, lifestyle behaviors, and the environment. The condition occurs when there is an imbalance between the amount of calories consumed and the amount of physical activity used to burn those calories. Overweight and obesity are generally defined by Body Mass Index (BMI). In children and adolescents 2-20 years, overweight is defined by the Centers for Disease Control and Prevention as a BMI between the 85th and 94th percentile and obesity is defined at or above the 95th percentile for children of the same age and sex.1
Obesity Prevalence among Children
Over the past four decades, the obesity rate has nearly tripled from 5 percent to 14 percent for children ages 2 to 5, increased from 4 percent to 19 percent for children ages 6 to 11, and increased from 5 percent to 17 percent for adolescents ages 12 to 19.2 In Massachusetts, approximately 30% of 2-to 5-year-olds and an equal proportion of 11-to 15-year-olds are above a healthy weight.3,4 In 2001, 10% of high school students in Massachusetts were obese, a 43% increase from 1999 at 7%.5
Why Focus on Childhood Obesity?
The growing rate of childhood obesity is receiving increasing national attention and recognition. It has reached such epidemic levels that the Surgeon General has called it “the fastest-growing, most threatening disease in America today.”6
Childhood obesity has significant health, social, and financial consequences. For the first time in American history, “youth of today may, on average, live less healthy, and possibly even shorter lives than their parents.”7 Not only do overweight children and adolescents have an increased risk of becoming obese adults,8,9 obesity that begins in childhood may be more closely associated with severe obesity in later life than obesity that begins at older ages.10 Furthermore, overweight children are at risk for numerous chronic conditions in adulthood,11 and this risk is thought to exist regardless of obesity in later life. Obese children have high blood pressure, undesirable serum lipid levels, insulin resistance,12 as well as calcifications in the coronary arteries and the aorta.13 The odds of elevated blood pressure are significantly higher for children whose body mass index (BMI) is at or above the 90th percentile than for those with BMI at or below the 10th percentile. Depending on race and gender, the risk of elevated blood pressure ranges from 2.5 to 3.7 times higher for the overweight child.14 In the past, it was generally thought that type 2 diabetes was restricted to adults and did not affect children. However, over the past two decades as childhood obesity has increased, there has been a tremendous increase in type 2 diabetes in children and adolescents.15 The lifetime risk for obese children born in the United States in the year 2000 to be diagnosed with type 2 diabetes is estimated to be 30% for boys and 40% for girls.16

1
Socially, obese children are often the targets of stigmatization which can have a significant impact on their emotional well-being. Overweight and obese children are often teased, called names, and the subject of weight-related jokes.17,18 Obese children and adolescents suffer from social isolation (i.e., rejected by their peers) and associated emotional consequences19 such as lower self-esteem, emotional distress, anxiety, depression, and suicidal thoughts and attempts.20 Compared to normal weight peers, obese children tend to be less physically active, withdraw from social situations, and participate in fewer activities. Furthermore, obese children have been shown to score lower on health-related quality of life indicators.21,22
In addition to the health impacts of obesity, the economic costs are substantial. Among children and adolescents, annual hospital costs related to obesity were nearly 3.5 times higher between 1997 and 1999 ($127 million in 2001 U.S. dollars) compared to 1979-1981 ($35 million).23 Many of these costs are assumed by states’ Medicaid programs which serve approximately 4 million obese children from low-income families. Furthermore, the current estimated range of annual national health expenditures associated to obesity (~$98 to $129 billion) is expected to increase given the growing rates of childhood obesity and the likelihood of children becoming obese adults.24
Scope of the Problem
A wide range of genetic, biological, behavior and environmental factors have contributed to the increase in childhood obesity. However, energy imbalance resulting from physical inactivity and excess energy intake is considered the most important factor. Over the past several decades, major societal changes have affected physical activity. Eight percent of middle schools and two percent of high schools provide daily physical education26 and children no longer walk or bike to school.27 Children also spend a substantial amount of time doing sedentary activities, such as watching TV, playing video games, and surfing the Internet. According to one study, children spend 19.3 hours a week watching TV, 2.3 hours a week playing video games, and 2.5 hours in front of the computer.28
At the same time, there has been an increase in the marketing, availability, appeal, affordability, and consumption of foods and beverages that are low in nutrients but high in fat, sugar, and calories. There are over 300,000 food products in today’s marketplace, 40,000 carried by the average supermarket at one time.29 To influence young consumers, over $10 billion a year is spent marketing high-calorie products packed with fat, sugar and salt to children between the ages of 2 and 11 years old.30
Fast food restaurants have become a major source of food. It is estimated that Americans spend about $110 billion on fast food each year.31 One-fourth of all Americans eat fast food at least once a day and one-quarter of the vegetables consumed in the United States are French fries.31 In addition, the “super sized” portions often available at fast food restaurants provide more fat and calories in one meal than a child or adolescent needs the entire day. Research suggests that children eat more calories and have lower quality diets on days when they eat fast food.32

2
Foods high in sugar and fat made available to students via vending machines, snack bars, and other food sources are displacing healthy foods and contributing to excessive fat intake. A national study found that 43 percent of elementary schools, 74 percent of middle schools, and 98 percent of high schools had vending machines, snack bars, and other food sources outside of the school meal programs.33 Another study found an average of 5 soft drink machines were available to high school students and only a third of the foods in high school a la carte areas and vending machines were lower than 5.5 fat grams per serving.34 The major problem is that students will eat the energy dense foods, when available, even if they also consume the regular school lunch.36
The increase in childhood obesity over the past several decades reflects cumulative effects of the changing environment and emphasizes the need to identify and modify the environmental influences that could help alter both energy intake and energy expenditure. The Town of Northborough conducted a needs assessment from September 2008 through September 2009 to collect information and community input on the needs and assets in Northborough that relate to overweight and obesity in children.
II. OBJECTIVES OF THE CHILDHOOD NEEDS ASSESSMENT
The specific objectives of the Community Needs Assessment are:
1. Describe the children living in Northborough. 2. Obtain data on the prevalence of childhood obesity and overweight. 3. Assess opportunities for physical activity available to children. 4. Assess the availability of healthy food choices for children. 5. Obtain input from parents, principals, and other community members on their
perceptions of childhood obesity, opportunities and barriers to physical activity and healthy food choices, and suggestions for addressing the factors that contribute to childhood obesity and overweight.
III. METHODOLOGY FOR CHILDHOOD OBESITY NEEDS ASSESSMENT
The Town of Northborough formed a working group of key stakeholders including the Recreation Director, Board of Health Director, Town Planner, and Family and Youth Director. An external consultant worked with the group to establish a plan. Each member was assigned a list of activities that contributed to the completion of the needs assessment. The methodology is described below. Web-based Survey A web-based survey was conducted to identify assets and barriers related to childhood obesity in Northborough. A survey link was emailed to 1,880 adults who personally participated or had a child participate in at least one program at the Northborough Parks and Recreation (e.g., recreational/physical activity programs, summer day care programs, family trips, or educational programs) during the past six years. After reading a description of the survey, adults were asked

3
to follow a link to complete the survey. The survey (Appendix A) included 40 questions on the programs at the Parks and Recreation Department, park and trail usage, child height and weight, perceptions of child weight, teasing related to overweight/obesity, Northborough schools, child physical activity and eating behaviors, parent knowledge and behaviors, and the environment. Current residents of Northborough were eligible to complete the survey. One email was sent and respondents had one month to complete the survey. Three hundred and fifty-five people responded and 327 were current residents. The respondents were predominately non-Hispanic White (95%) females (91%). Eighty-six percent of the respondents completed college or graduate/professional school and over half who reported household income (57%) had a household income greater than $90,000. Fourteen percent were currently enrolled in a Parks and Recreation program and 40 percent had one or more family members currently enrolled. Principal Survey The Family and Youth Director sent an email to the elementary and middle school principals describing the needs assessment. As key stakeholders in the endeavor, each principal was asked to complete a confidential survey (Appendix B) on the assets and barriers related to childhood obesity in Northborough. The survey included 22 questions on their perceptions of childhood obesity, physical activity, and healthy eating; the role the school plays on child health; available school-based programs; school wellness policies; and recommended strategies. Three of the five principals receiving a survey responded. Food Service Survey The Board of Health Director sent a survey to food service staff in each school (n=6). The survey (Appendix C) included 13 questions on the types of foods offered, the food selection process, and the number of minutes children have to eat lunch. Food service staff were also asked about their perceptions of childhood obesity, the role the school food environment has on childhood obesity, school wellness policies, media’s portrayal of school involvement, and challenges they face. Three of the six food service staff completed the survey. Focus Group A focus group was conducted with the Youth Commission. Members included parents, school staff, and high school students. Prior to the focus group, the facilitator explained the purpose of the focus group and the rules of participation. Members were reminded that they would not be identified with their comments and were encouraged to provide honest and open responses. Topics included childhood obesity and healthy weight; helping children maintain a healthy weight; opportunities in Northborough for physical activity and healthy eating; the role of parents in helping children engage in physical activity and healthy eating; and suggestions for changes in the home, schools, and community (Appendix D).

4
Ten Youth Commission members participated in the 90 minute focus group. Sidewalk Audit The Active Neighborhood Checklist (Checklist) environmental audit (Appendix E)37 was chosen to observe street segments surrounding Northborough schools. It is a refined version of existing audit tools38 and is designed to be a short, objective instrument for both community stakeholders and researchers. The Checklist consists of six categories: land use characteristics, sidewalks, shoulders and bike lanes, street characteristics, quality of the environment for pedestrians, and specific destinations (e.g., schools, grocery stores). It demonstrates high reliability when completed by researchers and community stakeholders across diverse street segments. Twelve street segments surrounding the Northborough elementary and middle schools were audited. An external consultant trained Parks and Recreation staff to audit streets. The training lasted 90 minutes. Two teams of two audited six street segments. After observing each street segment, teams discussed what they saw to ensure consistent results. Variations were discussed and final results were determined. Park/Trail Observations A modified version of the System for Observing Play and Recreation in Communities (SOPARC) was used to obtain direct information on park and trail use, including characteristics of parks and their users. Parks and Recreation staff observed park users’ physical activity levels, gender, activity modes/types, and estimated age and ethnicity groupings on two separate occasions for a two hour time period at the 135 park. Parks and Recreation staff observed trail users’ type of physical activity, gender, and estimated age and ethnicity groupings on two separate occasions for a two hour time period at the 135 park. In addition, staff members asked trail users how often they used the trail. Additional Data Collection Additional pre-existing data was gathered from the school and Parks and Recreation Department, including information on:
● Recess time, physical education, and other activities offered during school hours.
● Northborough parks/playgrounds.
● Weight status of children by grade. Limitations to Data Collection Several limitations must be considered. First, while the parent survey was sent to almost 2,000 people, the sample included individuals who personally participated or had a child participate in at least one program at the Northborough Parks and Recreation during the last six years. These individuals may not truly represent the population of Northborough. Second, half of the

5
principals and food service staff returned their surveys. While they provided valuable information, it may not speak to the other principals and food service staff. IV. FINDINGS
The findings are categorized by the objectives. Results from the relevant data collection methods are discussed within each category.
A. DEMOGRAPHICS According to the 2000 US Census,39 there are approximately 14,000 people, 4,900 households, and 3,900 families living in Northborough. Among the 4,900 households, an estimated 43 percent have children under the age of 18 years living with them. Figure 1 compares the percentage of children within the population of Northborough and the state of Massachusetts by age group. The racial makeup of Northborough is predominately white (93 %). The median household income is approximately $80,000. Approximately 2 percent of families in Northborough are below the poverty line. Figure 1. Percentage of Children Living in Northborough and Massachusetts
Percentage of Children Living in
Northborough and Massachusetts
0.00
1.00
2.00
3.00
4.00
5.00
6.00
7.00
8.00
9.00
10.00
00 through 04
Years
05 through 09
Years
10 through 14
Years
15 through 19
Years
Pe
rcen
tag
e
% of Northbourgh
Population
% of MA Population
Schools in Northborough.
There are four public elementary schools (preK-5th grade) in Northborough: Lincoln Street School, Margaret E. Peaslee School, Fannie E. Proctor School, and Marion E. Zeh School. There is one middle school (grades 6-8), Robert E. Melican Middle School, and one high school,

6
Algonquin Regional High School. Private schools include St. Bernadette’s, Alhuda Academy, and Cornerstone Academy. Parents participating in the survey were asked to provide the name of the school their child (if more than one child, they reported on the child whose birthday was closest to May 16th) attended. A list is provided in Table 1. Table 1. Schools Identified by Parents in Parent Survey (n=247)
School # of Parent Reporting Their Child
Attended the School
Lincoln Street School 27
Margaret E. Peaslee School 32
Fannie E. Proctor School 34
Marion E. Zeh School 45
Robert E. Melican Middle School 53
Algonquin Regional High School 25
Private School 13
Pre School/Daycare 8
Home School 2
Other 8
B. OVERWEIGHT/OBESITY PREVELANCE Body mass index (BMI) was calculated by dividing weight in kilograms by height in meters squared (kg/m2). For children of the same age and sex between the ages of 2 and 20, overweight is defined as a BMI between the 85th and 94th percentile and obesity is defined at or above the 95th percentile. In the parent survey, parents were asked to report their child’s height and weight (parents with more than one child were asked to report information on the child with the birthday closest to May 16th). In addition, the school nurse provided the percent of children considered overweight (85th to 94th percentile) or obese (> 95th percentile) by grade. Using the height and weight provided by parents, approximately 8 percent of children are underweight, 73 percent healthy weight, 9 percent overweight, and 10 percent obese. Table 2 provides weight status by age.

7
Table 2. Weight Status of Children By Age*
Status
Age Underweight
(%)
Healthy Weight
(%)
Overweight
(%)
Obese (%)
5 13.6 63.4 9.1 13.6
6 0.0 84.2 5.3 10.5
7 4.6 72.7 9.1 13.6
8 14.3 64.4 21.3 0.0
9 6.2 50.0 25.0 18.8
10 15.0 75.0 5.0 5.0
11 0.0 85.0 5.0 10.0
12 9.5 85.7 0.0 4.8
13 0.0 64.7 29.4 5.9
14 0.0 92.3 7.7 0.0
15 0.0 80.0 20.0 0.0
> 16 years 0.0 95.5 4.5 0.0
*Based on information provided by parents in parent survey (n=211)
School reports on weight status are based on actual height and weight and are found in Table 3.
Table 3. School Reported Weight Status of Children By Grade*
Grade Overweight
(%)
Obese
(%)
1 11.5 10.0
2 13.0 5.0
3 8.5 8.0
4 14.0 6.0
5 14.5 12.5
6 15.0 12.5
7 14.0 18.5
8 18.0 9.5
*Based on weight status provided by Northborough School Nurse
The school prevalence of children considered overweight or obese may vary from the parent survey for several reasons and should not be compared. First, parent report of height and weight may be an estimate which is different than actual height and weight taken by the school nurses. Second, child gender was not obtained by the parent survey or the information provided by the school nurse. The weight status calculated by the parent survey was based on females and may not be representative of the sample. Third, the school report is based on all children and the parent report is based on parents who took the survey which may not represent all children in Northborough.

8
C. PERCEPTIONS OF OVERWEIGHT AND OBESITY
Perceptions of child overweight and obesity were obtained from principals, food service personnel, Youth Commission, and parents.
All three of the principals who completed the principal survey stated that they have observed “slightly more” overweight or obese children in the Northborough community over the past ten years. They agree that childhood obesity is a problem.
Among the personnel who completed the food service survey, none believe childhood obesity is a problem in Northborough because the schools offer healthy foods, adequate gym time, and afterschool programs. Food service staff feel they may provide the only balanced meal and parents should assume some responsibility.
In the focus group with the Youth Commission, participants stated that there are more overweight or obese children today than there were ten years ago but agree the majority of children in Northborough are normal weight. They stated that Northborough has a problem with eating disorders and that there are things that could be done to promote health for all children, such as healthy eating and regular physical activity.
After providing child height and weight, parents were asked how they perceived their child’s weight status (Table 4). Among the children that were actually classified as overweight, only 40.9 percent of parents perceived their child as overweight. Almost 5 percent of parents considered their child to be underweight and 54.6 percent classified their child to be at a healthy weight. Parents of obese children also misclassified their child’s weight status. Four percent perceived their child to be at a healthy weight and 46.7 percent classified their child as overweight.
Table 4. Actual Child Weight Status by Parent Perception
Parent Perception of Child Weight Percent of Parents (n= 210)
Actual
Weight Status Underweight (%)
Healthy Weight (%)
Overweight (%)
Obese (%)
Underweight 41.7 58.3 0 0
Healthy Weight 6.8 86.3 6.8 0
Overweight 4.6 54.6 40.9 0
Obese 0 4.2 46.7 6.7
Among parents that perceived their child to be overweight or obese, 69 percent (n=22) said their child was bigger than they thought he/she should be; 41 percent (n=13) said he/she was bigger than kids similar in age; 25 percent (n=8) said their doctor told them their child was overweight or obese; and 13 percent (n=4) said other people told them their child was overweight or obese.

9
D. PHYSICAL ACTIVITY AND SEDENTARY BEHAVIORS
Parents were asked to report on their child’s physical activity and sedentary behaviors. Seventy percent of parents (n=184) said their child gets at least 30 minutes of physical activity 5-to-7 days per week; 25 percent (n=65) said 2-to-4 days per week; and 5 percent (n=14) said once a week or less. Eighty-seven percent of parents (n=228) said their child has participated in an organized sport or activity (e.g., soccer, swimming, dance) within the past year.
Eleven percent (n=29) of parents reported that their child walks or bikes to school. Forty-seven percent (n=120) said they would let their child walk or bike to school if he/she was interested. When thinking about their child walking or biking to school, parents were mostly concerned with traffic danger (59%); crime (18%); and distance from school (14%).
Parents were asked to report on their child’s daily sedentary behaviors, including watching TV, using the computer, and playing video games (Table 5).
Table 5. Percent of Children Engaging in Sedentary Activity by Minutes Per Day
< 30 minutes
31-59 minutes
60-89 minutes
90-119 minutes
> 120 minutes
Does not do this activity
Do not know
Watch TV 26.3 40.1 20.6 5.7 3.8 3.4 0.0
Use the computer 51.0 24.5 24.5 3.5 3.5 10.9 0.4
Play video games 50.2 13.7 3.1 1.1 0.4 31.0 0.4
Among the three principals, one said 1 percent of the students walk to school, one said 10 percent walk to school, and one said 30 percent walk to school. Principals reported safety and lack of sidewalks as barriers to children walking to school.
Focus group participants stated that most kids are carpooled because of safety issues. The location of most schools does not allow for kids to walk to school. In the winter, sidewalks are icy and it is not safe for children to walk to school.
E. PHYSICAL ACTIVITY OPPORTUNITIES/BARRIERS
Physical Activity at School. Principals were asked to provide information about physical activity offered at their school. All three principals stated that children participated in physical education class twice a week for approximately 40 minutes. Two principals said their children had 30 minutes of recess every day and one principal said their children did not have recess. Parents were asked how they rate their child’s school on promotion of physical activity through various school-based activities, recess time, education about alternatives to sedentary activities, and after school physical activity opportunities (Table 6). Among the parents that responded, many were pleased with the school-related activities and feel the school does a good job at

10
promoting physical activity. Several parents made suggestions for improving school-related physical activity (Section F). Table 6. Parents’ Perceptions of School-Related Physical Activity
Excellent %
Good %
Fair %
Poor %
Don’t Know %
Promotion of physical activity through various school-based activities
23.0 48.0 18.0 7.0 4.0
Adequate daily recess time 12.0 39.0 16.0 23.0 11.0
Education about alternatives to sedentary activities
10.0 36.0 20.0 8.0 26.0
After school physical activity opportunities 9.0 43.0 16.0 10.0 22.0
Parents and individuals in the focus group commented on Project Adventure. They agree it is a good opportunity for kids to move around and interact with other students as a team. School Fields. There are five fields, one at each school, open to the public after school hours. They include soccer, baseball, Lacrosse, and football. Streets Around Schools. The audited streets surrounding schools were predominately residential. Five of the twelve streets had a park with exercise or playground equipment, five had a sports/playing, and two had a basketball/tennis/volleyball court. Two of the streets did not have a posted speed limit sign. Among the ten streets that did, the speed limit was between 20 and 30 miles per hour. Half of the streets had marked lanes. Seven of the twelve streets had a cross walk for crossing the street, however, none of them had a “walk/don’t walk” signal. One street was a cul-de-sac and had a small paved connector to other neighborhood. Most streets were clear of litter and broken glass. None of the streets had a sidewalk on both sides of the street. Eight of the twelve streets had a sidewalk on one side of the street although one of sidewalks switched sides after the school zone forcing pedestrians to have to cross the street. Three of the sidewalks had major misalignments or cracks in the sidewalks making it difficult to walk. Northborough Parks and Recreation Programs. The Northborough Parks and Recreation Department offers after school programs, summer/December camp programs, and youth sports. The Northborough Parks and Recreation Department offers multiple after school programs that include physical activity and sports. Programs are determined by popularity and include soccer, archery, swimming, tennis, golf, karate, horseback riding, flag football, ice skating, gymnastics, yoga, and dance. They run for 5-to- 8 weeks and cost between $60 and $100. Participating children are generally active for one hour. Full day camps are available to children in K-8 when school is not in session. Summer camp is offered for eight weeks and starts immediately after the school year ends. December camp is offered during winter break. The camps are held at the school and the cost is $200 per week.
11
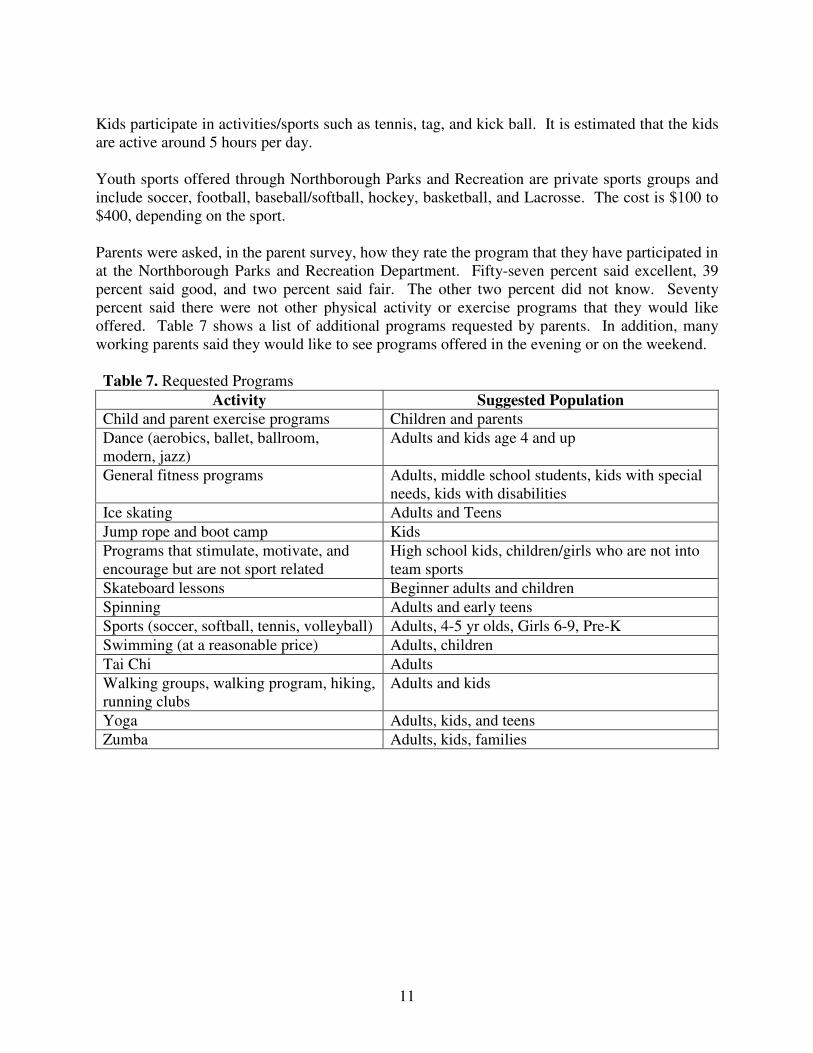
Kids participate in activities/sports such as tennis, tag, and kick ball. It is estimated that the kids are active around 5 hours per day. Youth sports offered through Northborough Parks and Recreation are private sports groups and include soccer, football, baseball/softball, hockey, basketball, and Lacrosse. The cost is $100 to $400, depending on the sport. Parents were asked, in the parent survey, how they rate the program that they have participated in at the Northborough Parks and Recreation Department. Fifty-seven percent said excellent, 39 percent said good, and two percent said fair. The other two percent did not know. Seventy percent said there were not other physical activity or exercise programs that they would like offered. Table 7 shows a list of additional programs requested by parents. In addition, many working parents said they would like to see programs offered in the evening or on the weekend. Table 7. Requested Programs
Activity Suggested Population
Child and parent exercise programs Children and parents
Dance (aerobics, ballet, ballroom, modern, jazz)
Adults and kids age 4 and up
General fitness programs Adults, middle school students, kids with special needs, kids with disabilities
Ice skating Adults and Teens
Jump rope and boot camp Kids
Programs that stimulate, motivate, and encourage but are not sport related
High school kids, children/girls who are not into team sports
Skateboard lessons Beginner adults and children
Spinning Adults and early teens
Sports (soccer, softball, tennis, volleyball) Adults, 4-5 yr olds, Girls 6-9, Pre-K
Swimming (at a reasonable price) Adults, children
Tai Chi Adults
Walking groups, walking program, hiking, running clubs
Adults and kids
Yoga Adults, kids, and teens
Zumba Adults, kids, families

12
Northborough Parks/Trails. There are numerous town parks and conservation areas in Northborough (Table 8). Table 8. Northborough Parks and Conversation Areas
Park Acreage Included Amenities
Mount Pisgah 186 acres Wooded area and trails
Ellsworth-McAfee Park 50 acres Playground equipment, recreational fields, and skate board park
Assabet Park 12 acres Playground equipment and splash pad
Memorial Field 10 acres Baseball fields
Howard Street Recreation Area 4 acres Playground
Bearfoot Road 13 acres Walking trail, boat ramp
Edmund Hill Woods 61 acres Wooded area and trails
Watson Park 41 acres Walking trail
Carney Park 18 acres Walking trail
Bartlett Street Pond 40 acres Trails, boat ramp
There is one skate park open to the public. It is located at Ellsworth McAfee Park. There is one splash pad located at Assabet Park. It is open during the summer from 12:30-6 p.m. Monday through Friday. Limited resources restrict the splash pad from being open on the weekends. There are three full size basketball courts located at Assabet Park, Ellsworth McAfee, and Town Hall. The two basketball courts located at the parks are outdoor courts and are open to the public at all times. The Town Hall basketball court is inside and is reserved for classes, leagues, and activities from 8 a.m. – 11 p.m. each day. Residents can rent the gym for $35 per hour. There are 8 outside tennis courts at the high school and middle school. They are open to the community when school is not in session. There are approximately 20 miles of trails located throughout Northborough. There are seven playgrounds in Northborough. They are located at each elementary school, Assabet Park, and Ellsworth McAfee Park. The school playgrounds are open to the public after school hours and the two parks are open from dawn to dusk. In the parent survey, parents were asked how often their family or children use Northborough parks (weather permitting). Sixty-four percent said weekly, 19 percent said monthly, 9 percent said not much or never, and 8 percent said daily. When visiting the parks, 71 percent said they use the playgrounds, 53 percent said they exercise (e.g., walking or biking), 52 percent said they play sports, and 14 percent said they relax. Over half of parents (56%) reported that their family or children did not use the Northborough trails very much or at all. Among those that do, 81 percent use them for walking, 41 percent observe the nature or watch birds, 39 percent use them for family or group outings, 27 percent use them to walk the dog, 9 percent use them to jog, and 1 percent uses them to commute to work.

13
During the park audits, the observers saw very few children and teens. Among those at the park, the majority played on the playground or skateboarded at the skate park. Most of the people at the park during the audits were adult males playing soccer. However, both adult men and woman were seen using the parks to walk (including walking dogs) and jog. During the trail audits, the observers saw eight individuals hiking and jogging at Mt. Pisgah Trail and two families walking the dog at the Cold Harbor Trail. The majority of the trail users (6/10) reported using the trail once per month and others (4/10) reported using the trail once per week. Neighborhood Environment. Information about the neighborhood was collected from parents and focus group participants. Parents were asked about their neighborhood environment. Fifty-six percent of respondents (n=157) reported having sidewalks in their neighborhood, 87 percent (n=244) said their neighborhood was “safe” or “very safe,” and 48 percent (n=131) said they feel “comfortable” or “very comfortable” with letting their child play outside on without adult supervision. Focus group participants stated that they feel Northborough is a pretty safe town but telling their kids to “go play in the street” doesn’t work anymore because kids do not play in the streets. After middle school, everything is an organized activity. Kids that are not sports minded stay indoors. They feel the Parks and Recreation Department does a good job offering a variety of activities for the community but that it needs to be advertised more and/or brought to the schools so children can participate after school.
F. SUGGESTIONS FOR PHYSICAL ACTIVITY PROMOTION FROM PARENTS,
PRINCIPALS, AND OTHER COMMUNITY MEMBERS
Parents, principals, food service staff, and focus group participants were asked to provide suggestions for improving physical activity opportunities for children in Northborough. A collective list is below.
● It is not as much about the opportunity, because there are things for kids to do, it is about “making it cool” to participate in physical activities and acceptable by peers
● Market the programs offered by the Parks and Recreation Department, parents may not be aware of all the opportunities
● Make it easier for kids to participate in the Parks and Recreation programs by offering them at school
● Provide more opportunities for kids that are not interested in sports
● Get older kids (paid or volunteers) to organize activities for younger kids after school (e.g., in the parks or on the playgrounds)
● Offer more activities, not just sports, for children in the community
● Offer programs at a discounted rate for families that cannot afford to participate
● Educate parents and children about healthy options
● Increase recess time (and not take it away for punishment)
● Increase physical education time

14
● Offer recess time for middle school students
● Organize recess so kids move around
● Increase physical activity communication between school and home
● Teach kids why physical activity is good for them and make it fun
● Offer more physical activity breaks throughout the school day
● Increase the time kids spend being active in physical education
● Increase the number of kids that walk to the bus stop (get parents to stop driving them to the bus stop)
G. EATING BEHAVIORS
According to the food service staff, lunch periods are 30 minutes long. Children usually get between 18 and 25 minutes to eat lunch after waiting in line. In the parent survey, parents were asked to report on their child’s eating behaviors (Table 9.) Table 9. Child Eating Habits
Everyday
%
4-6 times/wk
%
2-3 times/wk
%
1 time/wk
%
Less than 1/wk
%
Never
%
Eat out at a restaurant 0.0 0.8 8.0 33.6 55.7 1.9
Eat pre-packaged or prepared dinners such as TV dinners or takeout food
0.4 1.1 5.7 26.1 41.4 25.3
Eat a dinner that was cooked at home
34.2 62.4 2.3 0.8 0.4 0.0
Eat dinner in front of the television
1.2 3.7 13.5 16.6 38.8 46.7
Eat breakfast 87.0 7.6 3.0 0.8 0.8 0.8
Have second helpings at dinner 1.2 7.7 29.2 23.0 22.7 16.2
H. HEALTHY EATING OPPORTUNITIES/BARRIERS
School lunches. According to the food service staff, the most common lunch is spaghetti with meat sauce, tossed salad or vegetable, garlic bread, and fruit. The food service manager considers nutritional value, meal plan, and whether the kids will eat the food when planning lunches. Food service staff report using whole wheat bread, whole grain pizzas, fresh fruits when in season and cost effective. They have cut the amount of salt, sugar, and fats in many recipes. They reported that the biggest barriers are cost and providing healthy meals the children will eat. They need the USDA to provide better quality fruits and vegetables more often. According to the principals that responded to the survey, fruit is available on the lunch menu but is only offered once a week and is not always fresh. One principal stated that the lunch program needs to be redesigned to include healthier more attractive options.
15
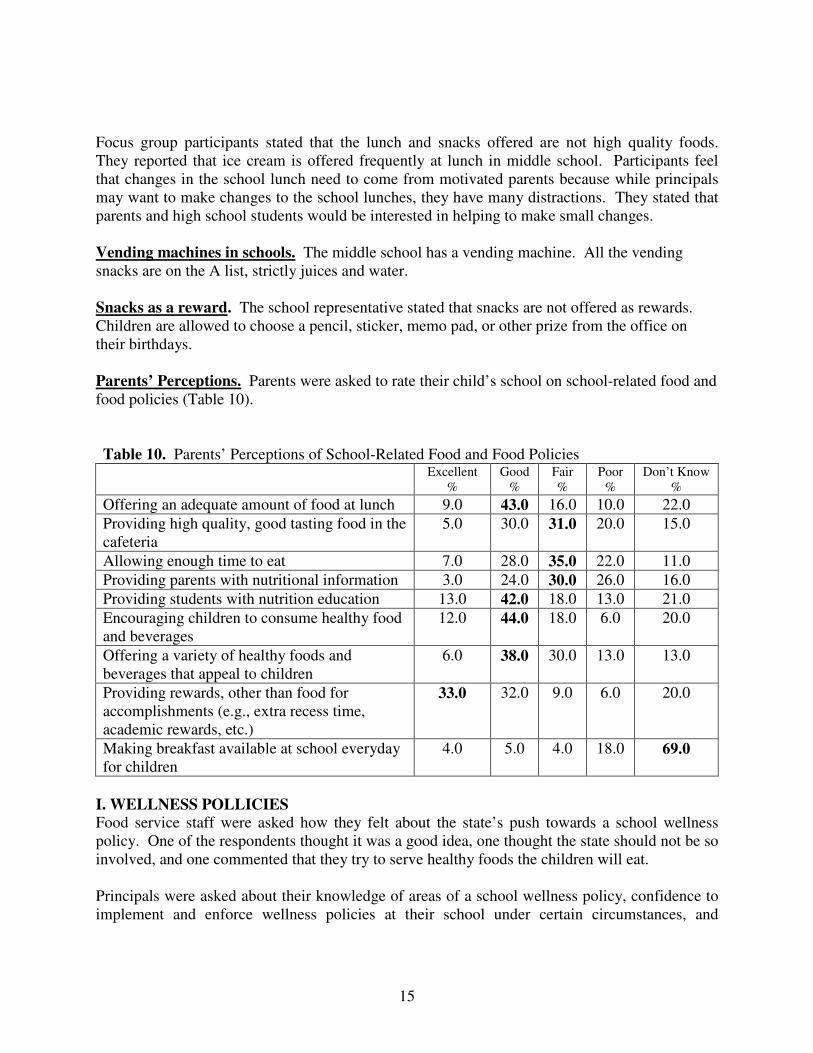
Focus group participants stated that the lunch and snacks offered are not high quality foods. They reported that ice cream is offered frequently at lunch in middle school. Participants feel that changes in the school lunch need to come from motivated parents because while principals may want to make changes to the school lunches, they have many distractions. They stated that parents and high school students would be interested in helping to make small changes. Vending machines in schools. The middle school has a vending machine. All the vending snacks are on the A list, strictly juices and water. Snacks as a reward. The school representative stated that snacks are not offered as rewards. Children are allowed to choose a pencil, sticker, memo pad, or other prize from the office on their birthdays. Parents’ Perceptions. Parents were asked to rate their child’s school on school-related food and food policies (Table 10). Table 10. Parents’ Perceptions of School-Related Food and Food Policies
Excellent %
Good %
Fair %
Poor %
Don’t Know %
Offering an adequate amount of food at lunch 9.0 43.0 16.0 10.0 22.0
Providing high quality, good tasting food in the cafeteria
5.0 30.0 31.0 20.0 15.0
Allowing enough time to eat 7.0 28.0 35.0 22.0 11.0
Providing parents with nutritional information 3.0 24.0 30.0 26.0 16.0
Providing students with nutrition education 13.0 42.0 18.0 13.0 21.0
Encouraging children to consume healthy food and beverages
12.0 44.0 18.0 6.0 20.0
Offering a variety of healthy foods and beverages that appeal to children
6.0 38.0 30.0 13.0 13.0
Providing rewards, other than food for accomplishments (e.g., extra recess time, academic rewards, etc.)
33.0 32.0 9.0 6.0 20.0
Making breakfast available at school everyday for children
4.0 5.0 4.0 18.0 69.0
I. WELLNESS POLLICIES Food service staff were asked how they felt about the state’s push towards a school wellness policy. One of the respondents thought it was a good idea, one thought the state should not be so involved, and one commented that they try to serve healthy foods the children will eat. Principals were asked about their knowledge of areas of a school wellness policy, confidence to implement and enforce wellness policies at their school under certain circumstances, and

16
accuracy of certain wellness policies. The three questions and answers (*=1 response) are listed below. Question: How much do you KNOW ABOUT each of the following areas as part of the implementation of a school wellness policy?
A great deal
A lot
Some
Not Very Much
Nothing
1 Preventing the sale of high fat high sugar foods for fundraising activities by students, teachers or parent groups
5 4 3 ***
2 1
2 Preventing the sale of carbonated beverages in the vending machines
5 **
4 *
3
2
1
3 Regulating the type of food that can be served or sold by the school meals program
5 4 *
3 **
2 1
4 Regulating teachers’ use of food or food coupons to reward students
5 *
4 **
3 2 1
5 Removal of high fat/high sugar foods from vending machines
5 **
4 *
3 2 1
6 Appointing individuals to be operationally responsible to ensure the school wellness policy is met
5 4 *
3 2 1 *
7 Preventing the sale of high fat/high sugar items at school stores and/or snack bars
5 *
4 *
3 *
2 1
8 When working with soft drink/soda companies, not using brand name on contracts
5 4 *
3 *
2 1 *
9 Developing committees and teams in the school or school district to focus on school wellness
5 *
4 **
3 2 1
10 Including physical education requirement in the curriculum 5
**
4 *
3 2 1
11 Including nutrition education in the curriculum 5 **
4 *
3 2 1

17
Question: If you were to add some of the components listed above to your wellness policy, how confident are you that you can implement and enforce the policy at your school when…
Very confident
Not at all
1 Teachers resist implementation of the policy because they do not have time to add any additional information to their lesson plans
5 **
4 3 2 1 *
2 Parents are upset about not being able to bring snacks for birthday parties and other activities
5 *
4 3 2 *
1
3 Federal funding has not been allocated for implementation of a school wellness policy
5 **
4 3 2 1 *
4 You lose money from vending and school stores 5 **
4 3 2 1 *
5 You rearrange schedules for physical activity 5 **
4 3 2 1 *
6 You are perceived as a bad guy by faculty, students, and parents when the school wellness policy is adopted
5 **
4 3 2 *
1
7 The food staff does not understand how to implement a school wellness policy
5 **
4 3 2 1 *
8 Students are upset about the removal of vending machines 5 **
4 3 2 1 *
9 Superintendents and other school board officials do not provide adequate support to implement a school wellness policy
5 **
4 3 2 1 *
Question: In your opinion, how accurate are each of the following statements?
Very much
Not at all
1 Implementing a school wellness policy helps improve the health of the students
5 **
4 3 *
2 1
2 Implementing a school wellness policy helps improve academic performance
5 **
4 3 *
2 1
3 Having a school wellness policy costs too much for a school to implement and enforce
5 4 3 2 *
1 **
4 Teachers and coaches are better educated if a school wellness policy is implemented
5 *
4 3 *
2 1 *
5 School wellness policies reduce the amount of money made from vending machines
5 *
4 3 *
2 1 *
6 School foodservice staff need to learn new cooking methods if a school wellness policy is implemented
5 **
4 3 2 1 *
7 Teachers have difficulty providing rewards in the classroom if high calorie/high fat snacks are banned
5 4 3 2 1 ***
8 School wellness policies help to increase students’ attendance 5 **
4 3 *
2 1
9 School food service staff are able to offer a healthy menu they are proud to serve when a school wellness policy is implemented
5 *
4 3 *
2 *
1

18
J. SUGGESTIONS FOR HEALTHY EATING FROM PARENTS, PRINCIPALS, AND
OTHER COMMUNITY MEMBERS
● Changes made in the school lunch will have to be driven by motivated parents, using Brookline, Ashland, and Framingham as examples.
● Work with high school students to spearhead the movement towards healthier snacks and school lunches.
● Improve/increase education in a fun informative manner.
● Make this a community manner.
● Have teachers serve as role models.
● Improve school lunches by providing
O Better tasting vegetables and fruits
O Enough time to buy and eat lunch (children complain about the lines being too long and not having enough time to eat their lunch)
O Better snacks
o More nutritious options/less fattening foods (French toast sticks and mozzarella sticks are not healthy options)
o Education regarding making healthier food choices/connections between healthy eating, being healthy, learning, and being successful and happy
o Healthier lunches (offer healthy foods rather than healthy as an option because kids will never choose healthy if they have a choice)
o Non-sugar drinks for children who do not drink milk

19
Strategic Plan
Information gathered in the Town of Northborough Community Needs Assessment on
Childhood Obesity 2008-2009 was used to create this strategic plan.
1. Increase awareness of the importance of the 60 minutes/day of physical activity for
children in Northborough (Similar to the NFL message). 2. Increase collaboration among diverse partners (Chief of Police, Superintendent, school
nurses, restaurants).
3. Work with restaurants to have them mark “healthy options” on menus (as a sustainable change).
4. Pilot program in a school(s) for limiting drop off location ¼ or ½ mile from the school to
increase activity by making kids walk the distance.
5. Incorporate nontraditional options for physical activity (not just organized sports).
6. Pilot program in school(s) to work with classroom teachers to incorporate physical activity in the classroom during the school day.
7. Increase training for staff who implement physical activity/sports/exercise programs to
ensure maximum movement during the allotted time.
8. Invite a recognized Food Service Director to present to the Superintendent so he/she is aware of positive changes that can be made in the school lunch program.
9. Work with developers to improve marked lanes, walk signs and sidewalks to promote
walkability between new and existing developments.

20
REFERENCES
1. U.S. Department of Health and Human Services, Centers for Disease Control and
Prevention. Defining Childhood Overweight. May 22, 2007; http://www.cdc.gov/nccdphp/dnpa/obesity/childhood/defining.htm. Accessed October 27, 2007.
2. Institute of Medicine. "Progress in Preventing Childhood Obesity: How Do We Measure
Up?" Report Brief, Draft 6 August 24, 2006. 3. Massachusetts Department of Public Health, Division of Nutrition, Center for
Community Health. Growing concerns about obesity in Massachusetts during pregnancy and early childhood: a statistical analysis of WIC PNSS and PedNSS data. http://www.mass.gov/Eeohhs2/docs/dph/behavioral_risk/phc_brfss_obesity.ppt. Accessed March 4, 2007.
4. Massachusetts Department of Public Health, Nutrition and Physical Activity Unit. Evaluation of Healthy Choices: a school-based nutrition and physical activity program. 2003.
5. Massachusetts Department of Education. Massachusetts Youth Risk Behavior Survey
Results. 2002. 6. Childhood Obesity: An epidemic is gripping California and the nation. How did we get
here? What do we do now? Advertising Supplement to the New York Times, Kaiser
Permanente, UC San Francisco Medical School, UCLA Medical School, January, 2006. 7. Olshansky SJ, Passaro DJ, Hershow RC, et al. A potential decline in life expectancy in
the United States in the 21st century. N Engl J Med. Mar 17 2005;352(11):1138-1145. 8. Serdula MK, Ivery D, Coates RJ, Freedman DS, Williamson DF, Byers T. Do obese
children become obese adults? A review of the literature. Prev Med. Mar 1993;22(2):167-177.
9. Whitaker RC, Wright JA, Pepe MS, Seidel KD, Dietz WH. Predicting obesity in young adulthood from childhood and parental obesity. N Engl J Med. Sep 25 1997;337(13):869-873.
10. Chan SC, Lam TH, Salili F, Leung GM, Wong DC, Botelho RL. A randomized controlled trial of an individualized motivational intervention on smoking cessation for parents of sick children: A pilot study. Applied Nursing Research. 2005;18:178-181.
11. Power C, Lake JK, Cole TJ. Measurement and long-term health risks of child and adolescent fatness. International Journal of Obesity & Related Metabolic Disorders:
Journal of the International Association for the Study of Obesity. 1997;21(7):507-526. 12. Berenson GS, Srinivasan SR, Wattigney WA, Harsha DW. Obesity and cardiovascular
risk in children. Annals of the New York Academy of Sciences. 1993;699:93-103. 13. Mahoney LT, Burns TL, Stanford W, et al. Coronary risk factors measured in childhood
and young adult life are associated with coronary artery calcification in young adults: the Muscatine Study. Journal of the American College of Cardiology. 1996;27(2):277-284.
14. Rosner B, Prineas R, Daniels SR, Loggie J. Blood pressure differences between blacks and whites in relation to body size among US children and adolescents. Am J Epidemiol.
May 15 2000;151(10):1007-1019.

21
15. Pinhas-Hamiel O, Dolan LM, Daniels SR, Standiford D, Khoury PR, Zeitler P. Increased incidence of non-insulin-dependent diabetes mellitus among adolescents. J Pediatr. May 1996;128(5 Pt 1):608-615.
16. Koplan JP, Liverman CT, Kraak VI, Committee on Prevention of Obesity in Children and Y. Preventing childhood obesity: health in the balance: executive summary. Journal of
the American Dietetic Association. Jan 2005;105(1):131-138. 17. Anesbury T, Tiggemann M. An attempt to reduce negative stereotyping of obesity in
children by changing controllability beliefs. Health Educ Res. Apr 2000;15(2):145-152. 18. Bell SK, Morgan SB. Children's attitudes and behavioral intentions toward a peer
presented as obese: does a medical explanation for the obesity make a difference? J
Pediatr Psychol. Apr-May 2000;25(3):137-145. 19. Strauss RS, Pollack HA. Social marginalization of overweight children. Arch Pediatr
Adolesc Med. Aug 2003;157(8):746-752. 20. Zametkin AJ, Zoon CK, Klein HW, Munson S. Psychiatric aspects of child and
adolescent obesity: a review of the past 10 years. J Am Acad Child Adolesc Psychiatry.
Feb 2004;43(2):134-150. 21. Friedlander SL, Larkin EK, Rosen CL, Palermo TM, Redline S. Decreased quality of life
associated with obesity in school-aged children. Arch Pediatr Adolesc Med. Dec 2003;157(12):1206-1211.
22. Schwimmer JB, Burwinkle TM, Varni JW. Health-related quality of life of severely obese children and adolescents. Jama. Apr 9 2003;289(14):1813-1819.
23. Wang G, Dietz WH. Economic burden of obesity in youths aged 6 to 17 years: 1979-1999. Pediatrics. May 2002;109(5):E81-81.
24. Institute of Medicine. Preventing Childhood Obesity: Health in the Balance. Washington, DC: The National Academies Press; 2005.
25. Sturm R. Childhood obesity -- what we can learn from existing data on societal trends, part 2. Prev Chronic Dis. Apr 2005;2(2):A20.
26. Lee SM, Burgeson CR, Fulton JE, Spain CG. Physical education and physical activity: results from the School Health Policies and Programs Study 2006. J Sch Health. Oct 2007;77(8):435-463.
27. McDonald NC. Active transportation to school: trends among U.S. schoolchildren, 1969-2001. Am J Prev Med. Jun 2007;32(6):509-516.
28. Roberts DF, et. al. Kids & Media @ the New Millennium, a Kaiser Family Foundation
Report 1999. 29. Harris M. Food Product Introductions Continue to Decline in 2000,. FoodReview.
2002;25(1):24-27. 30. Institute of Medicine. Food Marketing to Children and Youth: Threat or Opportunity?
2005. 31. Schlosser E. Fast Food Nation: The Dark Side of the American Meal. Boston: Houghton
Mifflin; 2001. 32. Bowman SA, Gortmaker SL, Ebbeling CB, Pereira MA, Ludwig DS. Effects of fast-food
consumption on energy intake and diet quality among children in a national household survey. Pediatrics. Jan 2004;113(1 Pt 1):112-118.

22
33. Wechsler H, Brener ND, Kuester S, Miller C. Food service and foods and beverages available at school: results from the School Health Policies and Programs Study 2000. J
Sch Health. Sep 2001;71(7):313-324. 34. Jeffery RW, French SA. Epidemic obesity in the United States: are fast foods and
television viewing contributing? Am J Public Health. Feb 1998;88(2):277-280. 35. "Soft Drinks as Top Calorie Culprit."
http://www.sciencenews.org/articles/20050618/food.asp. Accessed April 27, 2007. 36. Templeton SB, Marlette MA, Panemangalore M. Competitive foods increase the intake
of energy and decrease the intake of certain nutrients by adolescents consuming school lunch. J Am Diet Assoc. Feb 2005;105(2):215-220.
37. Hoehner CM, Ivy A, Ramirez LK, Handy S, Brownson RC. Active neighborhood checklist: a user-friendly and reliable tool for assessing activity friendliness. Am J Health
Promot. Jul-Aug 2007;21(6):534-537. 38. Brownson RC, Hoehner CM, Brennan LK, Cook RA, Elliott MB, McMullen KM.
Reliability of two instruments for auditing the environment for physical activity. J Phys
Act Health. 2004;1:189-207. 39. American Fact Finder, US Census Bureau. Accessed October 10, 2009.

23
APENDIX A.
PARENT SURVEY

24

25

26

27

28

29

30

31

32

33
APPENDIX B.
PRINCIPAL SURVEY

34
=============================General Questions========================
1. Over the past 10 years, have you observed more or less children in this community who are
overweight or obese?
A. A lot more B. Slightly more C. About the same D. Slightly less E. A lot less F. I have not noticed
2. Do you think there is a childhood obesity problem?
A. No B. Yes
2a. If you chose “yes,” please explain.
======================Community-Related Questions========================
3. Do you think that kids in this community have enough opportunities to be physically active?
A. No B. Yes
3a. If yes, what are some of the opportunities that you are aware of?

35
4. Do you think there are barriers that make it difficult for children in this community to get as
much physical exercise as would be desirable?
A. No B. Yes
4a. If “yes,” what are the barriers? 5. Do you think there are barriers that make it difficult for children in this community to make
healthy food choices?
A. No B. Yes
5a. If “yes,” what are the barriers?
==========================School-Related Questions========================
6. On a scale from 1 to 5, how much influence does the school have on the health of students?
(1=no influence and 5 = a big influence)
1 2 3 4 5 7. What, if anything, can schools do to help reduce the rates of childhood obesity?

36
8. What programs/activities are offered at your school that help to reduce the rates of childhood
obesity in Northborough?
9. Are there specific barriers that you encounter? (e.g. barriers specific to offering physical activity and healthy eating)
10. What percentage of your students walk to school? ____________%
11. Are there barriers to students walking to school?
A. No B. Yes
11a. If “yes,” what are the barriers?
12. How many minutes of recess do students at your school get each day? ________ minutes
13. How many days do students have physical education each week? __________ days 14. How many minutes per day do students have physical education? __________ minutes 15. Is fresh fruit available on the regular lunch menu?
A. No B. Yes

37
15a. If “yes,” please indicate frequency:
A. Daily B. 2 or 3 times per week C. Once a week
16. Are there vending machines on your school site?
A. No B. Yes
16a. If “yes,” when do student have access to these machines?
A. Students do not have access B. Before school C. During school D. After school

38
==========================School Wellness Policies======================== The Child Nutrition and WIC Reauthorization Act of 2004 requires school districts participating in federally subsidized child nutrition programs (e.g., National School Lunch Program, School Breakfast Program) to establish a local school wellness policy. 17. Do you have a copy of your district’s wellness policy? Yes No 18. How much do you KNOW ABOUT each of the following areas as part of the implementation of a school wellness policy?
A
great deal
A lot
Some
Not Very Much
Nothing
1 Preventing the sale of high fat high sugar foods for fundraising activities by students, teachers or parent groups
5 4 3 2 1
2 Preventing the sale of carbonated beverages in the vending machines
5 4 3 2 1
3 Regulating the type of food that can be served or sold by the school meals program
5 4 3 2 1
4 Regulating teachers’ use of food or food coupons to reward students
5 4 3 2 1
5 Removal of high fat/high sugar foods from vending machines
5 4 3 2 1
6 Appointing individuals to be operationally responsible to ensure the school wellness policy is met
5 4 3 2 1
7 Preventing the sale of high fat/high sugar items at school stores and/or snack bars
5 4 3 2 1
8 When working with soft drink/soda companies, not using brand name on contracts
5 4 3 2 1
9 Developing committees and teams in the school or school district to focus on school wellness
5 4 3 2 1
10
Including physical education requirement in the curriculum
5 4 3 2 1
11
Including nutrition education in the curriculum 5 4 3 2 1

39
19. If you were to add some of the components listed above to your wellness policy, how confident are you that you can implement and enforce the policy at your school when
Very confident
Not at all
1 Teachers resist implementation of the policy because they do not have time to add any additional information to their lesson plans
5 4 3 2 1
2 Parents are upset about not being able to bring snacks for birthday parties and other activities
5 4 3 2 1
3 Federal funding has not been allocated for implementation of a school wellness policy
5 4 3 2 1
4 You lose money from vending and school stores 5 4 3 2 1
5 You rearrange schedules for physical activity 5 4 3 2 1
6 You are perceived as a bad guy by faculty, students, and parents when the school wellness policy is adopted
5 4 3 2 1
7 The food staff does not understand how to implement a school wellness policy
5 4 3 2 1
8 Students are upset about the removal of vending machines 5 4 3 2 1
9 Superintendents and other school board officials do not provide adequate support to implement a school wellness policy
5 4 3 2 1
20. In your opinion, how accurate are each of the following statements?
Very much
Not at all
1 Implementing a school wellness policy helps improve the health of the students
5 4 3 2 1
2 Implementing a school wellness policy helps improve academic performance
5 4 3 2 1
3 Having a school wellness policy costs too much for a school to implement and enforce
5 4 3 2 1
4 Teachers and coaches are better educated if a school wellness policy is implemented
5 4 3 2 1
5 School wellness policies reduce the amount of money made from vending machines
5 4 3 2 1
6 School foodservice staff need to learn new cooking methods if a school wellness policy is implemented
5 4 3 2 1
7 Teachers have difficulty providing rewards in the classroom if high calorie/high fat snacks are banned
5 4 3 2 1
8 School wellness policies help to increase students’ attendance 5 4 3 2 1
9 School food service staff are able to offer a healthy menu they are proud to serve when a school wellness policy is implemented
5 4 3 2 1

40
=============================Recommendations======================== 21. What would you recommend as strategies that would reduce factors that contribute to
overweight and obesity in children? Are there strategies specific to physical activity? Nutrition?
22. Is there anything else you would like to share?

41
APPENDIX C.
FOOD SERVICE SURVEY

42
Food Service Personnel
1. Please describe a typical lunch served at your school. 2. How long is a lunch period at your school?
3. How many minutes do children get to eat, not including the time they wait in line? 4. What goes into the decision about what items to serve? 5. How do you balance the role of providing options and encouraging students to make
healthy choices with providing access only to healthy foods? 6. What changes, if any, have you tried/would like to try to encourage healthier dietary
habits among students? 7. Do you consider overweight/obesity to be a problem among students at this school?
Why/why not? 8. What role, if any, do you feel the school food environment plays in childhood/adolescent
obesity? 9. How do feel about the media's portrayal of schools' food environments and its role in
childhood/adolescent obesity? 10. How do you feel about the state's push for schools to establish a wellness policy? 11. What impact, if any, will this have on your school's food service program?
12. What challenges, if any, do you encounter on regular basis that make your job difficult?
13. In an ideal world, what would the school food service program at this school look like? What would your role be?

43
APPENDIX D.
FOCUS GROUP GUIDE

44
Discussion Guide
1. Do you believe there is a childhood obesity problem in Northborough? Why or why not?
2. When you think of the term “healthy weight,” what comes to mind?
3. Why is it important for children to maintain a “healthy weight?”
4. What are the most important factors to encouraging/helping children maintain a healthy lifestyle? Probes: how much physical activity should children get each day? What types and for how long? What are healthy foods?
5. Do you think children in the community have opportunities to be physically active and eat a healthy diet? What are some of the activities you are aware of?
6. What can parents, schools, and communities do to encourage/help children maintain a healthy lifestyle?
7. Are there barriers that parents in Northborough face in helping their children to participate in physical activity?
8. Are there barriers that parents in Northborough face in helping their children to eat healthy foods?
9. What suggestions do you have for changes at home, in schools, and in the community that would help children eat healthy foods and engage in physical activity?

45
APPENDIX E.
STREET AUDIT

46

47

48