northern saskatchewan prenatal biomonitoring study ...€¦ · the biomonitoring study was intended...
TRANSCRIPT

Ministry of Health, Government of Saskatchewan, 2019
Northern Saskatchewan Prenatal Biomonitoring
Study Technical Summary Report


Northern Saskatchewan Prenatal Biomonitoring Study
Summary Report
Ministry of Health, Government of Saskatchewan, 2019
For more information contact:
Environmental Health Population Health Branch
Miinistry of Health 3475 Albert Street,
Regina, SK, Canada, S4S 6X6
Telephone: 306-787-8847
Website: https://publications.saskatchewan.ca:443/api/v1/products/101374/formats/112048/download

Executive Summary ......................................................................................................................................................... 1
Introduction ..................................................................................................................................................................... 4
Study Rationale ......................................................................................................................................................... 4 Biomonitoring as the Tool of Choice ......................................................................................................................... 5 Stakeholder Analysis ................................................................................................................................................. 6
Alberta’s Biomonitoring Program ......................................................................................................................... 6 Engagement with Northern Communities ............................................................................................................ 6
Glossary ........................................................................................................................................................................... 7
Methodology ................................................................................................................................................................... 9
Scope ......................................................................................................................................................................... 9 Sample Selection ....................................................................................................................................................... 9
Recruitment and Consent ................................................................................................................................... 10
Chemical Selection .................................................................................................................................................. 12 Selection of Biomonitoring Matrix .......................................................................................................................... 13 Laboratory Analysis ................................................................................................................................................. 13 Statistical Analysis ................................................................................................................................................... 14
Analysis and Limitations...................................................................................................................................... 14 Weighting of Concentrations .............................................................................................................................. 14
Ethical Considerations ............................................................................................................................................. 15
Results… ........................................................................................................................................................................ 16
Preamble ................................................................................................................................................................. 16 Pooled Samples ....................................................................................................................................................... 17
Comparisons to Other Studies ................................................................................................................................ 18 Serum Chemical Levels in Northern Saskatchewan ................................................................................................ 18 Results by Chemical Class ........................................................................................................................................ 19
Organic Chemicals ............................................................................................................................................... 19 Cotinine............................................................................................................................................................ 19 Phytoestrogens ................................................................................................................................................ 20 Dioxins and Furans ........................................................................................................................................... 21 Polychlorinated Biphenyls (PCBs) .................................................................................................................... 23 Organochlorine Pesticides ............................................................................................................................... 25 DDT and Related Compounds .......................................................................................................................... 26 Hexachlorobenzene ......................................................................................................................................... 28
Polybrominated Diphenyl Ethers ..................................................................................................................... 30 Perfluorochemicals .......................................................................................................................................... 31 Bisphenol-A ...................................................................................................................................................... 34 Octylphenol ..................................................................................................................................................... 35 Methylmercury ................................................................................................................................................ 36 Phthalates ........................................................................................................................................................ 38 Parabens .......................................................................................................................................................... 39
TABLE OF CONTENTS

Trace Metals and Minerals ................................................................................................................................. 41 Trace Metals (Non-Micronutrients) .................................................................................................................... 41
Aluminum (Al) .................................................................................................................................................. 41 Antimony (Sb) .................................................................................................................................................. 42 Arsenic (As) ...................................................................................................................................................... 43 Barium (Ba) ...................................................................................................................................................... 45 Cadmium (Cd) .................................................................................................................................................. 46 Cesium (Cs) ...................................................................................................................................................... 47 Chromium (Cr) ................................................................................................................................................. 48 Lead (Pb) .......................................................................................................................................................... 49 Mercury (Hg) .................................................................................................................................................... 51 Strontium (SR) .................................................................................................................................................. 53 Uranium (U) ..................................................................................................................................................... 54
Mineral Micronutrients ....................................................................................................................................... 55 Boron (B) .......................................................................................................................................................... 55 Cobalt (Co) ....................................................................................................................................................... 56 Copper (Cu) ...................................................................................................................................................... 57 Iron (Fe) ........................................................................................................................................................... 58 Manganese (Mn).............................................................................................................................................. 59 Magnesium (Mg) .............................................................................................................................................. 59
Molybdenum (Mo) ........................................................................................................................................... 60 Nickel (ni) ......................................................................................................................................................... 61 Selenium (Se) ................................................................................................................................................... 61 Zinc (Zn) ........................................................................................................................................................... 63
STUDY Limitations ......................................................................................................................................................... 64
Biomonitoring ......................................................................................................................................................... 64 Study Design and Implementation .......................................................................................................................... 64
Missing Demographic Information ..................................................................................................................... 64 Pooled Sample Design ......................................................................................................................................... 64 Missing People .................................................................................................................................................... 65 Limited Biological Matrix Selection ..................................................................................................................... 65 Limited Options for Comparison ......................................................................................................................... 65
Discussion ...................................................................................................................................................................... 66
Cross-Jurisdiction Collaboration .............................................................................................................................. 66 Smoking - An Important Source of Exposure and Risk ............................................................................................ 66 Special Consideration in Interpretation .................................................................................................................. 70
Biological ............................................................................................................................................................. 70 Psychological ....................................................................................................................................................... 70
Social ................................................................................................................................................................... 70 Balancing Risk – Breast Feeding is Better ................................................................................................................ 71 Risk Assessments – The Role of Biomonitoring ....................................................................................................... 71
Conclusions .................................................................................................................................................................... 72
Works Cited ................................................................................................................................................................... 73
Acknowledgements ....................................................................................................................................................... 81
studies in the United States .......................................................................................................................... 67
Figure 1: Biomonitoring communities and the resulting pools ..................................................................................... 11
Figure 2: Type of chemicals studied .............................................................................................................................. 13
Figure 3: Infographic of how samples were assigned to geographic pools ................................................................... 17
Figure 4: Concentrations of cotinine in the blood serum of pregnant women in Saskatchewan and Alberta .............. 20
Figure 5: Concentrations of OCDD in blood serum of pregnant women in Saskatchewan and Alberta as determined by lipid weight (A, B) and by total concentration in serum (C and D) ............................................................ 22
Figure 6: Graphical comparison of the concentration of PCBs found in the Saskatchewan study against various large scale biomonitoring initiatives ...................................................................................................................... 24
Figure 7: Concentrations of 4,4’-DDE in blood serum of pregnant women in Saskatchewan and Alberta as determined by lipid weight (A, B) and by total concentration in serum (C and D) ........................................ 27
Figure 8: Concentrations of hexachlorobenzene in blood serum of pregnant women in Saskatchewan and Alberta as determined by lipid weight (A, B) and by total concentration in serum (C and D) ........................................ 29
Figure 9: Contrasting the range of PBDE concentrations in the Saskatchewan study to the range of values for the same in the Alberta study .............................................................................................................................. 31
Figure 10: Concentrations of Perfluorooctanoate (PFOA) in the blood serum of pregnant women in Saskatchewan (A) and Alberta (B) ......................................................................................................................................... 32
Figure 11: Concentrations of Perfluorooctane sulfonate (PFOS) in the blood serum of pregnant women in Saskatchewan (A) and Alberta (B) ................................................................................................................. 33
Figure 12: Concentrations of methylmercury in the blood serum of pregnant women in Saskatchewan (A) and Alberta (B). .................................................................................................................................................... 37
Figure 13: Concentrations of aluminum in the blood serum of pregnant women in Saskatchewan and Alberta ......... 42
Figure 14: Serum concentration of arsenic in pregnant women in Saskatchewan ........................................................ 44
Figure 15: Concentrations of cesium in the blood serum of pregnant women in Saskatchewan and Alberta .............. 48
Figure 16: Concentrations of lead in the blood serum of pregnant women in Saskatchewan (A) and Alberta by geographic region (B) .................................................................................................................................... 51
Figure 17: Concentrations of inorganic mercury in the blood serum of pregnant women in Saskatchewan (A) and Alberta by age (B) .......................................................................................................................................... 52
Figure 18: Concentrations of cobalt in the blood serum of pregnant women in Saskatchewan and Alberta ............... 57
Figure 19: Concentrations of selenium in the blood serum of pregnant women in Saskatchewan and Alberta ........... 63
Figure 20: Tobacco impact on biomonitoring ................................................................................................................ 69
Table 1: Sampling over two years .................................................................................................................................. 11
Table 2: Concentrations of serum octylphenol by pool ................................................................................................ 35
Table 3: Concentration of detected pthalate metabolites by pool ............................................................................... 39
Table 4: Concentrations of paraben isomers by pool .................................................................................................... 40
Table 5: Chemicals found to be statistically significantly different for smokers and non-smokers in biomonitoring
TABLE OF FIGURES
TABLE OF TABLES
1
What was the study about?
Humans are surrounded by chemicals—some are essential to life (e.g., oxygen, iron, selenium), while some may
cause harm under certain circumstances or at certain doses. Environmental chemicals describe those man-made
or naturally occurring chemicals that we are exposed to in our daily lives. People interact with a variety of
chemicals every day. Some may be eaten or drank, breathed in, or absorbed through the skin in consumer
products, water, soil, food, or air.
The biomonitoring study looked at various environmental chemicals found in the blood of pregnant women in
northern Saskatchewan.
What is biomonitoring and what is the purpose of biomonitoring?
Biomonitoring measures chemicals in humans through analyzing blood, urine, hair or breast milk. At this time, it is
the most accurate means we have to determine the amount of a given chemical or element a person is exposed to
in the environment. It gives us a snapshot in time and allows us to know the quantity of a given chemical in the
body, but does not tell us information on the source, duration, or route exposure. The risk to human health is
determined by the complex interplay between the type of chemical, the amount of the chemical, what kind of
exposure, how often the exposure took place and the person exposed.
Information from biomonitoring can:
enable the public and communities to become more aware of and take steps to reduce their exposure to environmental chemicals;
enable comparisons between populations and, over time, assist with government, environment and health agencies to assess risks and take public health or environmental actions; and
assist in the prioritization of further research.
How was the study done?
The study involved the co-operation of pregnant women living in the Northern Administrative District of
Saskatchewan between April 2011 and April 2013. These pregnant women allowed any blood remaining after
their routine prenatal blood tests were completed to be included in the study. Pooling of the residual blood from
855 serum samples was done to ensure there was enough specimen for testing of over 280 environmental
chemicals.
There were six different pools of specimens based on the area of northern Saskatchewan in which the women
resided. This allowed for comparisons across the north as well as comparisons with results from a previously
completed prenatal biomonitoring study in Alberta. Some comparisons were possible with other biomonitoring
studies; however, for some chemicals, only baseline results are available.
EXECUTIVE SUMMARY

2
Who are the agencies involved?
The study was done in partnership between the Saskatchewan Ministry of Health, northern Health Authorities and
Alberta Health.
A Steering Committee was engaged to assist with overall direction of the project. This included representatives
from the Ministries of Health and Environment, northern health authorities, First Nations health authorities, and
the First Nations Inuit Health Branch of Health Canada.
Feedback and support for the project was provided by the Northern Saskatchewan Environmental Quality
Committee, the Boards of the Athabasca Health Authority, the Keewatin Yatthé and the Mamawetan Churchill
River Health Regions, the Northern Intertribal Health Authority Board of Chiefs and Executive Council, the Prince
Albert Grand Council Chiefs and the Meadow Lake Tribal Council Health and Social Services group.
Information was provided to northern health professionals involved in the care of prenatal women, including
public health nurses and physicians. Community awareness was enhanced through the use of radio messaging in
Cree, Dene and English. Pamphlets were available at all health centers and through prenatal education. Posters or
bulletin boards were used at health centers and other community centers.
What environmental chemicals were tested?
The chemicals selected were based on other Canadian biomonitoring projects as well as chemicals that may be of concern in Alberta and Saskatchewan including:
industrial and agricultural by-products,
those used in the manufacture of consumer goods (furniture, building materials, clothing, cosmetics, etc), and
those that naturally exist in the environment.
A variety of mineral micronutrients (required for good health) and trace metals, a wide variety of chemicals
classified as pesticides, PCBs, flame retardants, phlalates, dioxians and furans were tested. Commercial tobacco
contains many chemicals of concern which be can be elevated in people exposed to tobacco smoke, so continine
which is a break-down product of nicotine, was also measured.
What did the study show?
Finding a chemical in the body through testing does not necessarily mean that this poses a health risk or causes a
health problem. Some chemicals (e.g minerals) are required for good health, but too much could increase the
chance of health problems.
Some highlights include:
• Some specific chemicals in the categories such as polybrominated diphenyl ethers (flame retardants),
perfluorochemicals, most pesticides tested, dioxins and furans, were either lower than Alberta levels or
were undetectable. Uranium, nonylphenol and bisphenol A were also not detectable or were below the
level that could be accurately measured.
• Selenium and molybdenum were slightly lower than the average levels in Alberta. Iron levels were also
slightly lower in Saskatchewan than Alberta women but cobalt was higher. Both iron and cobalt help
prevent anemia (weak blood from low iron or vitamin B12).

3
The levels of lead, a heavy metal, were higher than the average levels seen in Alberta. People may be
exposed to lead through lead-based paints (in older homes), drinking water coming in contact with old
lead plumbing, consumer products, or the ingestion of lead shot or lead bullet fragments in country foods.
Smokers or those exposed to second hand smoke tend to have higher levels.
• Mercury levels were comparable to those in Alberta; however, the levels in the far northern area of
Saskatchewan were higher. Methylmercury levels tend to be higher in those who consume a lot of fish
especially large predatory fish.
• Continine levels, a breakdown product of nicotine, were higher in northern Saskatchewan women
indicating higher exposures to tobacco smoke either through smoking or passive smoke exposure.
Exposure to tobacco smoke increases exposure to many other environmental chemicals as well.
OVERALL, MOST OF THE ENVIRONMENTAL CHEMICAL TESTING FOR NORTHERN SASKATCHEWAN REVEALED LEVELS LOWER THAN OR COMPARABLE TO LEVELS IN PREGNANT WOMEN IN THE ALBERTA STUDY.
4
Humans are immersed in chemicals. Some of these chemicals, such as oxygen and hydrogen, are essential to life.
On the other hand, some chemicals may cause harm under certain circumstances. Environmental chemicals are
those chemical substances we are exposed to in our daily lives; some are human-made while others are naturally
occurring; as with all chemicals, they may be helpful, harmful or neither.
This biomonitoring study should be seen as foundational work for developing a better understanding of the people
of Saskatchewan’s exposures to environment chemicals of interest or potential concern. Biomonitoring is a tool
that allows for a population level understanding of what chemicals people are being exposed to and to some
degree, how much.
The biomonitoring study was intended to establish typical human exposures to environmental chemicals during
pregnancy for women living in northern Saskatchewan. This purpose arose from several streams of thought:
INTRODUCTION
STUDY RATIONALE
Saskatchewan has never systematically performed population level biomonitoring. In Canada,
there is information available for overall Canadian biomonitoring results, but Saskatchewan
was not included in the sampling for the Canadian Health Measures Survey until its fourth
cycle in 2014/15. There is also biomonitoring information available for northern Canada (north
of 60) there are biomonitoring projects involving some Canadian First Nations communities,
including some in Saskatchewan. The data collected from a systematic biomonitoring program
could inform governments, researchers and health practitioners in a variety of ways.
The Alberta Ministry of Health is a key partner. They have a similar biomonitoring program.
Periodically they collect information; however, they were also interested in establishing a
comparator similar to their population prior to industrial particularly oil and gas development.
Parts of northern Saskatchewan are relatively untouched by oil and gas developments and so
this population was considered a reasonable comparitor.
New environmental chemicals continue to be developed with the potential for human health
exposure. Biomonitoring has potential to inform further action.
Pregnant women are of particular concern in terms of potentially adverse exposures due to the
sensitive nature of the fetus, and as it is routine for these women to have blood studies done
5
Biomonitoring is the measurement of chemicals or their metabolites (break down products) in humans. It is done
by measuring these chemicals in a biological matrix such as blood, urine, hair or breast milk.1 At this time, it is the
most accurate means we have to determine the amount of a given chemical or element a person is exposed to in
the environment. This information can then be used to inform decisions about health risks.
All persons interact with a variety of chemicals on any given day. Some may be eaten, inhaled or absorbed
through the skin (termed the ‘route’ of exposure) in any or all consumer products, water, soil, food or air. The risk
to human health is determined by the complex interplay between the chemical in question, the dose (amount) of
the chemical, the routea and frequency of exposure, and the person exposed.2
The internal dose is the measurable amount of a chemical that exists in a biological matrix. It depends on both the
pharmacokinetics (what the body does to the chemical) and the pharmacodynamics (what the chemical does to
the body) of a particular chemical in an individual. It is also affected by the same factors that are considered in
human health risk assessments (chemical characteristics, route of exposure, duration of exposure, frequency of
exposure and receptor).
Biomonitoring gives us a snapshot in time. It allows us to determine the internal dose, but only for a specific point
in time. It does not provide us with information on the source, duration or route of exposure, all of which are
fundamental in developing a complete understanding of exposure. Periodic biomonitoring, where biomonitoring
is repeated in a given population at a certain frequency, still cannot account for source, duration or route, but it
does allow for comparison over time.
Even with its limitations, biomonitoring has proven valuable in understanding population exposures to
environmental chemicals. In Canada, in addition to the Alberta program, the Canadian Health Measures Survey10
(CHMS), the Maternal-Infant Research on Environmental Chemicals (MIREC), the First Nations Biomonitoring
Initiative29, and the Northern Contaminants Program (in Nunavut, Northwest Territories and the Yukon) all used
biomonitoring as a tool to identify and monitor population exposures to environmental chemicals.
a Ingestion, inhalation, injection or dermal absorption
BIOMONITORING AS THE TOOL OF CHOICE
The data provided from biomonitoring has the capacity to inform governments, researchers and health
practitioners by152:
Establishing baseline levels of chemicals in the Canadian population.
Allowing for comparison of exposure to environmental chemicals among different populations.
Identification of chemicals for which further action should be taken to protect the public’s health.
Supporting future research on potential links between exposure to certain chemicals and specific health
effects.
Contributing to international monitoring programs.

6
Biomonitoring is a novel tool with great promise, but there are limitations on what can be drawn from the
information collected using this methodology. These limitations will be explored further in the “Limitations”
sections of this document and should be considered seriously in interpreting the findings of this study.
The Alberta Biomonitoring Program began with Phase I in 2005 and focussed on pregnant women.3 The second
phase included a study of Southern Alberta children in 2006.4 Phase III of this program is underway.
Alberta’s program was implemented after the development of the oil sands in Northern Alberta and therefore, a
baseline level of population exposure to chemicals of potential concern was not obtained prior to establishment of
the industry.
Northern Saskatchewan was deemed a suitable population to act as a proxy baseline. Subsequently,
Saskatchewan was offered the opportunity to undergo its own biomonitoring initiative which, along with providing
comparison values for Alberta, can provide some valuable information on Northern Saskatchewan’s exposures.
At the outset, a steering committee for the study was engaged to assist with overall direction of the project.
Representatives included: the Saskatchewan Ministries of Health and Environment, northern health authorities
and northern health regions, First Nations Health Authorities, and the First Nations Inuit Health Branch of Health
Canada.
The goals, principles, design, and purpose were shared with a variety of northern leadership, health and/or
environmental groups who provided feedback and support for the project including Northern Saskatchewan
Environmental Quality Committee, the Boards of the Athabasca Health Authority, the Keewatin Yatthé and the
Mamawetan Churchill River Health Regions, the Northern Intertribal Health Authority Board of Chiefs and
Executive Council, the Prince Albert Grand Council Chiefs and the Meadow Lake Tribal Council Health and Social
Services group.
Further information was provided to northern health professionals involved with the care of prenatal women
including public health nurses and physicians. Community awareness was enhanced through the use of radio
messaging in Cree, Dene and English as well as pamphlets available at all health centers and through prenatal
education, and posters used at health centers and other community centers or bulletin boards
STAKEHOLDER ANALYSIS
ALBERTA’S BIOMONITORING PROGRAM
ENGAGEMENT WITH NORTHERN COMMUNITIES
7
Aliquot A small portion of the total sample.
Arithmetic mean The average set of numbers, calculated by adding them together and dividing by the
number of terms in the set.
Background
concentration of
chemicals
A subjective term normally used to describe the baseline concentration of a chemical in
humans or the environment where there has been no occupational or accidental
exposure to high concentrations.
Bioaccumulation Accumulation of substances in an organism (plant, animal or human) above what is in the
environment (e.g. water, air, food).
Biological matrix Body fluid or tissue (e.g. blood, urine, breast milk, expelled air, hair, nails, etc.)
Biomonitoring The measurement of chemicals in human bodies. These measurements are often made
by analzying blood, urine or other body tissues such as hair or nails.
Blood serum The clear yellowish liquid part of whole blood. It is obtained by clotting the whole blood,
and then by separating the liquid from the solids.
Congener Chemicals that are related to each other by origin, structure, or function.
Descriptive statistics Statistical analysis that describes or summarizes the data in a meaningful way.
Environnmental
chemicals
The chemicals that can be found in the world around humans - both in nature and in the
man-made environment.
Fungicide A chemical that destroys fungus.
Geometric mean A type of mean or average that uses the product of a set of numbers (the nth root of the
product of n numbers).
Internal dose The amount of an agent/compound that enters the body by crossing an exposure surface
that acts like an absorption barrier such as the skin, or gastrointestinal lining. The same
as "absorbed dose".
Isomer Each of two or more compounds with the same chemical formula that have different
arrangements of atoms leading to different properties.
Limit of detection
(LOD)
The lowest concentration at which chemical can be measured.
GLOSSARY
8
Limit of
quantification (LOQ)
The limit of quantitation (LOQ) is set at a higher value than the limit of detection and is
the concentration at which concentrations of an analyte can be reported with
confidence.
Lipid Synonym of fat or oils.
Lipid serum weight This is the concentration of a lipophilic chemical presented in reference to the amount of
lipid in the serum sample.
Lipophilic “Fat loving” – describes compounds that can be easily dissolved or stored in lipids.
Man-made chemicals Chemicals that are produced by human activities, either intentionally or unintentionally,
and are not normally found in the environment. Also referred to as synthetic chemicals
or anthropomorphic (human-made) chemicals.
Metabolite A substance produced from another precursor substance through metabolic
transformation by enzymes or microorganisms in our bodies.
Naturally occurring
chemicals
Chemicals that are present or produced naturally in the environment. Some man-made
chemicals are also naturally occurring.
Opt-in consent Participants volunteer to take part in the research.
Opt-out consent Participants are contacted without volunteering to take part in the research and are
excluded when they declare they are unwilling to participate.
Periodic
biomonitoring
Repeated biomonitoring over more than one time point.
Persistent Resistant to degradation processes in our bodies or in the environment.
Pesticide A substance used to destroy insects or other organisms that may cause harm to crops or
animals.
Pharmacodynamics An area of study in pharmacology that explores the effects of substances on the human
body.
Pharmacokinetics An area of study in pharmacology that explores how the body responds to the presence
of a substance.
9
For details on the methodology please refer to the detailed technical document entitled “Northern Saskatchewan Biomonitoring Survey Report, 2019”. See: https://publications.saskatchewan.ca:443/api/v1/products/101375/formats/112049/download
The scope of this survey was to establish blood serum levels of various chemicals in women who were pregnant
and resided in the Northern Administrative District of Saskatchewan between April 2011 and April 2013.
1. Geographic: only residents in the Northern Administrative District of Saskatchewan from the former
Keewatin Yatthé, Mamawetan Churchhill River, and Athabasca Health Authorities plus the Village of
Cumberland House and Cumberland House First Nation were included;
2. Only females who were pregnant and had testing done during their pregnancy were selected;
3. Consent to use the sample was provided (direct or implied); and
4. Pregnancy testing had to be done between April 2011 and April 2013.
Pregnant women were selected for several reasons. The first is the known susceptibility of a developing fetus.
There are several chemicals known to have adverse effects on fetal development at relatively high maternal body
doses, but the effects on the fetus of new and emerging chemicals and low levels of some long standing chemicals
are less clearly defined. Second, targeting pregnant women was practical as there are routine blood tests
performed at the initial prenatal assessment. The serum specimens analyzed for biomonitoring were derived from
these blood draws - once the prenatal studies were completed if there was more than 1 ml of residual serum, the
sample was then eligible to be included for study.
- 1233 samples were collected
- 1086 consented to participate
- 841 samples were eligible for the study.
In total, the Roy Romanow Provincial Laboratory (formerly the Saskatchewan Disease Control Laboratory) received
1,233 serum samples between April 1, 2011 and April 8, 2013. Of these, 1,096 specimens were consented for
study inclusion; of those, 841 had a residual volume of 1mL and could be used for analysis. About 68% of the total
numbers of specimens from pregnant women in northern Saskatchewan were included in the pool. This is
relatively comparable to the Alberta sampling at 64% (28,484 samples drawn from 44,584 specimens collected).
The 841 samples were then grouped by geographic area into pools of at least 120 samples. This results in six
distinct collections of pooled serum samples.
METHODOLOGY
SCOPE
SAMPLE SELECTION
10
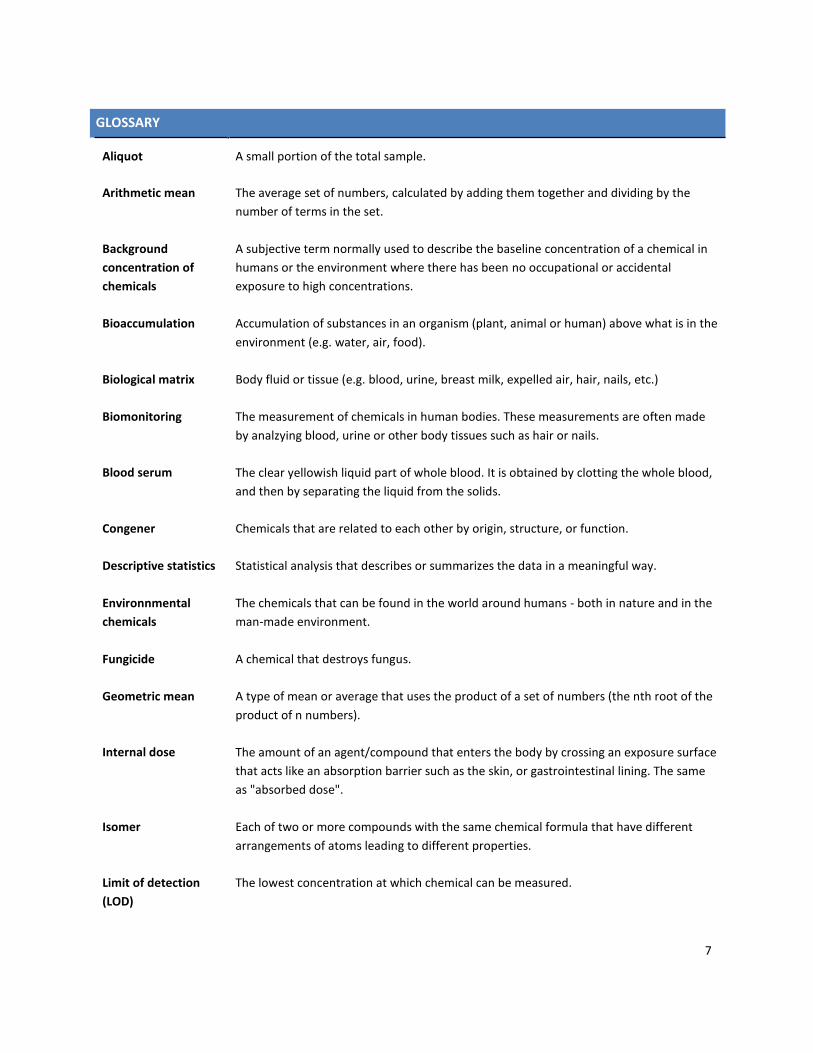
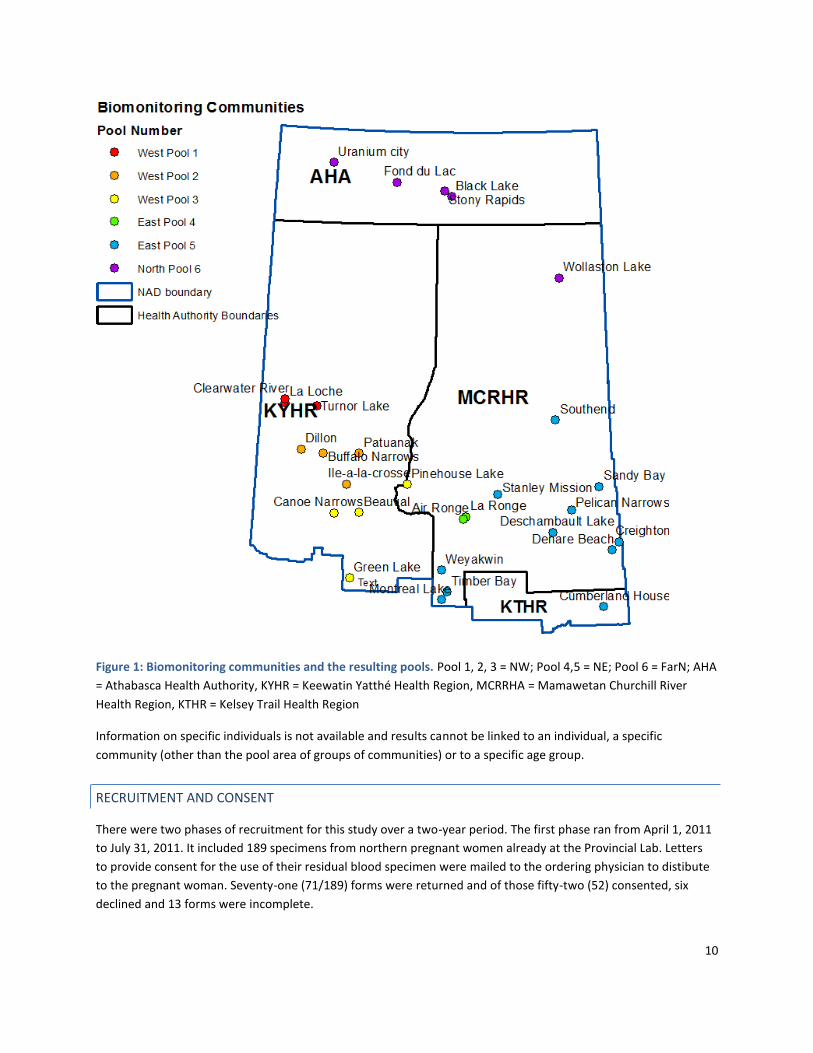
Figure 1: Biomonitoring communities and the resulting pools. Pool 1, 2, 3 = NW; Pool 4,5 = NE; Pool 6 = FarN; AHA
= Athabasca Health Authority, KYHR = Keewatin Yatthé Health Region, MCRRHA = Mamawetan Churchill River
Health Region, KTHR = Kelsey Trail Health Region
Information on specific individuals is not available and results cannot be linked to an individual, a specific
community (other than the pool area of groups of communities) or to a specific age group.
There were two phases of recruitment for this study over a two-year period. The first phase ran from April 1, 2011
to July 31, 2011. It included 189 specimens from northern pregnant women already at the Provincial Lab. Letters
to provide consent for the use of their residual blood specimen were mailed to the ordering physician to distibute
to the pregnant woman. Seventy-one (71/189) forms were returned and of those fifty-two (52) consented, six
declined and 13 forms were incomplete.
RECRUITMENT AND CONSENT

11
The second phase from August 1, 2011 to April 8, 2013 followed an extensive community awareness campaign
with the option for women to opt out. There were no refusals during this stage of the study.
Table 1: Sampling over two years
Phase One Phase Two
Date April 1, 2011 to July 31, 2011
(121 days)
August 1, 2011 to April 8, 2013
(616 days)
Sample Source Specimens already at the
provincial lab (189)
Pregnant women
Consent Letters sent to ordering
physicians to provide to women
Opt out at time of test (nil opted
out)
Sample Size 52
Of the 189 samples
- 71 forms returned
- 52 consented
- 6 declined
- 13 incomplete
1044
Samples with adequate serum (>
1 ml) and included in study pools 841 samples included across 6 pools
All of northern Saskatchewan was not sampled to the same extent. Some geographic areas were under sampled
compared to others. For example, those served by the Flin Flon Hospital have samples processed in Manitoba and
were not available for the study. In the first year, areas served by LaRonge Health Centre laboratory were not
included in the study samples, but were full participants in the subsequent year.
12
Chemicals were selected by reviewing data from similar biomonitoring studies, using criteria outlined in the
CHMS89, and consulting experts in the field.
The chemicals selected could be described asb:
Industrial and agricultural by-products;
Used in the manufacture of consumer goods;
Contaminants of potential concern either by The Stockholm Convention or in Federal regulations;
“Emerging” contaminants such as bisphenol A, parabens and phthalates (few studies available);
Naturally occurring in the environment though they may be found in different concentrations in different geographical areas. Some occur naturally in foods and some are required for the maintenance of good health, but can cause health concerns if people are exposed to large amounts.
b A similar set of chemicals were tested in Alberta as part of the Alberta Biomonitoring Study though the Saskatchewan study did include some
additional chemicals not included in the first phases of the Alberta study. A most recent Alberta study (Phase 3) included similar chemicals.
CHEMICAL SELECTION
Chemical Selection Approach:
Using criteria outlined in the CHMS89: known or suspected health effects related to the substance;
need for public health actions related to the substance;
level of public concern about exposures and possible health effects related to the substance;
evidence of exposure of the Canadian population to the substance; feasibility of collecting biological specimens in a [national] survey and associated burden on survey
respondents;
availability and efficiency of laboratory analytical methods; costs of performing the test; and,
parity of selected chemicals with other national and international surveys and studies.
Reviewing data from similar population biomonitoring studies;
Expert opinion.

13
Figure 2: Type of chemicals studied
There are advantages and disadvantages to using each biological matrix (such as urine, whole blood or serum). In
addition to these considerations, there are varying resource costs for collection and laboratory analysis of
chemicals in biological samples. In population level biomonitoring studies, choosing one matrix is considered to be
most cost-effective. Blood is typically considered a good reflection of the amount of the chemical that has
accumulated in the body or the internal body burden5. Thus, although blood serum may not be ideal for all
chemicals analyzed, it was the matrix selected for this study.
The chemical’s properities determine where the chemical will be found in the blood serum. Lipophilic (fat-loving)
chemicals are mostly found in the lipid rich portion of serum and are often described in reference to the lipid
weight of a serum sample. Some metals, such as mercury, prefer the blood cells and are not well measured in the
serum (which lacks blood cells). Therefore, it is necessary to consider the results found here with the realization
that blood serum was the matrix of choice (and not whole or lipid adjusted blood serum).
Several chemicals were analyzed at the Alberta Centre for Toxicology (Calgary, AB) including cotinine,
phytoestrogens and metals. Polybrominated diphenyl ethers (PBDEs) were analyzed in Prague, Czech Republic by
ALS Laboratory Group, while methylmercury was analyzed by ALS Laboratory Group in Sweden. The remaining
substances were evaluated in Edmonton, AB at the ALS Laboratory Group.
For the details of the analytical method for each chemical of interest, please refer to the full technical report.
The analysis of all Saskatchewan samples was provided by Alberta Health.
SELECTION OF BIOMONITORING MATRIX
LABORATORY ANALYSIS

14
The blood serum samples collected for this study were physically combined before analysis in a process called
“pooling”. The blood samples were pooled into six groups based on region (northeast, northwest and far north).
The pooling of blood samples has many advantages; however, it limits the information that can be derived from
the samples.
When individual blood samples are pooled together, the measured chemical concentration is a close estimate of
the arithmetic mean (average) of the concentrations that would have been in the blood of each individual.6 That
is to say, the concentrations for each pool are arithmetic averages of the pregnant women from a defined
geographic area.
In reality, most blood concentrations of chemicals across any given population tend to follow what is known as a
log-normal distribution.6 This is important because the best way to describe the “average” of such a population is
actually the geometric mean. 7
Standard deviation and standard error are important values that help add robustness to the information an
average, or mean, can provide. These were calculated and presented with all mean values. Both the standard
deviation and standard error provide an indication of the extent of the variability between the samples or the
range of results.
Pooling is important to increase the likelihood of detecting a concentration that is above either the limit of
detection (LOD) or the limit of quantification (LOQ). A challenge for assessing environmental chemicals in human
biomonitoring is that the concentrations of some chemicals are often so small that current techniques cannot
measure them. This is known as being below the limit of detection or the limit of quantification. When this
occurs, the presence of a particular chemical is unknown. When you pool together various samples you increase
the likelihood of measuring a substance if it is indeed there.
For the purposes of this study, the average across all six pools was determined only if at least five pools had
concentrations above the LOD or LOQ. 136 out of the approximately 283 chemicals met these criteria.
Unfortunately, due to the lack of randomization in the study design, we cannot generalize the findings of this study
to all pregnant women in northern Saskatchewan with certainty.
All analyses were conducted using Microsoft Excel (2003) with graphs generated using SigmaPlot (v12.5).
In order to compare the pools to each other and to pools in Alberta, statistical weighting was necessary. Some
pools had more individual samples than others, and to allow comparisons between these differing pools a
weighting factor was necessary. The detected concentration in a pool was multiplied by the number of its
samples. The sum of these products was divided by the sum of the number of samples (total participants),
resulting in a weighted overall mean. In this report, the combined northern values (weighted-arithmetic means)
will be identified as “mean” values.
STATISTICAL ANALYSIS
ANALYSIS AND LIMITATIONS
WEIGHTING OF CONCENTRATIONS

15
Biomonitoring provides valuable information, but the interpretation and application of that information should be
done ethically.
Formal ethical approval for this study was obtained from the University of Saskatchewan’s Research Ethics Board
(May 9, 2011 – Bio-RED-11-109). As well, approval was obtained from all four northern health authorities
(Athabasca Health Authority, Keewatin-Yatthé, Mamawetan Churchill River and Kelsey Trail Health Regions); and
the Northern Intertribal Health Authority (representing Prince Albert Grand Council, Meadow Lake Tribal Council,
Lac La Ronge Indian Band and the Peter Ballantyne Cree Nation).
ETHICAL CONSIDERATIONS

16
Biomonitoring is an important tool for understanding exposure to chemicals in the environment, but it is a tool
with limitations. These limitations are important to consider in the interpretation of the results. The “Limitations”
section of this document explores some of these in detail, but two key considerations include understanding the
ability to compare and the ability to interpret these results through a health lens.
Comparing Studies: The precision and accuracy of analytical instruments continue to improve with time. We now
can measure chemicals at very low concentrations, lower than ever before. As a result, the detection of a chemical
in one study and not in another may be the result of the changes in detection limits and may not reflect an actual
difference in exposure.
Chemicals and Health: For most chemicals or metals there are thresholds above which measurable health effects
are known to occur. Some substances are required for normal physiological functioning and thus too low amounts
can have detrimental effects. For other substances, chiefly carcinogens, but also some heavy metals such as lead,
there is no level of exposure below which health risk is considered zero. Some newer substances (such as
bisphenol-A) are still being studied and the health effects, if any, are unknown or unclear.
RESULTS
PREAMBLE

17
Six pooled samples were prepared based on the individual samples available. (Figure 3)
Figure 3: Infographic of how samples were assigned to geographic pools
* = limited sampling as most blood work done out of province
POOLED SAMPLES

18
A result is difficult to interpret without context to put value to that number. A challenge within the field of
biomonitoring is that due to the limited number of large scale biomonitoring projects and the constantly changing
technologies, this context is not always possible.
In this case, there are two key comparison studies from which comparisons are appropriate. The first is the
Alberta Biomonitoring Program3 and the second is the CHMS10. The Alberta Biomonitoring Program utilized serum
samples and the CHMS utilized whole blood, serum or urine. The comparison with the CHMS is possible when
serum samples were used. In cases where these two are not valid comparators, other sources will be presented.
There are circumstances, due to a variety of reasons (novel chemical, unique methodology, etc.), where no
comparison can be made.
Of the estimated 283 different chemicals that were studied, only 136 chemicals had at least five pools with
concentrations above the limit of detection or limit of quanitification. These chemicals met the criteria for further
statistical analysis. Where results were below the limit or detection or quantification, the concentrations for that
substance were either plotted without providing an overall mean value or were not reported at all.
COMPARISONS TO OTHER STUDIES
SERUM CHEMICAL LEVELS IN NORTHERN SASKATCHEWAN

19
Background
Cotinine is a breakdown product of nicotine, a chemical found in all tobacco products. Cotinine can be used to
estimate the exposure to tobacco smoke.
Individuals who are non-smokers are known to have serum cotinine concentrations less than 1-5 ng/mL (range
reflects variations across studies).11,12 Those who are heavily exposed to second-hand smoke have cotinine levels
in the range of 1-10 ng/mL, while active smokers have levels higher than 10 ng/mL. Any value above 10 ng/mL
strongly suggests regular tobacco smoking.
Notably, exposure to tobacco smoke is known to be associated with exposure to a wide variety of chemicals, many
measured in this study. The section “Smoking – An Important Source of Exposure and Risk” further explores how
this can influence the interpretation of some findings.
How can you be exposed to cotinine?
Tobacco smoke is the primary source of exposure to cotinine. Exposure can be via direct exposure to tobacco
smoke, but also as a consequence of second-hand smoke. Around 70% of the nicotine absorbed into the body via
exposure to tobacco is converted into cotinine.
What health effects have been linked to cotinine?
The health effects of cotinine are not of concern, but the health effects of tobacco smoke exposure are well
understood. These include a variety of life limiting and disabling diseases of the heart and respiratory tract.
Cancers of the lung, larynx and mouth are also known consequences of tobacco use. 13
Tobacco exposure during pregnancy has been associated with disruption in fetal development, pre-term birth and
adverse birth outcomes, and has also been linked with sudden infant death syndrome (SIDS).14,15 Babies born to
smoking mothers are known to be smaller than normal at the time of delivery.16
Result
Overall, serum cotinine concentrations measured among pregnant women in all pooled samples ranged from 46.8
ng/mL to 66.4 ng/mL (mean ± 95% confidence interval = 58.0 ng/mL ± 5.6 ng/mL). Non-smokers are normally
defined as having serum cotinine concentrations below 10 ng/mL, although often have concentrations below 1
ng/mL.11,12 Therefore, the concentrations of cotinine measured here indicate that many of the study participants
were smoking or exposed to significant amounts of second-hand smoke at the time of their blood sample
collection.
RESULTS BY CHEMICAL CLASS
ORGANIC CHEMICALS
COTININE

20
How do these values compare?
Saskatchewan Alberta
70 70
60 60
50 50
40 40
30 30
20 20
10 10
0 0
SK NW SK NE SK Far N SK OA
North Central South
Figure 4: Concentrations of cotinine in the blood serum of pregnant women in Saskatchewan (A) and Alberta (B).
The blue lines represent the limit of detection used in laboratory analysis. Estimates provided represent a 95%
confidence interval around the mean. SK OA = mean of the pooled samples from Northern Saskatchewan.
Nearly all pools from Saskatchewan were higher than the concentrations of cotinine identified in the Alberta study.
This suggests that smoking rates and overall tobacco exposure is markedly higher among the Saskatchewan
participants than those from Alberta.
Background
Phytoestrogens are naturally occurring compounds in plants and are consumed by humans in their diet. These
chemicals emulate estrogen and have been heralded as potentially protective against some medical conditions.17– 19
There are three major groups of phytoestrogens; isoflavones, lignans and coumestans.
How can you be exposed to phytoestrogens?
Common sources of isoflavones are legumes and soybean products, while lignans can be found in flaxseed, citrus
fruit, wheat, fennel, celery, and nuts.19 On average, Canadians consume less than 1 mg/day of isoflavones though
this may be higher in Asian populations.20
What health effects have been linked to phytoestrogens?
Scientific studies suggest that isoflavone products may reduce severe and frequent menopausal symptoms, as well
as lowered risk of osteoporosis, heart disease and some cancers.21,22 As isoflavones do act like estrogen in the
human body there is concern that some of them theoretically could lead to cancers associated with estrogen, but
at this time the scientific evidence does not support a need for concern.19,21
PHYTOESTROGENS
Co
nce
ntr
atio
n (
ng/m
L s
eru
m)

21
Result
Two isoflavones (daidzein and genistein) were measured in blood serum samples of pregnant northern
Saskatchewan women. Overall, the concentrations for daidzein ranged from 0.9 ng/mL to 2.0 ng/mL, while
genistein ranged from 3.0 ng/mL to 5.3 ng/mL. Pool 6 (far N) had the lowest blood serum concentration of both
daidzein and genistein whereas pool 2 (NW) had the highest.
How do these values compare?
Only the concentrations of daidzein in the Saskatchewan pools could be compared to the Alberta study. In
general, concentrations in Saskatchewan were comparable to those in Alberta and do not present any
concerns.
Background
Polychlorinated dibenzo-p-dioxins (PCDDs) and polychlorinated dibenzofurans (PCDFs), commonly known as
dioxins and furans, are relatively toxic and persistent environmental chemicals.
These compounds are not commercially manufactured or imported, but are produced as unintentional by-products
of several industrial processes (e.g. incineration, pulp bleaching, pesticide production), burning of municipal and
medical waste, backyard burning of household waste, wood burning and electrical power generation. Tobacco
smoke is also an exposure source for dioxins and furans. Dioxins and furans can also be naturally released during
forest fires and volcanic eruptions.
Dioxins and furans, once released into the air, can travel long distances before settling. This results in exposures
occurring far from the source.
How can you be exposed to dioxins and furans?
Most humans are exposed to dioxins and furans through diet or occupational exposures, with an estimated 90% of
total human exposure coming from food product of animal origin.23 Being that these classes of chemicals are so
widespread in the environment, all people have background concentrations in their body. As well, these
compounds accumulate in the human body and can take a long time to be excreted. These internal stores can
then be passed from mother to fetus during pregnancy or to an infant during breastfeeding.
What health effects have been linked to dioxins and furans?
Dioxins and furans are known to cause adverse health effects in humans. How likely or how severe depends on a
variety of factors including the chemical composition, dose, route of exposure, duration of exposure and timing of
exposure.
Some dioxins and furans have been clearly identified as a cause for cancer such as 2,3,7,8-tetrachlorodibenzo-p-
dioxin (TCDD) which has been classified as a Group 1 carcinogen (carcinogen to humans) by the International
Agency for Research on Cancer (IARC), while others have not.
DIOXINS AND FURANS

22
At high doses over short periods of time, such as what may occur in an occupational setting, dioxins and furans
may cause skin, liver and neurological problems, psychological effects, and impairment of the immune or
endocrine systems.24
Result
Out of 17 different dioxins and furans tested only OCDD and 1,2,3,4,6,7,8 – HpCDD were detected in all pools.
How do these values compare?
In general, OCDD concentrations were slightly lower than Alberta phase one values (2008). The same applied to
1,2,3,4,6,7,8 HPCDD. The remaining congeners could not be compared because of the number of Saskatchewan
pools below the limit of detection.
250
225
200
175
150
125
100
75
50
25
0
1.2
Saskatchewan
SK NW SK NE SK Far N SK OA
250
225
200
175
150
125
100
75
50
25
0
1.2
Alberta
North Central South
1.0 1.0
0.8 0.8
0.6 0.6
0.4 0.4
0.2 0.2
0.0
SK NW SK NE SK Far N SK OA
0.0
Age 18 - 25 Age 26-30 Age 31+
Figure 5: Concentrations of OCDD in blood serum of pregnant women in Saskatchewan and Alberta as
determined by lipid weight (A, B) and by total concentration in serum (C and D). The blue lines represent the
limit of detection used in laboratory analysis. Estimates provided represent a 95% confidence interval around the
mean.
Concentr
ation (
pg
/g lip
id)
Concentr
ation (
pg
/g s
eru
m)
23
Background
Polychlorinated biphenyls (PCBs) are human-made chemicals used for many decades as dielectric fluids in
transformers and capacitors in heat-exchange systems, as lubricants, plasticizers, and adhesives, as well as an
additive in sealants, plastics, paint, fire retardants, hydraulic oil, and pesticide extenders.25 Although PCB
manufacturing no longer occurs, PCBs were released into the environment during their manufacture, use and
disposal.
How can you be exposed to PCBs?
As PCBs do not degrade, they continue to exist in the environment long after manufacturing has ceased. Most
people continue to be exposed through their diet as oceans, freshwater bodies, pastures and agricultural soils
around the world contain low concentrations of PCBs. Once ingested, these compounds accumulate in the human
body and can take a long time to be excreted. Of particular concern is the transfer of these internal stores from
mother to fetus during pregnancy or to an infant during lactation.
Like dioxins and furans, PCBs are widespread and thus most people do have measurable concentrations.
What health effects have been linked to PCBs?
In terms of the health effects of being exposed to PCBs, the International Agency for Research on Cancer (IARC)
has determined that some of these chemicals are a Group 2A “probable carcinogen,” but at unknown exposure
levels over long periods of time. From studies on acute high level exposures (usually occupational) skin changes,
nail changes, limb swelling and neurological effects have all been identified.
PCBs have been somewhat evaluated in children of mothers who were exposed to remarkably high levels of PCBs.
The studies concluded that the children were at risk of several adverse health effects including low-birth weight,
immune system abnormalities, depressed motor skills and a decrease in short-term memory.26,27
Result
Of the 178 congeners of PCBs that were evaluated, 81 met the criteria for reporting (a sufficient number of pools
were above the limit of detection).
Overall mean concentrations of PCBs ranged from below the limit of detection to 249 ng/g.
Pool 1 most often had the highest concentration of PCB congeners compared to the other pools, particularly for
those congeners where the molecular size was smaller and had less chlorine in its molecular makeup. But, among
those PCBs with larger molecular sizes, the highest concentrations were seen more so in pools 4-6. Pool 6 had the
greatest concentration of the PCBs with the highest molecular weight. The penta- to hexa-chlorobiphenyl isomersc
were primarily detected in pools 3-5.
c These isomers (molecules with the same atoms, but configured differently) have 60% or higher chlorination (chlorine atoms per molecule)
POLYCHLORINATED BIPHENYLS (PCBS)
24
How do these values compare?
There were 8 PCB congeners detected and analyzed in both Saskatchewan and Alberta studies (PCBs 156, 158/129,
146, 170, 183, 187, 180, 199). Seven of these had similar levels between the two groups and for the PCB 158/129,
the mean concentration was lower in the Saskatchewan sample (mean ± 95% confidence interval: 0.25 ± 0.13 ng/g
lipid) than in the Alberta sample (mean ± 95% confidence interval: 0.62 ± 0.13 ng/g lipid).
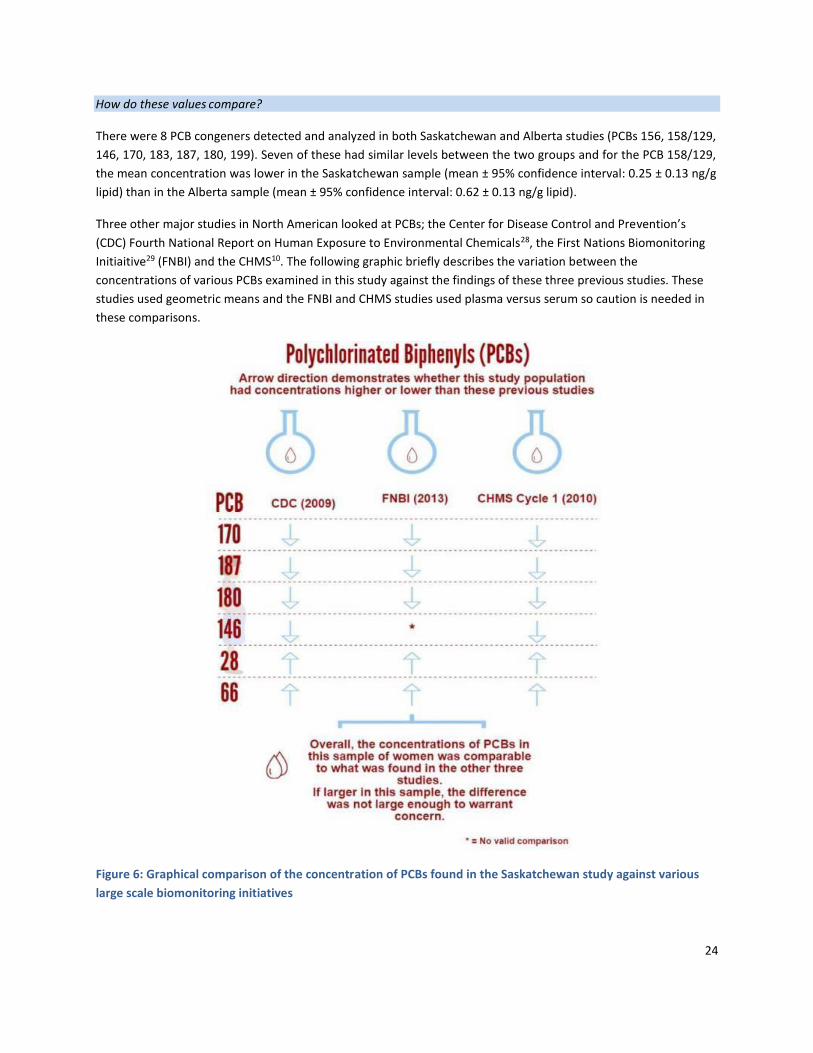
Three other major studies in North American looked at PCBs; the Center for Disease Control and Prevention’s
(CDC) Fourth National Report on Human Exposure to Environmental Chemicals28, the First Nations Biomonitoring
Initiaitive29 (FNBI) and the CHMS10. The following graphic briefly describes the variation between the
concentrations of various PCBs examined in this study against the findings of these three previous studies. These
studies used geometric means and the FNBI and CHMS studies used plasma versus serum so caution is needed in
these comparisons.
Figure 6: Graphical comparison of the concentration of PCBs found in the Saskatchewan study against various
large scale biomonitoring initiatives

25
Background
Organochlorine (OC) pesticides are synthetic chlorinated hydrocarbons. Historically they have been used as
insecticides and fungicides. Now they are mostly strictly controlled by international agreements on persistent
organic pollutants (POPs) as they are known to persist in the environment, travel long distances and bioaccumulate
through the food chain.
How can you be exposed to OC pesticides?
Most humans are exposed to OCs through diet as most are now stored in the world’s soils and these chemicals
bioaccumulate through food sources. Less commonly, people are exposed to OCs through contaminated water or
air.
Once ingested, these compounds accumulate in the fat stores in the human body and can take a long time to be
excreted. Of particular concern is the transfer of these internal stores from mother to fetus during pregnancy or to
an infant during lactation.
Result
In the present study, the following OC pesticides were tested for in blood serum samples of pregnant women in
northern Saskatchewan (bolded chemicals were detected in some of the pools):
alpha-BHC
Oxychlordane
Endosulfan
2,4’-DDT
beta-BHC Aldrin 4,4’-DDD Trans-nonachlor
delta-BHC Heptachlor Epoxide 4,4’-DDT Mirex
gamma-BHC (Lindane) Dieldrin Methoxychlor
Octachlorostyrene 4,4’-DDE alpha-Chlordane
Heptachlor Endrin gamma-Chlordane
Hexachlorobenzene
Only endrin, 4,4-DDE, 4,4’-DDT, beta-BHC and hexachlorobenzene were detected in blood serum samples and not
in all pools, and only 4,4-DDE and hexachorobenzene were detected above detection limit in 5 pools and met the
statistical inclusion criteria of this report. Of the 22 pesticides tested only 4,4-DDE have levels detected in all
pools.
ORGANOCHLORINE PESTICIDES
26
Background
DDT is a broad-spectrum insecticide and has been used historically in Canada to control insects known to transmit
human disease such as mosquitoes. Over time, it became apparent that the breakdown products of DDT (4,4’-DDE
and 4,4’-DDD) were highly persistent in the environment.30 As a result, DDT cannot be used in Canada, although it
continues to be used in parts of the world as an affordable form of mosquito control.
DDT has the ability to travel long distances, leading to contamination in areas of the world where DDT was never
actively used, such as Canada’s far north.31 DDT and its breakdown products accumulate on soil and aquatic
sediments with bioaccumulation up through the food chain.
How can you be exposed to DDT and related compounds?
Humans are generally exposed to DDT through dietary consumption of contaminated foods. Once ingested, these
compounds accumulate in the body. Of particular concern is the transfer of these internal stores from mother to
fetus during pregnancy or to an infant during breast feeding.30
What health effects have been linked to DDT and related compounds?
Both the hepatic and nervous systems are known to be adversely affected by exposure to DDT in adults.31 The
effects on children and the developing fetus remain unknown.30
DDE is known to persist longer in the human body and, as such DDE is recognized as a better indicator of historical
exposures.32 DDE at background concentrations is not known to cause adverse health effects in humans, but at
very high doses (e.g. accidental chemical releases) it can cause respiratory problems, impairment of the immune
system, neurotoxicity, birth defects and reproductive toxicity. 33–36
Result
Blood serum concentrations of 4,4’-DDE ranged from 19 ng/g lipid to 138 ng/g lipid across the pools. Pool 2 (NW)
had the greatest concentration at 138 ng/g lipid, followed by pool 4 (NE) at 68 ng/g lipid. Pool 1 was below the
limit of detection. Pool 3 (NW) measured 19 ng/g lipid, pool 5 (NE) 26 ng/g of lipid and pool 6 (FarN) had a
concentration of 51 ng/g lipid.
How do these values compare?
The overall mean serum lipid concentration from the Saskatchewan participants is comparable to all age groupings
from northern Alberta and 18-25 year olds in central Alberta. Otherwise, the overall Saskatchewan mean was
lower than mean concentrations determined in the other Alberta groups. (see Figure 7) Also, the highest mean
concentration in AB was higher than the pool with the highest concentration in Saskatchewan.
The overall mean lipid concentration from the Saskatchewan study is comparable to women above the age of 31 in
Northern Alberta (mean ± 95% confidence interval: 55.94 ± 19.33 ng/g). Women in Southern Alberta have serum
blood concentrations of 4’4 DDE higher than that of women in Saskatchewan.
DDT AND RELATED COMPOUNDS

27
In the U.S. National Health and Nutrition Examination Survey (NHANES, 2003-2004 Fourth Report) (CDC, 2009), the
geometric mean of serum DDE concentrations in females were 241 ng/g of lipid and 1.5 ng/g of serum, and the
50th percentile was reported as 207 ng/g lipid. The Saskatchewan study mean is not a geometric mean thus direct
comparison is not possible, but this value does help suggest a range.
Saskatchewan Alberta
250 250
200 200
150 150
100 100
50 50
0
1.4
SK NW SK NE SK Far N SK OA
0
1.4
North Central South
1.2 1.2
1.0 1.0
0.8 0.8
0.6 0.6
0.4 0.4
0.2 0.2
0.0
SK NW SK NE SK Far N SK OA
0.0
North Central South
Figure 7: Concentrations of 4,4’-DDE in blood serum of pregnant women in Saskatchewan and Alberta as
determined by lipid weight (A, B) and by total concentration in serum (C and D). The blue lines represent the limit
of detection used in laboratory analysis. Estimates provided represent a 95% confidence interval around the mean.
For the Saskatchewan study, the LOD varied by pool.
Co
nce
ntr
atio
n (n
g/g
lip
id)
Co
nce
ntr
atio
n (n
g/g
seru
m)

28
Background
Hexachlorobenzene (HCB), also known as pentachlorophenyl chloride, was formerly (until the 1960s) widely used
as a synthetic fungicide. It had various other uses through history including fireworks, ammunition, synthetic
rubber, wood preservative and dialectic fluids.37
Today HCB is still released into the environment in small amounts as a byproduct of manufacturing, the use of
chlorinated solvents and pesticides, emissions from incinerators, and through long range transport in air and water
from other countries.37
Hexachlorobenzene is resistant to degradation and is able to persist in the environment for long periods of time.
Although it binds strongly to soil, it can leach over time, reintroducing the chemical into the environment long
after use has been stopped. It is known to bioaccumulate through aquatic species.
How can you be exposed to HCB?
Most people are exposed to HCB through diet. Once in the body, HCB accumulates in fatty tissue and is barely
broken down by the body’s metabolism. This chemical can cross the placenta and be excreted in breast milk.
What health effects have been linked to HCB?
Studies of HCB have found that background concentrations of the chemical are not associated with known adverse
health effects in humans. Nonetheless, high doses whether accidental or otherwise can cause severe health
effects including liver disease, neurotoxicity, immunotoxicity and skin lesions.37
Result
All pools except pool 5 (NE), did have measurable amounts of HCB ranging between 0.042 ng/g and 0.35 ng/g (lipid
serum weight: 7.5 ng/g to 71 ng/g). Pool 2 was higher than the rest with a concentration (lipid weighted) of 71
ng/g whereas the remaining pools had concentrations between 7.5 ng/g lipid weight and 27 ng/g lipid weight.
How do these values compare?
The overall means of the Saskatchewan study were comparable to that of the Alberta study. Pool 2 (NW) was
notably elevated both compared to other Saskatchewan pools and Alberta mean study concentration. (Figure 8)
NHANES 2003-2004 Fourth Report reported a geometric mean for females of 15.8 ng/g lipid, which is slightly lower
than the overall mean for the Saskatchewan study. The Saskatchewan study mean is not a geometric mean thus
direct comparison is not possible, but this value does help suggest a range.
HEXACHLOROBENZENE

29
Saskatchewan AB
80 80
70 70
60 60
50 50
40 40
30 30
20 20
10 10
0
0.40
0.35
SK NW SK NE SK Far N SK OA
0 OA
0.40
0.35
0.30 0.30
0.25 0.25
0.20 0.20
0.15 0.15
0.10 0.10
0.05 0.05
0.00
SK NW SK NE SK Far N SK OA
0.00 OA
Figure 8: Concentrations of hexachlorobenzene in blood serum of pregnant women in Saskatchewan and Alberta
as determined by lipid weight (A, B) and by total concentration in serum (C and D). The blue lines represent the
limit of detection used in laboratory analysis in the Alberta data. The limit of detection varied by pool in the
Saskatchewan data. Estimates provided represent a 95% confidence interval around the mean.
Concentr
ation (
ng/g
seru
m)
Concentr
ation (
ng/g
lip
id)

30
Background
Polybrominated diphenyl ethers (PBDEs) are flame retardants that have been used for decades in commercial
products. Three main types of manufactured commercial mixtures have been classically produced; penta-BDE,
octa-BDE and deca-BDE (names based on the average bromine content). Overall, there are 209 possible
congeners. Currently, commercial mixtures of penta-BDE and octa-BDE cannot be manufactured, sold or imported
in Canada.
PBDEs can be released into the environment from the products in which they are used. They are persistent
chemicals that can travel long distances.
How can you be exposed to PBDEs?
Humans are exposed to PBDEs primarily through dust at home and in workplaces, as the chemicals are released
from manufactured commercial products.38 It is possible to be exposed through diet, particularly from meat, dairy,
fish and eggs.39 PBDEs can be passed to the fetus or to infants by crossing the placenta or through breast milk.40
Those PBDE congeners that are smaller (1-5 bromine atoms per molecule) are better absorbed by the body, stay
longer in the body and are more toxic compared to larger ones.41
What health effects have been linked to PBDEs?
There are no definitive links between PBDEs and negative health outcomes in people. Research on rats and mice
demonstrated that PBDEs can affect thyroid and liver function, and high concentrations may affect neurological
function and the immune system. Based on animal studies, decabromodiphenyl ether (PBDE 209) has been
classified as a possible human carcinogens.42
Result
The following twelve PBDEs were tested for in the blood serum samples of pregnant women in northern
Saskatchewan with two of them not being detected (not bolded in figure below) in any of the northern
Saskatchewan pools (those bolded were detected):
POLYBROMINATED DIPHENYL ETHERS
Decabromodiphenyl ether (BDE 209) 2,2′,3,4,4′,5′,6-heptabromodiphenyl ether (BDE 183)
2,2′,4,4′,5,6′-hexabromodiphenyl ether (BDE 154) 2,2′,4,4′,5,5′-hexabromodiphenyl ether (BDE 153)
2,3,3’,4,4′,5′- hexabromodiphenyl ether (BDE 138) 2,2′,4,4′,6-pentabromodiphenyl ether (BDE 100)
2,2′,4,4′,5-pentabromodiphenyl ether (BDE 99) 2,2′,3,4,4′-pentabromodiphenyl ether (BDE 85)
3,3',4,4'-tetrabromodiphenyl ether (BDE 77) 2,3',4,4'-tetrabromodiphenyl ether (BDE 66)
2,2′,4,4′-tetrabromodiphenyl ether (BDE 47) 2,4,4'-tribromodiphenyl ether (BDE 28)

31
Figure 9: Contrasting the range of PBDE concentrations in the Saskatchewan study to the range of values for the
same in the Alberta study
Of the 12 congeners evaluated, there is no distinct overarching geographic trend in northern Saskatchewan. In general, pools 2-4 (NW, NW, NE) generally had the highest concentrations of PBDEs.
How do these values compare?
The Saskatchewan pools had a lower range of concentrations of PBDEs compared to the Alberta study values. BDE
99 and BDE 47 were about three times higher in the Alberta study.
Background
Perfluorochemicals (PFCs) are also referred to as perfluroalkyls or perfluorinated chemicals and have been used
for decades in industrial processes and commercial products. PFCs have primarily been used for stain repellent
formulations for textiles, paints, waxes, polishes, electronics, adhesives and food packaging.43
Perfluorooctane sulfonate (PFOS) and perfluorooctanoic acid (PFOA) are the two most commonly detected
isomers of PFCs. PFCs are found across the globe as they are able to travel long-distances and thus can be found in
areas where PFCs were not used (remote regions of the far north). PFCs are widely found in wildlife and human
blood due to long half-lives.44 They, like many other chemicals, are able to cross the placenta.45
How can you be exposed to PFCs?
Humans are exposed by the dust in homes and workplaces, and through diet (mainly fish and food products of
animal origin, and from food packaging leaching).43
PERFLUOROCHEMICALS

32
What health effects have been linked to PFCs?
PFCs have not been linked to human health effects, although there are a limited number of studies. Studies on
animals indicate that high doses of PFCs can affect development, reproduction and liver function.46,47 Recent
studies suggest that there may be an association between the concentrations of PFOS or PFOA in pregnant women
and infant birth weight.48,49
Result
The following eight PFCs were tested for in this study:
Bold = detected in all pools *= not detected in any pool
Only PFOS and PFOA were above the level of detection in all pools. Levels for all pools were lower than Alberta
levels Overall, there was no distinct trend across the pools for these chemicals, although pool 6 (Far N) had the
highest concentration for five of the eight isomers. Three of the eight isomers were not detected in any pool.
4.0
Saskatchewan
4.0
Alberta
3.5 3.5
3.0 3.0
2.5 2.5
2.0 2.0
1.5 1.5
1.0 1.0
0.5 0.5
0.0
SK NW SK NE SK Far N SK OA
0.0
North Central South
Figure 10: Concentrations of Perfluorooctanoate (PFOA) in the blood serum of pregnant women in
Saskatchewan (A) and Alberta (B). Saskatchewan data is presented for each of the six pooled samples, and for an
overall (OA) weighted arithmetic mean of the six pools. Alberta data is presented by mean concentrations
stratified by both age and region. The blue lines represent the limit of detection used in laboratory analysis.
Estimates provided represent a 95% confidence interval around the mean.
Perfluorooctanoate (PFOA)
Perfluorononanoate (PFNA)
Perfluorodecanoate (PFDA)
Perfluoroundecanoate (PFUA)
Perfluorododecanoate (PFDoA)*
Perfluorohexane sulfonate (PFHxS)*
Perfluorooctane sulfonate (PFOS)
Perfluorodecane sulfonate (PFDS)*
Perfluoroalkyl carboxylates Perfluoroalkyl sulfonates
Concentr
atio
n (
ng/m
L s
eru
m)

33
A
Saskatchewan
12 12
Alberta
10 10
8 8
6 6
4 4
2 2
0
SK NW SK NE SK Far N SK OA
0
North Central South
Figure 11: Concentrations of Perfluorooctane sulfonate (PFOS) in the blood serum of pregnant women in
Saskatchewan (A) and Alberta (B). Saskatchewan data is presented for each of the six pooled samples, and for an
overall (OA) weighted arithmetic mean of the six pools. Alberta data is presented by region with mean of all the
pools that were analyzed from each region. The blue lines represent the limit of detection used in laboratory
analysis. Estimates provided represent a 95% confidence interval around the mean.
How do these values compare?
Only PFOS and PFOA had enough pools with concentrations above the limit of detection to allow for a mean to be
determined in the Saskatchewan study. In contrast, in Alberta 8 of the 9 assessed isomers reached this threshold.
In the case of these two identified isomers, the weighted arthimetic mean of the study pools in Saskatchewan was
lower than all Alberta mean values (study groups were stratified by age and geographic location).
In the CHMS Cycle 210 the geometric means of female participants aged 20-79 was 2.0 (1.8 to 2.2) µg/L plasma for
PFOA and 5.7 (4.9 to 6.6) µg/L plasma for PFOS (units are equivalent to our study) and Health Canada indicated
that these levels were not a concern for human health. The northern Saskatchewan weighted arithmetic means
were lower than these values for PFOS and PFOA. The CDC’s NHANES Fourth Report PFOS reported a geometric
mean of 18.4 µg/L plasma of PFOS in the general female population 12 years of age and older.28
B
Concentr
atio
n (
ng/m
L s
eru
m)

34
Background
Bisphenol-A (BPA) is a synthetic chemical used in the manufacturing of plastics and resins that are found in food
and beverage bottles, medical devices, dental fillings and sealants and thermal paper products. Health Canada has
concluded that current dietary exposure to BPA through food packaging uses is not expected to pose a health risk
including to newborns and young infants. However, Health Canada, as a precautionary measure, is working with
industry to reduce BPA in food packaging especially for infants and newborns. 50
How can you be exposed to BPAs?
Most humans are exposed to BPAs as the chemical leaches from these plastics and resins, contaminating foods and
beverages.51 There is also evidence emerging that BPAs can leach from landfills and enter into the surrounding
environment.52 Once BPA is in the body, it is able to cross the placenta53 and accumulate in breast milk.54
What health effects have been linked to BPAs?
The potential health effects of BPA on humans have yet to be determined due to it being a relatively new
substance and few human studies.55 Results of animal studies suggest that BPA may act like the human hormone
estrogen and may be linked to developmental and reproductive issues, neurotoxicity, ovarian dysfunction and
recurrent miscarriages in animals.
Result
Bisphenol-A was not detected in any of the northern Saskatchewan pools.
How do these values compare?
Bisphenol A was detected in over 25% of the pools in the Alberta study, whereas bisphenol-A was not detected in
any of the Saskatchewan pools.
Notably, the test for bisphenol A performed in Alberta differed from that in the Saskatchewan study. This
difference resulted in a higher limit of detection in the Saskatchewan study (a 20-fold difference), which meant all
pools with concentrations below 0.20 ng/mL were considered non-detectable (conversely this threshold was ~0.01
ng/mL for the Alberta pools). It is important to note that the Alberta samples were collected before the
prohibition of BPA in baby bottles and similar plastic products, while the Saskatchewan samples were collected
after this change in regulation. Therefore it is possible that women in Saskatchewan were exposed to a smaller
amount of BPA due to regulatory changes.
A single study performed in the Eastern Townships in Canada found a mean serum concentration of 3.83 ng/mL
across the women in their study.56 The Canadian Health Measures Survey and the First Nations Biomonitoring
Initiative measured BPA levels in urine.
BISPHENOL-A

35
Background
Octylphenol (OP) refers to a group of chemicals used for surfactant manufacturing. In Canada these are used in
the development of detergents, industrial cleaners, paints, textile mills and the pulp and paper industry.
How can you be exposed to octylphenol?
Humans are primarily exposed through diet (these chemicals can bioaccumulate through the food chain) and
exposure to the trace amounts of OPs in water and air.57,58 OPs can cross the placenta and be passed on through
breast milk.
What health effects have been linked to octylphenol?
The health effects of octylphenol from background exposures are unknown. Concerns exist due to the potential
estrogenic effects, but at this time research into these effects continues.59
Result
Octylphenol was detected in all pools with concentrations ranging from 13.7 ng/mL to 19 ng/mL.
Table 2: Concentrations of serum octylphenol by pool
Wet
weight
(ng/mL)
Pool 1
NW
N=162
Pool 2
NW
N=138
Pool 3
NW
N=120
Pool 4
NE
N= 130
Pool 5
NE
N=150
Pool 6
FarN
N=141
Mean (95% CI)
Octylphenol
19
15
18.7
13.7
18.7
18.2
17.3 (15.5-19.1)
How do these values compare?
There is presently no comparable value for serum from the Alberta study.
Two small studies can be used - the first of women between 55 and 75 years of age in Wisconsin and another of
maternal serum samples of women in the Yantze River Delta region. The first reported a median (of detectable
values) of 1.78 ng/mL60 and the second a median or 470 (Interquartile range = 280-660) ng/mL.61 The
Saskatchewan values fall well below the Chinese study, but all pools do measure above the Wisconsin study.
Unfortunately, there are no large scale studies against which to compare.
OCTYLPHENOL

36
Background
Mercury is a widespread, naturally occurring metal that is found across the globe. It exists in three forms;
elemental, inorganic and organic. Elemental and inorganic forms of mercury are released into the air and water
through a variety of human processes including burning of fossil fuels, mining, smelting, and other industrial
practices. It is also released through natural processes such as erosion, volcanoes and forest fires.62 It is discussed
in the Inorganic Chemicals section.
Methylmercury (MeHg, CH3Hg, “organic mercury”) is of particular concern as it is the most toxic form of mercury
to humans and its ability to adversely affect health is well understood. Of all the forms of mercury, it has the
greatest ability to cross the blood brain barrier and enter the brain - the nervous system is very sensitive to
mercury.63 It is also able to cross the placenta.64
How can you be exposed to methylmercury?
Methylmercury (MeHg) is often produced from other forms of mercury through natural biological processes by
bacteria in aquatic sediments. It efficiently bioaccumulates through the aquatic food chain.The greatest source for
humans is through dietary consumption of certain fish and seafood.
Large predatory fish such as shark, large tuna, swordfish, marlin and king mackerel have been identified as being of
particular concern.66 Fish and seafood are good sources of protein, omega-3 fatty acids, minerals and vitamins
(including vitamin D) that promote healthy hearts, healthy growth and brain and eye development of infants and
children. Health Canada recommends that all Canadians, including pregnant women and children, eat at least two
servings of fish per week to benefit from the nutrients found in fish and seafood but to limit the consumption of
fish known to have higher mercury levels.67
In order to minimize mercury exposure, Health Canada has guidelines advising Canadians to limit their
consumption of those higher mercury fish to a maximum of 150 grams per week. Pregnant women and children
have more stringent guidelines. Most importantly Health Canada promotes consuming a wide variety of fish and
seafood.68 Saskatchewan has additional consumption guidelines available for sports fish based on the lake, the
type and size of the fish recommendations and whether it is for the general population or for women of child
bearing age and for children.69
What health effects have been linked to methylmercury?
Methylmercury is a known neurotoxin. At moderate to high doses (such as in the case of a poisoning) MeHg is
known to cause adverse effects to both the motor and sensory nervous systems. If pregnant women are exposed
to high amounts, then there is risk of fetal abnormalities and neurotoxicity.64
At moderate to low doses, there are more subtle neurodevelopment effects that can result from MeHg exposure,
including memory loss, attention deficits, language issues and visual-motor skill problems in childhood.64
METHYLMERCURY

37
Result
Methymercury was detected in four of the six pools. Pool six had the highest concentration of methymercury at
0.3 ng/g. The detectable concentrations ranged from 0.1 ng/g to 0.3 ng/g.
How do these values compare?
Of the pools that were above the LOD, pools 1 (NW), 2(NW) and 4(NE) had values comparable to the detected
range in Alberta. Pool 6 (far N) had a concentration higher than the mean concentrations determined in the
Alberta study (where groups were defined by age and geographic region) (Figure 12). Although Health Canada has
set guidelines for methylmercury in whole blood, it is difficult to interpret the present results in this context
because serum is known to contain only a small fraction (5%) of total methylmercury.
0.35
Saskatchewan
0.35
Alberta
0.30 0.30
0.25 0.25
0.20 0.20
0.15 0.15
0.10 0.10
0.05 0.05
0.00
SK NW SK NE SK Far N
0.00
North Central South
Figure 12: Concentrations of methylmercury in the blood serum of pregnant women in Saskatchewan (A) and
Alberta (B). The blue lines represent the limit of detection used in laboratory analysis. Estimates provided
represent a 95% confidence interval around the mean.
The recent First Nations Food, Nutrition and Environment Survey in Saskatchewan reported on mercury exposures
as measured in hair samples and calculated through dietary estimates, to be low and not a health concern for
Saskatchewan First Nations generally; however, there were some exceedances of Health Canada guidelines among
women of childbearing age living in the Boreal Shield ecozone of the province.65
Con
ce
ntr
atio
n (
ng
/g se
rum
)

38
Background
Phthalates are a class of industrial chemicals used in plastics to make them more flexible and harder to break.70 It
is estimated that nearly 18 billion pounds of phthalates are produced and used each year for a variety of purposes
including PVC flooring, printing inks, personal care products and medical equipment.71
How can you be exposed to phthalates?
Exposure usually occurs by eating or drinking foods stored in containers that were made using phthalates. There is
also the possibility of being exposed by inhaling dust that contains phthalate particles (more common in
children).70 Phthalates can be passed through breast milk to the infant.72
What health effects have been linked to phthalates?
Phthalates are considered endocrine disruptors or hormonally active agents (HAAs) because of their ability to
interfere with the body’s natural hormones. At this time, most of the studies of phthalates have been on animals
and there is evidence to suggest these chemicals can cause developmental abnormalities such as cleft palates and
malformations of the genital tract (particularly in males).72
At this time there is more research needed into the effects of background environmental exposure to humans.
Result
Ten phthalate metabolites were tested for in the blood serum samples of select pregnant women in northern
Saskatchewan. Only four were detected as bolded below:
Mono-(2-ethylhexyl) phthalate (MEHP) was detected, but upon review it was discovered that sample containers
used for storage and analysis were plastic which resulted in falsely elevated values. As a consequence, MEHP was
removed from the final analysis.
There are no distinct geographic trends across the metabolites.
PHTHALATES
Mono-(2-ethyl-5-hydroxyhexyl) phthalate Monobenzyl phthalate
Monoisononyl phthalate Monocyclohexyl phthalate
Mono-(2-ethyl-5-oxohexyl) phthalate Monoisobutyl phthalate
Mono-n-octyl phthalate Monoethyl phthalate
Mono-(2-ethylhexyl) phthalate Monomethyl phthalate
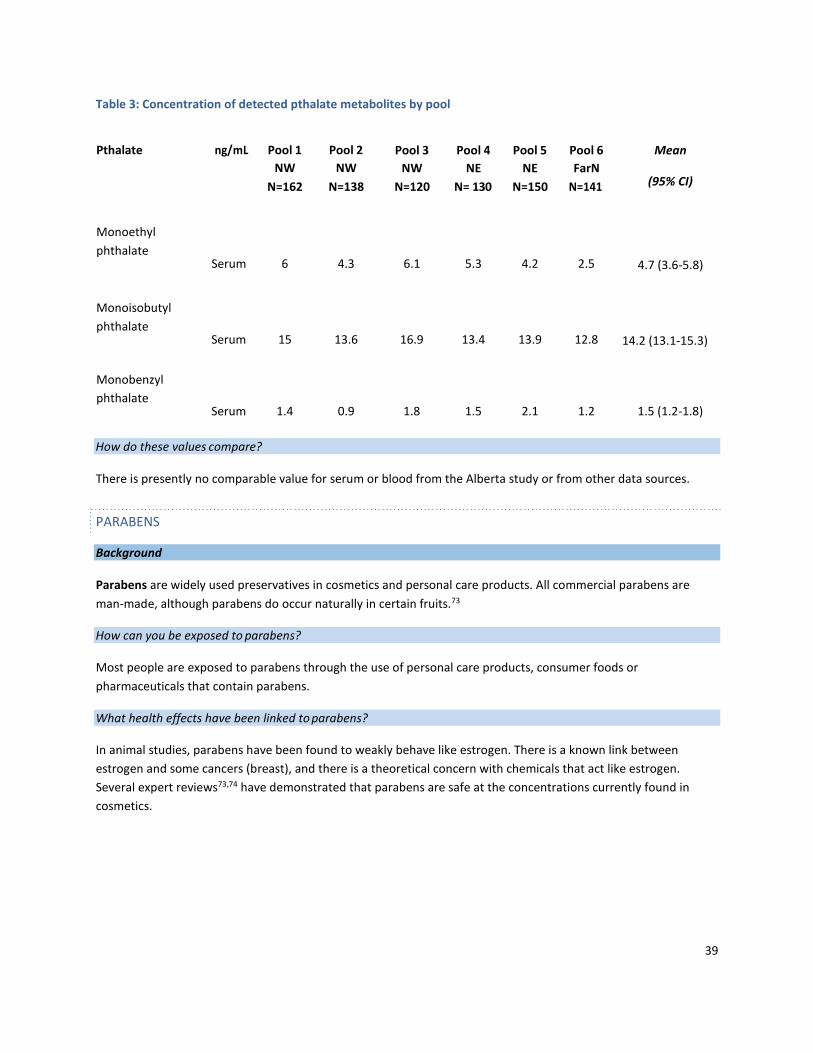
39
Table 3: Concentration of detected pthalate metabolites by pool
Pthalate ng/mL Pool 1
NW
N=162
Pool 2
NW
N=138
Pool 3
NW
N=120
Pool 4
NE
N= 130
Pool 5
NE
N=150
Pool 6
FarN
N=141
Mean
(95% CI)
Monoethyl
phthalate
Serum 6 4.3 6.1 5.3 4.2 2.5 4.7 (3.6-5.8)
Monoisobutyl
phthalate
Serum 15 13.6 16.9 13.4 13.9 12.8 14.2 (13.1-15.3)
Monobenzyl
phthalate
Serum 1.4 0.9 1.8 1.5 2.1 1.2 1.5 (1.2-1.8)
How do these values compare?
There is presently no comparable value for serum or blood from the Alberta study or from other data sources.
Background
Parabens are widely used preservatives in cosmetics and personal care products. All commercial parabens are
man-made, although parabens do occur naturally in certain fruits.73
How can you be exposed to parabens?
Most people are exposed to parabens through the use of personal care products, consumer foods or
pharmaceuticals that contain parabens.
What health effects have been linked to parabens?
In animal studies, parabens have been found to weakly behave like estrogen. There is a known link between
estrogen and some cancers (breast), and there is a theoretical concern with chemicals that act like estrogen.
Several expert reviews73,74 have demonstrated that parabens are safe at the concentrations currently found in
cosmetics.
PARABENS

40
Result
The following five paraben isomers were tested for in the blood serum samples of select pregnant women in
northern Saskatchewan. Those bolded were detected:
Three of the five tested paraben isomers were detected (Table 4). Pool 4 (NE) consistently had the lowest
concentration of the detected isomers.
Table 4: Concentrations of paraben isomers by pool
Paraben ng/mL Pool 1
NW
N=162
Pool 2
NW
N=138
Pool 3
NW
N=120
Pool 4
NE
N= 130
Pool 5
NE
N=150
Pool 6
FarN
N=141
Mean (95% CI)
Methyl
Paraben
Serum
12
14
9.7
4.5
7.6
8.2 9.4 (6.7-12.1)
Ethyl
Paraben
Serum
2.6
<LOD
<LOD
<LOD
1.6
1.7
N/A
Propyl
Paraben
Serum 1.9 2.4 1.48 0.9 1.5 1.4 1.6 (1.2-2.0)
where LOD = limit of detection
How do these values compare?
There is no value presently to compare in the Alberta study and no other comparable source is available for serum
or blood.
Propyl Paraben
Benzyl Paraben Ethyl Paraben
Butyl Paraben Methyl Paraben

41
Mineral micronutrients Non-micronutrients
The following trace metals were analyzed in the participant blood serum samples:
Boron Magnesium Aluminum Mercury
Cobalt Molybdenum Antimony Platinum
Copper Nickel Arsenic Strontium
Iron Selenium Barium Thallium
Manganese Zinc Beryllium Titanium
Cadmium Tungsten
Cesium Uranium
Chromium Vanadium
Lead
Mineral micronutrients are those metals and minerals that are required in small amounts to maintain the health of
a living organism.
The results of this study indicated that the following trace elements had more than 1 pool below detection limits:
Uranium, thallium, tungsten, cadmium, arsenic, chromium, vanadium, titanium, beryllium and boron. As such, no
aggregate statistics were performed on these trace metals and findings are not be presented here for all of these.
Background
Aluminum is the third most abundant chemical element in mineral rocks and is widespread in the environment.75
It has ideal chemical and physical properties and is used in many products such as automobiles, wiring, electrical
devices, paints, antiperspirants, cooking accessories, as well as additives in pharmaceuticals and food. 76
Aluminum sulphate is also commonly used in water treatment.
How can you be exposed to aluminum?
Aluminum can be released into our environment (air, water and soil) through the use or disposal of aluminum
containing products, as well as through various industrial processes. Most people are exposed to background
concentrations of aluminum in food, water or soil, or inhalation of air or dust containing trace amounts of the
metal. 75
TRACE METALS AND MINERALS
TRACE METALS (NON-MICRONUTRIENTS)
ALUMINUM (AL)

42
What health effects have been linked to aluminum?
Background concentrations of aluminum have been recognized as having no ill effects on humans. Most ingested
aluminum is not absorbed and is excreted in the feces, and that which is absorbed is excreted in the urine. 75
At high doses (such as in the case of accidental releases or unusual occupational exposures) aluminum is a known
neurotoxin, renal toxin and may causes respiratory problems, vomiting and/or rash.75
Result
Concentrations of aluminum ranged from 6.4 µg/L to 15 µg/L across all pools. (Figure ).
Saskatchewan AB
25 25
20 20
15 15
10 10
5 5
0 0
SK NW SK NE SK Far N SK OA OA
Figure 13: Concentrations of aluminum in the blood serum of pregnant women in Saskatchewan (A) and Alberta
(B). The blue lines represent the limit of quantification used in laboratory analysis. Estimates provided represent
a 95% confidence interval around the mean.
How do these values compare?
The overall mean serum concentration (± 95% confidence interval) measured was 22.3 ± 0.9 µg/L in the Alberta
study, thus all Saskatchewan pools were lower than this value. Although, the detection limit was quite different
between the two studies which can reduce the ability to reliably compare the two studies.
Background
Antimony is a naturally occurring metal. It can be released from the weathering of rocks and minerals and exists
naturally as various compounds used for a variety of alloys.75 It can be used to manufacture ceramics, glass,
pigments, flame retardants, paints, semi-conductors, fireworks, batteries and some plastics.76
ANTIMONY (SB)
Co
nce
ntr
atio
n (
g/L
se
rum
)

43
Antimony is released into the environment through disposal of these products or through a variety of mining and
industrial processes. It can also enter the water system naturally through soil erosion 77
How can you be exposed to antimony?
Exposure to antimony can occur through ingestion of food, and less so through inhalation or dermal contact with
substances containing antimony (including drinking water).79 People may be exposed to higher antimony
concentrations in occupational settings.77
What health effects have been linked to antimony?
Background exposures to antimony are not known to cause any ill health effects in humans.77 In cases where
doses are high such as in unusual occupational exposures or accidental releases, antimony may cause adverse
health effects of the respiratory, cardiac or digestive systems.77
Result
Overall, mean concentrations for antimony ranged from 3.3 µg/L to 3.8 µg/L (mean ± 95% confidence interval: 3.5
µg/L ± 0.2 µg/L). There was no apparent difference between regions.
How do these values compare?
Mean concentrations in the Alberta study are comparable to the mean concentration of the Saskatchewan study.
No single Saskatchewan pool varied from the ranges of mean values in the Alberta study.
Background
Arsenic is a naturally occurring element widely found in the earth’s crust. In nature arsenic can combine with
other elements to form inorganic arsenic compounds, or it can combine with carbon and hydrogen to form organic
arsenic compounds.80 There are trace amounts of arsenic in all living matter.
Inorganic arsenic is often used to make pressure-treated lumber (in the form of copper chromated arsenic (CCA))
for use in industrial applications but is no longer used in residential lumber. Some arsenic compounds are used as
pesticides, but uses are restricted. Some organic forms of arsenic are used in poultry feed as a form of disease
protection. There is a role for some elemental metalloids in ammunition, solders and lead-acid storage battery
grids.81
How can you be exposed to arsenic?
Background exposure can occur from a variety of pathways. For most Canadians, the primary source of exposure
to arsenic is food, followed by drinking water, soil and air. Geographical variation in naturally occurring soil
concentrations of arsenic can result in variations in population exposure.
In the Canadian Total Diet Survey, marine fish, fresh water fish, and canned fish contribute most to the total
arsenic intake from food.82 Individuals with higher fish and seafood consumption will have higher exposures to
ARSENIC (AS)

44
total arsenic; however, fish and other seafood contain mostly organic forms of arsenic which is essentially non-
toxic.
Human exposure to inorganic arsenic can also be from smoking tobacco.83
What health effects have been linked to arsenic?
Inorganic arsenic is well absorbed by the gastrointestinal tract, and to a lesser degree through inhalation. It is
poorly absorbed through skin.81
Inorganic arsenic can contribute to human cancers (gastrointestinal tract, kidneys, liver, lungs and skin) in cases of
long-term high level exposures. Short term exposures of very high levels of inorganic arsenic are also known to
cause ill health by disturbing the gastrointestinal, neurologic and dermal systems.84
Organic forms of arsenic are not known to cause ill health in humans.
Result
Serum arsenic concentrations were above the limit of detection in pools 1 (NW), 4 (NE) and 6 (Far N). The
concentrations ranged from 0.07 µg/L to 0.15 µg/L. Pool 6 had the highest concentration and pool 1 the minimum
detected (Figure 14). The results represent the total amount of arsenic and do not describe the quantity of
inorganic versus organic forms of the metal found in these blood serum samples. Higher levels in the Far N pool
may be a result of the essentially non-toxic organic form common in fish.
0.16
0.14
0.12
0.10
0.08
0.06
SK NW SK NE SK Far N
Figure 14: Serum concentration of arsenic in pregnant women in Saskatchewan. The blue line represents the
analytical limit of quantification.
How do these values compare?
There is no value to compare in the Alberta study and no other comparable source is available for serum values.
The First Nations Biomonitoring Initiative measured arsenic in blood (not serum) and urine so comparison is not
possible.29
Co
nce
ntr
atio
n (
g/L
seru
m)

45
Background
Barium is a naturally occurring element found often in sedimentary and igneous rocks. It is most often found in
compounds (such as salts) rather than in its free elemental state.85 No known barite deposits occur in
Saskatchewan or Alberta.
Barium compounds are used or found in many products including drilling mud, bricks, glass, rubber, florescent
lamps and are used forimaging-ray diagnosis of the digestive tract. 86
How can you be exposed to barium?
Background exposure to barium in the general population occurs through absorption, ingestion and inhalation of
food, water, soil and/or air containing trace amounts of barium. Barium is released into the environment by using
or disposing of products that contain barium as well as mining, burning coal and fossil fuels and other industrial
processes.86 Barium sulfate which is used as a benign aid to x-ray diagnosis, is not absorbed into the blood and is
non-toxic to humans.
Some foods have higher amounts of barium - milk, flour, potatoes and some cereals and nuts. Nonetheless, most
foods contain less than 0.0002 mg/g of barium.85 It is estimated that the average person consumes about 0.03
mg/day of barium. 87
Barium may be excreted in breast milk.
What health effects have been linked to barium?
Background concentrations of barium in humans are not known to cause ill health effects.86
The absorption of barium into the body via the gastrointestinal tract and lungs depends on the type of barium
compound, contents within the gastrointestinal tract and age of person.85,86 Barium salts, such as barium sulphate,
that are less water soluble cause fewer negative health effects. Soluble barium salts are extremely toxic at high
doses causing arteries to constrict, seizures, paralysis and in some cases death.85 Other symptoms of acute barium
toxicity include gastrointestinal issues.85
Result
Pool concentrations for barium ranged from 2.6 µg/L to 3.5 µg/L (mean ± 95% confidence interval: 3.2 µg/L ± 0.3
µg/L). There was not much variation between pools.
How do these values compare?
Saskatchewan pool concentrations were all lower than those detected in Alberta (Alberta was stratified by
geographic region and age).
BARIUM (BA)

46
Background
Cadmium is a soft metal, often a by-product of refining metals such as zinc, copper, or lead. Cadmium is used in
electroplating, as well as the manufacture of plastics and pigments and, to a lesser extent, fungicides, nuclear
reactors, television, batteries, motor oils and in rubber production. 88
Cadmium can enter the food chain through the soil into plants.89 It can also enter into water sources through
industrial and municipal wastes, and leaching from soldering, and black or galvanized pipes.88
How can you be exposed to cadmium?
In non-smokers, cadmium exposure often occurs through ingestion of foods containing cadmium. It can
accumulate in aquatic species and agricultural crops. Leafy greens, vegetables, potatoes, grains and peanuts are
primary food sources of cadmium, although individuals who consume shellfish and organ meats (kidney and liver)
regularly may have elevated exposures.88,89
An important source of cadmium is through inhalation of tobacco smoke;90 a single cigarette contains about 1 to 2
μg of cadmium. Those who smoke have kidney levels of cadmium twice that of non-smokers.88
Indigenous smoking rates are approximately double that of the general non-Indigenous population in Canada.91 As
a consequence, cadmium exposure is higher in this group. As well, cadmium is taken up by lichens and other
plants such as willow, thereby accumulating in the organs (kidney and livers) of herbivorous animals that are then
consumed by Indigenous populations.92 Several studies of Canadian First Nations show that cadmium levels were
associated with the number of cigarettes smoked by humans in the area, but not associated with traditional food
consumption.92,93 A study revealed cadmium levels in moose liver in northern Saskatchewan94,95 were lower than
levels found in southern Saskatchewan, Ontario96, Yukon97, northern British Columbia98, Manitoba99 and Alaska100.
What health effects have been linked to cadmium?
Cadmium when entering the body is deposited in all major organs, but the liver and kidney are the most common
sites. Cadmium can stay in the body for years. As a consequence, chronic low-level exposures can lead to a build-
up of cadmium in the body, and kidney damage can result. Long-terms exposures have also been linked to skeletal
changes, lumbar pain and myalgias.88
Cadmium has been determined to be a human carcinogen by the International Agency for Research on Cancer.89
Result
All pools were below the limit of quantification of 0.05 ug/L.
How do these values compare?
There is no value to compare in the Alberta study and no other comparable source is available for serum values. It
is not possible to compare the Saskatchewan data directly with the blood cadmium levels determined in the
Canadian Health Measures Survey, the Canadian survey found that cadmium levels were strongly associated with
smoking, while the impact of diet was modest to small
CADMIUM (CD)

47
Background
Cesium is naturally occurring and enters the environment from natural processes such as weathering of rocks and
minerals.101 In the environment, cesium exists as either the stable isotope form of cesium (134Cs) or as a compound
(hydroxides, carbonates, iodides and bromides).
Cesium compounds are used in a variety of products including alkaline storage batteries, photoelectric cells, optical
instruments, glasses and atomic clocks.101 Cesium is mined in southeastern Manitoba for the production of a
biodegradable lubricant fluid used in oil drilling.102 Use or disposal of cesium containing products, as well as mining
and some other industrial processes can release cesium into the environment (air, water and soil).
How can you be exposed to cesium?
Background exposure to cesium is primarily through ingestion or inhalation of food, water, soil and air containing
trace amounts of cesium. Tea and coffee contributes to the largest consumption of cesium by the average
Canadian adult. Yeast, herbs and spices have high concentrations of cesium but these are generally only
consumed in small amounts.82 Lichens are also high in cesium which is a major dietary source for caribou. Studies
in lichen and caribou in the Northwest Territories103 and Saskatchewan show relatively high levels of stable
cesium.104 Cesium chloride is sold as an oral alternative cancer therapy though there is no evidence of
effectiveness and this high dose use can cause serious heart rhythm problems.105
What health effects have been linked to cesium?
Background concentrations of cesium are not known to cause any ill health effects in humans, but long term
exposure studies of cesium are limited.101 High doses of cesium chloride as an alternative cancer therapy can
cause heart arrhythmias.
Result
The cesium analyzed in this study represents the amount of cesium 133 (stable or non-radioactive cesium) and is
not a measure of total cesium as other isotopes were not analyzed.
Overall, mean concentrations of cesium in the six pools ranged from 0.3 µg/L to 3.5 µg/L (mean ± 95% confidence
interval: 0.9 µg/L ± 1.0 µg/L). Pool 6 (Far N) had the highest concentration of cesium (3.46 µg/L).
The reasoning behind the elevated concentration of cesium in the far north (Pool 6) at this time is unclear. There
are behavioural variations in this area that include more subsistence hunting and consumption of country foods
and possible geological crustal variations, however, the concentrations measured here only indicate body burden,
so sources of exposure can only be speculative at this time.
CESIUM (CS)

48
How do these values compare?
Cesium levels in pools 1-5 were very similar both with Saskatchewan and when compared to the Alberta mean
concentrations (grouped by geography and age). Pool 6 when compared against all mean cesium concentrations in
Alberta is orders of magnitude greater (Figure 15).
Saskatchewan
4 4
Alberta
3 3
2 2
1 1
0 0
SK NW SK NE SK Far N SK OA North Central South
Figure 15: Concentrations of cesium in the blood serum of pregnant women in Saskatchewan (A) and Alberta (B).
Saskatchewan data is presented for each of the six pooled samples, and for an overall (OA) mean of the six pools.
Mean concentrations stratified by both age and region are presented for Alberta. The blue lines represent the
limit of quantification used in laboratory analysis.
Background
Chromium occurs naturally in the environment and released by weathering of rocks and minerals, and volcanic
eruptions. Naturally occurring chromium has three states; metallic (Cr(0)), trivalent (Cr(III)) or hexavalentCr(VI).
Hexavalent chromium is most commonly found in surface waters and aerobic soil environments. Trivalent
chromium is usually in sediments and wetlands. Hexavalent chromium salts are more able than trivalent
chromium to be mobile due to being more soluble.107
Chromium compounds are used as wood preservatives, in metal plating, for leather tanning, as a catalyst, and in
pigments, paints and fertilizers. Chromium is naturally released into environment from volcanoes, forest fires and
marine aerosols.108
Chromium is released into water by effluent of tanneries, pulp and paper mills, and cement and fertilizer plants
and other industrial sources.109 It is released into the air by aerosol.110 Chromium is not known to bioaccumulate
in aquatic environments.108
CHROMIUM (CR)
Age 18 - 25
Age 26-30
Age 31+
Con
ce
ntr
atio
n (
g
/Lseru
m)

49
How can you be exposed to chromium?
The general population is most likely to be exposed to trace levels of chromium in food. Low levels of the non-
toxic form of chromium (chromium III) occur naturally in a variety of foods, such as fruits, vegetables, nuts, and
meats. However, the general population is exposed to the more toxic forms of chromium (Cr VI) most often by
ingestion of contaminated foods, but also through tobacco smoking and contact with older forms of pressure
treated lumber (with chromated copper arsensate).109
What health effects have been linked to chromium?
Health effects of chromium depend on the dose, the length and timing of exposure, the environment, the species
of chromium and other physiological factors. Chromium (III) is an essential micro-nutrient, while chromium (VI)
can be toxic.
Background concentrations of hexavalent Cr is not known to cause any adverse health effects.109 Long-term
exposure of high doses of hexavalent chromium may cause health effects such as eye, skin, mucous membrane
and nose irritation as well as digestive system problems.109 Cr (VI) can accumulate in tissues such as the lymph
nodes, liver, spleen, kidneys and lungs as it can, unlike Cr (III), cross into cells.
Result
Concentrations for all pools were below the limit of quantification (0.5 µg/L).
How do these values compare?
The mean concentration of blood serum chromium in the Alberta study was 1.5 ± 0.7 µg/L.
Studies have found that serum and whole blood sampling cannot be compared due to chromium’s interaction with
red blood cells, and thus no other comparable studies are available.111
Background
Lead is a ubiquitous, naturally occurring heavy metal used in both industrial and commercial products (paints,
gasoline, plumbing fixtures, storage batteries, leaded glass, leaded crystal, radiation shielding, bullets, shot, and
fishing weights).112 Lead is released into homes and environments with the use or disposal of such products, as
well as a consequence of mining and other industrial processes.
Lead can enter into the environment through air plumes from smelters and emission stacks or mobilization in the
soil (under the right circumstances) and contamination of ground and surface water. Lead can also enter into the
water system through the leaching of lead containing pipes.112,113
How can you be exposed to lead?
Humans can be exposed to lead in a variety of ways. Lead containing dust can be found in homes and workplaces,
particularly older homes where lead-based paints were used. Drinking water that is delivered through older water
pipes containing lead is a known source of lead exposure.114
LEAD (PB)

50
Tobacco smoking is an important source of lead exposure among smokers.115 Lead shot shells and bullets used in
hunting have been identified as a source of exposure for those who consume game animals and birds. Indigenous
populations may be particularly vulnerable due to the higher degree of consumption of game animals and birds. 116–122
Lead can be detected in breast milk and may cross the placenta as early as 12 weeks into gestation112; infants and
fetal exposure can occur from either of these methods.
What health effects have been linked to lead?
Lead is rapidly absorbed by the body, both by ingestion and inhalation. Toxic effects are dependent on dose,
exposure length and timing.
At low levels, lead exposure has been linked with spontaneous abortion, premature delivery and neurotoxic effects
in the developing fetus.112 The developing fetus may also be affected by anemia, motor or sensory system
disturbances, immune system disruption and reproductive system problems.113
In humans, lead in higher concentrations can cause anemia, impaired kidney function, abdominal pain and nervous
system disturbances. It is a known neurotoxin that can cause hallucinations, headaches, dullness, muscle tremors,
poor attention span and loss of memory.112,113
The International Agency for Research on Cancer (IARC) has declared that inorganic lead compounds are a
probable human carcinogen, while organic lead compounds are not yet classifiable as to their carcinogenicity.112
Result
Overall, mean concentrations of lead ranged from 0.3 µg/L to 0.6 µg/L (mean ± 95% confidence interval: 0.5 µg/L ±
0.1 µg/L). All pools were above the level of quantification.
How do these values compare?
The overall mean of the six Saskatchewan pools was larger than the three geographic means measured in Alberta.
As well, many of the Alberta pools were below the level of quantification (< 0.2 µg/L)d (Figure 16). There are no
other studies available using serum levels for comparison.
d For lead the level of quantification for Saskatchewan (0.1 µg/L) did differ from that in Alberta (0.2 µg/L)

51
0.7
Saskatchewan
0.7
Alberta
0.6 0.6
0.5 0.5
0.4 0.4
0.3 0.3
0.2 0.2
0.1 0.1
0.0
SK NW SK NE SK Far N SK OA
0.0
North Central South
Figure 16: Concentrations of lead in the blood serum of pregnant women in Saskatchewan (A) and Alberta by
geographic region (B). The blue lines represent the limit of quantification used in laboratory analysis. Estimates
provided represent a 95% confidence interval around the mean.
The recent First Nations Food, Nutrition and Environment Survey in Saskatchewan identified samples such as wild birds and game meat with higher concentrations of lead, likely as a result of contamination from lead-containing ammunition.65 They recommended the use of nonlead ammunition when hunting and if hunting with lead- containing ammunition, they recommended cutting away the portion of meat surrounding the entry are to decrease the risk of lead exposure.
Background
This section relates primarily to elemental and inorganic mercury. Methylmercury is addressed in the Organic
Chemicals section of this report.
Mercury is naturally occurring and is introduced into the environment by the weathering of rocks and minerals, as
well as volcanic activities. It is the only metal that exists in liquid form at room temperature. It exists naturally in
elemental, inorganic and organic forms.123 High levels have been detected in the Arctic due to global atmospheric
circulation.
Elemental and inorganic mercury compounds are used in a wide variety of industrial, commercial and medicinal
products, including electrical instruments, thermometers, lamps and lights, batteries, cosmetics, dental amalgams
and antiseptics,123 although it is being phased out of most products.124
How can you be exposed to mercury?
Mercury can be released into the air, water or soil by the use or disposal of mercury containing products, burning
of coal, and through mining and other industrial processes.
MERCURY (HG)
C
on
ce
ntr
atio
n (
g
/L s
eru
m)

52
What health effects have been linked to mercury?
Background concentrations of elemental and inorganic mercury are not known to cause any ill health effects in
humans.
In exceptional scenarios where exposures are high (such as in accidental releases or unusual occupational
exposures) elemental and inorganic mercury may cause serious health effects, such as neurological, renal and
digestive system dysfunction, rash and eye irritation.63
Result
Mean concentrations of mercury ranged from 0.2 µg/L to 0.7 µg/L (mean ± 95% confidence interval: 0.4 µg/L ± 0.1
µg/L). There is no clear geographic trend, but the highest concentration was detected in pool 6 (Far N).
How do these values compare?
The mean concentrations from the Alberta study (by age group) were values that fell within the lower range of the
Saskatchewan pools, with concentrations in the two NW pools in Saskatchewan approximating the pool average
concentration of those women 18 to 25 years. (Figure 17)
Saskatchewan Alberta
0.8 0.8
0.7 0.7
0.6 0.6
0.5 0.5
0.4 0.4
0.3 0.3
0.2 0.2
0.1 0.1
0.0
SK NW SK NE SK Far N SK OA
0.0
Age 18 - 25 Age 26-30 Age 31+
Figure 17: Concentrations of inorganic mercury in the blood serum of pregnant women in Saskatchewan (A) and
Alberta by age (B). The blue lines represent the limit of quantification used in laboratory analysis. Estimates
provided represent a 95% confidence interval around the mean.
Walker et al. completed a study in Arctic Canada (Northwest Territories and Nunavut) that included measuring
concentrations of inorganic mercury. Unfortunately, the results cannot be compared against the Saskatchewan or
Alberta values as the methodologies differed. This study does nonetheless point to elevated inorganic mercury
values in those who self-identify as Inuit compared to those who identify as either Dene, Métis or Caucasian. This
suggests that variations in country food consumption may explain variations in inorganic mercury levels126 and
may help to understand the variability seen between the geographic pools in Saskatchewan.
Co
nce
ntr
atio
n (
g
/Lse
rum
)

53
Background
Strontium is a hard, white metal commonly found in nature that turns yellow when exposed to air. Rocks, soil,
dust, coal, oil, air, plants and animals all contain strontium. It exists in four stable isotopes and two radioactive
isotopes. Strontium compounds are used to make ceramics, glass products, pyrotechnics, paint pigments, other
products.127
Strontium-90 (one of the radioactive isotopes) was widely dispersed in the 1950s and 1960s in the United States as
fallout from nuclear weapons testing. Since that time, this isotope has been slowly decaying (half-life of 29.1
years).127 This study measured the non-radioactive form of strontium.
How can you be exposed to strontium?
Strontium naturally occurs in food and water however, additional strontium can be deposited into soil with the
disposal of coal ash, incinerator ash and industrial wastes. Depending on whether strontium in soil is soluble or
insoluble will determine whether it is likely to then migrate further into the ground and into groundwater.
Both stable and radioactive strontium background exposure occurs most often by breathing air, eating food or
drinking water that contains strontium. Food and drinking water are the most important sources, particularly
grains, leafy vegetables and dairy products.127
When strontium enters the body it either resides in the lungs (after inhaling strontium) or the bone, and the length
of time it remains in the body depends on the solubility of the compound. Excretion of strontium can happen
quickly through urine, feces or sweat or the metal may stay in the body for an extended period of time. Strontium
behaves similarly to calcium and can, in some cases, be built into bone matrix, depending on the age of the person
at the time of exposure.127
What health effects have been linked to strontium?
There is no negative human health effects linked to stable strontium.
Result
Overall, mean concentrations of strontium 88, a non-radioactive form of strontrium, ranged from 20.5 µg/L to 39.1
µg/L (mean ± 95% confidence interval: 26.9 µg/L ± 5.5 µg/L). There was no distinct geographic trend identified
across the pools.
Radioactive strontium was not evaluted in this study.
How do these values compare?
There is no value to compare in the Alberta study.
Two comparably small scale studies evaluated strontium levels in child-bearing age women can be used for
comparison. A Brazilian study of women aged 18 to 60 identified a mean plasma concentration of strontium to be
15.4 µg/L (standard deviation 4.2 µg/L).128 This value falls below the range of Saskatchewan pool concentrations
STRONTIUM (SR)

54
determined. While a Chinese study of non-pregnant, non-smoking women determined a median serum strontium
concentration of 57.59 (interquartile range 51.33-68.14) µg/L.129 The median value determined from China
exceeded both the Brazilian study and all Saskatchewan pools.
Background
Uranium is a naturally occurring element that is widespread in nature and found in rock, soil and water.
Distribution in the environment is based on existing geology and climatic processes.
Uranium is a weakly radioactive substance that exists as three isotopes in the environment: 238U, 235U and 234U. All
three naturally occurring isotopes are radioactive. It is usually found in an oxide form.130
Canada is the world’s second largest producer of uranium. Northern Saskatchewan, the source of Canadian
uranium, has some of the world’s most abundant and high grade deposits.131
Uranium is used as fuel for commercial nuclear power plants with industrial uses in ceramics, electron microscopy,
photography, as well as some military applications (e.g., armour plating, armour piercing ammunition).132
How can you be exposed to uranium?
The general population is most often exposed to uranium through diet, particularly root vegetables, and drinking
water especially from ground waters which naturally contain uranium in varying amounts.130 It is estimated that
an average person takes in between 0.07 to 1.1 μg of uranium through food each day.132
What health effects have been linked to uranium?
The health effects of background exposure to uranium are not known and the radiation risk from exposure to
natural uranium is very low. At high levels of exposure, uranium is known to cause kidney damange due to
chemical toxicity.130
Result
All pool concentrations were below the limit of quantification at 0.05 ug/L.
How do these values compare?
There is no value against which to compare in the Alberta study and no other source is available for comparison of
serum values. CHMS and the First Nations Biomonitoring Initiative demonstrated a high proportion of results for
whole blood and urine were below detection limits.
URANIUM (U)
55
The following substances are required by humans for normal physiological function. These are also known as trace
elements as they are only required in very small quantities. Given they are necessary to life, the following ten
substances can be linked to potential health effects in cases of either deficiency or excess.
Background
Boron occurs naturally in soil, water and food. It is required for normal development of plants and is “probably
essential”, as per the World Health Organization, in humans. Consumer products that contain boron or boron
compounds include laundry detergent, pesticides, facial creams and cleansers, plant foods and household
cleaners.133
How can you be exposed to boron?
Exposure to boron primarily occurs through consumption of food and water. The general public is not likely to be
exposed through air, although some occupational exposures are through inhalation.
What health effects have been linked to boron?
There have been studies in animals and humans that suggests that boron may play a role in reducing the risk of
osteoporosis but this has not been confirmed.134 Deficiency, though exceedingly rare and unknown in North
America, has been linked to adverse effects on embryonic development, brain function and cognitive performance.
Boron supplementation in people who are not deficient will not likely provide benefit.135
Very high exposures (over 30 g of boric acid) over a very short period of time can result in detrimental health
effects.
Result
The Saskatchewan pools had boron concentrations ranging from 13 µg/L to 24 µg/L (mean ± 95% confidence
interval: 17 ± 3.1 µg/L). There was no notable geographic variation.
How do these values compare?
Blood serum concentrations of boron in pregnant women in Alberta had mean concentrations ranging from 13.2
µg/L to 34.4 µg/L, with no trends between regions or across age groups. The Saskatchewan pools were quite
comparable to those in Alberta.
MINERAL MICRONUTRIENTS
BORON (B)

56
Background
Cobalt is found in rocks, water, soil, plants and animals. It is usually combined with other elements such as
oxygen, sulphur and arsenic. Cobalt is naturally released into the environment through leaching from soil,
airborne dust, sea spray, volcanic eruptions and forest fires. The burning of fossil fuels, sewage, sludge, phosphate
fertilizers, mining and smelting of cobalt-containing ores and industrial processes that use cobalt compounds are
all human-made sources of cobalt in the environment. Cobalt can exist in two important radioactive forms;
isotopes cobalt-60 and cobalt-57.136 This study measured the stable form of cobalt.
How can you be exposed to cobalt?
For most people, the vast majority of cobalt intake is from food including coffee and through vitamin B12 found in
meat and dairy products. In people who have a joint prosthesis made of cobalt alloys, exposure can be from the
prosthesis.
What health effects have been linked to cobalt?
Cobalt is a key component of vitamin B-12 (cobalamin) which is an essential nutrient for good health. Low levels of
vitamin B-12 can lead to anemia and neurological troubles. Exposure to cobalt levels normally found in the
environment is not harmful to humans.
Result
Overall, mean concentrations of cobalt ranged from 0.4 µg/L to 0.5 µg/L (mean ± 95% confidence interval: 0.5 µg/L
± 0.03 µg/L). All six pools had comparable concentrations and there was no distinct geographic pattern.
How do these values compare?
All Saskatchewan pools were higher than the overall mean serum concentration of the Alberta (mean ± 95%
confidence interval: 0.29 ± 0.05 µg/L ) (Figure 18).
COBALT (CO)

57
0.6
Saskatchewan AB
0.6
0.5 0.5
0.4 0.4
0.3 0.3
0.2 0.2
0.1 0.1
0.0
SK NW SK NE SK Far N SK OA
0.0
OA
Figure 18: Concentrations of cobalt in the blood serum of pregnant women in Saskatchewan (A) and Alberta (B).
Saskatchewan data is presented for each of the six pooled samples, and for an overall (OA) weighted arithmetic
mean of the six pools. An overall mean concentration (OA) is provided for Alberta. The blue lines represent the
limit of quantification used in laboratory analysis. Estimates provided represent a 95% confidence interval around
the mean.
Background
Copper has been mined and used by humans for over 5,000 years. Copper is used extensively for plumbing pipes,
particularly in domestic water systems. It is also used for electroplating, the production of alloys, as a fungicide, as
an antimicrobial agent and a variety of other industrial and commercial uses.137
Copper is an essential nutrient in mammals as it is required for normal enzyme function.
How can you be exposed to copper?
For the general population, copper is ingested in food. Less commonly exposure can result from inhalation of dust
particles containing copper or ingestion of drinking water.138
What health effects have been linked to copper?
Copper deficiency (less than 2 mg/day) can result in anemia, although exceedingly rare.
Copper, while generally considered to be non-toxic, can cause ill health effects in high doses (more than 15
mg/day).137 In these cases copper will build up in the liver and kidneys and cause harm to these organs.139
COPPER (CU)
Co
nce
ntr
atio
n (
g
/L s
eru
m)
58
Result
The overall mean concentration of copper ranged from 1.81 x 10³ µg/L to 2.13 x 10³ µg/L (mean ± 95% confidence
interval: 1.96 x 10³ ± 1.11 x 10² µg/L). There was little variation between the 6 pools.
How do these values compare?
The Saskatchewan pools approximated the Alberta mean concentrations which were grouped by age and
geographic region of Alberta.
Background
Iron is the fourth most common element that makes up the Earth’s crust. It has been used for many centuries in
the making of materials for tools and for construction. It is mined, smelted and is used in the manufacture of steel.
Iron is critical to human physiology, as many enzymes require it for normal functioning. Most iron in the body is
present in hemoglobin, the enzyme in red blood cells that carries oxygen to tissues. Women require more iron
than men, and pregnant women require increasing amounts of iron as the fetus develops through the pregnancy.
How can you be exposed to iron?
Iron is present in many foods and so the most common exposure route is through diet. Red meat, fish and poultry
contain the most easily absorbed iron. Intake through drinking water is also possible, but comparably much lower.
Health Canada recommends prenatal women take vitamin supplements including iron and folic acid. In workplace
settings, welders can be exposed to iron through welding fumes.
What health effects have been linked to iron?
Not enough iron in adults most often results in anemia, which causes fatigue and limited stamina.
Not enough iron in pregnant women can cause fatigue, heart stress, lower immunity and maternal anemia. It also
has consequences for the growing fetus including increased risk of premature delivery, low birth weight and
increased risk of perinatal infant mortality.140
Not enough iron in children can result in delayed motor or mental development.
Very high doses of iron can cause problems with the lining of the gastrointestinal tract, neurologic disturbances
and liver failure.141 This usually occurs through the accidental overdose of iron pills.
Result
Overall, mean concentrations for iron in the six pools of pregnant women sampled ranged from 967 µg/L to 1.23 x
103 µg/L (mean ± 95% confidence interval: 1.07 x 10³ ± 82.4 µg/L). There was little inter-pool variation.
IRON (FE)

59
How do these values compare?
In the Saskatchewan study the mean concentration of iron (1.07 X 10³ ± 82.4 ug/L) was slightly lower than the
mean concentration of iron measured in the Alberta study (1.2 X 10³ ± 24 ug/L).
Background
Manganese is found in rocks and soils naturally, but it does not occur in nature as a pure metal but rather in
combination with oxygen sulphur or chlorine. It is often used in steel production, fireworks, dry cell batteries,
paints, for medical imaging and in cosmetics.142
How can you be exposed to manganese?
Most people are exposed to manganese through food, water, air and consumer products that contain manganese.
Grains, nuts, legumes and fruit have higher concentrations of the element compared to most other foods.142
Manganese is required for normal function of many enzymes in the human body. It is required for normal bone
formation, protection of cells and in the metabolism of amino acids, cholesterol and carbohydrates.142
What health effects have been linked to manganese?
Manganese deficiency is very rare, but when it does occur neurological effects may result.
High doses of ingested manganese can result in lung damage. High doses of inhaled manganese can result in a
condition known as manganism – tremors, difficultly walking and facial spasms.142
Result
Overall, mean concentrations of manganese ranged from 2.6 µg/L to 4.2 µg/L (mean ± 95% confidence interval: 3.5
µg/L ± 0.4 µg/L). All six pools had comparable levels of manganese.
How do these values compare?
The Alberta pooled mean is slightly lower than the Saskchewan pooled mean, but this difference is not statistically
significant.
Background
Magnesium is the eighth most common natural element. Magnesium alloys are used to make beverage cans,
pressure die-cast products, electrical equipment, portable tools, sports equipment, and many other products. It is
used in both the steel and chemical industries extensively. It is also found naturally in many foods.143
Magnesium is required for over 300 known enzyme reactions in the body.
MANGANESE (MN)
MAGNESIUM (MG)

60
How can you be exposed to magnesium?
Magnesium is found in many foods and food products. Green leafy vegetables, unpolished grains and nuts are all
rich in magnesium.144
What health effects have been linked to magnesium?
Magnesium deficiencies are exceptionally rare, but when they do occur they negatively affect heart, kidney,
muscle and nerve function. The most common effect of too much magnesium is its ability to act as a laxative,
although the human body can quickly adapt and resolve this issue in many cases. More seriously, high levels of
magnesium can result in changes in heartbeat, and at very high levels (plasma concentrations above 180,000 µg/L)
paralysis, respiratory depression, coma or even death may occur.143
Result
Overall, mean concentrations of magnesium ranged from 1.70 x 10⁴ to 1.97 x 10⁴ µg/L (1.86 x 10⁴ µg/L ± 685 µg/L).
There was no notable variation between pools.
How do these values compare?
There is no value to compare in the Alberta study and no other similar studies available for comparison. Although
reference values may differ between laboratories, the magnesium reference value for Mayo Clinic Laboratories is
between 1.7 and 2.3 X 10⁴ ug/L.167
Background
Molybdenum naturally occurs in the Earth’s crust and is found in combination with other elements. It is naturally
found in rocks, soil, sediment, surface water, groundwater, plants, animals and humans. Both natural and man-
made processes can release it into the environment, including weathering, combustion of coal, sewage sludge and
mining. Fertilizer use is an important source of aquatic species exposure.145
Molybdenum is required for three types of enzymes to work properly in the human body: sulphite
oxidase, aldehyde dehydrogenase, and xanthine oxidase.146
How can you be exposed to molybdenum?
Diet is the primary source of molybdenum.
What health effects have been linked to molybdenum?
Human health effects from low levels of molybdenum are unknown. In circumstances of long-term exposures to
very high levels (10-15 mg/day), gout-like symptoms can occur.146
MOLYBDENUM (MO)

61
Result
Overall, mean concentrations of molybdenum (Mo) ranged from 1.1 µg/L to 1.3 µg/L (1.2 µg/L ± 0.06 µg/L). There
is not a distinct pattern across pools.
How do these values compare?
Compared to the range of blood serum concentrations in pregnant women in Alberta (1.06 µg/L to 4.29 µg/L),
northern Saskatchewan presented with slightly lower overall concentrations (1.2 ± 0.060 µg/L).
Background
Nickel is hard, silvery-white metal that is commonly combined with other metals to form alloys. It is used to make
steel, nickel plate, battery production and as a catalyst. Alloys are used in coins and jewelry. Human activities such
as mining, industry, oil-burning, coal-burning and trash incineration can release nickel into the environment.147
How can you be exposed to nickel?
Exposure to nickel is primarily through food. Foods naturally high in nickel include chocolate, soybeans, nuts and
oatmeal. Wearing nickel containing jewelry or using consumer products contain nickel are less important
sources.147
What health effects have been linked to nickel?
The most common health effect of nickel exposure is an allergic reaction. Yet, this reaction is mostly in cases of
skin exposure and the result is most commonly a rash.147
Result
Overall, mean concentrations of nickel ranged from 0.4 µg/L to 2.08 µg/L (mean ± 95% confidence interval = 0.8
µg/L ± 0.6 µg/L).
How do these values compare?
The mean concentration of the Saskatchewan pools combined was statistically comparable to that found in the
Alberta study (0.9 ± 0.09 µg/L). The range of the Alberta results were from 0.386 to 5.58 ug/L.
Background
Selenium is a naturally occurring substance found distributed in the Earth’s crust, with some geographic areas
known to contain more selenium than others.148 Selenium and selenium compounds can be used in plastics,
rubber, agriculture, paints, ceramics and glass, electronic materials, drug products, natural health products,
lubricants and metallurgical applications.149 Mining and burning of fossil fuels also can release selenium into the
environment.
NICKEL (NI)
SELENIUM (SE)
62
Selenium can also be released into the environment through natural processes such as volcanic activity and
weathering of soils and rocks.149
Selenium is necessary for human functioning as antioxidant enzymes, enzymes that protect the body from tissue
damage, require it. It is also required for normal growth and metabolism.148
Fish consumption recommendations are in place for Beaverlodge and Martin Lakes in the Eastern Athabascan
Region of Saskatchewan since 2003 due to high concentrations of selenium in fish associated with historical
uranium mining in the area. These advisories provide recommendations of the maximum number of fish that it is
advisable to eat from these lakes (Personal communication: Dr. James Irvine).
How can you be exposed to selenium?
People are exposed to low levels of selenium on a daily basis through food, water and air, with most coming from
dietary sources. Food that are grown (e.g. grains) or fed (animal products) with feed grown in areas known to be
higher in selenium will contain more selenium.148 Selenium is an ingredient in some vitamin pills, including some
prenatal vitamins.
What health effects have been linked to selenium?
Selenium is a necessary substance for normal physiological functioning, but too high levels have been shown to
cause harm.
Not consuming enough selenium is hazardous to health as it makes the body more susceptible to illness caused by
other nutritional, biochemical or infectious stresses.148
Selenosis is a well described health outcome of consuming elevated levels of selenium (above 800 µg/day) over an
extended period of time. Selenosis is characterized by brittle hair and deformed nails and/or tooth decay. The
most extreme cases present with loss of feeling and control of the arms and legs.148
Result
Overall, concentrations of selenium ranged from 107.9 µg/L to 124.1 µg/L (118 µg/L ± 4.8 µg/L). There is no
apparent trend between pools.
How do these values compare?
The blood serum pools in Saskatchewan (means of 118 ± 4.77 µg/L) were slightly lower than the overall mean
serum concentration in Alberta of 154 ± 2.84 µg/L. (Figure 19)
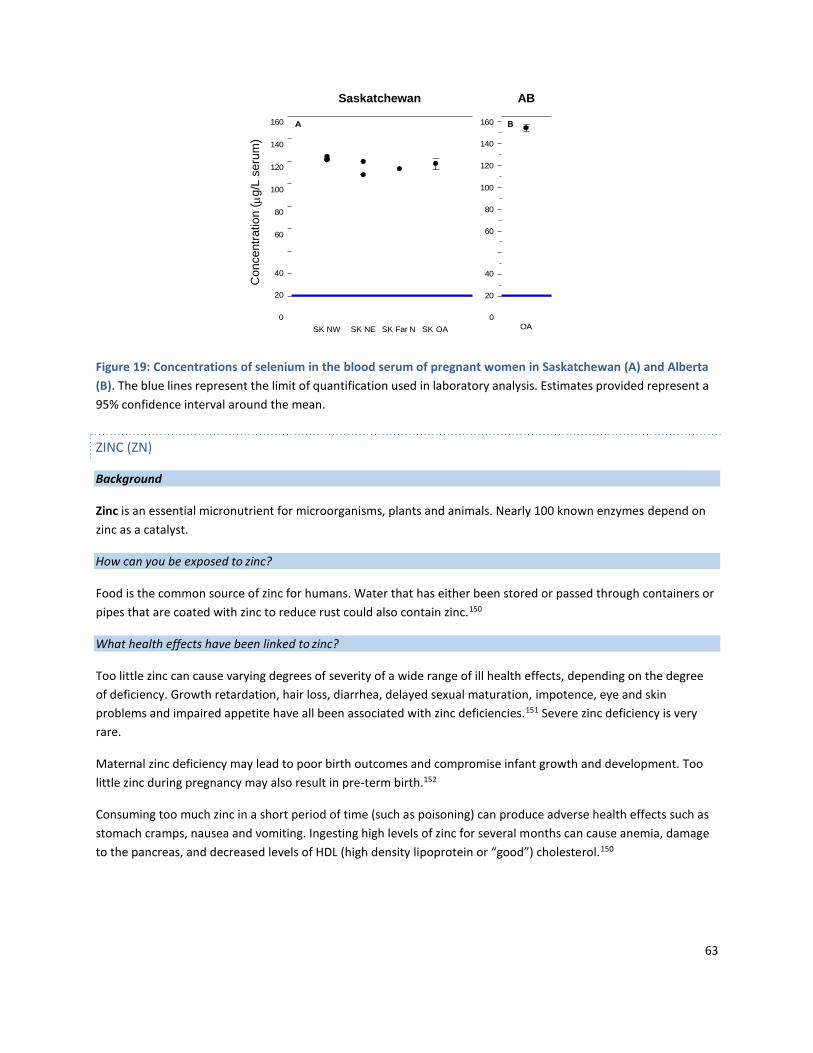
63
160
140
120
100
80
60
Saskatchewan AB
160
140
120
100
80
60
40 40
20 20
0 0
SK NW SK NE SK Far N SK OA OA
Figure 19: Concentrations of selenium in the blood serum of pregnant women in Saskatchewan (A) and Alberta
(B). The blue lines represent the limit of quantification used in laboratory analysis. Estimates provided represent a
95% confidence interval around the mean.
Background
Zinc is an essential micronutrient for microorganisms, plants and animals. Nearly 100 known enzymes depend on
zinc as a catalyst.
How can you be exposed to zinc?
Food is the common source of zinc for humans. Water that has either been stored or passed through containers or
pipes that are coated with zinc to reduce rust could also contain zinc.150
What health effects have been linked to zinc?
Too little zinc can cause varying degrees of severity of a wide range of ill health effects, depending on the degree
of deficiency. Growth retardation, hair loss, diarrhea, delayed sexual maturation, impotence, eye and skin
problems and impaired appetite have all been associated with zinc deficiencies.151 Severe zinc deficiency is very
rare.
Maternal zinc deficiency may lead to poor birth outcomes and compromise infant growth and development. Too
little zinc during pregnancy may also result in pre-term birth.152
Consuming too much zinc in a short period of time (such as poisoning) can produce adverse health effects such as
stomach cramps, nausea and vomiting. Ingesting high levels of zinc for several months can cause anemia, damage
to the pancreas, and decreased levels of HDL (high density lipoprotein or “good”) cholesterol.150
ZINC (ZN)
Co
nce
ntr
atio
n (
g
/L s
eru
m)

64
Result
Overall, concentrations of zinc ranged from 1303.86 µg/L to 1528.70 µg/L (mean ± 95% confidence interval:
1409.39 µg/L ± 66.40 µg/L). There were no meaningful differences between pools.
How do these values compare?
The mean concentration in Saskatchewan (1409.39 ± 66.40 µg/L) overlaps with the overall mean concentrations in
women in Northern, Central and Southern Alberta based on the Alberta study.
As technology advances and biomonitoring continues to evolve the ability to measure chemicals in a biological
matrix, such as blood serum, continues to improve. The ability to interpret the data in regards to risk to health
remains limited. Further research in a variety of fields is required before biomonitoring data can be used to
meaningfully and reliably determine risk. 153
The desire for knowledge was weighed against feasibility in this study, as is the case in many studies. Choices that
were made in regards to the study design resulted in several limitations.
In this study only the postal code of participants was collected and no other demographic information was
included. As a result, we cannot further evaluate these findings by particular sub-categories such as age of
mother, gestational age, etc.
The choice to use a pooled sample design over individual samples had the benefit of being more economical and
less likely to have a high number of concentrations below the limit of detection (this can complicate statistical
analysis). However, with pooled samples it becomes impossible to know individual level information about
participants.
Without knowing individual level data, it is impossible to answer queries such as whether all the participants have
approximately the same blood serum concentrations or if one person had a really high level and everyone else had
very low concentrations. Pooling makes it impossible to know the difference between the two.
STUDY LIMITATIONS
BIOMONITORING
STUDY DESIGN AND IMPLEMENTATION
MISSING DEMOGRAPHIC INFORMATION
POOLED SAMPLE DESIGN

65
Women whose prenatal blood screen was sent through Flin Flon Hospital laboratory were not included in the
study, and some of the prenatal blood specimens from LaRonge Health Center at the very beginning of specimen
collection were not included. It is estimated that pools 1, 2, 3, 4 and 6 included most of the pregnant women from
those regions, but pool 5 is likely less reflective. Therefore, all pools save pool 5 are likely able to represent what is
happening to most women in their respective geographies. Pool 5 does not represent women from those
communities where the blood work was sent through the Flin Flon Hospital (e.g. Creighton, Denare Beach, Pelican
Narrows and Deschambault).
This study analyzed all substances from the blood serum of participants. Although this simplifies the study and
made it economical, it limits some of the conclusions that can be derived from the information. For example,
some substances are better measured in another matrix (whole blood including blood cells, urine etc.).
Comparisons to other biomonitoring studies (such as CHMS or First Nations Biomonitoring Initiative) were often
not possible due to either differences in analytical methods or due to selection of another biological matrix. The
Saskatchewan study was designed to allow for comparison with the Alberta study. Even then comparisons
between the two studies were not always possible due to:
Inclusion of some substances in the Saskatchewan study that were not in the Alberta study.
Variations in how the pools were determined (e.g. geographically versus by age).
Variation in analytical techniques and resulting difference in the limit of detection
Without comparison it can be difficult to understand what a particular concentration may mean.
MISSING PEOPLE
LIMITED BIOLOGICAL MATRIX SELECTION
LIMITED OPTIONS FOR COMPARISON

66
Cross-jurisdictional projects are challenging for a variety of reasons. In the case of this study the legal, organization,
ethical and cultural milieus of each jurisdiction (Alberta and Saskatchewan) varied sufficiently that certain
modifications in study design were necessary. The efficient negotiation of these realities is a valuable lesson
learned from this study.
The structure of the team behind this biomonitoring initiative was a laudable example of cross-boundary
cooperation and collaboration.
Europe and the U.S. are leaders in large scale biomonitoring initiatives and have independently developed
approaches to improve cross-border biomonitoring initiatives. The CDC introduced (2009) the State Biomonitoring
Cooperative Agreement that supports the capability and capacity of states to conduct biomonitoring and state
population-based biomonitoring surveillance.154 In Europe the trans-national challenge was met by support from
European Union affiliated organizations acting as leads and from that a cohesive project was produced.155 The
Alberta-Saskatchewan biomonitoring initiative, was a collaborative and receptive process that demonstrates how
provincial governments can partner on large scale projects. Fundamentally, environmental contaminants do not
abide by boundaries and this must be considered when developing sound biomonitoring surveillance programs.
Without the mentoring, leadership and fiscal support from Alberta, biomonitoring in Saskatchewan would not
have occurred. At the time of the project there was little expertise and capacity around human biomonitoring
provincially and, as a result, no momentum for developing human biomonitoring as a surveillance tool in
Saskatchewan existed.
The area of biomonitoring is emerging as an important tool in environment and public health surveillance. Alberta
has opened the door with this study on Saskatchewan’s northern population, but there is an opportunity to go
further and develop human biomonitoring surveillance across the province.
The World Health Organization describes tobacco as “the most widely available harmful product on the market.”
Tobacco smoking is known to increase the risk of disability, disease and death, in particular due to cancer and
cardiovascular disease. Cigarettes contain over 4,000 chemicals, 50 of which are known carcinogens.156 In 2002,
37,209 Canadians died from tobacco use and tobacco use was attributed to 2,210,155 days in hospital.157
Tobacco smoke is known to cause elevated levels of heavy metals, including arsenic81, cadmium88 and lead115,
among various other chemicals.158 Measured lead levels in this study were higher than the Alberta study values
(Figure 16). There are many other chemicals also known to be statistically significantly different (often higher) in
smokers than in non-smokers including dioxins and furans, polyaromatic hydrocarbon and volatile organic
compounds (Table 5).
DISCUSSION
CROSS-JURISDICTION COLLABORATION
SMOKING - AN IMPORTANT SOURCE OF EXPOSURE AND RISK

67
Table 5: Chemicals found to be statistically significantly different for smokers and non-smokers in biomonitoring
studies in the United States. From the National Health and Nutritional Examination Survey (NHANES) 2011-2012
for males and females combined 20 years of age or over.
Chemical
Geometric Mean Concentrations (urine)
(95% Confidence Intervals)
Fold
Difference
Smokers
Non-Smokers
Metals and Arsenic Species
Cadmium (ug/g) 0.366 (0.295 – 0.383) 0.199 (0.163-0.216) 1.8
Lead (ug/g) 0.518 (0.465-0.576) 0.417 (0.386-0.451) 1.24
Molybdenum 35.6 (33.7 – 37.7) 40.4 (38.7 – 42.2) 0.88
Uranium 0.008 (0.007 - 0.009) 0.006 (0.005 – 0.007) 1.4
Thiocyanate
Thiocyanate (mg/g) 4.53 (4.02-5.10) 0.933 (0.881-0.988) 4.86
Metabolites of Polyaromatic hydrocarbons (PAHs)
2-Hydroxyfluorene (ng/g) 1260 (1140-1400) 190 (176-203) 6.63
3-Hydroxyfluorene (ng/g) 662 (595-738) 66.9 (62.0-72.1) 9.9
9-Hydroxyfluorene (ng/g) 666 (592-751) 240 (220-261) 2.8
1-Hydroxyphenanthrene 216 (200 – 234) 134 (123 – 145) 1.6
2-Hydroxyphenanthrene 123 (114 – 133) 62.4 (57.9 – 67.3) 2.0
3-Hydroxyphenanthrene 153 (144 – 163) 56.6 (52.3 – 61.3) 2.7
4-Hydroxyphenanthrene 41.6 (37.5 – 46.1) 20.4 (19.1 – 21.9) 2.0
1-Hydroxypyrene 266 (246 - 269) 96.8 (90.8 – 103) 2.7
1-Hydroxynapthalene 10.5 (9.06 – 12.1) 1.37 (1.25 – 1.51) 7.7
2-Hydroxynapthalene 13.5 (12.3 – 14.8) 3.69 (3.46 – 3.93) 3.7
Metabolites of Volatile Organic Compounds (VOCs)
N-Acetyl-S-(2-carbamoyl-2-
hydroxyethyl)-L-cysteine
31.1 (28.0 – 34.6)
15.0 (14.1 – 15.9)
2.1
N-Acetyl-S-(2-carbamoylethyl)-L-
cysteine
121 (110 – 134)
42.4 (39.9 – 44. 9)
2.9
N-Acetyl-S-(2-carboxyethyl)-L-cysteine 250 (224 – 278) 93.6 (87.6 – 100) 2.7

68
N-Acetyl-S-(3-hydroxypropyl)-L-
cysteine
1090 (968 – 1230)
224 (208 – 241)
4.9
N-Acetyl-S-(2-cyanoethyl)-L-cysteine 134 (118 – 151) 1.75 (1.57 – 1.94) 76.6
N-Acetyl-S-(N-methylcarbamoyl)-L-
cysteine
455 (390 – 531)
126 (119 – 134)
3.6
N-Acetyl-S-(3,4-dihydroxybutyl)-L-
cysteine
365 (340 – 392)
269 (257 – 281)
1.4
N-Acetyl-S-(4-hydroxy-2-butenyl)-L-
cysteine
63.1 (55.1 – 72.2)
8.12 (7.41 – 8.89)
7.8
N-Acetyl-S-(2-hydroxypropyl)-L-
cysteine
115 (99.4 – 134)
61.0 (54.8 – 67.9)
1.9
N-Acetyl-S-(3-hydroxypropyl-1-
methyl)-L-cysteine
1969 (1720 – 2240)
388 (362 – 416)
5.1
t,t-Muconic acid 132 (117 – 150) 73.8 (67.1 – 81.1) 1.8
Mandelic acid 311 (280 – 345) 150 (141 – 160) 2.1
2-Methylhippuric acid 109 (96.5 – 123) 30.1 (27.0 – 33.6) 3.6
3-and 4-Methylhippuric acid 732 (647 -828) 201 (187 – 215) 3.6
Phenylglyoxylic acid 338 (306 – 374) 186 (172 – 200) 1.8
*where applicable, creatine corrected levels provided, +highlighted chemicals were assessed in this study
Cotinine, a substance measured in this study, is a primary nicotine metabolite and is a recognized marker of
smoking. Non-smokers typically have serum cotinine levels below 5 ng/mL.12,13 The mean cotinine level of the 6
pools was 58.03 ng/mL (95% CI 52.40-63.66 ng/mL), suggesting that a sizeable number of participants either
smoked themselves or were exposed to second-hand smoke at the time of their blood sample collection.

69
Figure 20: Tobacco impact on biomonitoring
In 2013, 17.6% of people smoked in Saskatchewan, while the national rate was only 14.6%.158 In 2010, those living
in northern Saskatchewan were smoking at nearly twice the provincial rate. Almost half of the population of
northern Saskatchewan lives in First Nations communities and it is estimated that 59% of on-reserve persons
smoke tobacco.
A questionnaire administered to women postpartum in Saskatchewan (2007-2011) revealed that about 54.2% of
the northern population did smoke during pregnancy, compared to 24.2% of the general Saskatchewan
population.160 The Athabasca Health Authority, Keewatin Yatthé and Mamawetan Churchill River Health Regions
reported 73%, 54.5% and 49% of women who smoked while pregnant, respectively. 91
This is to say that the cotinine levels detected align with epidemiologic evidence – that smoking in northern
Saskatchewan remains a priority public health concern.
The Saskatchewan Ministry of Health is responsible for developing and amending The Tobacco Control Act and The
Tobacco Control Regulations. The goal of this legislation is to reduce youth access to tobacco products and protect
Saskatchewan residents from the harms associated with environmental tobacco smoke. The Act was put into
place in 2002 and has since been amended. Laws within The Tobacco Control Act include a ban on smoking in
70
enclosed public places, in cars with children under the age of 16 present, around doorways, windows and air
intakes of public buildings, a ban on tobacco use on school grounds, and a number of restrictions on the sale and
advertising of tobacco products. As of October 1, 2010, amendments to The Tobacco Control Act further reduce
youth access to tobacco products and continue to protect Saskatchewan people from the harms of environmental
tobacco smoke. On April 1, 2011, the provision of The Tobacco Control Act banning the sale of tobacco and
tobacco-related products in pharmacies came into effect. The Federal government has instituted Tobacco
Reporting Regulations which ensures that tobacco manufacturers provide annual reports to Health Canada with
their product ingredients, sale numbers, promotional activities and toxic constituents.161
The cotinine levels from this study, beyond putting some of the other chemical findings in context, can be used as
a benchmark to follow future trends in tobacco use and the effectiveness of current and future tobacco control
strategies in the region.
The findings in this study are of a specific set of chemicals in the blood serum of a select number of people over a
given time. The amount of chemical present at the time of blood draw depends on a wide variety of factors
including time of exposure, length of exposure, the chemical properties of the substance itself and the physiology
of the participant. Nonetheless, the detected amount of chemical provides valuable baseline information on which
to build.
The interpretation of results in a biomonitoring study can be challenging - environmental research is complex,
and consequentially scientific controversies and uncertainties are expected.8 As well, the assessment of human
health risks associated with chemicals is complex since some chemicals may not cause any health concerns at low
levels and that levels of concern (threshold levels) are not known for all chemicals. An individual or a community
may feel anxiety due to being made aware of the presence of a given substance in a biomonitoring study, but may
be left with uncertainty as to what to do with that information.
Given the improvements in laboratory testing, many substances can be detected at minute quantities, so, as in the
case of this study, a region can be told that they are being exposed to chemicals or exposed at a higher level
compared to another region without an understanding of their health risk. To address these concerns where
possible, further explanation will be provided to put the value in context. For some levels, individual action may
reduce exposures, whereas other exposures may require broader societal changes. For many levels, there may not
be any known health effect; but the value will be important for future assessments to determine if exposures are
increasing.
The findings of this study focus on human exposure to various chemicals, but the presence or absence of chemicals
in the participants reflects to some degree the physical and social environments in which they exist. The social
SPECIAL CONSIDERATION IN INTERPRETATION
BIOLOGICAL
PSYCHOLOGICAL
SOCIAL

71
determinants of health such as physical and social environments, are well known to influence the health of
populations.162
Communities in northern Saskatchewan have specific physical and social environment concerns.91 Housing
conditions, access to fresh and clean water and indoor air quality are other important elements of the physical
environment that affect health and can be sources of exposure to a variety of substances.163 In particular, smoking
rates are higher in this area compared to the rest of the province (smoking is a major contributor to indoor air
quality), and these elevated rates of smoking influence some of the findings in this study.
Those living in northern Saskatchewan tend to draw on traditional food sources (such as hunting and fishing) to
meet their foods needs. Thus, exploring country foods as a source of exposure for some substances has value.
Studies that have explored the relationship between traditional diets and chemical expsoures such as
methylmercury in northern Canada, including northern Saskatchewan, have identified that a good understanding
of possible exposure balanced against the environmental, societal and individual values of consuming country
foods is important.164,165
Various substances that have been discussed in this study, particularly a subset of the organic chemicals, are
known to, or considered to possibly be, passed on through breast milk when a mother is breastfeeding.
It is well understood that the benefits of breastfeeding outweigh the risks of potential introduction of some of
these substances to a newborn or infant. Breastfeeding is the best food to help a newborn grow and develop
healthfully. It has been linked to improved cognitive skills. It is often also the most practical and affordable
option.
As with all risk considerations, both the risk of exposure and the risk of the actions taken to avoid the exposure
should be thoroughly weighed. Although in some cases that can be complex, in the case of breastfeeding the
benefits of continuing to breastfeed far outweigh the possible risk of exposure to some chemicals. Breastfeeding is
better.
A human health risk assessment (HHRA) is a process wherein the risk to human health and wellbeing is estimated
based on exposure. Often the exposure is chemical. A HHRA attempts to answer questions around what health
effects could result from exposure to a particular chemical or set of chemicals over a period of time.
A biomonitoring study does not provide sufficient evidence to complete a risk assessment. The information found
by biomonitoring can be used to inform a complete human health risk assessment. Biomonitoring does not
provide information about how or to what degree a specific exposure occurred. For most substances
biomonitoring just gives a snap shot in time and does not allow for a complete understanding of how much a
person is exposed to a certain substance over time. Detailed dose and exposure assessments are necessary
elements of a HHRA.
The findings of this study can provide insight into whether a thorough HHRA is a reasonable next step, but can also
be a resource for any future HHRAs in the region.
BALANCING RISK – BREAST FEEDING IS BETTER
RISK ASSESSMENTS – THE ROLE OF BIOMONITORING
72
The study provides information on serum levels of a wide range of environmental chemical levels in pregnant
women from various geographic areas in northern Saskatchewan. This information is useful as baseline
information for monitoring in the future as well as for public policy and preventive health approaches. For
some of the environmental chemicals, one is able to make direct comparisons with levels in pregnant women
in other areas such as in Alberta.
Overall, most of the environmental chemical testing for northern Saskatchewan revealed levels lower than or
comparable to levels in pregnant women in Alberta. Some highlights include:
• Some specific chemicals in the categories such as polybrominated diphenyl ethers (flame retardants),
perfluorochemicals, most pesticides tested, dioxins and furans, were either lower than Alberta levels or
were undetectable. Uranium, nonylphenol and bisphenol A were also not detectable or were below the
level that could be accurately measured.
• Selenium and molybdenum were slightly lower than the average levels in Alberta. Iron levels were also
slightly lower in Saskatchewan than Alberta women but cobalt was higher. Both iron and cobalt help
prevent anemia (weak blood from low iron or vitamin B12).
• The levels of lead, a heavy metal, were higher than the average levels seen in Alberta. People may be
exposed to lead through lead-based paints (in older homes), drinking water coming in contact with old
lead plumbing, consumer products, or the ingestion of lead shot or lead bullet fragments in country foods.
Smokers or those exposed to second hand smoke tend to have higher levels.
• Mercury levels were comparable to those in Alberta; however, the levels in the far northern area of
Saskatchewan were higher. Methylmercury levels tend to be higher in those who consume a lot of fish
especially large predatory fish.
• Continine levels, a breakdown product of nicotine, were higher in northern Saskatchewan women
indicating higher exposures to tobacco smoke either through smoking or passive smoke exposure.
Exposure to tobacco smoke increases exposure to many other environmental chemicals as well.
A factsheet has been prepared called “Reducing My Exposure to Environmental Chemicals” which is available at:
https://publications.saskatchewan.ca:443/api/v1/products/101376/formats/112050/download
CONCLUSIONS

1. Centers for Disease Control and Prevention. National Biomonitoring Program. https://www.cdc.gov/biomonitoring/. Accessed March 25, 2019.
2. U.S. Environmental Protection Agency. Human Health Risk Assessment. EPA Risk Assessment. https://www.epa.gov/risk. Accessed
March 25, 2019.
3. Alberta Health and Wellness. Alberta Biomonitoring Program: Chemical Biomonitoring in Serum of Pregnant Women in Alberta.; 2008.
4. Alberta Health and Wellness. Alberta Biomonitoring Program: Chemicals in Serum of Children in Southern Alberta 2004-2006 -
Influence of Age and Comparison to Pregnant Women.; 2010.
5. Esteban M, Castaño A. Non-invasive matrices in human biomonitoring: a review. Environ Int. 2009;35(2):438-449. doi:10.1016/j.envint.2008.09.003.
6. Heffernan AL, Aylward LL, Toms L-ML, Sly PD, Macleod M, Mueller JF. Pooled biological specimens for human biomonitoring of
environmental chemicals: opportunities and limitations. J Expo Sci Environ Epidemiol. 2013;24(3):225-232. doi:10.1038/jes.2013.76.
7. Caudill SP. Important issues related to using pooled samples for environmental chemical biomonitoring. Stat Med. 2011;30(5):515- 521. doi:10.1002/sim.3885.
8. Harrison M. Applying bioethical principles to human biomonitoring. Environ Health. 2008;7 Suppl 1:S8.
9. Keune H, Morrens B, Loots I. Risk communication and human biomonitoring: which practical lessons from the Belgian experience are
of use for the EU perspective? Environ Health. 2008;7 Suppl 1:S11. doi:10.1186/1476-069X-7-S1-S11.
10. Health Canada. The Canadian Health Measures Survey. August 2015. http://www.hc-sc.gc.ca/ewh-semt/contaminants/human- humaine/chms-ecms-eng.php. Accessed September 30, 2018.
11. Centers for Disease Control and Prevention. Cotinine. Biomonitoring Summaries.
http://www.cdc.gov/biomonitoring/Cotinine_BiomonitoringSummary.html. Published 2013. Accessed August 18, 2018.
12. Benowitz NL, Bernert JT, Caraballo RS, Holiday DB, Wang J. Optimal Serum Cotinine Levels for Distinguishing Cigarette Smokers and Nonsmokers Within Different Racial/Ethnic Groups in the United States Between 1999 and 2004. Am J Epidemiol. 2008;169(2):236- 248. doi:10.1093/aje/kwn301.
13. CDC’s Office on Smoking and Health. Smoking and Tobacco Use; Health Effects.
http://www.cdc.gov/tobacco/basic_information/health_effects/index.htm. Accessed September 23, 2015.
14. Ejaz S, Lim CW. Toxicological overview of cigarette smoking on angiogenesis. Environ Toxicol Pharmacol. 2005;20(2):335-344. doi:10.1016/j.etap.2005.03.011.
15. Dušková M, Hruškovičová H, Šimůnková K, Stárka L, Pařízek A. The effects of smoking on steroid metabolism and fetal programming. J
Steroid Biochem Mol Biol. 2014;139:138-143. doi:10.1016/j.jsbmb.2013.05.003.
16. Ivorra C, García-Vicent C, Ponce F, Ortega-Evangelio G, Fernández-Formoso JA, Lurbe E. High cotinine levels are persistent during the first days of life in newborn second hand smokers. Drug Alcohol Depend. 2014;134:275-279. doi:10.1016/j.drugalcdep.2013.10.017.
17. Duffy C, Perez K, Partridge A. Implications of phytoestrogen intake for breast cancer. CA - A Cancer J Clin. 2007;57:260-277.
18. Cotterchio M., Boucher BA, Manno M. Dietary phytoestrogen intake is associated with reduced colorectal cancer risk. J Nutr.
2006;136:3046-3053.
19. Tempfer CB, Froese G, Heinze G, Bentz E-K, Hefler LA, Huber JC. Side effects of phytoestrogens: a meta-analysis of randomized trials. Am J Med. 2009;122(10):939-46.e9. doi:10.1016/j.amjmed.2009.04.018.
20. Lee N. Phytoestrogens as bioactive ingredients in functional foods: Canadian regulatory update. J AOAC Int. 2006;89:1135-1137.
21. Health Canada, Natural Health Products Directorate. Technical Report to Summarize the Scientific Rationale for the Natural Health
Products Directorate’s New Guidance on the Regulation of Soy Isoflavone Products. Ottawa, ON; 2009. https://www.canada.ca/en/health-canada/services/drugs-health-products/natural-non-prescription/legislation-guidelines/guidance- documents/technical-report-summarize-scientific-rationale-regulation-isoflavone.html. Accessed January 2, 2019.
22. Patisaul HB, Jefferson W. The pros and cons of phytoestrogens. Front Neuroendocrinol. 2010;31(4):400-419..
WORKS CITED

74
23. Health Canada, Government of Canada. It’s Your Health - Dioxins and Furans. https://www.canada.ca/en/health- canada/services/healthy-living/your-health/environment/dioxins-furans.html. Published 2004. Accessed August 18, 2018.
24. Lee CC, Lin WT, Liao PC, Su HJ, Chen HL. High average daily intake of PCDD/Fs and serum levels in residents living near a deserted
factory producing pentachlorophenol (PCP) in Taiwan: influence of contaminated fish consumption. Environ Pollut. 2006;141(2):381- 386. doi:10.1016/j.envpol.2005.08.032.
25. Health Canada. It’s Your Health - PCBs. It’s Your Health. https://www.canada.ca/en/health-canada/services/healthy-living/your-
health/environment/pcbs.html. Modified October 2005. Accessed August 18, 2018.
26. Jacobson JL, Jacobson SW. Postnatal exposure to PCBs and childhood development. Lancet (London, Engl). 2001;358(9293):1568-9.
27. Forns J, Torrent M, Garcia-Esteban R, et al. Prenatal exposure to polychlorinated biphenyls and child neuropsychological development in 4-year-olds: an analysis per congener and specific cognitive domain. Sci Total Environ. 2012;432:338-343. doi:10.1016/j.scitotenv.2012.06.012.
28. Centers for Disease Control and Prevention. Fourth National Report of Human Exposures to Environmental Chemicals. Atlanta, GA;
2009. https://www.cdc.gov/exposurereport/pdf/FourthReport.pdf. Accessed September 2018.
29. Assembly of First Nations. First Nations Biomonitoring Initiative - National Results (2011). Ottawa, ON; 2013. doi:10.1007/s13398-014- 0173-7.2.
30. U.S. Department of Health and Human Services. Toxicological Profile for DDT, DDE and DDD. Atlanta, GA; 2002.
31. Aboriginal Affairs and Northern Development Canada. Dichlorodiphenyltrichloroethane (DDT). Persistent Organic Pollutants (POPs)
Fact Sheet Series. https://www.aadnc-aandc.gc.ca/eng/1316102914633/1316103004743. Published 2010. Accessed August 20, 2018.
32. Centers for Disease Control and Prevention. Organochlorine Pesticides Overview. National Biomonitoring Program. http://www.cdc.gov/biomonitoring/DDT_BiomonitoringSummary.html. Published 2013. Accessed October 15, 2018.
33. Charlier CJ, Foidart J-M. Comparative study of dichlorodiphenyldichloroethylene in blood and semen of two young male populations:
Lack of relationship to infertility, but evidence of high exposure of the mothers. Reprod Toxicol. 2005;20(2):215-220.
34. Jorge Chedrese P, Feyles F. The diverse mechanism of action of dichlorodiphenyldichloroethylene (DDE) and methoxychlor in ovarian cells in vitro. Reprod Toxicol. 2001;15(6):693-698. doi:10.1016/S0890-6238(01)00172-1.
35. Quirós-Alcalá L, Alkon AD, Boyce WT, et al. Maternal prenatal and child organophosphate pesticide exposures and children’s
autonomic function. Neurotoxicology. 2011;32(5):646-655. doi:10.1016/j.neuro.2011.05.017.
36. Beard J. DDT and human health. Sci Total Environ. 2006;355(1-3):78-89. doi:10.1016/j.scitotenv.2005.02.022.
37. Agency for Toxic Substances and Disease Registry. Toxicological Profile: Hexachlorobenzene. Toxic Substances Portal. http://www.atsdr.cdc.gov/toxprofiles/tp.asp?id=627&tid=115. Published 2013. Accessed August 21, 2018.
38. Harrad S, Diamond M. New Directions: Exposure to polybrominated diphenyl ethers (PBDEs) and polychlorinated biphenyls (PCBs):
Current and future scenarios. Atmos Environ. 2006;40(6):1187-1188. doi:10.1016/j.atmosenv.2005.10.006.
39. Schecter A, Papke O, Harris T, et al. Polybrominated Diphenyl Ether (PBDE) Levels in an Expanded Market Basket Survey of U.S. Food
and Estimated PBDE Dietary Intake by Age and Sex. Environ Health Perspect. 2006;114(10):1515-1520.
40. Hooper K, McDonald TA. The PBDEs: an emerging environmental challenge and another reason for breast-milk monitoring programs. Environ Health Perspect. 2000;108(5):387-392.
41. McDonald TA. A perspective on the potential health risks of PBDEs. Chemosphere. 2002;46(5):745-755. doi:10.1016/S0045-
6535(01)00239-9.
42. Agency for Toxic Substances and Disease Registry. Polybrominated Diphenyl Ethers (PBDEs). Toxic Substances Portal. http://www.atsdr.cdc.gov/toxfaqs/tf.asp?id=900&tid=183. Published 2004. Accessed October 21, 2018.
43. Kantiani L, Llorca M, Sanchís J, Farré M, Barceló D. Emerging food contaminants: a review. Anal Bioanal Chem. 2010;398(6):2413-
2427. doi:10.1007/s00216-010-3944-9.
44. Giesy JP, Kannan K. Peer Reviewed: Perfluorochemical Surfactants in the Environment. Environ Sci Technol. 2002;36(7):146A-152A.
doi:10.1021/es022253t.

75
45. Apelberg BJ, Goldman LR, Calafat AM, et al. Determinants of Fetal Exposure to Polyfluoroalkyl Compounds in Baltimore, Maryland. Environ Sci Technol. 2007;41(11):3891-3897. doi:10.1021/es0700911.
46. Butenhoff JL, Kennedy GL, Frame SR, O’Connor JC, York RG. The reproductive toxicology of ammonium perfluorooctanoate (APFO) in
the rat. Toxicology. 2004;196(1-2):95-116. doi:10.1016/j.tox.2003.11.005.
47. Lau C, Butenhoff JL, Rogers JM. The developmental toxicity of perfluoroalkyl acids and their derivatives. Toxicol Appl Pharmacol. 2004;198(2):231-241. doi:10.1016/j.taap.2003.11.031.
48. Apelberg BJ, Witter FR, Herbstman JB, et al. Cord Serum Concentrations of Perfluorooctane Sulfonate ( PFOS ) and Perfluorooctanoate
( PFOA ) in Relation to Weight and Size at Birth. Environ Health Perspect. 2007;115(11):1670-1676. doi:10.1289/ehp.10334.
49. Fei C, Mclaughlin JK, Tarone RE, Olsen J. Perfluorinated Chemicals and Fetal Growth : A Study within the Danish National Birth Cohort. Environ Health Perspect. 2007;115(11):1677-1682. doi:10.1289/ehp.10506.
50. Health Canada. Fourth Report on Human Biomonitoring of Environmental Chemicals in Canada. 2017.
https://www.canada.ca/en/health-canada/services/environmental-workplace-health/reports-publications/environmental- contaminants/fourth-report-human-biomonitoring-environmental-chemicals-canada.html
51. Kang J-H, Kondo F, Katayama Y. Human exposure to bisphenol A. Toxicology. 2006;226(2-3):79-89. doi:10.1016/j.tox.2006.06.009.
52. Coors A, Jones PD, Giesy JP, Ratte HT. Removal of Estrogenic Activity from Municipal Waste Landfill Leachate Assessed with a Bioassay
Based on Reporter Gene Expression. Environ. Sci. Technol., 2003, 37 (15), pp 3430–3434
53. Schonfelder G, Wittfoht W, Hopp H, Talsness CE, Paul M, Chahoud I. Parent bisphenol A accumulation in the human maternal-fetal- placental unit. (Children’s Health Articles). Environ Health Perspect. 2002;110(11):A703.
54. Sun Y, Irie M, Kishikawa N, Wada M, Kuroda N, Nakashima K. Determination of bisphenol A in human breast milk by HPLC with
column-switching and fluorescence detection. Biomed Chromatogr. 2004;18(8):501-507. doi:10.1002/bmc.345.
55. Rochester JR. Bisphenol A and human health: a review of the literature. Reprod Toxicol. 2013;42:132-155. doi:10.1016/j.reprotox.2013.08.008.
56. Aris A. Estimation of bisphenol A (BPA) concentrations in pregnant women, fetuses and nonpregnant women in Eastern Townships of
Canada. Reprod Toxicol. 2014;45:8-13. doi:10.1016/j.reprotox.2013.12.006.
57. Calafat AM, Reidy JA, Needham LL. Exposure of the U.S. Population to Bisphenol A and 4-tertiary-Octylphenol: 2003-2004. Environ Health Perspect. 2008;116(1):39-44.
58. He D, Ye X, Xiao Y, et al. Dietary exposure to endocrine disrupting chemicals in metropolitan population from China: A risk assessment
based on probabilistic approach. Chemosphere. 2015. doi:10.1016/j.chemosphere.2015.05.036.
59. Miller JP Van, Staples CA. Review of the Potential Environmental and Human Health–Related Hazards and Risks from Long-Term Exposure to p-tert-Octylphenol. Hum Ecol Risk Assess An Int J. 2005;11(2):319-351. doi:10.1080/10807030590925812.
60. Sprague BL, Trentham-Dietz A, Hedman CJ, et al. Circulating serum xenoestrogens and mammographic breast density. Breast Cancer
Res. 2013;15(3):R45. doi:10.1186/bcr3432.
61. Li L-X, Chen L, Meng X-Z, et al. Exposure Levels of Environmental Endocrine Disruptors in Mother-Newborn Pairs in China and Their
Placental Transfer Characteristics. PLoS One. 2013;8(5):e62526. doi:10.1371/journal.pone.0062526.
62. Health Canada. Human Health Risk Assessment of Mercury in Fish and Health Benefits of Fish Consumption.; 2007. http://www.hc- sc.gc.ca/fn-an/pubs/mercur/merc_fish_poisson-eng.php. Accessed August 27, 2015.
63. Agency for Toxic Substances and Disease Registry. Mercury. ToxFAQsTM. http://www.atsdr.cdc.gov/toxfaqs/TF.asp?id=113&tid=24.
Published 2015. Accessed October 15, 2018.
64. Karagas MR, Choi AL, Oken E, et al. Evidence on the Human Health Effects of Low-Level Methylmercury Exposure. Environ Health Perspect. 2012;120(6):799-806. doi:10.2307/41549074.
65. Chan L, Receveur O, Batal M, Sadik T, Schwartz H, Ing A, Fediuk K, Tikhonov C. First Nation Food, Nutrition and Environment Study
(FNFNES): Results from Saskatchewan (2015). Ottawa: University of Ottawa, 2018 http://www.fnfnes.ca/docs/Saskatchewan_Report_Aug_8_2018.pdf. Accessed March 15, 2019.
66. Mahaffey KR. Fish and shellfish as dietary sources of methylmercury and the omega-3 fatty acids, eicosahexaenoic acid and

76
docosahexaenoic acid: risks and benefits. Environ Res. 2004;95(3):414-428. doi:10.1016/j.envres.2004.02.006.
67. Saskatchewan Ministry of Health. Health Benefits of Eating Fish and Minimizing Mercury Concerns Fact Sheet. 2017: http://publications.saskatchewan.ca/#/products/91659. Accessed March 20, 2019.
68. Health Canada. Mercury in Fish: Consumption Advice: Making Informed Decisions about Fish. March 2007. http://www.hc-sc.gc.ca/fn-
an/securit/chem-chim/environ/mercur/cons-adv-etud-eng.php. Accessed August 27, 2018.
69. Government of Saskatchewan. Mercury in Saskatchewan Fish: Guidelines for Consumption. http://www.environment.gov.sk.ca/adx/aspx/adxGetMedia.aspx?DocID=90437caa-287b-4fa1-9217- 8f5e5de1ad34&MediaID=bd109399-a270-4cfa-8cbc-d67f273ef6bf&Filename=2011+Mercury+in+Fish+Guidelines.pdf&l=English. Published 2014. Accessed March 20, 2019.
70. Centers for Disease Control and Prevention. Phthalates. Chemical Factsheet.
https://www.cdc.gov/biomonitoring/Phthalates_FactSheet.html. Accessed September 1, 2018.
71. Crinnion WJBT-AMR. Toxic effects of the easily avoidable phthalates and parabens. Alternative Medicine Review 2010;15(3):190+. http://go.galegroup.com.cyber.usask.ca/ps/i.do?id=GALE%7CA239916603&v=2.1&u=usaskmain&it=r&p=EAIM&sw=w&asid=b838b04 84fef5beffd1905e6177a3113.
72. Toxicity and Exposure Assessment for Children’s Health (TEACH). Phthalates. TEACH Chemical Summary.
doi:10.5565/PUBLMAT_Introduction.
73. Health Canada. Safety of Cosmetic Ingredients. April 2014. http://www.hc-sc.gc.ca/cps-spc/cosmet-person/labelling- etiquetage/ingredients-eng.php#a4.7. Accessed October 1, 2018.
74. U.S. Food and Drug Administration. Parabens in Cosmetics. February 22, 2018.
https://www.fda.gov/Cosmetics/ProductsIngredients/Ingredients/ucm128042.htm#What_are_parabens. Accessed September 1, 2018.
75. Agency for Toxic Substances and Disease Registry. Toxicological Profile: Aluminum. Toxic Substances Portal.
http://www.atsdr.cdc.gov/toxprofiles/tp.asp?id=191&tid=34. Published 2008. Accessed September 29, 2015.
76. Riihimäki V, Aitio A. Occupational exposure to aluminum and its biomonitoring in perspective. Crit Rev Toxicol. 2012;42(10):827-853. doi:10.3109/10408444.2012.725027.
77. Agency for Toxic Substances and Disease Registry. Toxicological Profile: Antimony. Toxic Substances Portal.
http://www.atsdr.cdc.gov/toxprofiles/tp.asp?id=332&tid=58. Published 1992. Accessed September 29, 2015.
78. Food Inspection Agency of Canada. Antimony in Juice and Bottled Water. Food Safety Action Plan REPORT 2010-2011 Targeted Surveys Chemistry.; 2011. http://inspection.gc.ca/food/chemical-residues-microbiology/chemical-residues/2010-2011- antimony/eng/1395942519416/1395942520431. Accessed online March 20, 2019.
79. Centers for Disease Control and Prevention. Antimony. Biomonitoring Summaries.
http://www.cdc.gov/biomonitoring/Antimony_BiomonitoringSummary.html. Published 2013. Accessed March 20, 2019.
80. Agency for Toxic Substances and Disease Registry. Toxicological Profile: Arsenic. Toxic Substances Portal. http://www.atsdr.cdc.gov/toxprofiles/tp.asp?id=22&tid=3. Published 2007. Accessed March 20, 2019.
81. Centers for Disease Control and Prevention. Arsenic. Biomonitoring Summaries.
http://www.cdc.gov/biomonitoring/Arsenic_BiomonitoringSummary.html. Published 2014. Accessed March 20, 2019.
82. Health Canada. Canadian Total Diet Study. Concentration of contaminants and other chemicals in food composites. https://www.canada.ca/en/health-canada/services/food-nutrition/food-nutrition-surveillance/canadian-total-diet- study/concentration-contaminants-other-chemicals-food-composites.html#a10. Published 2016. Accessed March 20, 2019.
83. Krivan V, Schneider G, Baumann H, Reus U. Multi-element characterization of tobacco smoke condensate. Fresenius J Anal Chem.
1994;348(3):218-225. doi:10.1007/BF00325364.
84. Health Canada. Arsenic - Chemical Contaminants - Food Safety. March 2008. http://www.hc-sc.gc.ca/fn-an/securit/chem- chim/environ/arsenic-eng.php. Accessed September 30, 2015.
85. Health Canada. Barium [Technical Document - Chemical/Physical Parameters].; 1997. http://www.hc-sc.gc.ca/ewh-semt/pubs/water-

77
eau/barium-baryum/index-eng.php. Accessed September 30, 2018.
86. Agency for Toxic Substances and Disease Registry. Toxicological Profile: Barium. Toxic Substances Portal. http://www.atsdr.cdc.gov/toxprofiles/tp.asp?id=327&tid=57. Published 2007. Accessed March 25, 2019.
87. Canadian Council of Ministers of the Environment. Barium. Canadian Soil Quality Guidelines for the Protection of Environmental and
Human Health. 2013. http://ceqg-rcqe.ccme.ca/download/en/258. Accessed March 25, 2019.
88. Health Canada. Cadmium - Technical document - Chemical/Physical Parameters. August 1986. http://www.hc-sc.gc.ca/ewh- semt/pubs/water-eau/cadmium/index-eng.php. Accessed March 25, 2019.
89. Agency for Toxic Substances and Disease Registry. Toxicological Profile: Cadmium. Toxic Substances Portal.
http://www.atsdr.cdc.gov/toxprofiles/tp.asp?id=48&tid=15. Published 2012. Accessed March 25, 2019.
90. Health Canada. Second Report on Human Biomonitoring of Environmental Chemicals in Canada.; 2013. http://hc-sc.gc.ca/ewh- semt/pubs/contaminants/chms-ecms-cycle2/index-eng.php. Accessed August 4, 2015.
91. Irvine J, Quinn B. Northern Saskatchewan Health Indicators Report 2011. LaRonge, SK; 2011.
http://www.populationhealthunit.ca/media/Northern Saskatchewan Health Indicator Report 2011.pdf.
92. Charania N a., Tsuji LJS, Martin ID, et al. An examination of traditional foods and cigarette smoking as cadmium sources among the nine First Nations of Eeyou Istchee, northern Quebec, Canada. Environ Sci Process Impacts. 2014;16(6):1422-1433. doi:10.1039/c4em00064a.
93. Cole DC, Kearney JP. Blood cadmium, game consumption and tobacco smoking in southern Ontario anglers and hunters. Can J Public
Health. 1997;88(1):44-46.
94. Thomas P, Irvine J, Lyster J, Beaulieu R. Radionuclides and trace metals in Canadian moose near uranium mines: comparison of radiation doses and food chain transfer with cattle and caribou. Health Phys. 2005;88(5):423-438.
95. Population Health Unit. Moose: a safe choice in traditional food. Spec Suppl to Oppor North. 2005.
96. Glooschenko V, Downes C, Frank R, Braun HE, Addison EM, Hickie J. Cadmium levels in Ontario moose and deer in relation to soil
sensitivity to acid precipitation. Sci Total Environ. 1988;71(2):173-186.
97. Gamberg M, Palmer M, Roach P. Temporal and geographic trends in trace element concentrations in moose from Yukon, Canada. Sci
Total Environ. 2005;351-352:530-538. doi:10.1016/j.scitotenv.2004.05.033.
98. Jin A, Joseph-Quinn KM. Consumption guideline for cadmium in moose meat in northern British Columbia, Canada. Int J Circumpolar Health. 2004;63 Suppl 2:169-173.
99. Crichton V, Paquet P. Cadmium in Manitoba’s wildlife. Alces. 2000;36:205-216.
100. Arnold SM, Zarnke RL, Lynn T V, Chimonas M-AR, Frank A. Public health evaluation of cadmium concentrations in liver and kidney of
moose (Alces alces) from four areas of Alaska. Sci Total Environ. 2006;357(1-3):103-111. doi:10.1016/j.scitotenv.2005.02.040.
101. Agency for Toxic Substances and Disease Registry. Toxicological Profile: Cesium. Toxic Substances Portal.
http://www.atsdr.cdc.gov/toxprofiles/tp.asp?id=578&tid=107. Published 2004. Accessed September 30, 2015.
102. Government of Manitoba, Department of Growth, Enterprise and Trade. Industrial Minerals: Commodity Summaries: Pollucite
(cesium). Accessed online: https://www.gov.mb.ca/iem/geo/industrial/pollucite.html
103. Larter NC, Macdonald CR, Elkin BT, et al. Cadmium and other elements in tissues from four ungulate species from the Mackenzie
Mountain region of the Northwest Territories, Canada. Ecotoxicol Environ Saf. 2016;132:9-17. doi:10.1016/j.ecoenv.2016.05.018.
104. Irvine J. Personal Communication.
105. Health Canada. Health Canada Warns Canadians of Cardiac Risks Associated with Cesium Chloride. Recalls & alerts.
http://www.healthycanadians.gc.ca/recall-alert-rappel-avis/hc-sc/2009/13329a-eng.php. Published 2009.
106. Melnikov P, Zanoni LZ. Clinical effects of cesium intake. Biol Trace Elem Res. 2010;135(1-3):1-9. doi:10.1007/s12011-009-8486-7.
107. Health Canada. Chromium [Technical Document - Chemical/Physical Parameters].; 2005. http://www.hc-sc.gc.ca/ewh-
semt/pubs/water-eau/chromium-chrome/index-eng.php. Accessed September 30, 2015.
78
108. Canadian Council of Ministers of the Environment. Chromium. Canadian Water Quality Guidelines for the Protection of Aquatic Life. Accessed online: http://ceqg-rcqe.ccme.ca/download/en/165
109. Agency for Toxic Substances and Disease Registry. Toxicological Profile: Chromium. Toxic Substances Portal.
http://www.atsdr.cdc.gov/toxprofiles/tp.asp?id=62&tid=17. Published 2012. Accessed September 30, 2015.
110. Fawell JK, Lund U. Chromium in Drinking-water. Heal criteria other Support information, World Heal Organ. 1996;2:1-13.
111. Ziaee H, Daniel J, Datta AK, Blunt S, Mcminn DJW. Transplacental transfer of cobalt and chromium in patients with metal-on-metal hip arthroplasty: a controlled study. J Bone Joint Surg Br. 2007;89(3):301.
112. Centers for Disease Control and Prevention. Lead. Biomonitoring Summaries.
http://www.cdc.gov/biomonitoring/Lead_BiomonitoringSummary.html. Published 2013. Accessed March 25, 2019.
113. Agency for Toxic Substances and Disease Registry. Toxicological Profile: Lead. Toxic Substances Portal. http://www.atsdr.cdc.gov/toxprofiles/tp.asp?id=96&tid=22. Published 2007. Accessed March 25, 2019.
114. Health Canada. Lead Information Package. http://www.hc-sc.gc.ca/ewh-semt/contaminants/lead-plomb/asked_questions-
questions_posees-eng.php. Published May 19, 2004. Accessed March 25, 2019.
115. Richter P a, Bishop EE, Wang J, Kaufmann R. Trends in tobacco smoke exposure and blood lead levels among youths and adults in the United States: the National Health and Nutrition Examination Survey, 1999-2008. Prev Chronic Dis. 2013;10:E213. doi:10.5888/pcd10.130056.
116. Couture A, Levesque B, Dewailly É, Muckle G, Déry S, Proulx J-F. Lead exposure in Nunavik: from research to action. Int J Circumpolar
Health. 2012;71(0):1-7. doi:10.3402/ijch.v71i0.18591.
117. Chan L, Receveru O, Sharp D, Schwart H, Ing A, Tikhonov C. First Nations Food, Nutrition and Environment Study: Results from British Columbia (2008/2009). 2011. http://www.fnfnes.ca/docs/FNFNES_Report_BC_FINAL_PRINT_v2-lo.pdf. Accessed March 25, 2019.
118. Chan L, Receveur O, Batal M, et al. First Nations Food, Nutrition & Environment Study (FNFNES): Results from Ontario (2011/2012).
2014. http://www.fnfnes.ca/docs/FNFNES_Ontario_Regional_Report_2014_final.pdf. Accessed March 25, 2019.
119. Chan L, Receveur O, Batal M, et al. First Nations Food, Nutrition & Environment Study (FNFNES): Results from Alberta 2013. 2016. http://www.fnfnes.ca/docs/FNFNESReport-ALBERTA_June_30_2016.pdf. Accessed March 25, 2019.
120. Chan L, Receveur O, Sharp D, Schwartz H, Tikhonov C. First Nations Food, Nutrition and Environment Study (FNFNES) : Results from
Manitoba (2010). 2012. http://www.fnfnes.ca/docs/MB%20Reports/FNFNES%20Report-MB_WEB_rev.pdf. Accessed March 25, 2019.
121. Tsuji L, Wainman B, Martin I, et al. Elevated Blood-lead Levels in First Nation People of Northern Ontario Canada: Policy Implications. Bull Environ Contam Toxicol. 2008;80(1):14-18. doi:10.1007/s00128-007-9281-9.
122. Tsuji LJS, Wainman BC, Martin ID, et al. Lead shot contribution to blood lead of First Nations people: The use of lead isotopes to
identify the source of exposure. Sci Total Environ. 2008;405(1):180-185. doi:10.1016/j.scitotenv.2008.06.048.
123. Agency for Toxic Substances and Disease Registry. Toxicological Profile: Mercury. Toxic Substances Portal. http://www.atsdr.cdc.gov/toxprofiles/tp.asp?id=115&tid=24. Published 1999. Accessed March 25, 2019.
124. Environment Canada. Mercury and the Environment - About Mercury - Pollution and Waste. Major Pollutants.
http://www.ec.gc.ca/mercure-mercury/default.asp?lang=En&n=D64997D2-1. Published 2009. Accessed March 25, 2019.
125. Centers for Disease Control and Prevention. Mercury. Biomonitoring Summaries.
https://www.cdc.gov/biomonitoring/Mercury_BiomonitoringSummary.html. Last updated 2016. Accessed March 25, 2019.
126. Butler Walker J, Houseman J, Seddon L, et al. Maternal and umbilical cord blood levels of mercury, lead, cadmium, and essential trace elements in Arctic Canada. Environ Res. 2006;100(3):295-318. doi:10.1016/j.envres.2005.05.006.
127. Agency for Toxic Substances and Disease Registry. Toxicological Profile: Strontium. Toxic Substances Portal.
http://www.atsdr.cdc.gov/toxprofiles/tp.asp?id=656&tid=120. Published 2004. Accessed March 25, 2019.
128. Rodrigues JL, Batista BL, Nunes J a., Passos CJS, Barbosa F. Evaluation of the use of human hair for biomonitoring the deficiency of
essential and exposure to toxic elements. Sci Total Environ. 2008;405(1-3):370-376. doi:10.1016/j.scitotenv.2008.06.002.

79
129. Zheng G, Wang LL, Guo Z, et al. Association of Serum Heavy Metals and Trace Element Concentrations with Reproductive Hormone Levels and Polycystic Ovary Syndrome in a Chinese Population. Biol Trace Elem Res. 2015;167(1):1-10.
130. Centers for Disease Control and Prevention. Uranium. Biomonitoring Summaries.
https://www.cdc.gov/biomonitoring/Uranium_BiomonitoringSummary.html. Published 2013. Last updated Dec 23, 2016. Accessed March 25, 2019.
131. Government of Canada. Natural Resources Canada. About Uranium. http://www.nrcan.gc.ca/energy/uranium-nuclear/7695.
Published 2014. Accessed March 25, 2019.
132. Agency for Toxic Substances and Disease Registry. Toxicological Profile: Uranium. Toxic Substances Portal. http://www.atsdr.cdc.gov/toxprofiles/tp.asp?id=440&tid=77. Published 2015. Accessed March 25, 2019.
133. Agency for Toxic Substances and Disease Registry. Toxicological Profile: Boron. Toxic Substances Portal.
http://www.atsdr.cdc.gov/toxprofiles/tp.asp?id=453&tid=80. Accessed March 25, 2019.
134. Government of Canada. Canadian Drinking Water Quality Guidelines - Boron. Published 1991. https://www.canada.ca/en/health- canada/services/publications/healthy-living/guidelines-canadian-drinking-water-quality-guideline-technical-document-boron.html. Accessed March 25, 2019.
135. Government of Canada. Boron as a Medicinal Ingredient in Oral Natural Health Products.; 2007. https://www.canada.ca/en/health-
canada/services/drugs-health-products/reports-publications/natural-health-products/boron-medicinal-ingredient-oral-natural- health-products-natural-health-products-directorate-heath-canada-2007.html. Accessed March 25, 2019.
136. Agency for Toxic Substances and Disease Registry. Toxicological Profile: Cobalt. Toxic Substances Portal.
http://www.atsdr.cdc.gov/toxprofiles/tp.asp?id=373&tid=64. Published 2004. Accessed October 1, 2015.
137. Government of Canada. Canadian Drinking Water Quality Guidelines - Copper. https://www.canada.ca/en/health- canada/services/publications/healthy-living/guidelines-canadian-drinking-water-quality-guideline-technical-document-copper.html . Published 1992. Accessed March 25, 2019.
138. Canadian Council of Ministers of the Environment. Copper. Canadian Soil Quality Guidelines for the Protection of Environmental and
Human Health. Published 1999. http://ceqg-rcqe.ccme.ca/download/en/263. Accessed March 25, 2019.
139. Agency for Toxic Substances and Disease Registry. Toxicological Profile: Copper. Toxic Substances Portal. http://www.atsdr.cdc.gov/toxprofiles/tp.asp?id=206&tid=37. Published 2004. Accessed March 25, 2019.
140. Health Canada. Prenatal Nutrition Guidelines for Health Professionals.; 2010. http://www.hc-sc.gc.ca/fn-an/alt_formats/hpfb-
dgpsa/pdf/pubs/iron-fer-eng.pdf.
141. Bateman DN. Iron. Medicine (Baltimore). 2007;35(12):624-625. doi:10.1016/j.mpmed.2007.09.003.
142. Agency for Toxic Substances and Disease Registry. ATSDR - Toxicological Profile: Manganese. Toxic Substances Portal. http://www.atsdr.cdc.gov/toxprofiles/tp.asp?id=102&tid=23. Published 2012. Accessed October 1, 2015.
143. Government of Canada. Canadian Drinking Water Quality Guidelines - Magnesium. https://www.canada.ca/en/health-
canada/services/publications/healthy-living/guidelines-canadian-drinking-water-quality-supporting-documents-magnesium.html Published 1978. Accessed March 25, 2019.
144. Institute of Medicine. Magnesium. In: Dietary Reference Intakes for Calcium, Phosphorus, Magnesium, Vitamin D, and Fluoride. Unites
States of America: National Academy of Sciences. http://www.nap.edu/read/5776/chapter/8#190. Accessed March 25, 2019.
145. Canadian Council of Ministers of the Environment. Molybdenum. Canadian Water Quality Guidelines for the Protection of Aquatic Life. Published 1999. http://ceqg-rcqe.ccme.ca/download/en/195. Accessed March 25, 2019.
146. Centers for Disease Control and Prevention. Molybdemum. Biomonitoring Summaries.
https://www.cdc.gov/biomonitoring/Molybdenum_BiomonitoringSummary.html. Published 2013. Accessed March 25, 2019.
147. Agency for Toxic Substances and Disease Registry. Toxicological Profile: Nickel. Toxic Substances Portal. http://www.atsdr.cdc.gov/toxprofiles/tp.asp?id=245&tid=44. Published 2005. Accessed March 25, 2019.
148. Agency for Toxic Substances and Disease Registry. Toxicological Profile: Selenium. Toxic Substances Portal.
http://www.atsdr.cdc.gov/toxprofiles/tp.asp?id=153&tid=28. Published 2003. Accessed March 25, 2019.
149. Government of Canada. Risk Management Scope for Selenium and Its Compounds under the Selenium-Containing Substance

80
Grouping; Environment and Climate Change Canada, Health Canada, 2017. https://www.canada.ca/content/dam/eccc/documents/pdf/pded/selenium- rma/English%20Risk%20Management%20Approach%20for%20Selenium%20and%20its%20Compounds%20under%20the%20Seleniu m-containing%20Substance%20Grouping.pdf. Accessed March 25, 2019.
150. Agency for Toxic Substances and Disease Registry. Toxicological Profile: Zinc. Toxic Substances Portal.
http://www.atsdr.cdc.gov/PHS/PHS.asp?id=300&tid=54. Published 2005. Accessed March 25, 2019.
151. Institute of Medicine. Zinc. In: Dietary Reference Intakes for Vitamin A, Vitamin K, Arsenic, Boron, Chromium, Copper, Iodine, Iron, Manganese, Molybdenum, Nickel, Silicon, Vanadium, and Zinc. The National Academies Press; 2001. http://www.nap.edu/catalog/10026/dietary-reference-intakes-for-vitamin-a-vitamin-k-arsenic-boron-chromium-copper-iodine-iron- manganese-molybdenum-nickel-silicon-vanadium-and-zinc. Accessed March 25, 2019.
152. Darnton-Hill I. Zinc supplementation during pregnancy - biological, behavioural and contextual rationale. e-Library Evid Nutrtional
Actions. 2013. http://www.who.int/elena/bbc/zinc_pregnancy/en/. Accessed March 25, 2019.
153. Government of Canada. Human Biomonitoring of Environmental Chemicals. August 2010. http://www.hc-sc.gc.ca/ewh- semt/contaminants/human-humaine/index-eng.php. Accessed March 25, 2019.
154. Centers for Disease Control and Prevention. National Biomonitoring Program - State Biomonitoring Grants.
http://www.cdc.gov/biomonitoring/state_grants.html. Published 2014. Accessed August 11, 2015.
155. Schindler BK, Esteban M, Koch HM, et al. The European COPHES/DEMOCOPHES project: Towards transnational comparability and reliability of human biomonitoring results. Int J Hyg Environ Health. 2014;217(6):653-661. doi:10.1016/j.ijheh.2013.12.002.
156. Alwan A. Global Status Report on Noncommunicable Diseases.; 2011. doi:978 92 4 156422 9.
157. Rehm J, Baliunas D, Brochu S. The Costs of Substance Abuse in Canada 2002: Highlights. Ottawa, ON: Canadian Centre on Substance
Abuse; 2006.
158. Rodgman A, Perfetti TA. The Chemical Components of Tobacco and Tobacco Smoke. 2nd ed. (Perfetti 1952- TA, ed.). Boca Raton: Boca Raton : CRC Press; 2013.
159. Reid JL, Hammond D, Rynard VL, Madill CL, Burkhalter R. Tobacco Use in Canada: Patterns and Trends, 2017 Edition. Waterloo, ON:
Propel Centre for Population Health Impact, University of Waterloo.
160. Saskatchewan Ministry of Education Early Childhood Development and Integrated Services. 2011.
161. Government of Canada. Federal Regulations - Tobacco Legislation. https://www.canada.ca/en/health-canada/services/health-
concerns/tobacco/legislation/federal-regulations.html. Published August 9, 2011. Accessed March 25, 2019.
162. Public Health Agency of Canada. Social Determinants of Health. Canadian Best Practices Portal. http://cbpp-pcpe.phac- aspc.gc.ca/public-health-topics/social-determinants-of-health/. Published July 28, 2015. Accessed March 25, 2019.
163. World Health Organization. Social Determinants of Health: The Solid Facts. Vol 2. 2nd ed. (Wilkinson R, Marmot M, eds.). Denmark:
World Health Organization; 2003. doi:10.1016/j.jana.2012.03.001.
164. Donaldson SG, Van Oostdam J, Tikhonov C, et al. Environmental contaminants and human health in the Canadian Arctic. Sci Total Environ. 2010;408(22):5165-5234. doi:10.1016/j.scitotenv.2010.04.059.
165. Kuhnlein H V. Dietary Change and Traditional Food Systems of Indigenous Peoples. Annu Rev Nutr. 1996;16(1):417-442.
doi:10.1146/annurev.nutr.16.1.417.
166. Mayo Clinic Laboratories, Test ID: Serum magnesium. https://www.mayomedicallaboratories.com/test- catalog/Clinical+and+Interpretive/8448

81
Alberta Health provided funding for analytical testing through the operating grant to the Alberta Centre for Toxicology at the University of Calgary.
The Alberta Centre for Toxicology provided analytical services, technical advice and administrative support.
Members of the technical working group provided in-kind technical contributions through study design and planning, and the review and discussion of results and report materials.
The technical report and this summary report were prepared by: Dr. James Irvine Saskatchewan Ministry of Health & SK Health Authority Megan Reichert Alberta Health Briana Yee Saskatchewan Ministry of Health (summer student) Dr. Jasmine Hasselbach Public Health & Preventive Medicine Resident, SK Ministry of Health
With contributions from:
Technical Working Group: Tim Macaulay Saskatchewan Ministry of Health Dr. Jennifer Graydon Alberta Health Dr. Valerie Mann Saskatchewan Ministry of Health
Nicole Maserek Saskatchewan Ministry of Health Fred Ackah Alberta Health Dr. Weiping Zhang Alberta Health Dr. David Kinniburgh Alberta Centre for Toxicology
Dr. Amy MacDonald Alberta Centre for Toxicology Maureen Anderson Public Health Agency of Canada Placement – SK Ministry of Health Haoer Ying Saskatchewan Ministry of Health (summer student) Sheila Kelly Saskatchewan Ministry of Health
Other contributors: Penni Edwards Alberta Centre for Toxicology
Patricia Parmentier Alberta Centre for Toxicology Xu Zhang Alberta Centre for Toxicology Dr. Stephan Gabos Environmental Health Consultant, University of Alberta Dr. Don Schopflocher Consultant Sylvia Tiu Contractor, Alberta Centre for Toxicology Dr. Greg Horsman Roy Romanow Provincial Laboratory Dr. Paul Levitt Roy Romanow Provincial Laboratory Jim Putz Roy Romanow Provincial Laboratory
Special thanks for valuable editorial comments: Rolf Puchtinger Saskatchewan Ministry of Health
Also special thanks to those providing support: Dr. Kevin McCullum Saskatchewan Ministry of Environment Dr. Ibrahim Khan & Tim Bonish First Nations Inuit Health Branch, Indigenous Services Canada Brenda Ziegler & Dr. Nnamdi Ndubuka Northern Intertribal Health Authority Cindy Rogers Saskatchewan Ministry of Health
ACKNOWLEDGEMENTS