notes to the financial statements - investis...
TRANSCRIPT

1. GENERAL INFORMATIONBig Yellow Group PLC is a Company incorporated in the United Kingdom under the Companies Act 2006. The address of the registered office is 2 The Deans,Bridge Road, Bagshot, Surrey, GU19 5AT. The nature of the Group’s operations and its principal activities are set out in note 4 and in the Strategic Reporton pages 16 to 28.
2. SIGNIFICANT ACCOUNTING POLICIESBasis of preparation of financial statementsThe financial statements have been prepared in accordance with International Financial Reporting Standards (“IFRS”) as adopted for use in the EuropeanUnion in accordance with EU law (IAS regulation EC1606/2002) and those parts of the Companies Act 2006 applicable to companies reporting under IFRS,and therefore the Group financial statements comply with Article 4 of the EU IAS Regulation.
The financial statements are presented in Sterling, being the currency of the primary economic environment in which the Group operates. Unless otherwisestated, figures are rounded to the nearest thousand.
The accounting policies adopted are consistent with those of the previous financial year, except as described in the following sections.
Amendments to IFRSs that are mandatorily effective for the current yearIn the current year, the Group has applied a number of amendments to IFRSs issued by the International Accounting Standards Board (IASB). Their adoptionhas not had any material impact on the disclosures or on the amounts reported in these financial statements.
Amendments to IAS 7 Statement of Cash FlowAmendments to IAS 12 Income TaxesIFRS 12 Disclosure of interests in other entities
New and revised IFRSs in issue but not yet effectiveAt the date of authorisation of these financial statements, the Group has not applied the following new and revised IFRSs that have been issued but arenot yet effective:
IFRS 9 Financial InstrumentsIFRS 15 Revenue from Contracts with CustomersIFRS 16 LeasesIFRS 2 (amendments) Classification and Measurement of Share-based Payment TransactionsIAS 7 (amendments) Disclosure InitiativeIAS 12 (amendments) Recognition of Deferred Tax Assets for Unrealised LossesIFRS 10 and IAS 28 (amendments) Sale or Contribution of Assets between an Investor and its Associate or Joint Venture
None of these standards not yet effective are expected to have a significant impact on the Financial Statements of the Group or Company. Certain Standardswhich might have an impact are discussed below.
IFRS 9 – Financial InstrumentsIFRS 9 covers the classification, measurement and derecognition of financial assets and liabilities. It also introduces a new impairment model for financialassets and new rules for hedge accounting. The standard is applicable for financial years commencing on or after 1 January 2018, and hence the yearending 31 March 2019 will be the first applicable year for the Group.
There will be no impact on the Group’s accounting for financial liabilities, as the new requirements only affect the accounting for financial liabilities thatare designated at fair value through the income statement and the Group does not have any such liabilities.
The impairment model under IFRS 9 requires the recognition of impairment provisions based on expected credit losses (“ECL”) rather than only incurredcredit losses as is the case under IAS 39. The significant financial assets held by the Group that will be impacted by the impairment losses recognisedunder IFRS 9 are trade receivables.
Trade receivables in the balance sheet at 31 March 2018 were £3.7 million with an impairment provision recognised under IAS 39 of £0.01 million. Asdescribed in note 16, the Group’s exposure to credit risk is low. The Directors have assessed the impact of impairment losses recognised for tradereceivables under IFRS 9 at 31 March 2018 based on actual losses experienced over the past five years. Following this assessment, the impact andvolatility on impairment losses recognised under IFRS 9 is estimated to be immaterial.
The Company holds intercompany loan and receivables balances with the subsidiaries of the Group as disclosed in Note 31. The Directors do not estimatethere to be a material impact on the Company only Financial Statements from the recognition of impairment provisions for the loans and receivablesunder IFRS 9 compared to accounting for it held under IAS 39.
The new standard introduces enhanced disclosure requirements and changes in presentation.
Notes to the Financial StatementsYear ended 31 March 2018
100

101
2. SIGNIFICANT ACCOUNTING POLICIES (continued)
IFRS 15 – Revenue RecognitionIFRS 15 replaces IAS 18 and governs the recognition of revenue. The standard is applicable for financial years commencing on or after 1 January 2018,and hence the year ending 31 March 2019 will be the first applicable year for the Group. The standard is based on the principle that revenue is recognisedwhen control of a good or service transfers to a customer.
The Group’s assessment is that IFRS 15 will apply to all its streams of revenue, although it is estimated that there will not be a material change in theamounts and timing of revenue recognised following the adoption of the standard. Each customer license agreement is terminable on seven days’ noticeby the customer at any time and in specific circumstances by the Group. This is an indicator IFRS 16 would not apply. Each licence has a discreteperformance obligation with revenue recognised from day one. The opening offer discount was also assessed under IFRS 15 and the Group has concludedthat the accounting for this will be unchanged following the introduction of IFRS 15 that is to spread it evenly over the period of the opening offer discount.
The standard also introduces enhanced disclosure requirements and changes in presentation.
IFRS 16 – LeasesIFRS 16 results in almost all leases being recognised on the balance sheet for a lessee, as the distinction between operating and finance leases is removed.The standard is applicable for financial years commencing on or after 1 January 2019, and hence the year ending 31 March 2020 will be the first applicableyear for the Group.
Under the standard, an asset, representing the right to use the leased item, and a financial liability to pay rentals are recognised. The only exceptions areshort-term and low-value leases. The new standard changes the allocation of the finance lease payments over the length of the lease, resulting in therental payments paid being more front ended in the income statement. The accounting for lessors will not significantly change.
The Group already classifies its leasehold stores as finance leases. The income statement charge for these leases in the year was £2.1 million. On adoptingIFRS 16, the changes in the way the standard allocates the finance lease payments, would, we estimate, increase the rent charge in the first year ofadoption by £0.3 million to £2.4 million. The Group has a limited number of operating leases, with non-cancellable future lease payments of £1.1 millionat 31 March 2018. These will be brought onto balance sheet on adoption of the standard.
Basis of accountingThe financial statements have been prepared on the historical cost basis, except for the revaluation of investment properties and derivative financialinstruments. Historical cost is generally based on the fair value of the consideration given in exchange for the assets. The principal accounting policiesadopted, which have been applied consistently to the results, other gains and losses, assets, liabilities and cash flows of entities included in theconsolidated financial statements in the current and preceding year, are set out below:
Going concernA review of the Group’s business activities, together with the factors likely to affect its future development, performance and position are set out in theStrategic Report. The financial position of the Group, its cash flows, liquidity position and borrowing facilities are shown in the balance sheet, cash flowstatement and accompanying notes to the financial statements. Further information concerning the Group’s objectives, policies and processes for managingits capital; its financial risk management objectives; details of its financial instruments and hedging activities; and its exposures to credit risk and liquidityrisk can be found in the Strategic Report and in the notes to the financial statements.
After reviewing Group and Company cash balances, borrowing facilities, forecast valuation movements and projected cash flows, the Directors believethat the Group and Company have adequate resources to continue operations for the foreseeable future. In reaching this conclusion the Directors havehad regard to the Group’s operating plan and budget for the year ending 31 March 2019 and projections contained in the longer term business plan whichcovers the period to March 2022. The Directors have carefully considered the Group’s trading performance and cash flows as a result of the uncertainglobal economic environment and the other principal risks to the Group’s performance, and are satisfied with the Group’s positioning. For this reason,they continue to adopt the going concern basis in preparing the financial statements.
Basis of consolidationThe consolidated financial statements incorporate the financial statements of the Company and entities controlled by the Company made up to 31 March eachyear. Control is achieved where the Company has the power to direct the relevant activities of an investee entity so as to obtain benefits from its activities.
The Group consolidates the financial results and balance sheets of Big Yellow Group PLC and all of its subsidiaries at the year end using acquisitionaccounting principles. All intra-group transactions, balances, income and expenses are eliminated on consolidation. Where necessary, adjustments aremade to the financial statements of subsidiaries to bring the accounting policies used into line with those used by the Group. The results of subsidiariesacquired or disposed of during the year are included in the consolidated statement of comprehensive income from the effective date of acquisition or upto the effective date of disposal, as appropriate.
The acquisition of subsidiaries is accounted for using the purchase method. The cost of the acquisition is measured at the aggregate of the fair values, atthe date of exchange, of assets given, liabilities incurred or assumed, and equity instruments issued by the Group in exchange for control of the acquiree.Any costs directly attributable to the business combination are recognised in the income statement. The acquiree’s identifiable assets, liabilities andcontingent liabilities that meet the conditions for recognition under IFRS 3 are recognised at their fair value at the acquisition date, except for non-currentassets (or disposal groups) that are classified as held for sale in accordance with IFRS 5 Non-Current Assets Held for Sale and Discontinued Operations,which are recognised and measured at the lower of their carrying amount and fair value less costs to sell (excluding investment property which ismeasured at fair value).

2. SIGNIFICANT ACCOUNTING POLICIES (continued)
GoodwillGoodwill arising on acquisition is recognised as an asset and initially measured at cost, being the excess of the cost of the business combination overthe Group’s interest in the net fair value of the identifiable assets, liabilities and contingent liabilities recognised. If, after reassessment, the Group’s interestin the net fair value of the acquiree’s identifiable assets, liabilities and contingent liabilities exceeds the cost of the business combination, the excess isrecognised immediately in the statement of comprehensive income. Goodwill is reviewed for impairment at least annually. Any impairment is recognisedimmediately in the statement of comprehensive income and is not subsequently reversed.
Intangible assetsIntangible assets acquired in a business combination and recognised separately from goodwill are initially recognised at their fair value at their acquisitiondate (which is typically regarded as their cost). Subsequent to their initial recognition, intangible assets with indefinite useful lives are carried at costless accumulated impairment losses. Intangible assets with finite useful lives that are acquired separately are carried at cost less accumulatedamortisation and accumulated impairment losses. Amortisation is recognised on a straight line basis over their estimated useful lives. The estimateduseful life and amortisation method are reviewed at the end of each reporting period with the effect of any changes in estimate being accounted for on aprospective basis.
Investment in associatesAn associate is an entity over which the Group is in a position to exercise significant influence, but not control or joint control, through participation in thefinancial and operating policy decisions of the investee. Significant influence is the power to participate in the financial and operating policy decisions ofthe investee but is not control or joint control over those policies.
The results and assets and liabilities of associates are incorporated in these financial statements using the equity method of accounting except whenclassified as held for sale. Investments in associates are carried in the balance sheet at cost as adjusted by post-acquisition changes in the Group’s shareof the net assets of the associate, less any impairment in the value of individual investments. Losses of an associate in excess of the Group’s interest inthat associate (which includes any long-term interests that, in substance, form part of the Group’s net investment in the associate) are recognised onlyto the extent that the Group has incurred legal or constructive obligations or made payments on behalf of the associate. Where necessary, adjustmentsare made to the financial statements of associates to bring the accounting policies used into line with those used by the Group. Where a Group Companytransacts with an associate of the Group, profits and losses are eliminated to the extent of the Group’s interest in the relevant associate. Losses mayprovide evidence of an impairment of the asset transferred in which case appropriate provision is made for impairment.
Revenue recognitionRevenue represents amounts derived from the provision of services which fall within the Group’s ordinary activities after deduction of trade discountsand any applicable value added tax. Self storage income is recognised over the period for which the storage room is occupied by the customer on a straight-line basis. The opening offer discount of 50% off for up to 8 weeks is spread evenly over the term of the discount period.
Other storage related income comprises:
> insurance income which is recognised on a straight line basis over the period a customer occupies their room; and> packing material sales are recognised at the point of sale, as there is no further ongoing performance obligation beyond the point of sale.
The Group recognises non-storage income, which is principally rental income from tenants of properties awaiting development, on a straight-line basisover the period in which it is earned.
Management fees earned are recognised on a straight-line basis over the period for which the services are provided. Fees earned from associates arerecognised in full in the income statement through revenue with the proportionate debit shown in the share of profit of associate.
Operating leasesRentals payable under operating leases are charged to the statement of comprehensive income on a straight-line basis over the term of the relevant lease.In the event that lease incentives are received to enter into operating leases, such incentives are recognised as a liability. The aggregate benefit ofincentives is recognised as a reduction of rental expense on a straight-line basis, except where another systematic basis is more representative of thetime pattern in which economic benefits from the leased asset are consumed.
BorrowingsInterest-bearing loans and overdrafts are measured at fair value, net of direct issue costs. Premiums payable on settlement or redemption and directissue costs are accounted for on an accruals basis in the statement of comprehensive income using the effective interest rate method and are added tothe carrying value amount of the instrument to the extent that they are not settled in the period in which they arise. Borrowings are subsequently heldat amortised cost.
Notes to the Financial Statements (continued)Year ended 31 March 2018
102

103
2. SIGNIFICANT ACCOUNTING POLICIES (continued)
Finance costs and incomeAll borrowing costs are recognised in the statement of comprehensive income in the period in which they are incurred, unless the costs are incurred aspart of the development of a qualifying asset, when they will be capitalised. Commencement of capitalisation is the date when the Group incurs expenditurefor the qualifying asset, incurs borrowing costs and undertakes activities that are necessary to prepare the assets for their intended use when it isprobable that they will result in future economic benefits to the entity and the costs can be measured reliably. In the case of suspension of activitiesduring extended periods, the Group suspends capitalisation. The Group ceases capitalisation of borrowing costs when substantially all of the activitiesnecessary to prepare the asset for use are complete, typically when a store opens.
Interest income is accrued on a time basis, by reference to the principal outstanding and the effective interest rate applicable, which is the rate thatexactly discounts estimated future cash receipts through the expected life of the financial asset to that asset’s net carrying amount.
Debt modificationA change in debt carried at amortised cost that is considered substantial is accounted for as an extinguishment, which means that the original debt isderecognised, with a gain or loss is recorded in the income statement, and a new financial liability recorded based on the new terms. If the change is notconsidered to be substantial (substantial is defined as a change in the net present value of the cash flows of more than 10%), the original debt remainson the books and there is no current income statement impact.
Non-recurring items of income and expenditureNon-recurring items of income and expenditure are recognised on the basis that they are unusual in nature and large in scale.
Operating profitOperating profit is stated after gains and losses on surplus land, movements on the revaluation of investment properties and before the share of resultsof associates, investment income and finance costs.
TaxationThe tax expense represents the sum of the tax currently payable and deferred tax.
The tax currently payable is based on taxable profit for the year. Taxable profit differs from the net profit as reported in the statement of comprehensiveincome because it excludes items of income or expense that are taxable or deductible in other years and it further excludes items that are never taxableor deductible. The Group’s liability for current tax is calculated using tax rates that have been enacted or substantively enacted by the balance sheet date.
Deferred tax is the tax expected to be payable or recoverable on differences between the carrying amounts of assets and liabilities in the financialstatements and the corresponding tax bases used in the computation of taxable profit, and is accounted for using the balance sheet liability method.Deferred tax liabilities are generally recognised for taxable temporary differences and deferred tax assets are recognised to the extent that it is probablethat taxable profits will be available against which deductible temporary differences can be utilised. Such assets and liabilities are not recognised if thetemporary differences arise from goodwill or from the initial recognition (other than in a business combination) of other assets and liabilities in a transactionthat affects neither the tax profit nor the accounting profit.
Deferred tax liabilities are recognised for taxable temporary differences arising on investments in subsidiaries and associates except where the Group isable to control the reversal of the temporary difference and it is probable that the temporary difference will not reverse in the foreseeable future.
The carrying amount of deferred tax assets is reviewed at each balance sheet date and reduced to the extent that it is no longer probable that sufficienttaxable profits will be available to allow all or part of the asset to be recovered.
Deferred tax is calculated at the tax rates substantively enacted at the balance sheet date that are expected to apply in the period when the liability issettled or the asset is realised. Deferred tax is charged or credited in the statement of comprehensive income, except when it relates to items charged orcredited directly to equity, in which case the deferred tax is also dealt with in equity.
Deferred tax assets and liabilities are offset as there is a legally enforceable right to set off current tax assets against current tax liabilities.
Plant, equipment and owner occupied propertyAll property, plant and equipment, not classified as investment property, is carried at historic cost less depreciation and any recognised impairment loss.
Depreciation is charged so as to write off the cost or valuation of assets, other than land and investment properties, less any residual value over theirestimated useful lives, using the straight-line method, on the following bases:
Freehold property 50 yearsLeasehold improvements over period of the leasePlant and machinery 10 yearsMotor vehicles 4 yearsFixtures and fittings 5 yearsComputer equipment 3 to 5 years
The gain or loss arising on the disposal or retirement of an asset is determined as the difference between the sales proceeds and the carrying amount ofthe asset and is recognised in the income statement.

2. SIGNIFICANT ACCOUNTING POLICIES (continued)
Investment propertyThe criteria used to distinguish investment property from owner-occupied property is to consider whether the property is held for rental income and/orfor capital appreciation. Where this is the case, the Group recognises these owned or leased properties as investment properties. Investment property isinitially recognised at cost and revalued at the balance sheet date to fair value as determined by professionally qualified external valuers. In accordancewith IAS 40, investment property held as a leasehold is stated gross of the recognised finance lease liability.
Gains or losses arising from the changes in fair value of investment property are included in the statement of comprehensive income for the period inwhich they arise. In accordance with IAS 40, as the Group uses the fair value model, no depreciation is provided in respect of investment propertiesincluding integral plant.
Leasehold properties that are leased under operating leases are classified as investment properties and included in the balance sheet at fair value. Theobligation to the lessor for the buildings element of the leasehold is included in the balance sheet at the present value of the minimum lease paymentsat inception, and is shown within note 21. Lease payments are apportioned between finance charges and a reduction of the outstanding lease obligationso as to achieve a constant rate of interest on the remaining balance of the liability.
Investment property under constructionInvestment property under construction is initially recognised at cost and revalued at the balance sheet date to fair value as determined by professionallyqualified external valuers.
Gains or losses arising from the changes in fair value of investment property under construction are included in the statement of comprehensive incomein the period in which they arise.
Impairment of assetsAt each balance sheet date, the Group reviews the carrying amounts of its assets (excluding investment property and derivative financial instrumentswhich are carried at fair value) to determine whether there is any indication that those assets have suffered an impairment loss. If any such indicationexists, the recoverable amount of the asset is estimated in order to determine the extent of the impairment loss (if any). The recoverable amount is thehigher of an asset’s net selling price and its value-in-use (i.e. the net present value of its future cash flows discounted at the Group’s average pre-taxinterest rate that reflects the borrowing costs and risk for the asset).
InventoriesInventories, representing the cost of packing materials, are stated at the lower of cost and net realisable value.
Financial instrumentsFinancial assets and financial liabilities are recognised on the Group’s balance sheet when the Group becomes a party to the contractual provisions ofthe instrument. Financial assets at FVTPL are stated at fair value, with any gains or losses arising on re-measurement recognised in the income statement.The net gain or loss recognised in the income statement incorporates any dividend or interest earned on the financial asset and is included in the ‘othergains and losses’ line item in the income statement.
A – Derivative financial instruments and hedge accountingThe Group’s activities expose it primarily to the financial risks of interest rates. The Group uses interest rate swap contracts to hedge these exposures.The Group does not use derivative financial instruments for speculative purposes. The use of financial derivatives is governed by the Group’s policiesapproved by the Board of Directors. The policy in respect of interest rates is to maintain a balance between flexibility and the hedging of interest rate risk.
Derivatives are initially recognised at fair value and are subsequently reviewed at each balance sheet date. The fair value of interest rate derivatives atthe reporting date is determined by discounting the future cash flows using the forward curves at the reporting date and the credit risk inherent in thecontract.
Changes in the fair value of derivative financial instruments are recognised in the statement of comprehensive income as they arise. The Group has notadopted hedge accounting. Derivatives embedded in other financial instruments or other host contracts are treated as separate derivatives when theirrisks and characteristics are not closely related to those of host contracts and the host contracts are not carried at fair value with unrealised gains orlosses reported in the statement of comprehensive income.
B – Loans and receivablesTrade receivables, loans, and other receivables that have fixed or determinable payments that are not quoted in an active market are classified as loansand receivables. Loans and receivables are initially recognised at fair value and subsequently measured at amortised cost using the effective interestmethod, less any impairment. Interest income is recognised by applying the effective interest rate, except for short-term receivables when the recognitionof interest would be immaterial.
Notes to the Financial Statements (continued)Year ended 31 March 2018
104

105
2. SIGNIFICANT ACCOUNTING POLICIES (continued)
C – Impairment of financial assetsFinancial assets are assessed for indicators of impairment at each balance sheet date. Financial assets are impaired where there is objective evidencethat, as a result of one or more events that occurred after the initial recognition of the financial asset, the estimated future cash flows of the investmenthave been impacted. The carrying amount of the financial asset is reduced by the impairment loss directly for all financial assets with the exception oftrade receivables, where the carrying amount is reduced through the use of an allowance account. When a trade receivable is considered uncollectible,it is written off against the allowance account. Subsequent recoveries of amounts previously written off are credited against the allowance account.Changes in the carrying amount of the allowance account are recognised in the income statement.
D – Cash and cash equivalentsCash and cash equivalents comprises cash on hand and demand deposits, and other short term highly liquid investments that are readily convertible toa known amount of cash and are subject to an insignificant risk of changes in value. The carrying amounts of these assets approximates to the fair value.
E – Financial liabilities and equityFinancial liabilities and equity instruments are classified according to the substance of the contractual arrangements entered into.
F – Equity instrumentsEquity instruments issued by the Company are recorded at the proceeds received, net of direct issue costs.
G – Trade payablesTrade payables are not interest bearing and are initially stated at fair value and subsequently recorded measured at amortised cost.
Retirement benefit costsPension costs represent contributions payable to defined contribution schemes and are charged as an expense to the statement of comprehensive incomeas they fall due. The assets of the schemes are held separately from those of the Group.
Share-based paymentsThe Group issues equity-settled share-based payments to certain employees. These are measured at fair value at the date of grant. The fair valuedetermined at the grant date of the share-based payment is expensed on a straight-line basis over the vesting period, based on the Group’s estimate ofshares that will eventually vest.
Fair value is measured by use of the Black-Scholes model and excludes the effect of non-market based vesting conditions. The expected life used in themodel has been adjusted, based on management’s best estimate, for the effects of non-transferability, exercise restrictions, and behavioural considerations.At each balance sheet date, the Group revises its estimate of the number of equity instruments expected to vest as a result of the effect of non-marketbased vesting conditions. The impact of the revision of the original estimates, if any, is recovered in the income statement such that the cumulativeexpenses reflects the revised estimate with a corresponding adjustment to equity reserves.
For cash-settled share-based payments, a liability is recognised for the goods or services acquired, measured initially at the fair value of the liability. Ateach balance sheet date until the liability is settled, and at the date of settlement, the fair value of the liability is re-measured, with any changes in fairvalue recognised in the income statement for the year.
Critical accounting estimates and judgementsIn the application of the Group’s accounting policies, which are described above, the Directors are required to make judgements, estimates and assumptionsabout the carrying amounts of assets and liabilities that are not readily apparent from other sources. The estimates and associated assumptions arebased on historical experience and other factors that are considered to be relevant. Actual results may differ from these estimates.
The estimates and underlying assumptions are reviewed on an ongoing basis. Revisions to accounting estimates are recognised in the period in whichthe estimate is revised if the revision affects only that period, or in the period of the revision and future periods if the revision affects both current andfuture periods.
Estimate of fair value of Investment Properties and Investment Property under Construction(critical accounting estimate)The Group’s self storage centres and stores under development are valued using a discounted cash flow methodology which is based on projections of netoperating income. The Group employs expert external valuers, Cushman & Wakefield LLP, who report on the values of the Group’s stores on an annual basis.The stores within the Armadillo Partnerships are valued by Jones Lang LaSalle. The principal assumptions underlying the estimation of the fair value arethose related to: stabilised occupancy levels; expected future growth in storage rents; capitalisation rates; and discount rates. A more detailed explanationof the background and methodology adopted in the valuation of the Group’s investment properties is set out in note 15 to the financial statements.
Judgement of business combinationsThe Directors assess whether the acquisition of property through the purchase of a corporate vehicle should be accounted for as an asset purchase or abusiness combination. Where the acquired corporate vehicle is an integrated set of activities and assets that is capable of being conducted and managedto provide a return to investors, the transaction is accounted for as a business combination. Where there are no such significant items, the transaction istreated as an asset purchase. The Directors assess when the risks and rewards associated with an acquisition or disposal have transferred. There havebeen no business combinations in the year.

Notes to the Financial Statements (continued)Year ended 31 March 2018
106
3. REVENUEAnalysis of the Group’s operating revenue can be found below and in the Portfolio Summary on page 20.
2018 2017£000 £000
Open storesSelf storage income 97,717 91,600Other storage related income 16,494 15,189Ancillary store rental income 524 526
114,735 107,315Other revenueNon-storage income 950 885Management fees earned 975 870
Total revenue 116,660 109,070
Non-storage income derives principally from rental income earned from tenants of properties awaiting development.
4. SEGMENTAL INFORMATIONIFRS 8 requires operating segments to be identified on the basis of internal reports about components of the Group that are regularly reviewed by theChief Executive to allocate resources to the segments and to assess their performance. Given the nature of the Group’s business, there is one segment,which is the provision of self storage and related services.
Revenue represents amounts derived from the provision of self storage and related services which fall within the Group's ordinary activities after deductionof trade discounts and value added tax. The Group’s net assets, revenue and profit before tax are attributable to one activity, the provision of self storageand related services. These all arise in the United Kingdom in the current year and prior year.
5. PROFIT FOR THE YEARa) Profit for the year has been arrived at after charging/(crediting):
2018 2017£000 £000
Depreciation of plant, equipment and owner-occupied property 729 738Depreciation of finance lease capital obligations 1,109 1,196Gain on the revaluation of investment property (71,635) (43,706)Profit on part disposal of investment property (650) –Cost of inventories recognised as an expense 1,043 1,035Employee costs (see note 6) 16,306 15,622Operating lease rentals 127 133
b) Analysis of auditor’s remuneration:2018 2017£000 £000
Fees payable to the Company’s auditor for the audit of the Company’s annual accounts 156 156Fess payable to the Company’s auditor for the subsidiaries’ annual accounts 32 30
Total audit fees 188 186
Audit related assurance services – interim review 30 31Tax advisory services – 19Other assurance services – assurance of CSR report – 22Other services – planning consultancy – 11Other services – 2
Total non-audit fees 30 85
Fees payable to KPMG LLP and their associates for non-audit services to the Company are not required to be disclosed because the consolidatedfinancial statements are required to disclose such fees on a consolidated basis. Fees charged by KPMG LLP to the Group’s associates, ArmadilloStorage Holding Company Limited and Armadillo Storage Holding Company 2 Limited in the year amounted to £45,000 which all related to auditservices. The prior year audit fees and non-audit fees disclosed were payable to Deloitte LLP.

107
6. EMPLOYEE COSTSThe average monthly number of full-time equivalent employees (including Executive Directors) was:
2018 2017Number Number
Sales 284 279Administration 51 50
335 329
At 31 March 2018 the total number of Group employees was 375 (2017: 361).2018 2017£000 £000
Their aggregate remuneration comprised:Wages and salaries 11,377 10,990Social security costs 1,913 1,783Other pension costs 546 525Share-based payments 2,470 2,324
16,306 15,622
Details of Directors’ Remuneration is given on pages 66 to 85. The Directors are the only employees assessed as key management personnel.
7. INVESTMENT INCOME2018 2017£000 £000
Bank interest receivable 13 16Unwinding of discount on Capital Goods Scheme receivable 231 340
Total interest receivable 244 356
Change in fair value of interest rate derivatives 1,294 719
Total investment income 1,538 1,075
8. FINANCE COSTS2018 2017£000 £000
Interest on bank borrowings 9,817 10,953Capitalised interest (360) (128)Interest on obligations under finance leases 992 931
Total interest payable 10,449 11,756
Refinancing costs 1,526 –
Total finance costs 11,975 11,756
The refinancing costs relate to the unamortised loan arrangement costs of the previous bank facility which was extinguished, and the write-off of thecosts of the new bank facility in accordance with IAS 39.

Notes to the Financial Statements (continued)Year ended 31 March 2018
108
9. TAXATIONThe Group converted to a REIT in January 2007. As a result the Group does not pay UK corporation tax on the profits and gains from its qualifying rentalbusiness in the UK provided that it meets certain conditions. Non-qualifying profits and gains of the Group are subject to corporation tax as normal.The Group monitors its compliance with the REIT conditions. There have been no breaches of the conditions to date.
Finance (No.2) Bill 2015 provides that the rate of corporation tax for the 2017 Financial Year (commencing 1 April 2017) would be 19% and that the ratefrom 1 April 2020 will be 18%. At Budget 2016, the government announced a further reduction to the Corporation Tax main rate (for all profits except ringfence profits) for the year starting 1 April 2020, setting the rate at 17%. This rate was incorporated in Finance Act 2016 which was fully enacted on15 September 2016.
2018 2017£000 £000
UK current tax:– Current year 546 417– Prior year 51 (145)
597 272
A reconciliation of the tax charge is shown below:2018 2017£000 £000
Profit before tax 134,139 99,783
Tax charge at 19% (2017 – 20%) thereon 25,486 19,957Effects of:Revaluation of investment properties (13,734) (8,741)Share of profit of associates (260) (288)Other permanent differences (1,374) (1,242)Profits from the tax exempt business (9,176) (8,791)Utilisation of brought forward losses (11) –Movement on other unrecognised deferred tax assets (385) (478)
Current year tax charge 546 417Prior year adjustment 51 (145)
Total tax charge 597 272
At 31 March 2018 the Group has unutilised tax losses of £32.1 million (2017: £32.6 million) available for offset against certain types of future taxableprofits. All losses can be carried forward indefinitely.
10. ADJUSTED PROFIT2018 2017£000 £000
Profit before tax 134,139 99,783Gain on revaluation of investment properties – wholly owned (71,635) (43,706) – in associate (net of deferred tax) (724) (756)Change in fair value of interest rate derivatives – Group (1,294) (719) – in associate (60) 8Gain on part disposal of investment property (650) –Prior period VAT recovery – (328)Acquisition costs written off – 296Refinancing costs 1,526 –Share of associate acquisition costs written off 120 63
Adjusted profit before tax 61,422 54,641Tax (597) (272)
Adjusted profit after tax 60,825 54,369

109
10. ADJUSTED PROFIT (continued)Adjusted profit before tax which excludes gains and losses on the revaluation of investment properties, changes in fair value of interest rate derivatives,net gains and losses on disposal of investment property, and non-recurring items of income and expenditure have been disclosed as, in the Board’s view,this provides a clearer understanding of the Group’s underlying trading performance.
The refinancing costs of £1.5 million relate to the unamortised loan arrangement costs of the previous bank facility, and the write-off of the costs of thenew bank facility in accordance with IAS 39.
11. DIVIDENDS2018 2017£000 £000
Amounts recognised as distributions to equity holders in the year:Final dividend for the year ended 31 March 2017 of 14.1p (2016: 12.8p) per share. 22,107 20,003Interim dividend for the year ended 31 March 2018 of 15.3p (2017: 13.5p) per share. 24,076 21,155
46,183 41,158
Proposed final dividend for the year ended 31 March 2018 of 15.5p (2017: 14.1p) per share. 24,417 22,107
Subject to approval by shareholders at the Annual General Meeting to be held on 19 July 2018, the final dividend will be paid on 27 July 2018. The ex-divdate is 21 June 2018 and the record date is 22 June 2018.
The Property Income Dividend (“PID”) payable for the year is 27.5 pence per share (2017: 24.0 pence per share).
12. EARNINGS PER SHARE
Year ended 31 March 2018 Year ended 31 March 2017Earnings Shares Pence per Earnings Shares Pence per
£m million share £m million share
Basic 133.5 157.1 85.0 99.5 156.5 63.6Dilutive share options – 1.0 (0.6) – 1.2 (0.5)
Diluted 133.5 158.1 84.4 99.5 157.7 63.1
Adjustments:Gain on revaluation of investment properties (71.6) – (45.3) (43.7) – (27.7)Change in fair value of interest rate derivatives (1.3) – (0.8) (0.7) – (0.4)Gain on part disposal of investment property (0.6) – (0.4) – – –Acquisition costs written off – – – 0.3 – 0.2Prior period VAT recovery – – – (0.3) – (0.2)Refinancing costs 1.5 – 1.0 – – –Share of associate non-recurring gains and losses (0.7) – (0.4) (0.7) – (0.5)
EPRA – diluted 60.8 158.1 38.5 54.4 157.7 34.5
EPRA – basic 60.8 157.1 38.7 54.4 156.5 34.8
The calculation of basic earnings is based on profit after tax for the year. The weighted average number of shares used to calculate diluted earnings pershare has been adjusted for the conversion of share options.
EPRA earnings and earnings per ordinary share have been disclosed to give a clearer understanding of the Group’s underlying trading performance.

Notes to the Financial Statements (continued)Year ended 31 March 2018
110
13. NET ASSETS PER SHAREThe European Public Real Estate Association (“EPRA”) has issued recommended bases for the calculation of net assets per share information and this isshown in the table below:
31 March 31 March2018 2017£000 £000
Basic net asset value 981,148 890,350Exercise of share options 1,105 820
EPRA NNNAV 982,253 891,170Adjustments:Fair value of derivatives (1,704) 2,964Fair value of derivatives – share of associate 17 77Share of deferred tax in associates 794 626
EPRA NAV 981,360 894,837
Basic net assets per share (pence) 623.2 568.0EPRA NNNAV per share (pence) 616.8 562.1EPRA NAV per share (pence) 616.2 564.4
EPRA NAV (as above) (£000) 981,360 894,837Valuation methodology assumption (see note 15) (£000) 77,706 68,530
Adjusted net asset value (£000) 1,059,066 963,367Adjusted net assets per share (pence) 665.0 607.6
No. of shares No. of shares
Shares in issue 158,570,574 157,882,867Own shares held in EBT (1,122,907) (1,122,907)
Basic shares in issue used for calculation 157,447,667 156,759,960Exercise of share options 1,798,494 1,781,652
Diluted shares used for calculation 159,246,161 158,541,612
Net assets per share are equity shareholders’ funds divided by the number of shares at the year end. The shares currently held in the Group’s EmployeeBenefit Trust are excluded from both net assets and the number of shares. Adjusted net assets per share include the effect of those shares issuableunder employee share option schemes and the effect of alternative valuation methodology assumptions (see note 15).
14. NON-CURRENT ASSETSa) Investment property, investment property under construction and interests in leasehold property
Investmentproperty Interests in
Investment under leaseholdproperty construction property Total
£000 £000 £000 £000
At 31 March 2016 1,092,210 33,945 20,165 1,146,320Additions 17,817 2,827 1,871 22,515Adjustment to present value – – 2,761 2,761Revaluation (see note 15) 44,363 (657) – 43,706Depreciation – – (1,196) (1,196)
At 31 March 2017 1,154,390 36,115 23,601 1,214,106Additions 8,147 33,012 – 41,159Adjustment to present value – – 437 437Transfer on opening of store 9,710 (9,710) – –Revaluation (see note 15) 72,895 (1,260) – 71,635Depreciation – – (1,109) (1,109)
At 31 March 2018 1,245,142 58,157 22,929 1,326,228

111
14. NON-CURRENT ASSETS (continued)a) Investment property, investment property under construction and interests in leasehold property (continued)
During the year the Group sold land at its Richmond store to an adjoining landowner for £650,000. The valuation of the store was not impacted bythis disposal, hence the full proceeds have been recorded as profit on part disposal of investment property. This has been eliminated from the Group’sadjusted profit for the year.
Additions to the interests in leasehold properties in the prior year relate to the lease at Twickenham 2, acquired from Lock and Leave in April 2016.
The income from self storage accommodation earned by the Group from its investment property is disclosed in note 3. Direct operating expenses,which are all applied to generating rental income, arising on the investment property in the year are disclosed in the Portfolio Summary on page 20.Included within additions is £0.4 million of capitalised interest (2017: £0.1 million), calculated at the Group’s average borrowing cost for the year of2.9%. 55 of the Group’s investment properties are pledged as security for loans, with a total external value of £1,076.2 million.
b) Plant, equipment and owner occupied propertyFixtures,
Freehold Leasehold Plant and Motor fittings & officeproperty improvements machinery vehicles equipment Total
£000 £000 £000 £000 £000 £000
CostAt 31 March 2016 2,183 101 592 25 1,498 4,399Retirement of fully depreciated assets – (4) (34) – (489) (527)Additions 6 – 91 30 422 549Disposals – – – (23) – (23)
At 31 March 2017 2,189 97 649 32 1,431 4,398Retirement of fully depreciated assets – (30) (79) – (584) (693)Additions 8 7 121 – 469 605
At 31 March 2018 2,197 74 691 32 1,316 4,310
DepreciationAt 31 March 2016 (367) (52) (197) (25) (353) (994)Retirement of fully depreciated assets – 4 34 – 489 527Charge for the year (42) (2) (102) (5) (587) (738)Disposals – – – 23 – 23
At 31 March 2017 (409) (50) (265) (7) (451) (1,182)Retirement of fully depreciated assets – 30 79 – 584 693Charge for the year (42) (2) (123) (7) (555) (729)
At 31 March 2018 (451) (22) (309) (14) (422) (1,218)
Net book valueAt 31 March 2018 1,746 52 382 18 894 3,092
At 31 March 2017 1,780 47 384 25 980 3,216
c) Intangible assetsThe intangible asset relates to the Big Yellow brand, which was acquired through the acquisition of Big Yellow Self Storage Company Limited in 1999.The carrying value remains unchanged from the prior year as there is considered to be no impairment in the value of the asset. The asset has anindefinite life and is tested annually for impairment or more frequently if there are indicators of impairment.
This was shown as goodwill in the prior year, but this has been restated to treat it as an intangible asset in both years, as this more fairly reflects thenature of the asset.
d) Investment in associatesArmadilloThe Group has a 20% interest in Armadillo Storage Holding Company Limited (“Armadillo 1”) and a 20% interest in Armadillo Storage Holding Company2 Limited (“Armadillo 2”). Both interests are accounted for as associates, using the equity method of accounting. Both companies are incorporated,registered and operate in England and Wales.

Notes to the Financial Statements (continued)Year ended 31 March 2018
112
14. NON-CURRENT ASSETS (continued)d) Investment in associates (continued)
Armadillo 1 Armadillo 2 Total
31 March 31 March 31 March 31 March 31 March 31 March 2018 2017 2018 2017 2018 2017 £000 £000 £000 £000 £000 £000
At the beginning of the year 5,048 4,173 2,404 2,233 7,452 6,406Subscription for capital – – 900 – 900 –Share of results (see below) 937 1,093 433 349 1,370 1,442Dividends (255) (218) (191) (178) (446) (396)
Share of net assets 5,730 5,048 3,546 2,404 9,276 7,452
In March 2018, Armadillo 2 raised £4.5 million of equity, which alongside additional debt from Lloyds, funded the acquisition of 1st Storage Centres.Big Yellow’s equity invested was £0.9 million (20% of the total raised), with the balance funded by our partners. The Group’s total subscription forpartnership capital and advances in Armadillo 1 is £1,920,000 and £2,689,000 in Armadillo 2.
The investment properties owned by Armadillo 1 and Armadillo 2 have been valued at 31 March 2018 by Jones Lang LaSalle.
The figures below show the trading results of the Armadillo Partnerships, and the Group’s share of the results and the net assets of the ArmadilloPartnerships. Armadillo 1 Armadillo 2
Year ended Year ended Year ended Year ended31 March 31 March 31 March 31 March
2018 2017 2018 2017£000 £000 £000 £000
Income statement (100%)Revenue 8,188 6,324 4,576 4,159Cost of sales (4,247) (3,270) (1,919) (1,763)Administrative expenses (282) (207) (136) (88)
Operating profit 3,659 2,847 2,521 2,308Gain on the revaluation of investment properties 3,264 3,725 1,196 322Net interest payable (938) (718) (813) (729)Acquisition costs written off (375) (316) (227) –Fair value movement of interest rate derivatives 147 8 154 (49)Deferred and current tax (1,074) (78) (664) (109)
Profit attributable to shareholders 4,683 5,468 2,167 1,743Dividends paid (1,275) (1,091) (957) (890)
Retained profit 3,408 4,377 1,210 853
Balance sheet (100%)Investment property 53,176 43,375 38,205 25,900Interest in leasehold properties 1,403 – 3,233 3,526Other non-current assets 1,149 1,125 1,989 1,487Current assets 1,177 1,177 1,480 867Current liabilities (2,842) (1,895) (2,367) (1,821)Derivative financial instruments (52) (199) (34) (188)Non-current liabilities (25,361) (18,341) (24,778) (17,753)
Net assets (100%) 28,650 25,242 17,728 12,018
Group shareOperating profit 732 569 504 462Gain on the revaluation of investment properties 653 745 239 64Net interest payable (187) (144) (163) (146)Acquisition costs written off (75) (63) (45) –Fair value movement of interest rate derivatives 29 2 31 (10)Deferred and current tax (215) (16) (133) (21)
Profit attributable to shareholders 937 1,093 433 349Dividends paid (255) (218) (191) (178)
Retained profit 682 875 242 171
Associates’ net assets 5,730 5,048 3,546 2,404

113
15. VALUATION OF INVESTMENT PROPERTYRevaluation on
Deemed cost deemed cost Valuation£000 £000 £000
Freehold storesAt 31 March 2017 583,297 527,613 1,110,910Transfer from investment property under construction 11,763 (2,053) 9,710Movement in year 7,780 73,452 81,232
At 31 March 2018 602,840 599,012 1,201,852
Leasehold storesAt 31 March 2017 16,210 27,270 43,480Movement in year 367 (557) (190)
At 31 March 2018 16,577 26,713 43,290
Total of open storesAt 31 March 2017 599,507 554,883 1,154,390Transfer from investment property under construction 11,763 (2,053) 9,710Movement in year 8,147 72,895 81,042
At 31 March 2018 619,417 625,725 1,245,142
Investment property under constructionAt 31 March 2017 45,477 (9,362) 36,115Transfer to investment property (11,763) 2,053 (9,710)Movement in year 33,012 (1,260) 31,752
At 31 March 2018 66,726 (8,569) 58,157
Valuation of all investment propertyAt 31 March 2017 644,984 545,521 1,190,505Movement in year 41,159 71,635 112,794
At 31 March 2018 686,143 617,156 1,303,299
The Group has classified the fair value investment property and the investment property under construction within Level 3 of the fair value hierarchy.There has been no transfer to or from Level 3 in the year.
The wholly owned freehold and leasehold investment properties have been valued at 31 March 2018 by external valuers, Cushman & Wakefield (“C&W”).The valuation has been carried out in accordance with the RICS Valuation – Global Standards, published by The Royal Institution of Chartered Surveyors(“the Red Book”). The valuation of each of the investment properties and the investment properties under construction has been prepared on the basisof either Fair Value or Fair Value as a fully equipped operational entity, having regard to trading potential, as appropriate.
The valuation has been provided for accounts purposes and as such, is a Regulated Purpose Valuation as defined in the Red Book. In compliance with thedisclosure requirements of the Red Book, C&W have confirmed that:
> one of the members of the RICS who has been a signatory to the valuations provided to the Group for the same purposes as this valuation, has doneso since September 2004. This is the third occasion on which the other member has been a signatory;
> C&W have been carrying out this annual valuation for the same purposes as this valuation on behalf of the Group since September 2004;> C&W do not provide other significant professional or agency services to the Group;> in relation to the preceding financial year of C&W, the proportion of the total fees payable by the Group to the total fee income of the firm is less than
5%; and> the fee payable to C&W is a fixed amount per store, and is not contingent on the appraised value.
Market uncertaintyC&W’s valuation report comments on valuation uncertainty resulting from low liquidity in the market for self storage property. C&W note that in the UKsince Q1 2015 there have only been thirteen transactions involving multiple assets and ten single asset transactions. C&W state that due to the lack ofcomparable market information in the self storage sector, there is greater uncertainty attached to their opinion of value than would be anticipated duringmore active market conditions.
Portfolio PremiumC&W’s valuation report further confirms that the properties have been valued individually but that if the portfolio was to be sold as a single lot or inselected groups of properties, the total value could differ significantly. C&W state that in current market conditions they are of the view that there couldbe a material portfolio premium.

15. VALUATION OF INVESTMENT PROPERTY (continued)
AssumptionsA. Net operating income is based on projected revenue received less projected operating costs together with a central administration charge of 6% of
the estimated annual revenue subject to a cap and a collar. The initial net operating income is calculated by estimating the net operating income inthe first 12 months following the valuation date.
B. The net operating income in future years is calculated assuming either straight-line absorption from day one actual occupancy or variable absorptionover years one to four of the cash flow period, to an estimated stabilised/mature occupancy level. In the valuation the assumed stabilised occupancylevel for the 74 trading stores (both freeholds and leaseholds) open at 31 March 2018 averages 83.6% (31 March 2017: 82.8%). The projected revenuesand costs have been adjusted for estimated cost inflation and revenue growth. The average time assumed for the 74 stores to trade at their maturitylevels is 16 months (31 March 2017: 22 months).
C. The capitalisation rates applied to existing and future net cash flow have been estimated by reference to underlying yields for industrial and retailwarehouse property, yields for other trading property types such as student housing and hotels, bank base rates, ten-year money rates, inflationand the available evidence of transactions in the sector. The valuation included in the accounts assumes rental growth in future periods.If an assumption of no rental growth is applied to the external valuation, the net initial yield pre-administration expenses for the 74 stores is 6.5%(31 March 2017: 6.5%) rising to a stabilised net yield pre-administration expenses of 6.9% (31 March 2017: 7.2%). The weighted average exitcapitalisation rate adopted (for both freeholds and leaseholds) is 6.3% (31 March 2017: 6.6%).
D. The future net cash flow projections (including revenue growth and cost inflation) have been discounted at a rate that reflects the risk associatedwith each asset. The weighted average annual discount rate adopted (for both freeholds and leaseholds) is 9.4% (31 March 2017: 9.7%).
E. Purchaser’s costs in the range of circa 6.1% to circa 6.8% (see below) have been assumed initially, reflecting the progressive SLDT rates brought intoforce in March 2016 and sale plus purchaser’s costs totalling circa 7.1% to 7.8% are assumed on the notional sales in the tenth year in relation to thefreehold and long leasehold stores.
Short leaseholdThe same methodology has been used as for freeholds, except that no sale of the assets in the tenth year is assumed but the discounted cash flow isextended to the expiry of the lease. The average unexpired term of the Group’s seven short leasehold properties is 14.0 years (31 March 2017: 15.0 yearsunexpired).
SensitivitiesAs noted in ‘Significant judgements and key estimates’ on page 105, self storage valuations are complex, derived from data which is not widely publiclyavailable and involve a degree of judgement. For these reasons we have classified the valuations of our property portfolio as Level 3 as defined byIFRS 13. Inputs to the valuations, some of which are ‘unobservable’ as defined by IFRS 13, include capitalisation yields, stable occupancy rates, and rentalgrowth rates. The existence of an increase of more than one unobservable input would augment the impact on valuation. The impact on the valuationwould be mitigated by the inter-relationship between unobservable inputs moving in opposite directions. For example, an increase in stable occupancymay be offset by an increase in yield, resulting in no net impact on the valuation. A sensitivity analysis showing the impact on valuations of changes inyields and stable occupancy is shown below. Impact of a change Impact of a change in in stabilised capitalisation rates occupancy assumption
25 bps decrease 25 bps increase 1% increase 1% decrease
Reported group £48.6m (£44.9m) £18.3m (£19.1m)
A sensitivity analysis has not been provided for a change in the rental growth rate adopted as there is a relationship between this measure and thediscount rate adopted. So, in theory, an increase in the rental growth rate would give rise to a corresponding increase in the discount rate and the resultingvalue impact would be limited.
Investment properties under constructionC&W have valued the stores in development adopting the same methodology as set out above but on the basis of the cash flow projection expected forthe store at opening and after allowing for the outstanding costs to take each scheme from its current state to completion and full fit-out. C&W haveallowed for holding costs and construction contingency, as appropriate. Four schemes do not yet have planning consent and C&W have reflected theplanning risk in their valuation.
Notes to the Financial Statements (continued)Year ended 31 March 2018
114

115
15. VALUATION OF INVESTMENT PROPERTY (continued)
Immature stores: value uncertaintyC&W have assessed the value of each property individually. However, two of the Group’s stores are relatively immature and have low initial cash flows.C&W have endeavoured to reflect the nature of the cash flow profile for these properties in their valuation, and the higher associated risks relating to theas yet unproven future cash flows, by adjustment to the capitalisation rates and discount rates adopted. However, immature low cash flow stores of thisnature are rarely, if ever, traded individually in the market, unless as part of a distressed sale or similar situation. Although, there is more evidence ofimmature low cash flow stores being traded as part of a group or portfolio transaction. Please note C&W’s comments in relation to market uncertainty inthe self storage sector due to the lack of comparable market transactions and information. The degree of uncertainty relating to the immature stores isgreater than in relation to the balance of the properties due to there being even less market evidence that might be available for more mature propertiesand portfolios. C&W state that in practice, if an actual sale of the properties were to be contemplated then any immature low cash flow stores wouldnormally be presented to the market for sale lotted or grouped with other more mature assets owned by the same entity, in order to alleviate the issue ofnegative or low short-term cash flow. This approach would enhance the marketability of the group of assets and assist in achieving the best price availablein the market by diluting the cash flow risk.
C&W have not adjusted their opinion of Fair Value to reflect such a grouping of the immature assets with other properties in the portfolio and all storeshave been valued individually. However, they highlight the matter to alert the Group to the manner in which the properties might be grouped or lotted inorder to maximise their attractiveness to the market place. C&W consider this approach to be a valuation assumption but not a Special Assumption, thelatter being an assumption that assumes facts that differ from the actual facts existing at the valuation date and which, if not adopted, could produce amaterial difference in value. As noted above, C&W have not assumed that the entire portfolio of properties owned by the entity would be sold as a singlelot and the value for the whole portfolio in the context of a sale as a single lot may differ significantly from the aggregate of the individual values for eachproperty in the portfolio, reflecting the lotting assumption described above.
Valuation assumption for purchaser’s costsThe Group’s investment property assets have been valued for the purposes of the financial statements after deducting notional purchaser’s cost of circa6.1% to 6.8% of gross value, as if they were sold directly as property assets. The valuation is an asset valuation which is entirely linked to the operatingperformance of the business. The assets would have to be sold with the benefit of operational contracts, employment contracts and customer contracts,which would be very difficult to achieve except in a corporate structure. This approach follows the logic of the valuation methodology in that the valuationis based on a capitalisation of the net operating income after allowing a deduction for operational cost and an allowance for central administration costs.Sale in a corporate structure would result in a reduction in the assumed Stamp Duty Land Tax but an increase in other transaction costs reflecting additionaldue diligence resulting in a reduced notional purchaser’s cost of 2.75% of gross value. All the significant sized transactions that have been concluded inthe UK in recent years were completed in a corporate structure. The Group therefore instructed C&W to carry out an additional valuation on the abovebasis, and this results in a higher property valuation at 31 March 2018 of £1,380.3 million (£77.0 million higher than the value recorded in the financialstatements). The total valuations in the two Armadillo Partnerships performed by Jones Lang LaSalle are £3.3 million higher than the value recorded inthe financial statements, of which the Group’s share is £0.7 million. The sum of these is £77.7 million and translates to 48.8 pence per share. We haveincluded this revised valuation in the adjusted diluted net asset calculation (see note 13).
16. TRADE AND OTHER RECEIVABLES31 March 31 March
2018 2017£000 £000
CurrentTrade receivables 3,684 3,174Capital Goods Scheme receivable 1,876 2,725Other receivables 287 266Prepayments and accrued income 12,739 11,877
18,586 18,042
Non-currentCapital Goods Scheme receivable 2,385 4,091
Trade receivables are net of a bad debt provision of £14,000 (2017: £7,000). The Directors consider that the carrying amount of trade and other receivablesapproximates their fair value.
The Financial Review contains commentary on the Capital Goods Scheme receivable.
Notes to the Financial Statements (continued)Year ended 31 March 2018
116
16. TRADE AND OTHER RECEIVABLES (continued)
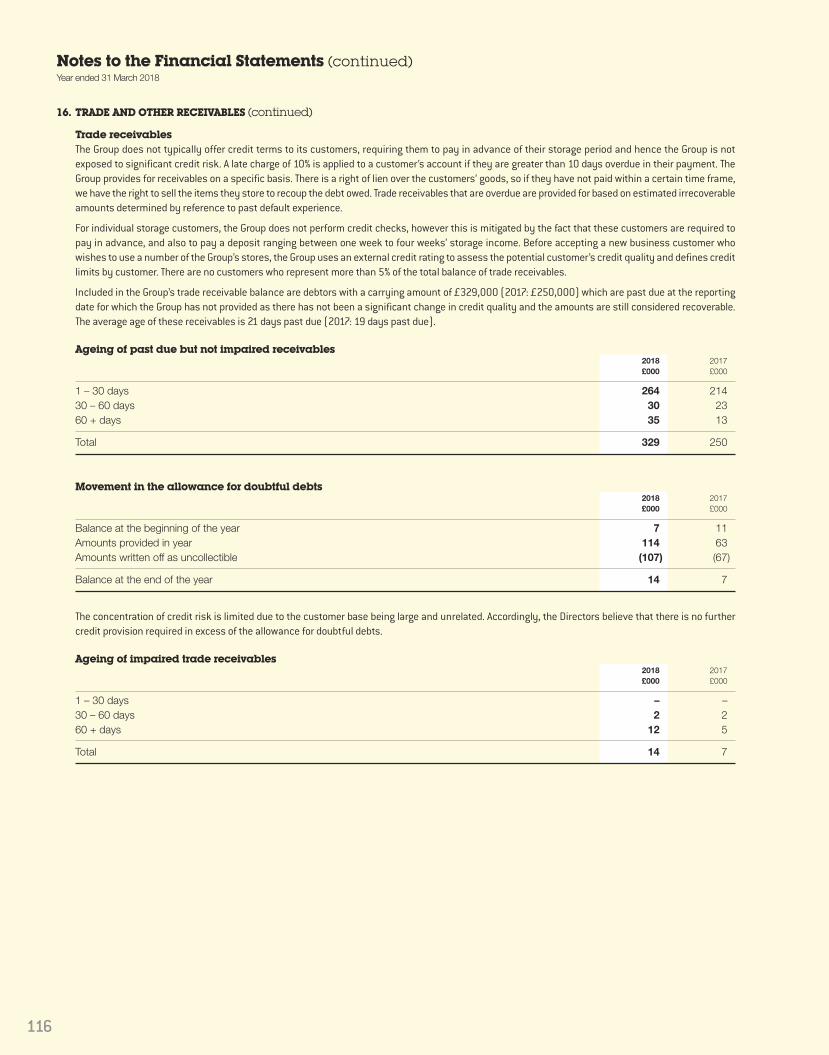
Trade receivablesThe Group does not typically offer credit terms to its customers, requiring them to pay in advance of their storage period and hence the Group is notexposed to significant credit risk. A late charge of 10% is applied to a customer’s account if they are greater than 10 days overdue in their payment. TheGroup provides for receivables on a specific basis. There is a right of lien over the customers’ goods, so if they have not paid within a certain time frame,we have the right to sell the items they store to recoup the debt owed. Trade receivables that are overdue are provided for based on estimated irrecoverableamounts determined by reference to past default experience.
For individual storage customers, the Group does not perform credit checks, however this is mitigated by the fact that these customers are required topay in advance, and also to pay a deposit ranging between one week to four weeks’ storage income. Before accepting a new business customer whowishes to use a number of the Group’s stores, the Group uses an external credit rating to assess the potential customer’s credit quality and defines creditlimits by customer. There are no customers who represent more than 5% of the total balance of trade receivables.
Included in the Group’s trade receivable balance are debtors with a carrying amount of £329,000 (2017: £250,000) which are past due at the reportingdate for which the Group has not provided as there has not been a significant change in credit quality and the amounts are still considered recoverable.The average age of these receivables is 21 days past due (2017: 19 days past due).
Ageing of past due but not impaired receivables2018 2017£000 £000
1 – 30 days 264 21430 – 60 days 30 2360 + days 35 13
Total 329 250
Movement in the allowance for doubtful debts2018 2017£000 £000
Balance at the beginning of the year 7 11Amounts provided in year 114 63Amounts written off as uncollectible (107) (67)
Balance at the end of the year 14 7
The concentration of credit risk is limited due to the customer base being large and unrelated. Accordingly, the Directors believe that there is no furthercredit provision required in excess of the allowance for doubtful debts.
Ageing of impaired trade receivables2018 2017£000 £000
1 – 30 days – –30 – 60 days 2 260 + days 12 5
Total 14 7

117
17. TRADE AND OTHER PAYABLES31 March 31 March
2018 2017£000 £000
CurrentTrade payables 12,739 13,279Other payables 7,710 8,352Accruals and deferred income 16,379 15,304
36,828 36,935
The Group has financial risk management policies in place to ensure that all payables are paid within the credit terms. The Directors consider the carryingamount of trade and other payables and accruals and deferred income approximates fair value.
18. FINANCIAL INSTRUMENTSThe Group manages its capital to ensure that entities in the Group will be able to continue as going concerns while maximising the return to stakeholdersthrough the optimisation of the debt and equity balance. The capital structure of the Group consists of debt, which includes the borrowings disclosed innote 19, cash and cash equivalents and equity attributable to equity holders of the parent, comprising issued capital, reserves and retained earnings.The Group’s debt facilities require 40% of total drawn debt to be fixed. The Group has complied with this during the year.
With the exception of derivative instruments which are classified as a financial liability at fair value through the income statement (“FVTPL”), financialliabilities are categorised under amortised cost. All financial assets are categorised as loans and receivables.
Exposure to credit, interest rate and currency risks arises in the normal course of the Group’s business. Derivative financial instruments are used tomanage exposure to fluctuations in interest rates, but are not employed for speculative purposes.
A. Balance sheet managementThe Group’s Board reviews the capital structure on an ongoing basis. As part of this review, the Board considers the cost of capital and the risksassociated with each class of capital. The Group seeks to have a conservative gearing ratio (the proportion of net debt to equity). The Board considersat each review the appropriateness of the current ratio in light of the above. The Board is currently satisfied with the Group’s gearing ratio.
The gearing ratio at the year end is as follows:2018 2017£000 £000
Debt (330,599) (304,955)Cash and cash equivalents 6,853 6,906
Net debt (323,746) (298,049)Balance sheet equity 981,148 890,350Net debt to equity ratio 33.0% 33.5%
B. Debt managementThe Group currently borrows through a senior term loan, secured on 25 self storage assets and sites, a 15 year loan with Aviva Commercial FinanceLimited secured on a portfolio of 15 self storage assets, and a £70 million seven year loan from M&G Investments Limited secured on a portfolio of15 self storage assets. Borrowings are arranged to ensure an appropriate maturity profile and to maintain short term liquidity. Funding is arrangedthrough banks and financial institutions with whom the Group has a strong working relationship.

Notes to the Financial Statements (continued)Year ended 31 March 2018
118
18. FINANCIAL INSTRUMENTS (continued)
C. Interest rate risk managementThe Group is exposed to interest rate risk as entities in the Group borrow funds at both fixed and floating interest rates. The risk is managed by theGroup by maintaining an appropriate mix between fixed and floating rate borrowings, and by the use of interest rate swap contracts. Hedging activitiesare evaluated regularly to align with interest rate views and defined risk appetite; ensuring optimal hedging strategies are applied, by either positioningthe balance sheet or protecting interest expense through different interest rate cycles.
At 31 March 2018 the Group had two interest rate derivatives in place; £30 million fixed at 0.4% (excluding the margin on the underlying debtinstrument) until October 2021, and £35 million fixed at 0.76% (excluding the margin on the underlying debt instrument) until June 2023.
Under interest rate swap contracts, the Group agrees to exchange the difference between fixed and floating rate interest amounts calculated onagreed notional principal amounts. Such contracts enable the Group to mitigate the risk of changing interest rates on the fair value of issued fixedrate debt held and the cash flow exposures on the issued variable rate debt held. The fair value of interest rate swaps at the reporting date is determinedby discounting the future cash flows using the curves at the reporting date and the credit risk inherent in the contract, and is disclosed below. Theaverage interest rate is based on the outstanding balances at the end of the financial year.
The £30 million interest rate swap settles on a monthly basis. The floating rate on the interest rate swap is one month LIBOR. The Group settles thedifference between the fixed and floating interest rate on a net basis.
The £35 million interest rate swap settles on a three-monthly basis. The floating rate on the interest rate swap is three month LIBOR. The Group settlesthe difference between the fixed and floating interest rate on a net basis.
The Group does not hedge account for its interest rate swaps and states them at fair value, with changes in fair value included in the statement ofcomprehensive income. A reconciliation of the movement in derivatives is provided in the table below:
2018 2017£000 £000
At 1 April (2,964) (3,683)Fair value movement in the year 1,294 719Cancellation of interest rate derivative 3,374 –
At 31 March 1,704 (2,964)
The table below reconciles the opening and closing balances of the Group’s finance related liabilities.Finance Interest rate
Loans leases derivatives Total
At 1 April 2017 (304,955) (23,601) (2,964) (331,520)Cash movement in the year (25,644) 1,109 3,374 (21,161)Non-cash movements – (437) 1,294 857
At 31 March 2018 (330,599) (22,929) 1,704 (351,824)
D. Interest rate sensitivity analysisIn managing interest rate risks the Group aims to reduce the impact of short-term fluctuations on the Group’s earnings, without jeopardising itsflexibility. Over the longer term, permanent changes in interest rates may have an impact on consolidated earnings.
At 31 March 2018, it is estimated that an increase of 0.25 percentage points in interest rates would have reduced the Group’s adjusted profit beforetax and net equity by £445,000 (2017: reduced adjusted profit before tax by £375,000) and a decrease of 0.25 percentage points in interest rateswould have increased the Group’s adjusted profit before tax and net equity by £445,000 (2017: increased adjusted profit before tax by £375,000).The sensitivity has been calculated by applying the interest rate change to the variable rate borrowings, net of interest rate swaps, at the year end.
The Group’s sensitivity to interest rates has increased during the year, following the increase in the amount of floating rate debt. The Board monitorsclosely the exposure to the floating rate element of our debt.
E. Cash management and liquidityUltimate responsibility for liquidity risk management rests with the Board of Directors, which has built an appropriate liquidity risk managementframework for the management of the Group’s short, medium and long-term funding and liquidity management requirements. The Group managesliquidity risk by maintaining adequate reserves, banking facilities and reserve borrowing facilities by continuously monitoring forecast and actualcash flows and matching the maturity profiles of financial assets and liabilities. Included in note 19 is a description of additional undrawn facilitiesthat the Group has at its disposal to further reduce liquidity risk.
Short term money market deposits are used to manage liquidity whilst maximising the rate of return on cash resources, giving due considerationto risk.

119
18. FINANCIAL INSTRUMENTS (continued)
F. Foreign currency managementThe Group does not have any foreign currency exposure.
G. Credit riskThe credit risk management policies of the Group with respect to trade receivables are discussed in note 16. The Group has no significant concentrationof credit risk, with exposure spread over 55,000 customers in our stores.
The credit risk on liquid funds is limited because the counterparties are banks with high credit-ratings assigned by international credit-rating agencies.
H. Financial maturity analysisIn respect of interest-bearing financial liabilities, the following table provides a maturity analysis for individual elements.
Less than One to Two to More thanTotal one year two years five years five years
2018 maturity £000 £000 £000 £000 £000
DebtAviva loan 87,599 2,474 2,598 8,601 73,926M&G loan payable at variable rate 35,000 – – – 35,000M&G loan fixed by interest rate derivatives 35,000 – – – 35,000Bank loan payable at variable rate 143,000 – – 143,000 –Debt fixed by interest rate derivatives 30,000 – – 30,000 –
Total 330,599 2,474 2,598 181,601 143,926
Less than One to Two to More thanTotal one year two years five years five years
2017 maturity £000 £000 £000 £000 £000
DebtAviva loan 89,955 2,356 2,474 8,190 76,935M&G loan payable at variable rate 35,000 – – – 35,000M&G loan fixed by interest rate derivatives 35,000 – – – 35,000Bank loan payable at variable rate 115,000 – – 115,000 –Debt fixed by interest rate derivatives 30,000 – – 30,000 –
Total 304,955 2,356 2,474 153,190 146,935
I. Fair values of financial instrumentsThe fair values of the Group’s cash and short term deposits and those of other financial assets equate to their book values. Details of the Group’sreceivables at amortised cost are set out in note 16. The amounts are presented net of provisions for doubtful receivables, and allowances forimpairment are made where appropriate. Trade and other payables, including bank borrowings, are carried at amortised cost. Finance lease liabilitiesare included at the fair value of their minimum lease payments. Derivatives are carried at fair value.
For those financial instruments held at valuation, the Group has categorised them into a three level fair value hierarchy based on the priority of theinputs to the valuation technique in accordance with IFRS 7. The hierarchy gives the highest priority to quoted prices in active markets for identicalassets or liabilities (Level 1) and the lowest priority to unobservable inputs (Level 3). If the inputs used to measure fair value fall within differentlevels of the hierarchy, the category level is based on the lowest priority level input that is significant to the fair value measurement of the instrumentin its entirety. The fair value of the Group’s outstanding interest rate derivative, as detailed in note 18C, has been estimated by calculating the presentvalue of future cash flows, using appropriate market discount rates, representing Level 2 fair value measurements as defined by IFRS 7. There are nofinancial instruments which have been categorised as Level 1 or Level 3. The fair value of the Group’s debt equates to its book value.

Notes to the Financial Statements (continued)Year ended 31 March 2018
120
18. FINANCIAL INSTRUMENTS (continued)
J. Maturity analysis of financial liabilitiesThe contractual maturities based on market conditions and expected yield curves prevailing at the year end date are as follows:
Tradeand other Interest rate Borrowings Financepayables swaps and interest leases Total
2018 £000 £000 £000 £000 £000
From five to twenty years – (63) 159,548 23,709 183,194From two to five years – (1,139) 207,092 6,285 212,238From one to two years – (381) 11,855 2,095 13,569
Due after more than one year – (1,583) 378,495 32,089 409,001Due within one year 20,449 (195) 11,855 2,095 34,204
Total 20,449 (1,778) 390,350 34,184 443,205
Tradeand other Interest rate Borrowings Financepayables swaps and interest leases Total
2017 £000 £000 £000 £000 £000
From five to twenty years – 127 166,652 25,556 192,335From two to five years – 1,493 180,928 6,116 188,537From one to two years – 692 11,930 2,039 14,661
Due after more than one year – 2,312 359,510 33,711 395,533Due within one year 21,631 816 11,930 2,039 36,416
Total 21,631 3,128 371,440 35,750 431,949
K. Reconciliation of maturity analysesThe maturity analysis in note 18J shows non-discounted cash flows for all financial liabilities including interest payments. The table below reconcilesthe borrowings column in note 19 with the borrowings and interest column in the maturity analysis presented in note 18J.
Unamortisedborrowing Borrowings
Borrowings Interest costs and interest2018 £000 £000 £000 £000
From five to twenty years 143,926 13,958 1,664 159,548From two to five years 181,601 25,491 – 207,092From one to two years 2,598 9,257 – 11,855
Due after more than one year 328,125 48,706 1,664 378,495Due within one year 2,474 9,381 – 11,855
Total 330,599 58,087 1,664 390,350
Unamortisedborrowing Borrowings
Borrowings Interest costs and interest2017 £000 £000 £000 £000
From five to twenty years 146,935 17,806 1,911 166,652From two to five years 153,190 26,373 1,365 180,928From one to two years 2,474 9,456 – 11,930
Due after more than one year 302,599 53,635 3,276 359,510Due within one year 2,356 9,574 – 11,930
Total 304,955 63,209 3,276 371,440

121
19. BORROWINGS31 March 31 March
2018 2017Secured borrowings at amortised cost £000 £000
Current liabilitiesAviva loan 2,474 2,356
2,474 2,356Non-current liabilitiesBank borrowings 173,000 145,000Aviva loan 85,125 87,599M&G loan 70,000 70,000Unamortised loan arrangement costs (1,664) (3,276)
Total non-current borrowings 326,461 299,323
Total borrowings 328,935 301,679
The weighted average interest rate paid on the borrowings during the year was 2.9% (2017: 3.3%).
The Group has £37,000,000 in undrawn committed bank borrowing facilities at 31 March 2018, which expire between four and five years (2017:£45,000,000 expiring between four and five years).
The Group has a £100 million 15 year fixed rate loan with Aviva Commercial Finance Limited. The loan is secured over a portfolio of 15 freehold self storagecentres. The annual fixed interest rate on the loan is 4.9%. The loan amortises to £60 million over the course of the 15 years. The debt service is payablemonthly based on fixed annual amounts.
The Group has a £210 million five year revolving bank facility with Lloyds and HSBC expiring in October 2022, with a margin of 1.25%. The Group has anoption to increase the amount of the loan facility by a further £60 million during the course of the loan’s term, and an option to increase the term of theloan by a further two years.
The Group has a £70 million seven year loan with M&G Investments Limited, with a bullet repayment in June 2023. The loan is secured over a portfolio of15 freehold self storage centres. Half of the loan is variable and half is subject to an interest rate derivative.
The Group was in compliance with its banking covenants at 31 March 2018 and throughout the year. The main covenants are summarised in the tablebelow:
Covenant Covenant level At 31 March 2018
Consolidated EBITDA Minimum 1.5x 7.9xConsolidated net tangible assets Minimum £250m £981.1mBank loan income cover Minimum 1.75x 14.2xAviva loan interest service cover ratio Minimum 1.5x 4.1xAviva loan debt service cover ratio Minimum 1.2x 2.7xM&G income cover Minimum 1.5x 7.5x
Interest rate profile of financial liabilitiesWeighted
Weighted Period for averageFloating Fixed average which the period
Total rate rate interest rate is until£000 £000 £000 rate fixed maturity
At 31 March 2018Gross financial liabilities 330,599 178,000 152,599 2.9% 6.5 years 5.5 years
At 31 March 2017Gross financial liabilities 304,955 150,000 154,955 3.2% 7.0 years 5.9 years
All monetary liabilities, including short term receivables and payables are denominated in sterling. The weighted average interest rate includes the effectof the Group’s interest rate derivatives. The Directors have concluded that the carrying value of borrowings approximates to its fair value.
Narrative disclosures on the Group’s policy for financial instruments are included within the Strategic Report and in note 18.

Notes to the Financial Statements (continued)Year ended 31 March 2018
122
20. DEFERRED TAXDeferred tax assets in respect of share based payments (£0.1 million), corporation tax losses (£4.5 million), capital allowances in excess of depreciation(£0.3 million) and capital losses (£1.4 million) in respect of the non-REIT taxable business have not been recognised due to uncertainty over the projectedtax liabilities arising in the short term within the non-REIT taxable business. A deferred tax liability in respect of interest rate swaps (£0.3 million) arisingin the non-REIT taxable business has also not been recognised as the relevant entity has the legal right to settle the potential tax amounts on a net basisand these taxes are levied by the same taxing authority.
21. OBLIGATIONS UNDER FINANCE LEASES Present value minimum Minimum lease payments of lease payments
2018 2017 2018 2017£000 £000 £000 £000
Amounts payable under finance leases:Within one year 2,095 2,039 2,061 2,005Within two to five years inclusive 8,380 8,155 7,390 7,193Greater than five years 23,709 25,556 13,478 14,403
34,184 35,750 22,929 23,601
Less: future finance charges (11,255) (12,149)
Present value of lease obligations 22,929 23,601
All lease obligations are denominated in sterling. Interest rates are fixed at the contract date. All leases are on a fixed repayment basis and no arrangementshave been entered into for contingent rental payments. The carrying amount of the Group’s lease obligations approximates their fair value.
22. SHARE CAPITAL Called up, allotted and fully paid
2018 2017£000 £000
Ordinary shares of 10 pence each 15,857 15,788
Movement in issued share capitalNumber of shares at 31 March 2016 157,369,287Exercise of share options – Share option schemes 513,580
Number of shares at 31 March 2017 157,882,867Exercise of share options – Share option schemes 687,707
Number of shares at 31 March 2018 158,570,574
The Company has one class of ordinary shares which carry no right to fixed income.
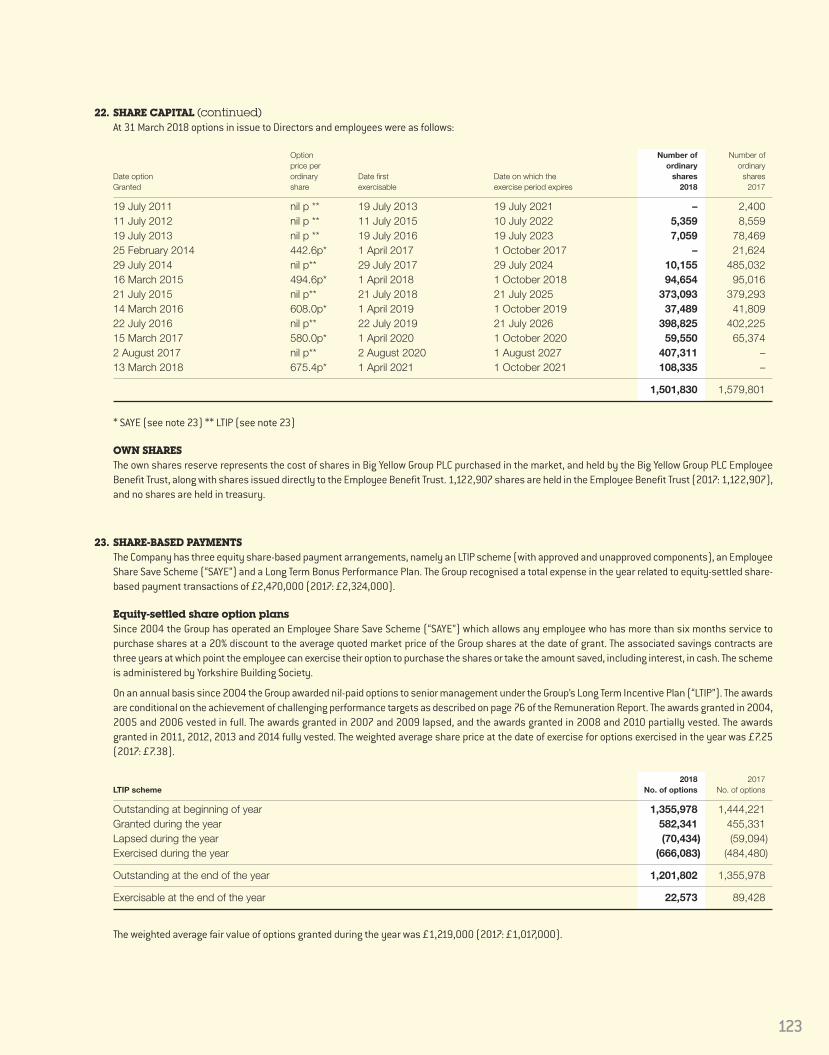
123
22. SHARE CAPITAL (continued)At 31 March 2018 options in issue to Directors and employees were as follows:
Option Number of Number of price per ordinary ordinary
Date option ordinary Date first Date on which the shares sharesGranted share exercisable exercise period expires 2018 2017
19 July 2011 nil p ** 19 July 2013 19 July 2021 – 2,40011 July 2012 nil p ** 11 July 2015 10 July 2022 5,359 8,55919 July 2013 nil p ** 19 July 2016 19 July 2023 7,059 78,46925 February 2014 442.6p* 1 April 2017 1 October 2017 – 21,62429 July 2014 nil p** 29 July 2017 29 July 2024 10,155 485,03216 March 2015 494.6p* 1 April 2018 1 October 2018 94,654 95,01621 July 2015 nil p** 21 July 2018 21 July 2025 373,093 379,29314 March 2016 608.0p* 1 April 2019 1 October 2019 37,489 41,80922 July 2016 nil p** 22 July 2019 21 July 2026 398,825 402,22515 March 2017 580.0p* 1 April 2020 1 October 2020 59,550 65,3742 August 2017 nil p** 2 August 2020 1 August 2027 407,311 –13 March 2018 675.4p* 1 April 2021 1 October 2021 108,335 –
1,501,830 1,579,801
* SAYE (see note 23) ** LTIP (see note 23)
OWN SHARESThe own shares reserve represents the cost of shares in Big Yellow Group PLC purchased in the market, and held by the Big Yellow Group PLC EmployeeBenefit Trust, along with shares issued directly to the Employee Benefit Trust. 1,122,907 shares are held in the Employee Benefit Trust (2017: 1,122,907),and no shares are held in treasury.
23. SHARE-BASED PAYMENTSThe Company has three equity share-based payment arrangements, namely an LTIP scheme (with approved and unapproved components), an EmployeeShare Save Scheme (“SAYE”) and a Long Term Bonus Performance Plan. The Group recognised a total expense in the year related to equity-settled share-based payment transactions of £2,470,000 (2017: £2,324,000).
Equity-settled share option plansSince 2004 the Group has operated an Employee Share Save Scheme (“SAYE”) which allows any employee who has more than six months service topurchase shares at a 20% discount to the average quoted market price of the Group shares at the date of grant. The associated savings contracts arethree years at which point the employee can exercise their option to purchase the shares or take the amount saved, including interest, in cash. The schemeis administered by Yorkshire Building Society.
On an annual basis since 2004 the Group awarded nil-paid options to senior management under the Group’s Long Term Incentive Plan (“LTIP”). The awardsare conditional on the achievement of challenging performance targets as described on page 76 of the Remuneration Report. The awards granted in 2004,2005 and 2006 vested in full. The awards granted in 2007 and 2009 lapsed, and the awards granted in 2008 and 2010 partially vested. The awardsgranted in 2011, 2012, 2013 and 2014 fully vested. The weighted average share price at the date of exercise for options exercised in the year was £7.25(2017: £7.38).
2018 2017LTIP scheme No. of options No. of options
Outstanding at beginning of year 1,355,978 1,444,221Granted during the year 582,341 455,331Lapsed during the year (70,434) (59,094)Exercised during the year (666,083) (484,480)
Outstanding at the end of the year 1,201,802 1,355,978
Exercisable at the end of the year 22,573 89,428
The weighted average fair value of options granted during the year was £1,219,000 (2017: £1,017,000).

Notes to the Financial Statements (continued)Year ended 31 March 2018
124
23. SHARE-BASED PAYMENTS (continued)
2018 2017Weighted Weighted
2018 average 2017 averageNo. of exercise price No. of exercise price
Employee Share Save Scheme (“SAYE”) options (£) options (£)
Outstanding at beginning of year 223,823 5.36 205,330 4.87Granted during the year 108,335 6.75 65,374 5.80Forfeited during the year (10,506) 5.89 (17,781) 5.07Exercised during the year (21,624) 4.43 (29,100) 3.07
Outstanding at the end of the year 300,028 5.91 223,823 5.36
Exercisable at the end of the year – – – –
Options outstanding at 31 March 2018 had a weighted average contractual life of 2.0 years (2017: 2.1 years).
The inputs into the Black-Scholes model for the options granted during the year are as follows:
LTIP SAYE
Expected volatility n/a 27%Expected life 3 years 3 yearsRisk-free rate 0.1% 0.1%Expected dividends 4.6% 4.6%
Expected volatility was determined by calculating the historical volatility of the Group’s share price over the year prior to grant.
Long Term bonus performance planThe Executive Directors receive awards under the Long Term Bonus Performance Plan. This is accounted for as an equity instrument. The plan was set upin July 2015. The vesting criteria and scheme mechanics are set out in the Directors’ Remuneration Report. At 31 March 2018 the weighted averagecontractual life was 0.3 years.
24. CAPITAL COMMITMENTSAt 31 March 2018 the Group had £13.7 million of amounts contracted but not provided in respect of the Group’s properties (2017: £8.6 million of capitalcommitments).
25. EVENTS AFTER THE BALANCE SHEET DATEOn 5 April 2018, the Group exchanged contracts to acquire a property in Uxbridge for a new 55,000 sq ft store.
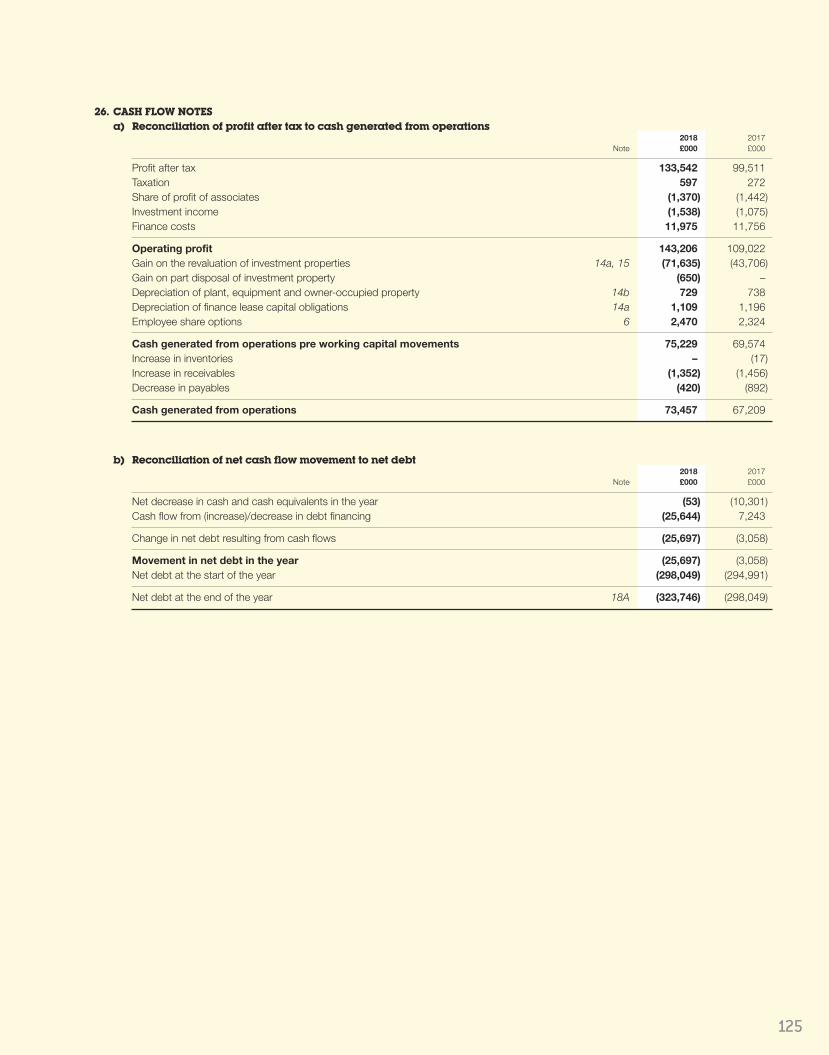
125
26. CASH FLOW NOTESa) Reconciliation of profit after tax to cash generated from operations
2018 2017Note £000 £000
Profit after tax 133,542 99,511Taxation 597 272Share of profit of associates (1,370) (1,442)Investment income (1,538) (1,075)Finance costs 11,975 11,756
Operating profit 143,206 109,022Gain on the revaluation of investment properties 14a, 15 (71,635) (43,706)Gain on part disposal of investment property (650) –Depreciation of plant, equipment and owner-occupied property 14b 729 738Depreciation of finance lease capital obligations 14a 1,109 1,196Employee share options 6 2,470 2,324
Cash generated from operations pre working capital movements 75,229 69,574Increase in inventories – (17)Increase in receivables (1,352) (1,456)Decrease in payables (420) (892)
Cash generated from operations 73,457 67,209
b) Reconciliation of net cash flow movement to net debt2018 2017
Note £000 £000
Net decrease in cash and cash equivalents in the year (53) (10,301)Cash flow from (increase)/decrease in debt financing (25,644) 7,243
Change in net debt resulting from cash flows (25,697) (3,058)
Movement in net debt in the year (25,697) (3,058)Net debt at the start of the year (298,049) (294,991)
Net debt at the end of the year 18A (323,746) (298,049)

Notes to the Financial Statements (continued)Year ended 31 March 2018
126
27. RELATED PARTY TRANSACTIONSTransactions between the Company and its subsidiaries, which are related parties, have been eliminated on consolidation and are not disclosedin this note.
Transactions with Armadillo Storage Holding Company LimitedAs described in note 14, the Group has a 20% interest in Armadillo Storage Holding Company Limited (“Armadillo 1”), and entered into transactions withArmadillo 1 during the period on normal commercial terms as shown in the table below.
Transactions with Armadillo Storage Holding Company 2 LimitedAs described in note 14, the Group has a 20% interest in Armadillo Storage Holding Company 2 Limited (“Armadillo 2”), and entered into transactions withArmadillo 2 during the year on normal commercial terms as shown in the table below.
31 March 31 March2018 2017£000 £000
Fees earned from Armadillo 1 705 574Fees earned from Armadillo 2 270 253Balance due from Armadillo 1 89 86Balance due from Armadillo 2 33 48
The remuneration of the Executive and Non-Executive Directors, who are the key management personnel of the Group, is set out below in aggregate.Further information on the remuneration of individual Directors is found in the audited part of the Directors’ Remuneration Report on pages 75 to 85.
31 March 31 March2018 2017£000 £000
Short term employee benefits 1,398 1,325Post-employment benefits 154 151Share based payments 5,618 1,566
7,170 3,042
AnyJunk LimitedJames Gibson is a Non-Executive Director and shareholder in AnyJunk Limited and Adrian Lee is a shareholder in AnyJunk Limited. During the yearAnyJunk Limited provided waste disposal services to the Group on normal commercial terms, amounting to £37,000 (2017: £36,000).
No other related party transactions took place during the years ended 31 March 2018 and 31 March 2017.

130
Notes to the Financial Statements (continued)Year ended 31 March 2018
28. PROFIT/(LOSS) FOR THE YEARAs permitted by section 408 of the Companies Act 2006, the statement of comprehensive income of the Company is not presented as part of thesefinancial statements. The profit for the year attributable to equity shareholders dealt with in the financial statements of the Company was £5.3 million(2017: loss of £0.3 million).
29. BASIS OF ACCOUNTINGThe separate financial statements of the Company are presented as required by the Companies Act 2006. As permitted by that Act, the separate financialstatements have been prepared in accordance with International Financial Reporting Standards as endorsed by the EU.
The financial statements have been prepared on the historic cost basis except that derivative financial instruments are stated at fair value.
The Company’s principal accounting policies are the same as those applied in the Group financial statements. See note 23 for details of share basedpayments affecting the Company.
Going concernSee note 2 for the review of going concern for the Group and the Company.
Investment in subsidiariesThese are recognised at cost less provision for any impairment.
IFRIC 11, IFRS 2 Group and Treasury Share TransactionsThe Company makes equity settled share based payments to certain employees of certain subsidiary undertakings. Equity settled share based paymentsthat are made to the employees of the Company’s subsidiaries are treated as increases in equity over the vesting period of the award, with a correspondingincrease in the Company’s investments in subsidiaries, based on an estimate of the number of shares that will eventually vest. This is the only additionto investment in subsidiaries in the current year. The Company does not have any employees.
30. NON-CURRENT ASSETSa) Plant, equipment and owner occupied property
Fixtures,fittings
Freehold Leasehold & officeproperty improvements equipment Total
£000 £000 £000 £000
CostAt 31 March 2017 2,186 64 30 2,280Additions 8 – 23 31
At 31 March 2018 2,194 64 53 2,311
Accumulated depreciationAt 31 March 2017 (408) (20) (12) (440)Charge for the year (42) (1) (13) (56)
At 31 March 2018 (450) (21) (25) (496)
Net book valueAt 31 March 2018 1,744 43 28 1,815
At 31 March 2017 1,778 44 18 1,840

131
30. NON-CURRENT ASSETS (continued)b) Investments in subsidiary companies
Investment insubsidiary
undertakings£000
CostAt 31 March 2017 18,020Additions 2,470
At 31 March 2018 20,490
The Group subsidiaries are all wholly-owned, the Group holds 100% of the voting power and the companies are incorporated, registered and operatein England and Wales. The registered office of all subsidiaries is 2 The Deans, Bridge Road, Bagshot, Surrey, GU19 5AT. The subsidiaries at 31 March2018 are listed below:
Name of subsidiary Principal activity
.Big Yellow Self Storage (GP) Limited General Partner
.Big Yellow Self Storage Company Limited Self storageBig Yellow (Battersea) Limited Self storageThe Big Yellow Construction Company Limited Construction managementThe Big Yellow Holding Company Limited Holding CompanyBig Yellow Limited Partnership Self storageBig Yellow Nominee No. 1 Limited DormantBig Yellow Nominee No. 2 Limited DormantBig Yellow Self Storage (Chester) Limited Application to strike offBig Yellow Self Storage Company 1 Limited DormantBig Yellow Self Storage Company 2 Limited DormantBig Yellow Self Storage Company 3 Limited DormantBig Yellow Self Storage Company 4 Limited DormantBig Yellow Self Storage Company 8 Limited Self storageBig Yellow Self Storage Company A Limited Self storageBig Yellow Self Storage Company M Limited Self storageBYRCo Limited Property managementBYSSCo A Limited DormantBYSSCo Limited Self storageKator Storage Limited Self storageThe Last Mile Company Limited Holding CompanyLock & Leave Limited Self storageLock & Leave (Twickenham) Limited Self storage
In addition the Group has a 100% interest in Pramerica Bell Investment Trust Jersey, a trust registered in Jersey.
Audit exemption statementFor its most recent year end the companies listed below were entitled to exemption from audit under section 479A of the Companies Act 2006 relatingto subsidiary companies. The members of these companies have not required them to obtain an audit of their financial statements for the year ended31 March 2018.
.Big Yellow Self Storage (GP) Limited Big Yellow Self Storage Company 8 LimitedThe Big Yellow Construction Company Limited BYRCo LimitedBig Yellow Holding Company Limited BYSSCo LimitedBig Yellow Nominee No. 1 Limited BYSSCo A LimitedBig Yellow Nominee No. 2 Limited Kator Storage LimitedBig Yellow Self Storage Company 1 Limited The Last Mile Company LimitedBig Yellow Self Storage Company 2 Limited Lock & Leave LimitedBig Yellow Self Storage Company 3 Limited Lock & Leave (Twickenham) LimitedBig Yellow Self Storage Company 4 Limited

132
Notes to the Financial Statements (continued)Year ended 31 March 2018
31. TRADE AND OTHER RECEIVABLES31 March 31 March
2018 2017£000 £000
Amounts owed by Group undertakings 470,597 481,188Prepayments and accrued income 119 106
470,716 481,294
Amounts owed by Group undertakings are unsecured and are repayable on demand. The Company recharges its external interest cost to its subsidiaries.
32. TRADE AND OTHER PAYABLES31 March 31 March
2018 2017£000 £000
CurrentOther payables 3,247 2,992Accruals and deferred income 292 145
3,539 3,137
33. BANK BORROWINGS AND FINANCIAL INSTRUMENTS
Interest rate derivativesThe Company has one interest rate swap in place at the year end; £30 million fixed at 0.4% (excluding the margin on the underlying debt instrument)until October 2021. The floating rate at 31 March 2018 was paying a margin of 1.25% above one month LIBOR, the fixed rate debt was paying a margin of1.25%. The Group’s policy on risk management is set out in the Report on Corporate Governance on page 62 and in note 18.
31 March 31 March2018 2017£000 £000
Bank borrowings 173,000 145,000Unamortised loan arrangement fees – (1,365)
173,000 143,635
Maturity profile of financial liabilities2018 2017
Financial Financialliabilities liabilities
£000 £000
Between one and two years – –Between two and five years 173,000 145,000
Gross financial liabilities 173,000 145,000
The fair value of interest rate derivatives at 31 March 2018 was an asset of £751,000 (2017: asset of £297,000). See note 18 for detail of the interest rateprofile of financial liabilities.

133
34. FINANCIAL INSTRUMENTSThe disclosure relating to the Company’s financial instruments are detailed in note 18 to the Group financial statements. These disclosures are relevantto the Company’s bank borrowings and derivative financial instruments. In addition, the Company has trade and other payables of £3,539,000 in thecurrent year (of which the financial liability is £292,000 (2017: £3,137,000, of which the financial liability was £145,000), which are held at amortisedcost in the financial statements.
35. RELATED PARTY TRANSACTIONSIncluded within these financial statements are amounts owing from Group undertakings of £470,597,000 (2017: £481,188,000), including intercompanyinterest receivable of £5,101,000 (2017: £3,585,000) and dividends receivable of £5,749,000 (2017: £nil).
36. NOTES TO THE COMPANY CASH FLOW STATEMENT
Reconciliation of profit after tax to cash generated from operations2018 2017£000 £000
Profit/(loss) after tax 5,298 (339)Investment income (10,850) (3,585)Finance costs 4,647 2,975
Operating profit (905) (949)Depreciation 56 53Decrease in receivables 10,578 46,831Decrease in payables 427 (73)
Cash generated from operations 10,156 45,862
37. GLOSSARY
Adjusted eps Adjusted profit after tax divided by the diluted weighted average number of shares in issue during the period.
Adjusted NAV EPRA NAV adjusted for an investment property valuation carried out at purchasers’ costs of 2.75%.
Adjusted Profit Before Tax The Company’s pre-tax EPRA earnings measure with additional Company adjustments.
Average net achieved rent per sq ft Storage revenue divided by average occupied space over a defined period.
BREEAM An environmental rating assessed under the Building Research Establishment’s Environmental AssessmentMethod.
Carbon intensity Carbon emissions divided by the Group’s average occupied space.
Closing net rent per sq ft Annual storage revenue generated from in-place customers divided by occupied space at the balance sheet date.
Debt Long-term and short-term borrowings, as detailed in note 19, excluding finance leases and debt issue costs.
Earnings per share (eps) Profit for the period attributable to equity shareholders divided by the average number of shares in issue duringthe period.
EBITDA Earnings before interest, tax, depreciation and amortisation.
EPRA The European Public Real Estate Association, a real estate industry body. This organisation has issued Best PracticeRecommendations with the intention of improving the transparency, comparability and relevance of the publishedresults of listed real estate companies in Europe.
EPRA earnings The IFRS profit after taxation attributable to shareholders of the Company excluding investment propertyrevaluations, gains/losses on investment property disposals and changes in the fair value of financial instruments.
EPRA earnings per share EPRA earnings divided by the average number of shares in issue during the period.
EPRA NAV per share EPRA NAV divided by the diluted number of shares at the period end.
EPRA net asset value IFRS net assets excluding the mark-to-market on interest rate derivatives effective cash flow as deferred taxationon property valuations where it arises. It is adjusted for the dilutive impact of share options.
EPRA NNNAV The EPRA NAV adjusted to reflect the fair value of debt and derivatives and to include deferred taxation onrevaluations.
Equity All capital and reserves of the Group attributable to equity holders of the Company.

Notes to the Financial Statements (continued)Year ended 31 March 2018
134
37. GLOSSARY (continued)
Gross property assets The sum of investment property and investment property under construction.
Gross value added The measure of the value of goods and services produced in an area, industry or sector of an economy.
Income statement Statement of Comprehensive Income.
Interest cover The ratio of operating cash flow excluding working capital movements divided by interest paid (before exceptionalfinance costs, capitalised interest and changes in fair value of interest rate derivatives). This metric is providedto give readers a clear view of the Group’s financial position.
Like-for-like occupancy Excludes the closing occupancy of new stores acquired or opened in the current period.
Like-for-like revenue Excludes the impact of new stores acquired or opened in the current or preceding financial year in both the currentyear and comparative figures. This excludes Nine Elms and Twickenham 2 (both acquired in April 2016) andGuildford Central (opened in March 2018).
LTV (loan to value) Net debt expressed as a percentage of the external valuation of the Group’s investment properties.
Maximum lettable area (MLA) The total square foot (sq ft) available to rent to customers.
Move-ins The number of customers taking a storage room in the defined period.
Move-outs The number of customers vacating a storage room in the defined period.
NAV Net asset value.
Net debt Gross borrowings less cash and cash equivalents.
Net initial yield The forthcoming year’s net operating income expressed as a percentage of capital value, after adding notionalpurchaser’s costs.
Net promoter score (NPS) The Net Promoter Score is an index ranging from -100 to 100 that measures the willingness of customers torecommend a company’s products or services to others. The Company measures NPS based on surveys sent toall of its move-ins and move-outs.
Net rent per sq ft Storage revenue generated from in place customers divided by occupancy.
Occupancy The space occupied by customers divided by the MLA expressed as a %.
Occupied space The space occupied by customers in sq ft.
Pipeline The Group’s development sites.
Property Income Distribution (PID) A dividend, generally subject to withholding tax, that a UK REIT is required to pay from its tax exempt propertyrental business and which is taxable for UK-resident shareholders at their marginal tax rate.
REIT Real Estate Investment Trust. A tax regime which in the UK exempts participants from corporation tax both on UKrental income and gains arising on UK investment property sales, subject to certain conditions.
REVPAF Total store revenue divided by the average maximum lettable area in the year.
Store EBITDA Store earnings before interest, tax, depreciation and amortisation.
Total shareholder return (TSR) The growth in value of a shareholding over a specified period, assuming dividends are reinvested to purchaseadditional units of shares.