notice - office of international programs · notice the federal highway ... in the united states....
TRANSCRIPT


N O T I C E
The Federal Highway Administration provides high-quality information to serve Government,industry, and the public in a manner that promotes public understanding. Standards
and policies are used to ensure and maximize the quality, objectivity, utility, and integrityof its information. FHWA periodically reviews quality issues and adjusts its programs
and processes to ensure continuous quality improvement.

1. Report No.
FHWA-PL-05-0012. Government Accession No. 3. Recipient’s Catalog No.
Technical Report Documentation Page
4. Title and SubtitleTransportation Performance Measures in Australia, Canada, Japan, and New Zealand
7. Author(s) Douglas MacDonald, Connie Yew, Robert Arnold, John Baxter,Randall Halvorson, Hal Kassoff, Michael Meyer, Ken Philmus, JeffreyPrice, Douglas Rose, Michael Walton, William White9. Performing Organization Name and Address
American Trade InitiativesP.O. Box 8228Alexandria, VA 22306-8228
12. Sponsoring Agency Name and Address
Office of International ProgramsOffice of PolicyFederal Highway AdministrationU.S. Department of TransportationAmerican Association of State Highway and Transportation Officials
5. Report Date
December 20046. Performing Organization Code
8. Performing Organization Report No.
10. Work Unit No. (TRAIS)
11. Contract or Grant No.
DTFH61-99-C-005
13. Type of Report and Period Covered
14. Sponsoring Agency Code
15. Supplementary Notes
FHWA COTR: Hana Maier, Office of International Programs
16. Abstract
A trend toward greater public accountability in decisionmaking over the past decade has led many U.S.agencies to adopt performance measurement programs. The Federal Highway Administration, AmericanAssociation of State Highway and Transportation Officials, and National Cooperative Highway ResearchProgram sponsored a scanning study of how agencies in Australia, Canada, Japan, and New Zealand useperformance measures in transportation planning and decisionmaking.
The U.S. delegation found that transportation agencies in the countries visited use performance measuresfor setting priorities and making investment and management decisions to a greater extent than is typicalin the United States. The team observed the most impressive application of performance management inroad safety, where it was used to identify strategies to reduce fatalities. Agencies also used performancemeasurement to provide greater accountability and visibility to the public and elected decisionmakers.
The scanning team’s recommendations for U.S. application include encouraging States to implement bestpractices on safety performance measurement. The team also recommends developing a data exchangeand warehousing consortium for benchmarking performance among participating States, and conductingfurther research on performance measurement-related topics.
17. Key Words
performance measures, transportation decisionmak-ing, safety, fatality reduction, congestion, mobility,benchmarking
18. Distribution Statement
No restrictions. This document is available to thepublic from the: Office of International Programs,FHWA-HPIP, Room 3325, U.S. Department ofTransportation, Washington, DC [email protected]
19. Security Classify. (of this report)
Unclassified20. Security Classify. (of this page)
Unclassified21. No. of Pages
10822. Price
Free
Form DOT F 1700.7 (8-72) Reproduction of completed page authorized

Transportation PerformanceMeasures in Australia,Canada, Japan,and New ZealandPrepared by the International Scanning Study Team:
Douglas MacDonaldWashington State DOTCo-Chair
Connie P. YewFHWACo-Chair
Robert ArnoldFHWA
John R. BaxterFHWA
Randall K. HalvorsonMinnesota DOT
Hal KassoffParsons Brinckerhoff
Michael MeyerGeorgia Institute of TechnologyReport Facilitator
Ken PhilmusPort Authority of New York and NewJersey
T. Jeffrey PriceVirginia DOT
Douglas R. RoseMaryland State HighwayAdministration
C. Michael WaltonUniversity of Texas at Austin
William R. WhiteFHWA
Transportation Performance Measures iii
F H W A I N T E R N A T I O N A L T E C H N O L O G Y S C A N N I N G P R O G R A M
andAmerican Trade Initiatives, Inc.LGB & Associates, Inc.
for the Federal Highway Administration, U.S. Department of Transportationand the American Association of State Highway and Transportation Officials
National Cooperative Highway Research Program (Panel 20-36)of the Transportation Research Board
December 2004

FHWA InternationalTechnologyExchange ProgramT he Federal Highway Administration’s (FHWA)
Technology Exchange Program assesses and evalu-ates innovative foreign technologies and practices
that could significantly benefit U.S. highway transporta-tion systems. This approach allows for advanced technol-ogy to be adapted and put into practice much more effi-ciently without spending scarce research funds to recre-ate advances already developed by other countries.
The main channel for accessing foreign innovations isthe International Technology Scanning Program. Theprogram is undertaken jointly with the AmericanAssociation of State Highway and TransportationOfficials (AASHTO) and its Special Committee onInternational Activity Coordination in cooperation withthe Transportation Research Board’s NationalCooperative Highway Research Program Project 20-36“Highway Research and Technology—InternationalInformation Sharing,” the private sector, and academia.
FHWA and AASHTO jointly determine priority topics forteams of U.S. experts to study. Teams in the specificareas being investigated are formed and sent to countrieswhere significant advances and innovations have beenmade in technology, management practices, organiza-tional structure, program delivery, and financing.Scanning teams usually include representatives fromFHWA, State departments of transportation, local govern-ments, transportation trade and research groups, the pri-vate sector, and academia.
After a scan is completed, team members evaluate find-ings and develop comprehensive reports, including rec-ommendations for further research and pilot projects toverify the value of adapting innovations for U.S. use.Scan reports, as well as the results of pilot programs andresearch, are circulated throughout the country to Stateand local transportation officials and the private sector.
Since 1990, FHWA has organized more than 60 interna-tional scans and disseminated findings nationwide ontopics such as pavements, bridge construction and main-tenance, contracting, intermodal transport, organization-al management, winter road maintenance, safety, intelli-gent transportation systems, planning, and policy.
The International Technology Scanning Program hasresulted in significant improvements and savings in roadprogram technologies and practices throughout theUnited States. In some cases, scan studies have facilitat-ed joint research and technology-sharing projects withinternational counterparts, further conserving resourcesand advancing the state of the art. Scan studies have alsoexposed transportation professionals to remarkableadvancements and inspired implementation of hundredsof innovations. The result: large savings of research dol-lars and time, as well as significant improvements in theNation’s transportation system.
For a complete list of International Technology ScanningProgram topics and to order free copies of the reports,please see the list contained in this publication and at www.international.fhwa.dot.gov, or e-mail [email protected].
Transportation Performance Measures v

vi
FHWA InternationalTechnologyExchange ReportsInternational Technology Scanning Program:Bringing Global Innovations to U.S. Highways
SafetyTraffic Safety Information Systems in Europe andAustralia (2004)
Signalized Intersection Safety in Europe (2003)
Managing and Organizing Comprehensive HighwaySafety in Europe (2003)
European Road Lighting Technologies (2001)
Commercial Vehicle Safety, Technology, and Practice in Europe (2000)
Methods and Procedures to Reduce Motorist Delays in European Work Zones (2000)
Innovative Traffic Control Technology and Practice in Europe (1999)
Road Safety Audits—Final Report and Case Studies (1997)
Speed Management and Enforcement Technology:Europe and Australia (1996)
Safety Management Practices in Japan, Australia, and New Zealand (1995)
Pedestrian and Bicycle Safety in England, Germany, and the Netherlands (1994)
Planning and EnvironmentTransportation Performance Measures in Australia,Canada, Japan, and New Zealand (2004)
European Right-of-Way and Utilities Best Practices (2002)
Geometric Design Practices for European Roads (2002)
Wildlife Habitat Connectivity Across European Highways (2002)
Sustainable Transportation Practices in Europe (2001)
Recycled Materials In European Highway Environments (1999)
European Intermodal Programs: Planning, Policy, and Technology (1999)
National Travel Surveys (1994)
Policy and InformationEuropean Practices in Transportation WorkforceDevelopment (2003)
Intelligent Transportation Systems and WinterOperations in Japan (2003)
Emerging Models for Delivering TransportationPrograms and Services (1999)
All publications are available on the Internet at www.international.fhwa.dot.gov
National Travel Surveys (1994)
Acquiring Highway Transportation Information fromAbroad (1994)
International Guide to Highway TransportationInformation (1994)
International Contract Administration Techniques for Quality Enhancement (1994)
European Intermodal Programs: Planning, Policy, and Technology (1994)
OperationsSuperior Materials, Advanced Test Methods, andSpecifications in Europe (2004)
Freight Transportation: The Latin American Market(2003)
Meeting 21st Century Challenges of System PerformanceThrough Better Operations (2003)
Traveler Information Systems in Europe (2003)
Freight Transportation: The European Market (2002)
European Road Lighting Technologies (2001)
Methods and Procedures to Reduce Motorist Delays in European Work Zones (2000)
Innovative Traffic Control Technology and Practice in Europe (1999)
European Winter Service Technology (1998)
Traffic Management and Traveler Information Systems (1997)
European Traffic Monitoring (1997)
Highway/Commercial Vehicle Interaction (1996)
Winter Maintenance Technology and Practices—Learning from Abroad (1995)
Advanced Transportation Technology (1994)
Snowbreak Forest Book—Highway SnowstormCountermeasure Manual (1990)
Infrastructure—GeneralEuropean Practices in Transportation WorkforceDevelopment (2003)
Contract Administration: Technology and Practice in Europe (2002)
European Road Lighting Technologies (2001)
Geometric Design Practices for European Roads (2001)
Geotechnical Engineering Practices in Canada andEurope (1999)
Geotechnology—Soil Nailing (1993)
Infrastructure—PavementsPavement Preservation Technology in France, SouthAfrica, and Australia (2003)
Recycled Materials In European Highway Environments (1999)
South African Pavement and Other HighwayTechnologies and Practices (1997)
Highway/Commercial Vehicle Interaction (1996)
European Concrete Highways (1992)
European Asphalt Technology (1990)
Infrastructure—BridgesPerformance of Concrete Segmental and Cable-StayedBridges in Europe (2001)
Steel Bridge Fabrication Technologies in Europe andJapan (2001)
European Practices for Bridge Scour and StreamInstability Countermeasures (1999)
Advanced Composites in Bridges in Europe and Japan (1997)
Asian Bridge Structures (1997)
Bridge Maintenance Coatings (1997)
Northumberland Strait Crossing Project (1996)
European Bridge Structures (1995)
Transportation Performance Measures vii

viii
Executive Summary . . . . . . . . . . . . . . . . . . . . . . . . . . . . . . . . .xiiiGeneral Observations . . . . . . . . . . . . . . . . . . . . . . . . . . . . . . . . . . . . . . . . . . . .xiiiLessons for the United States . . . . . . . . . . . . . . . . . . . . . . . . . . . . . . . . . . . . . .xvImplementation Strategies and Recommendations . . . . . . . . . . . . . . . . . . . .xvii
Chapter One | Introduction . . . . . . . . . . . . . . . . . . . . . . . . . . . . .1Scan Context . . . . . . . . . . . . . . . . . . . . . . . . . . . . . . . . . . . . . . . . . . . . . . . . . . . .1Panel Composition . . . . . . . . . . . . . . . . . . . . . . . . . . . . . . . . . . . . . . . . . . . . . . . .1Organizations Visited . . . . . . . . . . . . . . . . . . . . . . . . . . . . . . . . . . . . . . . . . . . . . .1Report Organization . . . . . . . . . . . . . . . . . . . . . . . . . . . . . . . . . . . . . . . . . . . . . .1
Chapter Two | Key Findings . . . . . . . . . . . . . . . . . . . . . . . . . . . . .3Canada . . . . . . . . . . . . . . . . . . . . . . . . . . . . . . . . . . . . . . . . . . . . . . . . . . . . . . . . .3Vancouver, British Columbia . . . . . . . . . . . . . . . . . . . . . . . . . . . . . . . . . . . . . . . .5Japan . . . . . . . . . . . . . . . . . . . . . . . . . . . . . . . . . . . . . . . . . . . . . . . . . . . . . . . . . .10Australia . . . . . . . . . . . . . . . . . . . . . . . . . . . . . . . . . . . . . . . . . . . . . . . . . . . . . . .19Brisbane, Queensland . . . . . . . . . . . . . . . . . . . . . . . . . . . . . . . . . . . . . . . . . . . .20Sydney, New South Wales . . . . . . . . . . . . . . . . . . . . . . . . . . . . . . . . . . . . . . . . .30Melbourne, Victoria . . . . . . . . . . . . . . . . . . . . . . . . . . . . . . . . . . . . . . . . . . . . . .39New Zealand . . . . . . . . . . . . . . . . . . . . . . . . . . . . . . . . . . . . . . . . . . . . . . . . . . . .50
Chapter Three | Safety: From Platitudes to Performance . . . . . . .60Step 1: Understand the Problem . . . . . . . . . . . . . . . . . . . . . . . . . . . . . . . . . . .60Step 2: Establish Institutional Leadership, Responsibility,and Accountability . . . . . . . . . . . . . . . . . . . . . . . . . . . . . . . . . . . . . . . . . . . . . . .60Step 3: Define Desired Outcomes . . . . . . . . . . . . . . . . . . . . . . . . . . . . . . . . . .63Step 4: Identify Performance Indicators . . . . . . . . . . . . . . . . . . . . . . . . . . . . .63Step 5: Compare With Other Experiences . . . . . . . . . . . . . . . . . . . . . . . . . . .63Step 6: Develop and Implement a Systematic Safety Data Collectionand Analysis Process . . . . . . . . . . . . . . . . . . . . . . . . . . . . . . . . . . . . . . . . . . . . .64Step 7: Develop a Safety Plan and Integrate it into AgencyDecisionmaking . . . . . . . . . . . . . . . . . . . . . . . . . . . . . . . . . . . . . . . . . . . . . . .64Step 8: Monitor Effectiveness of Implementation Strategies and Actions . . .64
Chapter Four | Observations and Lessons Learned . . . . . . . . . . .69General Observations . . . . . . . . . . . . . . . . . . . . . . . . . . . . . . . . . . . . . . . . . . . .69Lessons for the United States . . . . . . . . . . . . . . . . . . . . . . . . . . . . . . . . . . . . . .71
Chapter Five | Implementation Strategies and Recommendations . .74
Appendix A | Scan Team Members . . . . . . . . . . . . . . . . . . . . . .76
Appendix B | Amplifying Questions . . . . . . . . . . . . . . . . . . . . . .80
Appendix C | New Zealand Transit Strategic Plan . . . . . . . . . . . . .84
Contents
p. 19
Interventions
Transport Performance,
Target Indicators
p. 22

List of Figures and Tables
Figures
Figure 1. Results chain for Transport Canada. . . . . . . . . . . . . . . . . . . . . . . . . .4
Figure 2. Relationship of performance scorecardfactors to TransLink decisions. . . . . . . . . . . . . . . . . . . . . . . . . . . . . . . . . . . . . . .8
Figure 3. Performance management in the Ministry of Land,Infrastructure, and Transportation in Japan. . . . . . . . . . . . . . . . . . . . . . . . . . .11
Figure 4. Visualization of performance data in Japan. . . . . . . . . . . . . . . . . . .14Figure 4a. Congestion on a beltway in Tokyo. . . . . . . . . . . . . . . . . . . . . . . . .14Figure 4b. Congestion on an urban arterial. . . . . . . . . . . . . . . . . . . . . . . . . . .14
Figure 5. Identification of priority locationsfor safety countermeasures in Japan. . . . . . . . . . . . . . . . . . . . . . . . . . . . . . . . .16
Figure 6. Determining consequences of projectimplementation in Japan. . . . . . . . . . . . . . . . . . . . . . . . . . . . . . . . . . . . . . . . . .18
Figure 7. Visualization of network performance data in Japan. . . . . . . . . . .19
Figure 8. Austroads’ congestion indicator for states. . . . . . . . . . . . . . . . . . . .21
Figure 9. Relationship of performance indicatorsto agency decisionmaking in Queensland. . . . . . . . . . . . . . . . . . . . . . . . . . . . .22
Figure 10. Strategic framework for road systemasset management in Queensland. . . . . . . . . . . . . . . . . . . . . . . . . . . . . . . . . . .23
Figure 11. Performance-related data for networkand route planning in Queensland. . . . . . . . . . . . . . . . . . . . . . . . . . . . . . . . . .26
Figure 11a. Route performance report. . . . . . . . . . . . . . . . . . . . . . . . . . . . . . .26Figure 11b. Network performance report. . . . . . . . . . . . . . . . . . . . . . . . . . . .27
Figure 12. Performance planning framework for the Roadsand Traffic Authority in New South Wales. . . . . . . . . . . . . . . . . . . . . . . . . . . .32
Figure 13. Rural highway performance in New South Wales. . . . . . . . . . . . .33
Figure 14. Sample presentation of asset managementinformation in New South Wales. . . . . . . . . . . . . . . . . . . . . . . . . . . . . . . . . . . .34
Figure 15. Results logic for performance monitoring usedby the New South Wales Department of Treasury. . . . . . . . . . . . . . . . . . . . . .35
Figure 16. Monitoring intersection delay in Sydney. . . . . . . . . . . . . . . . . . . .36
Figure 17. Post-construction review process in New South Wales. . . . . . . . .38
Figure 18. Role of performance measurementin corporate planning in Victoria. . . . . . . . . . . . . . . . . . . . . . . . . . . . . . . . . . . .40
Figure 19. Illustrative reporting of key DOIperformance indicators in Victoria. . . . . . . . . . . . . . . . . . . . . . . . . . . . . . . . . .42
Figure 20. Performance-based management activities at VicRoads. . . . . . . .44
Figure 21. Business plan development for VicRoads. . . . . . . . . . . . . . . . . . . .44
Figure 22. VicRoads’ safety targets. . . . . . . . . . . . . . . . . . . . . . . . . . . . . . . . . .46
Figure 23. Examples of congestion reporting in Victoria. . . . . . . . . . . . . . . .48Figure 23a. System performance measurements. . . . . . . . . . . . . . . . . . . . . .48Figure 23b. Freeway performance measurements. . . . . . . . . . . . . . . . . . . . .48
Transportation Performance Measures ix
C O N T E N T S
p. 26
p. 32
p. 34

x
C O N T E N T S
Figures (continued)
Figure 24. Role of performance measures in managementdecisionmaking in New Zealand. . . . . . . . . . . . . . . . . . . . . . . . . . . . . . . . . . . .51Figure 25. Hierarchical relationship of safetyperformance measures in New Zealand. . . . . . . . . . . . . . . . . . . . . . . . . . . . . .53Figure 26. Safety management system’s impacton planning and decisionmaking. . . . . . . . . . . . . . . . . . . . . . . . . . . . . . . . . . . .55Figure 27. Record of road fatalities in New South Wales and Victoria. . . . . .61Figure 27a. New South Wales road crash toll. . . . . . . . . . . . . . . . . . . . . . . . .61Figure 27b. Victoria road crash toll. . . . . . . . . . . . . . . . . . . . . . . . . . . . . . . . .61Figure 28. Crash research results in Victoria. . . . . . . . . . . . . . . . . . . . . . . . .62Figure 29. Ranking crash-related factors in Queensland. . . . . . . . . . . . . . . .62Figure 30. Examples of crash data comparison by VicRoads. . . . . . . . . . . . .65Figure 31. Creating road safety knowledge from data at VicRoads. . . . . . . .66Figure 32. Safety program analysis in New Zealand. . . . . . . . . . . . . . . . . . . .66Figure 33. Assessing effectiveness of implemented actions. . . . . . . . . . . . . .67Figure 33a. Effectiveness of safety actions in Queensland. . . . . . . . . . . . . . .67Figure 33b. Effectiveness of safety actions in Victoria. . . . . . . . . . . . . . . . . .67Figure 34. Impact of speed camera enforcementon road speeds in Melbourne. . . . . . . . . . . . . . . . . . . . . . . . . . . . . . . . . . . . . . .68
Tables
Table 1. Linkage among objectives, outcomes,and indicators at Transport Canada. . . . . . . . . . . . . . . . . . . . . . . . . . . . . . . . . .5Table 2. Performance measures for the BritishColumbia Ministry of Transportation. . . . . . . . . . . . . . . . . . . . . . . . . . . . . . . . .7Table 3. TransLink’s performance scorecard. . . . . . . . . . . . . . . . . . . . . . . . . . .9Table 4. Core performance indicators in Japan. . . . . . . . . . . . . . . . . . . . . . . .13Table 5. Relationship among Main Roads’ outputsand government outcomes. . . . . . . . . . . . . . . . . . . . . . . . . . . . . . . . . . . . . . . . .22Table 6. Strategic objectives and correspondingperformance measures. . . . . . . . . . . . . . . . . . . . . . . . . . . . . . . . . . . . . . .24 & 25Table 7. Maintenance program performance measures. . . . . . . . . . . . . . . . . .33Table 8. Change in performance terminology in New South Wales. . . . . . . .35Table 9. Seventeen safety challenges for VicRoads. . . . . . . . . . . . . . . . . . . . .46Table 10. Congestion measurement in Wellington. . . . . . . . . . . . . . . . . . . . .55Table 11. Relationship between asset managementand transit New Zealand’s goals. . . . . . . . . . . . . . . . . . . . . . . . . . . . . . . . . . . . .57Table 12. Comparison of different maintenancebusiness models in New Zealand. . . . . . . . . . . . . . . . . . . . . . . . . . . . . . . . . . . .58
p. 53
p. 66

Abbreviations andAcronymsAASHTO American Association of State Highway and Transportation OfficialsAHS Cruise-assist highway systemARMIS A Road Management Information SystemATC Australian Transport CouncilCRSC Community Road Safety CouncilDOI Department of InfrastructureDSRC Dedicated short-range communicationEMS Environmental management systemETC Electronic toll collectionFHWA Federal Highway AdministrationFY Fiscal yearGIS Geographic information systemGPS Global positioning systemICBC Insurance Corporation of British ColumbiaIRI International Roughness IndexISO International Organization for StandardizationITS Intelligent transportation systemLTSA Land Transport Safety AuthorityMAE Multiple account evaluationMEX Metropolitan Expressway Public CorporationMLIT Ministry of Land, Infrastructure, and TransportationMVKT Motor vehicle-kilometers traveledNHS National Highway SystemOTCI Overall track condition indexPCR Post-construction reviewPM Performance measureRAS Road asset systemRCIS Road Crash Information SystemRCMP Royal Canadian Mounted PoliceRSM Road System ManagementRSP Results and services planRTS Roads and Traffic AuthoritySCATS Sydney Coordinated Adaptive Traffic SystemSHIP Strategic Highway Infrastructure ProgramTMC Traffic management centerTransLink Greater Vancouver Transportation AuthorityTSR Temporary speed restrictionsVicRoads Roads Corporation of VictoriaVICS Vehicle information and communication system
Transportation Performance Measures xi

ExecutiveSummaryT he purpose of this international scan was to
investigate the use of performance measures intransportation planning and decisionmaking in
selected countries. Performance measures can relate to many different aspects of and be applied at differentlevels of decisionmaking, so the scan panel representeda diverse set of interests and concerns for both national and State-level decisionmaking.
The Federal Highway Administration (FHWA) and theAmerican Association of State Highway and Transpor-tation Officials (AASHTO) jointly sponsored this scan. In addition to FHWA and AASHTO officials, the panelincluded representatives of State transportation agen-cies for the States of Maryland, Minnesota, Virginia, andWashington; representatives of the International Bridge,Tunnel, and Turnpike Association and the AmericanCouncil of Engineering Companies; and two universityprofessors of transportation engineering and policy.These panel members represented diverse interests andexpertise in engineering, intelligent transportation sys-tems, policy, planning, safety, and system operations.
The scan team met with the following types of repre-sentatives during its 2.5-week study: • National ministry of transportation and other national
transportation agencies in Canada, Japan, and NewZealand.
• Provincial or state departments of transportation inBritish Columbia; Japan; and Queensland, New SouthWales, and Victoria, Australia.
• State department of infrastructure in Victoria.• Rail or transit planning organization in Vancouver,
Victoria, Queensland, and Japan.• Police in Victoria.
General ObservationsThe scan team identified 23 observations on the use ofperformance measures in the countries visited thatwould be of interest to officials in the United States.Many of these observations are of broad interest to
transportation professionals, while others might be ofinterest in a specific context. These observationsinclude the following:
1. The scan team found examples in which the process-es of setting priorities and making planning, invest-ment, and management decisions are based on, oruse, performance measures to a much greaterextent than is typical in the United States. In thosecases where performance measures were used asinput to priority setting, the process represented anew level of organizational behavior. The verticalintegration of information flow through the use ofperformance measures characterized the betterexamples of performance measurement.
2. Perhaps the most impressive application of perform-ance measurement, in terms of showing how theprocess can influence governmental policy and budg-et determinations, was in the area of road safety.Impressive results in reducing fatalities and injurieshave occurred in some of the sites the scan team vis-ited through a comprehensive program of engineer-ing, enforcement, and education.
3. A common framework to performance measurementappeared to be present in all cases the team exam-ined. Each effort was related to a broader set of goalsand objectives defined either by a legislative body orthrough a public visioning process. These goals andobjectives led to identification of transportation sys-tem-specific performance measures, often tied to tar-get values to be achieved in a future year.
4. Transportation officials appeared to have a generalunderstanding of the distinction between the con-cepts of outcomes and outputs. Outcomes wereviewed as the ultimate characteristic of transporta-tion system performance, while outputs were theproducts and services of the organizations that led tothese outcomes.
Transportation Performance Measures xiii

xiv
E X E C U T I V E S U M M A R Y
5. In each of the cases the team observed, transporta-tion officials explained the initial movement towardperformance measurement as a means of providinggreater accountability and visibility to the publicof their agency’s activities.
6. In addition to accountability and public visibility,many officials commented that performance meas-urement can be used to educate elected decision-makers and the general public on the role thattransportation plays in society and/or the need foradditional investment.
7. Performance measurement was applied at severaldifferent levels of planning and decisionmaking.For example, many measures were targeted atstrategic investment decisions relating to long-termimprovements to the transportation system. Inother cases, performance measures were used tomanage network operations.
8. In Japan, the national ministry established a coreset of 17 performance measures as a guide for allregional offices and prefectures (states) in thecountry. This was an example of a phenomenoncommon to all applications—the need and desire todetermine a small set of measures that were reallyimportant to an agency.
9. All of the sites visited used measures commonlyused in the United States. Road network conges-tion was a transportation system measure found inall of the performance measurement applicationsexamined. Officials often viewed this as one of theimportant issues facing their region and agency.Other network measures related to accessibilityand mobility provided by the transportation sys-tem, road safety, travel time, and trip reliability.
10. Environmental measures were also present in all ofthe performance measurement efforts examined.The scan team noted that of all the performancemeasurement categories it examined, the environ-mental measurement category created the greatestchallenge for transportation agencies.
11. Measures of customer satisfaction were found in allof the sites visited. The measures most often relat-ed to the average scores obtained from public sur-
veys. Also, New Zealand’s approach to customersatisfaction measures focused on identifying issuescausing customer dissatisfaction and targeting orga-nizational action to deal with the issues.
12. Measures relating to transportation system securitywere not found in any performance measurementexamples. In many ways, this was viewed as anAmerican issue, although transportation officials inQueensland and New South Wales did say thatsecurity was becoming a more important issue andthat some form of a security indicator most likelywould be incorporated into their performance man-agement regime in the future.
13. Many performance measurement applications tar-geted rural transportation network performance asa specific category for measurement. This was par-ticularly true in Australia, where each state has onemajor urban area dominating the economy. Thiswas viewed primarily as a regional equity issue.
14. The level of integrated data collection strategies asthey related to performance measurement variedfrom one site to another. Some of the more suc-cessful performance measurement programsoccurred in data-rich environments with a historyof strong data collection and analysis.
15. Before-and-after studies were important elementsof the performance measurement systems in Japanand Australia. Each performance measurement casein the scan countries paid considerable attention todiscovering what impacts adopted or implementedactions have had on selected performance meas-ures. The results of these studies act as feedback tothe decisionmaking process and help determinelikely results to similar actions in other areas.
16. Graphic (and visual) presentation of performanceresults was viewed as a key component of the per-formance management process, as was identifica-tion of measures that the public can relate to. Mostofficials involved in managing the performancemeasurement efforts stated that unless top deci-sionmakers understand the information presentedto them, the efforts will be ineffective. Visualizationof information is thus critical to successful perform-ance measurement.

Transportation Performance Measures xv
17. Benchmarking against peer organizations and juris-dictions was used in Japan, Australia, and NewZealand to understand key factors that distin-guished economic and transportation performanceamong states. This benchmarking was used as ascreening tool to identify differences (in both quan-tity per capita and relative ranking), which then ledto a more detailed examination of why those differ-ences occurred.
18. The key measure of success for performance meas-urement itself is the degree to which it influencesdecisions and budget allocation. This was a diffi-cult linkage to pin down during the scan study. Themost advanced application appeared to be inQueensland and Victoria, where the performancemeasurement process was important for determin-ing program priorities for safety actions.
19. The team found few examples in which perform-ance measurement resulted in multimodal invest-ment tradeoffs. In most cases, performance meas-urement is implemented within a modally focusedagency, so performance measures were targeted atdecisions relating to the performance of that modalnetwork.
20. Measures relating to freight movement were foundin many performance measurement efforts.Examples include commercial trucking travel timebetween economic gateways (British Columbia);mode split for goods movement (Vancouver);increase in average annual truck payload capacity,percent of illegally overloaded trucks, and freightrail delays and travel time variability (Queensland);and freight productivity, access to ports, freightrates, freight-related infrastructure condition, andeffects of congestion on freight movement(Victoria).
21. Organizational productivity measures were foundin all of the performance measurement applica-tions. Agency managers viewed them as a criticalelement of the performance measurement exercisein that they indicated the degree to which theiragency was delivering the products and servicesneeded to meet other performance objectives.
22. Monitoring project delivery through the use of
performance measures was also a commonapproach at most of the sites visited. An interest-ing aspect of this project delivery monitoring wasthe effort to assess project performance againstproject expectations.
23. In cases where performance management was mostsuccessfully institutionalized within agency opera-tions, top management leadership and commit-ment to the process of development and continu-ous use was essential to get performance measure-ment past its infancy. This was particularly impor-tant for agencies where the organizational cultureand even the culture of the society itself were notconducive to the concept of open and responsiveperformance-based planning and decisionmaking.
Lessons for the United StatesSimilar to the scan team observations, a large numberof “lessons learned” came out of this scan. The mostsignificant are described below:
1. Safety was viewed as a strategic use of performancemeasurement that has resulted in a significantdecline in fatalities. A great deal can be learned fromthis application of performance measurement, espe-cially as it relates to the identification of strategiesand actions that need to be put in place to achievereductions in road fatalities.
2. Meaningful performance measurement is a productof extensive outreach, discussion, and collaborationwith partners. Performance measures are readilyavailable and easy to create, but without a compre-hensive (internal and external) outreach processtheir value as a behavioral influencer is limited.Open, inclusive planning processes are fundamentalto good performance measurement.
3. In the best examples of performance measurement,officials were still refining what measures to use,and how to make sense of the political guidancethey received. This suggested that performance-based planning and decisionmaking are never-endingprocesses, and must be viewed as such by top agencyofficials. This also implied that an agency should notmeasure too many objectives; it should measure onlywhat is needed to make business decisions. Toomany measures can be a burden on staff.

xvi
E X E C U T I V E S U M M A R Y
4. The key to success for measurement is accounta-bility. This translates into the need for understand-able measures and systematic followthrough todetermine the level of failure or success in meetingthe objectives defined by the measures. This issueis important across all transportation areas, buthas particular short-term relevance and applicationin the safety area.
5. Performance measurement is most relevant whenlinked to decisionmaking, especially resource allo-cation. Elements to consider include allocation offunding at the program and project levels, multi-modal tradeoffs, and distributional equity. A multi-modal approach is best, although the scan teamfound few examples of such an approach.Performance measures position an agency well toengage in debate, but are not necessarily the deter-mining factor in a decision, especially in the legisla-tive arena. Measures sharpen and focus the debate,and help clarify organizational direction.
6. Quality systems have been put in place and appearto be replacing externally defined quality criteria(e.g., ISO 9000). Many are redefining quality andfinding that the International Organization forStandardization (ISO) process does not meet theirneeds.
7. For safety, enforcement strategies were the key tochanging driving behavior and affecting overallsuccess. The best-case examples go beyond themandatory use of seatbelts (alcohol testing andspeed enforcement) and are succeeding at reducingfatalities. In addition, engineering strategies are animportant element of an overall safety program,resulting in significant short- and long-termimprovements.
8. Analysis is an important underpinning for settingtargets and determining the effectiveness of actionsto reach these targets. The scan team found a muchgreater use of benefit-cost analysis to determine thedesirability of projects, and a desire to determineafter the project was implemented whether the ini-tial analysis was close to the resulting performance.
9. Customer surveys are an important element ofdetermining organizational performance, if done
appropriately and in a valid manner. Many coun-tries appeared to be most successful at getting use-ful data from customer surveys by asking morefocused questions on specific aspects of transporta-tion system performance. Many survey effortsfocused on getting feedback from users on whatshould be changed and how it should be changed.
10. A strong linkage exists between performancemeasurement and asset management in Australiaand New Zealand. In both countries, scan partici-pants found that transportation officials have amuch better handle on the changing value of theirasset base than most transportation agencies in theUnited States. The team believes the U.S. trans-portation community could learn from these exam-ples of how to better link asset value to decision-making via performance measurement.
11. Although all of the sites the team visited professedconcern about environmental quality, all found itdifficult to come up with area-wide environmentalmeasures. This was the most disappointing aspectof the site visits for the team. New Zealand faces asignificant challenge because recent legislationrequires the national transportation agency to rede-fine its mission in the context of sustainability, orhow its actions will contribute to a more sustain-able land transport system for the country. Theresulting actions over the next six months will beworth watching.
12. Do not measure too many things. The most impor-tant measures are those needed to influence budgetallocations and investment decisionmaking. In situ-ations where large numbers of performance meas-ures were considered, lack of focus resulted in littleinfluence on the decisionmaking process.
13. Post evaluations/assessments should be part of per-formance measurement. In many cases in the UnitedStates, little effort is made to determine the afteref-fects of transportation investment. One of the sur-prising results of this scan was the widespread use ofbefore-and-after studies as a means of determiningthe effectiveness of implemented actions.
14. Performance measurement is a complex, evolvingarea of opportunity. The U.S. transportation

Transportation Performance Measures xvii
industry is advanced in many areas of performancemeasurement, but still has much to learn. The scanteam believes a coordinated, structured approach to sharing and advancing in the performance measurement area would serve the U.S. transportation industry well. This approach should emphasize the business model approach to assessing performance.
Implementation Strategies andRecommendationsThe timing of this scan is most conducive to implemen-tation of the scan results because many opportunitiesexist for disseminating them. For example, the resultswere reported to several AASHTO committees during2004, including the Standing Committee on Quality inApril, the Standing Committee on Planning in May, andothers at the annual meeting in September.
The team has developed the following preliminary rec-ommendations on further activities that should followfrom the scan:
1. National emphasis area demonstration on safety(FHWA). The most integrated and impressive appli-cation of a performance measurement framework thescan team observed was in the area of safety. Theteam believes that the Australian model and the sig-nificant results achieved in the safety area are wor-thy of sharing and ultimately implementing in theUnited States. Two safety implementation strategiesare recommended:• Bring Australian safety leaders to the United States
to tell their story to key groups.• Encourage States to implement the best practices
learned.
2. Data exchange and warehousing consortium forbenchmarking (AASHTO). Develop an action plan toinitiate a data exchange and warehousing consortiumfor benchmarking performance among participatingStates. The goal is to export State-level performancedata to an external source for the purpose of compar-ing performance in a variety of service areas.
3. Performance measure (PM) research. Initiateresearch and disseminate findings (through FHWAand AASHTO) on several performance measurement-related topics:
• Monetizing PMs—Initiate a study on convertingmeasures into cost-based numbers and targets byidentifying the cost and/or the benefit of providingthe improvement on a monetary basis.
• Interrelationship of PMs—Initiate a study on thecause-and-effect impacts between PMs that exam-ines the correlation between improving possiblycompeting transportation attributes.
• Multimodal tradeoffs—Initiate a study on the inter-relationship between modal PMs. The study wouldexpand on the “interrelationship” issue to includetradeoffs between modes.
• Outcome/output empirical relationships—Initiate astudy on translating output indicators to outcomeconsequences.
4. Training (National Highway Institute) or guidancepapers (AASHTO). Develop performance measure-ment courses and instruction aimed at executiveand midlevel leadership. Topics could include thefollowing:• Development and use of performance measures• Outsourcing of products and services• Best practices
5. Stand-alone overview document on the scan team’sfindings related to congestion and reliability per-formance measures. Develop a resource documenton international and domestic practices on measur-ing congestion and reliability. Related publicationscould include an abbreviated pamphlet for distribu-tion at conferences and meetings.
6. Conferences and meetings. Plan, develop, andimplement conferences and meetings specificallyoriented to presenting the scan findings and recommendations to a variety of transportation professionals.
7. Technical guidance. Develop and distribute throughAASHTO, FHWA, and other stakeholder organiza-tions guidance on various secondary PM topics:• Auditable PMs—Provide PM design and tracking
methodology for developing verifiable measurenumbers and associated impacts.
• Before-and-after analysis—Prepare best-practicematerials on this type of analysis. This would beon implemented actions and their relationship toperformance measurement improvement.

xviii
8. Presentations of findings from the scan at appro-priate regional and national meetings and confer-ences throughout the United States over the nextyear. Candidate venues include AASHTO annual,committee, subcommittee, task force, and regionalorganization meetings; Transportation ResearchBoard annual and committee meetings; and meet-ings of organizations such as the Institute ofTransportation Engineers, Association ofMetropolitan Planning Organizations, and theInternational Bridge, Tunnel, and TurnpikeAssociation.
9. Web-based distribution of materials. Investigateand select a logical Web-based home for the materi-als emanating from the scan, including reports, pre-sentations, and implementation actions. Optionsinclude AASHTO, FHWA, or a university.
10. Followup review on the sustainability concept.New Zealand is attempting to incorporate sustain-ability into transportation decisionmaking. At thetime of the scan, the national transport agency wassix months away from proposing how it wouldincorporate sustainability goals into its perform-ance measurement system. The team recommendsthat a Transit New Zealand official be invited to theUnited States after the agency implements the pro-posal to discuss the topic.

Atrend toward greater public accountability andtransparency in decisionmaking has been an impor-tant characteristic of U.S. transportation planning,
decisionmaking, and organizational management overthe past 10 years. One way this has been accomplishedis through the use of performance measures—indicatorsof transportation system and organizational performancethat provide decisionmakers with a sense of whethertheir decisions are improving transportation system per-formance or organizational productivity. By monitoringsuch indicators, other officials, legislators, and the gener-al public can also follow the continuing efforts of trans-portation agencies to improve the performance of thetransportation system.
Scan ContextThis international scan investigated the best-case use ofperformance measures in transportation planning anddecisionmaking around the world. Lessons from thisscan can help U.S. transportation professionals betterunderstand how performance measures could be usedto enhance the effectiveness of decisionmaking andorganizational management in Federal, State, regional,and local transportation agencies.
This scan was timely because many transportation offi-cials are thinking about ways to get the best use of thelimited funds available for investment. In addition, thetransportation profession is devoting considerableattention to how performance measures can improvethe technical foundation for decisionmaking (e.g., asecond national conference on performance measureswas held four months after the scan).
Panel CompositionPerformance measures can relate to many differentaspects of, as well as be applied at, different levels ofdecisionmaking. The scan panel, therefore, represent-ed a diverse set of interests and concerns for nationaland State-level transportation decisions.
In addition to representatives from the FederalHighway Administration (FHWA) and the American
Association of State Highway and TransportationOfficials (AASHTO), the panel included officials fromState transportation agencies in Maryland, Minnesota,Virginia, and Washington; representatives of theInternational Bridge, Tunnel, and Turnpike Associationand the American Council of Engineering Companies;and university professors of transportation engineeringand policy.
These panel members represented a diverse set ofinterests and expertise in the areas of engineering,intelligent transportation systems, policy, planning,safety, and system operations (see Appendix A). FHWAand AASHTO jointly sponsored this scan.
Organizations VisitedThe scan team met with the following types of repre-sentatives during its 2.5-week study in Australia,Canada, Japan, and New Zealand: • National ministry of transportation and other nation-
al transportation agencies in Canada, Japan, and NewZealand
• Provincial or state departments of transportation inBritish Columbia, Japan, and the Australian states ofQueensland, New South Wales, and Victoria
• State department of infrastructure in Victoria,Australia
• Rail or transit planning organization in Vancouver,British Columbia; Victoria and Queensland,Australia; and Japan
• Police agency in Victoria, Australia
Given the limited time available to the scan team, sev-eral important stakeholders in performance manage-ment were not part of the meetings. For example, theteam did not meet with representatives from civic,shipper, freight handler, or environmental groups, eachof which could have an important role in influencingthe development and use of a performance measure-ment system.
Report OrganizationBefore the scan, the team sent a set of amplifying ques-
Transportation Performance Measures 1
C H A P T E R O N E
Introduction
2
tions to those on the itinerary to clarify the types ofinformation desired. These amplifying questions are inAppendix B.
Chapter Two of this report presents the informationgathered from the four countries visited, in the orderof the scan team’s visits. Thus, the chapter discussesthe results of the British Columbia visit, followed byJapan, Australia, and New Zealand. The decision tovisit these countries was based on professional com-munications, literature reviews, and Web searches, andeach presented a unique experience with performancemeasurement that would be of interest to the U.S.transportation community.
Chapter Three focuses on the use of performancemeasurement for safety programs, which the scanteam found to be one of the most impressive uses ofperformance-based planning and decisionmaking. Thefinal chapters present general observations, overall les-sons for the United States, and recommendations forimplementing the scan results.
In each of the cases described in the following pages,monetary amounts are reported in the country’s owncurrency unit, followed by a conversion to U.S. dollars.Similar conversions are shown for metric distancemeasurements. In the case of currency, although muchof the financing information is reported from planningand budgetary documents prepared over the past 10years, the conversion rates used were those for April20, 2004. Although this suggests the buying power ofthe monetary estimates might be different from thatintended in these documents, it serves the purpose ofcomparing investment levels consistently from one country to another.
C H A P T E R O N E

CANADA
Canada has a long tradition of corporate planning inthe governmental sector. From the national govern-ment to local municipalities, public agencies have
spent considerable time developing approaches to poli-cy formation and implementation that provide a long-term perspective on desired outcomes and on the effec-tiveness of government programs in achieving theseoutcomes. In visiting Canada, the scan team was partic-ularly interested in identifying best practices on corpo-rate planning, transportation system performancemeasurement, and the use of performance measuresrelating to the linkage between transportation and sustainable development.
Governmental ContextCanada is a confederation of member provinces and ter-ritories, governed by parliamentary democracy. TheParliament is bicameral, with the Prime Minister choos-ing the Cabinet from among his own party or from par-ties in a coalition government. Because of the structureof the national government and of the great distancesinvolved, Canadian provinces tend to be more independ-ent (and more powerful) than comparable U.S. States.Most service and infrastructure provision is the responsi-bility of the provinces (e.g., provincial and local govern-ments are responsible for most of the roads in Canada).The national government is often the vehicle for collect-ing revenues (e.g., a national gas tax), returning a portionof these revenues to the provinces in the form of transferpayments. Similar to the United States, there appears tobe considerable debate about what constitutes a fairreturn of the revenues collected in the provinces.Transport Canada
Transport CanadaTransport Canada, the federal ministry of transport forCanada, is responsible for safe and efficient movementon Canada’s rail, marine, road, and air transportationsystem. It establishes policies and sets standards toachieve this goal. Although at one time responsible for
operating Canada’s air traffic control system, this sys-tem has since been transferred to a nonprofit corpora-tion. Most ports and harbors have also been divested,leaving Transport Canada with little direct operatingresponsibility. With privatization came a substantialdownsizing in staff, resulting in about 4,700 employeesworking at Transport Canada today. One of the mostimportant legislatively mandated roles for TransportCanada as it relates to this scan is its responsibility tomonitor and assess the performance of Canada’s trans-portation system.
A National Highway System (NHS) serves as the backbone of Canada’s road network. Representing 3 percent of total road mileage (25,000 kilometers (km) or15,535 miles (mi)), this system carries 30 percent of allvehicle travel in the country. Transport Canada adminis-ters several funding programs that support improvementsto the NHS and other critical transportation infrastruc-ture in the country. The Strategic Highway InfrastructureProgram (SHIP) committed CN$600 million (US$441million) over the past four years to critical componentsof the network, with $500 million going to highway construction and $100 million to national system integration. The funds are allocated to the provinces andterritories mainly based on population with considera-tion of other factors, and require a 50-50 match. ACN$600 million (US$441 million) Border InfrastructureFund, administered jointly by Transport Canada andInfrastructure Canada, focuses investment on criticalborder infrastructure and also requires a 50-50 match.Infrastructure Canada provides CN$2 billion (US$1.47billion) to support large-scale infrastructure projectsdone in partnership with provincial, municipal, or territorial governments. This $2 billion Strategic Infra-structure Fund was announced in the 2001 federal budg-et. An additional $2 billion was set aside for this fund inthe 2003 budget. Although regional equity considerationsare taken into account, investments will be directed tolarge-scale projects of national and regional significance.Population is a factor used to determine funding allocations between regions, but not the only factor.
Transportation Performance Measures 3
C H A P T E R T W O
Key Findings

4
C H A P T E R T W O
In the 2003 federal budget, a Municipal RuralInfrastructure Fund (CN$1 billion) was announced. Atleast 80 percent of the funds are dedicated to municipali-ties with a population of less than 250,000, and theremaining funds are available to municipalities withgreater than 250,000 population. The federal governmentcontributes, on average, one-third of the eligible costs.Provinces and municipalities will contribute the remain-der of the cost.
The Canadian government has a few other infrastructureinitiatives related to transportation improvements.Eligible projects under these programs include sustain-able transportation projects, transit improvements, androad projects. The projects include the following:• Infrastructure Canada Program (CN$2.05 billion,
2000-2007)• Green Municipal Funds (CN$250 million, ongoing
since 2000)• Green Municipal Investment Fund (CN$200 million,
ongoing since 2000)• Prairie Grain Roads Program (CN$175 million,
ongoing since 2000)
Similar to the U.S. Department of Transportation,Transport Canada produces an annual report on nationaltransportation statistics that focuses on trends in thedemand, supply, and financing of the transportation sys-
tem. This report, a parliamentary requirement, not onlyexamines the factors that drive transportation demand(e.g., national economic performance), but also presentsthe characteristics of transport system performance bymode. There was a sense among those the scan teaminterviewed that because much of the data for this reportcomes from the provinces, and because of the aggregatenature of many of the measures reported on, the annualreport does not provide a good picture of Canada’s “stateof transportation.” Officials noted, however, that theannual report often adopts a theme, such as internation-al trade, that is useful for focusing attention on a particu-lar issue.
Transport Canada uses a “results chain” as the underly-ing logic of its more comprehensive performance meas-urement efforts. Figure 1 shows such a results chain forthe goal of achieving a more sustainable transport net-work. As shown, individual activities in the organizationcan be targeted at specific audiences, which then lead tovarious levels of outcomes. An example of the linkageamong strategic objectives, ultimate outcomes, and per-formance indicators is shown in table 1. Note that thistable was prepared by Transport Canada to illustrate theframework being developed.
In 2003, Transport Canada’s Corporate Audit andAdvisory Services unit reviewed the performance
ActivityAreas/Output
TargetAudienceReach
ImmediateOutcomes
IntermediateOutcomes
UltimateOutcomes
Transport Canada
Other federal government departments
Other levels of government
NGOs
Other stakeholders
Public
Industry
A more sustainable transportation system
Improved mobility and access
Improved health
Improved competitiveness
Maintenance of safety standards
Improved resource stewardship:• Improved air quality and reduced GHGs• Improved soil quality• Improved water quality• Improved land use and preservation of ecosystems and biodiversity
Entrenchment of sustainable transportation culture in society
Increased system efficiency and optimized modal choices
Enhanced efficiency of vehicles, fuels, and fueling infrastructure
Improved performance of carriers and operators
Improved decision-making by governments and the transportation sector
Encourage-ment for Canadians to make more sustainable transportation choices
Enhanced innovation and skills development
Improved management of Transport Canada operations and lands
Data collection & analysis
Policy & program development
Technological research and development
Public & industry outreach
Evaluation of regulatory options
Figure 1. Results chain for Transport Canada.

Transportation Performance Measures 5
K E Y F I N D I N G S
framework established for the agency’s sustainable development strategy. This review indicated that 80 percent of the agency’s commitments and just over 70percent of the targets were met or were on track to bemet. In addition, this review concluded that the agency’s environmental management system (EMS) was critical to the overall success of improving environmental performance.
Provincial Efforts at Performance MeasurementMany provincial governments in Canada are in variousstages of developing and using a performance-basedplanning and decisionmaking framework. A good example is Alberta, where in 1992 a new governmentinstituted dramatic changes in government operations,including the use of outcome-based performance measurement. The Alberta Ministry of Transportationhas been a leader in implementing such change
(visit www.tu.gov.ab.ca/home/index.asp for its latestannual report and to see how performance is meas-ured). To obtain a more detailed understanding of howa province and a metropolitan area undertake perform-ance measurement, the scan team visited Vancouver,British Columbia.
VANCOUVER, BRITISH COLUMBIA
The scan team met with officials from Transport Canada,the British Columbia Ministry of Transportation, andTransLink, Vancouver’s regional transportation agency.To a large extent, the performance management experi-ence in Vancouver and British Columbia is still in a peri-od of development. Both the Ministry of Transport andTransLink have developed a performance-based planningand decisionmaking accountability system in recent
Strategic Objective Ultimate Outcome Indicators of Progress*
Ensure high standards for a safe and securetransportation system.
• Protection of life, health, environment andproperty
• High confidence in the safety and securityof the transportation system
• Reduced accident rate • Increased compliance rate • High public confidence in travel • Stakeholder understanding of safety
benefits and issues • Reduced security risks • A regulated community that is engaged
and well informed
Contribute to Canada’s economic growthand social development.
An integrated intermodal transportation system with the following characteristics:• Efficient, effective, viable, affordable, and
accessible • Responsive to users and communities• Competitive and harmonized, both
domestically and internationally
• Service and price levels • Current and prospective viability of system
components • Trends in operational costs • Cost to taxpayer • Community and user satisfaction with
price and service • Benefits to industry and consumers from
improved harmonization
Protect the physical environment. • Environmentally sustainable transportationsystem for Canadians
• Reduction of greenhouse gas emissionsand pollution from the transportation sector
• Prevention and mitigation of environmen-tal damage from transportation activities
• Increased public awareness of the environ-mental impact of transportation activities
• Increase in the use of more energy-efficient vehicles
• Reduction in annual vehicle kilometers • Reduced greenhouse gas emissions
and other air pollutants from transportation sources
* This list is not intended to be an exhaustive list of all current and/or future indicators.SOURCE: Transport Canada, Sustainable Development Principles for Transport Canada, Ottawa, Ontario.
Table 1. Linkage among objectives, outcomes, and indicators at Transport Canada.
6
C H A P T E R T W O
years, and both are still determining how to integrate thesystem into the decisionmaking process.
British Columbia Ministry of Transportation—In 2001,the provincial government instituted a policy requiringgovernment ministries to establish “service plans thatinclude measurable performance standards and targetsfor all programs that are annually audited and pub-lished.” This requirement was in direct response to aprovincial law entitled “Budget Transparency andAccountability Act.” The Ministry of Transportation’sservice plan for fiscal years (FY) 2004/05 and 2006/07was organized by agency goals and core business areas.For each performance measure, a baseline value wasidentified along with targets for the next three years. The performance measures found in the service plan areshown in table 2.
Several aspects of the performance measurement regi-men shown in table 2 merit comment. It is clear fromthe focus of the performance measurement effort thattransportation’s role in fostering economic growth is akey policy direction of the ministry, a focus confirmed inconversation with a ministry representative. In thisregard, the measures relating to “leveraged privateinvestment” and “commercial trucking travel timebetween economic gateways” stand out because the scanteam did not find them at other scan sites. The measureson competitiveness, especially those measuring reduc-tion in legal and regulatory barriers, were also uniquecompared to those found elsewhere.
Another interesting category of measures related to high-ways. The reliability measure—duration of highway clo-sures longer than 30 minutes—directly linked to theministry’s and police agency’s ability to remove incidentsfrom the road network.
The team found the use of customer and employee satis-faction surveys all of the cases it examined during thisscan. Of interest in the Ministry of Transport’s effort,however, was its attempt to pinpoint those aspects of dis-satisfaction that it could address (e.g., maintenance andsnow removal efforts). More than 1,000 surveys wereused to establish the baseline satisfaction score (6.5 outof 10.0). The Ministry of Transport has established an FY2006/07 target of 8.0 out of 10.0 for this performancemeasure.
TransLink—The Greater Vancouver TransportationAuthority, known as TransLink, was created in 1999 witha mandate to plan, finance, and manage a regional
transportation system, including Vancouver’s public transit system and major road network. The actual delivery of public transit services takes place throughsubsidiary companies and contractors, while mainte-nance and improvement of the major road network isdone in partnership with the municipalities. Unlike mostsuch authorities in the United States, TransLink has theability to assess property taxes, collect tolls, and raisemotor vehicle and parking fees to support its programs.
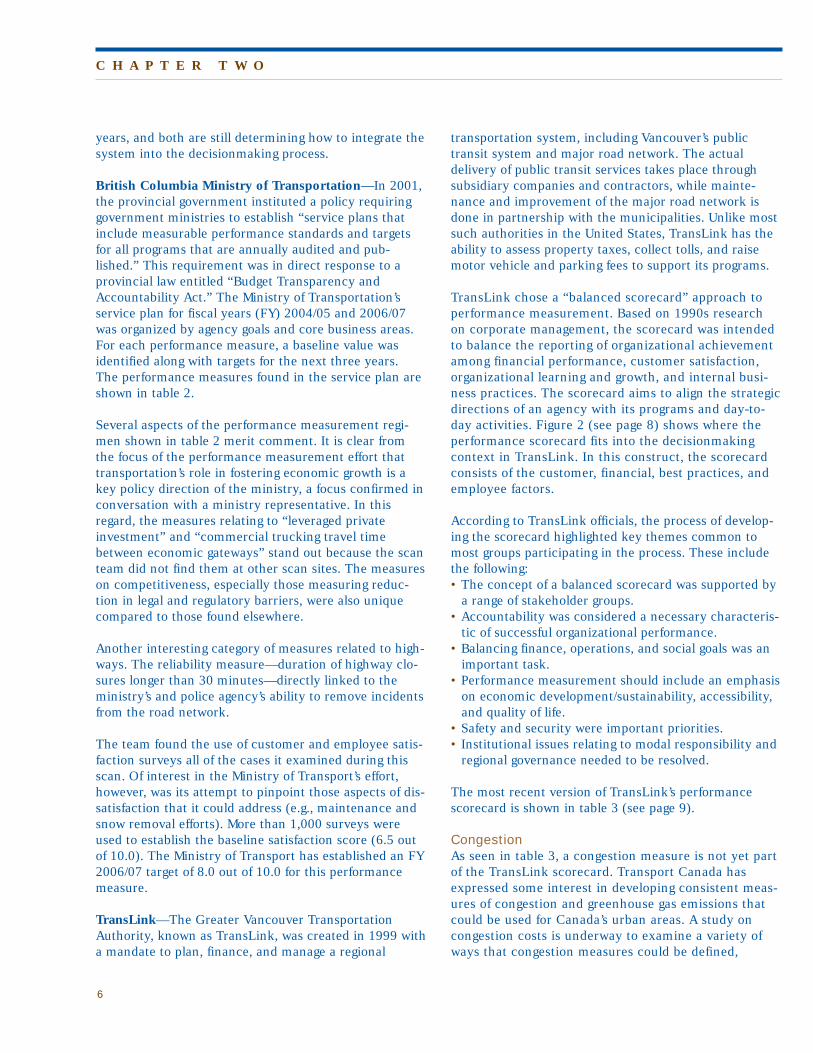
TransLink chose a “balanced scorecard” approach toperformance measurement. Based on 1990s researchon corporate management, the scorecard was intendedto balance the reporting of organizational achievementamong financial performance, customer satisfaction,organizational learning and growth, and internal busi-ness practices. The scorecard aims to align the strategicdirections of an agency with its programs and day-to-day activities. Figure 2 (see page 8) shows where theperformance scorecard fits into the decisionmakingcontext in TransLink. In this construct, the scorecardconsists of the customer, financial, best practices, andemployee factors.
According to TransLink officials, the process of develop-ing the scorecard highlighted key themes common tomost groups participating in the process. These includethe following: • The concept of a balanced scorecard was supported by
a range of stakeholder groups.• Accountability was considered a necessary characteris-
tic of successful organizational performance.• Balancing finance, operations, and social goals was an
important task.• Performance measurement should include an emphasis
on economic development/sustainability, accessibility,and quality of life.
• Safety and security were important priorities.• Institutional issues relating to modal responsibility and
regional governance needed to be resolved.
The most recent version of TransLink’s performancescorecard is shown in table 3 (see page 9).
CongestionAs seen in table 3, a congestion measure is not yet partof the TransLink scorecard. Transport Canada hasexpressed some interest in developing consistent meas-ures of congestion and greenhouse gas emissions thatcould be used for Canada’s urban areas. A study oncongestion costs is underway to examine a variety ofways that congestion measures could be defined,

Transportation Performance Measures 7
Goal Objective Performance Measure
Key transportationinfrastructure isimproved to driveeconomic growthand trade.
Regional and local input is used when setting transportation priorities.
Annual reports from Regional Transportation AdvisoryCommittees
Available provincial investment dollars are used aseffectively as possible.
Private investment capital leveraged through public/privatepartnerships, plus defrayed or reduced costs from efficientland use
Worsening congestion trend in urban areas is mitigated.
Percentage of urban vehicle-kilometers traveled in congested conditions
Mobility is improved for highways servicing major economic gateways.
Commercial trucking travel time between economic gateways
British Columbia isprovided with asafe and reliablehighway system.
Contractors maintain the provincial highway system toa high standard.
Maintenance cost per lane-kilometer
Rating of maintenance contractors
Existing main highway system is systematically preserved and replaced at the least life cycle cost.
Percentage of kilometers with good or excellent pavement condition
Percentage of bridges with good or excellent condition
Number of lane-kilometers improved
Road access is improved for resource industries and rural residents.
Percentage of rural kilometers with good or excellent pavement condition
Number of lane-kilometers improved
Highway safety and reliability are improved. Demonstrated safety improvements on a capital project-by-project basis, with measure comparing crashdata before and after projects
Annual total duration of unplanned closures greater than30 minutes for all numbered highways
An effective risk management process is establishedacross the ministry.
Risk management plan development and implementationstatus
British Columbia’stransportationindustries becomemore competitive.
Provincial regulatory burden on the public, industry, andstakeholders is reduced by one-third.
Reduction in legislation, regulations, and policies
Procedures for commercial passenger carriers are simplified, with safety as the primary criterion.
Reduction in the number of motor carrier regulatoryrequirements
Third-party regulations and policies that impede BritishColumbia’s ability to compete with other jurisdictions inthe transportation market are reduced or eliminated.
Process toward implementation of an amended Canada-U.S. air service agreement
Excellent customerservice is achievedand the ministry isrecognized as agood employer.
Excellent service is provided to all British Columbians. Higher user satisfaction with existing ministry services anddelivery processes
Employees are provided with the support, training, andworking environment they need to excel at their jobs.
Survey of employee satisfaction with organizationalimprovements
Table 2. Performance measures for the British Columbia Ministry of Transportation.

8
C H A P T E R T W O
ranging from total social cost of congestion to facilitydelay indicators.
Even though a congestion measure is not yet available,TransLink has developed a set of project evaluationguidelines in support of a multiple account evaluation(MAE) process that has been established by the govern-ment for major investment analysis. These guidelinesserve as the methodological foundation for project evalu-ation and development of study recommendations. Thecriteria are divided into four major accounts—direct sec-tor, indirect sector, external, and social accounts. Thedirect sector relates to the generalized costs, includingtravel time of the consumers of transportation, and tothe capital and operating costs for the producers of trans-portation. The indirect sector relates to the economicdevelopment and land value changes. External accountsreflect crash, air quality, and noise impacts. Socialaccounts relate to the intergovernmental transfer, neigh-borhood, and social impacts. The MAE is used to evalu-ate larger projects and to assess the larger-scale systemseffects of network investment. There was some discus-sion during the scanning study of the need to link systemperformance measures with the criteria found in theMAE approach. As one TransLink representative noted,consensus is good on what is important within modal
categories, but across modes little agreement exists onhow multimodal performance should be measured.
ObservationsThe following are the scan team’s key observations fromthe Vancouver, British Columbia, visit:• The TransLink scorecard, although still in develop-
ment, has served some useful purposes. According toTransLink representatives, the stakeholder involve-ment process leading to the development of the score-card provided numerous opportunities for a diversegroup of constituencies to interact and understand thepositions of others. For example, the scorecard is cred-ited with gaining the support of environmental con-stituencies for TransLink’s program. TransLink repre-sentatives believe that the scorecard and the invest-ment decisions it represents were instrumental in con-vincing voters to approve a 2 cent property taxincrease in 2002 that raises $40 million (US$29.4 mil-lion) per year for transportation investment.
• The TransLink scorecard, because of the way it isstructured, focuses not only on system performance,but also on employee objectives. Incorporating a per-formance culture into TransLink is one of the objec-tives of the performance approach. The belief is that
Figure 2. Relationship of performance scorecard factors to TransLink decisions.

Transportation Performance Measures 9
K E Y F I N D I N G S
CUSTOMER
Objectives Measures
Customer Satisfaction • Overall transit system rating• Specific transit service, car/van
pool, and AirCare ratings• Ratings of onboard safety and
personal safety at transit stops• Rating of major roads/bridges• Public acceptability of TransLink’s
performance
Partner Satisfaction • TransLink’s approach to communication and involvement
Effective Mobility • Proximity and frequency of transitservices
• Accessibility of transit fleet• Peak hour and weekend travel
time between key centers• People movement and
mode share• Goods movement and
mode share
Table 3. TransLink’s performance scorecard.
FINANCIAL
Objectives Measures
Financial Strength • Transportation revenue proportionversus other revenue sources
• Debt ratio• Reserve ratio
Financial Performance • Budget versus actual• Transit cost recovered by transit
revenues• Road expenditures commitment• New leveraged capital funds
committed
BEST PRACTICES
Objectives Measures
Transit SystemPerformance
• Transit service effectiveness: ridership growth
• Transit service efficiency: peak hours load factor
• Service reliability: ontime performance
• Service reliability: % of actualservice versus scheduled service
Safety and Security • Number of safety-related incidentsper transit passenger trip
Road NetworkPerformance
• Operating condition of major roadnetwork
Capital ProjectManagement
• Project performance based on thefollowing: —Timeliness—Cost—Quality—Delivery of agreed scope
EnvironmentalStewardship
TransLink’s emission-reduction con-tribution
EMPLOYEES
Objectives Measures
Employee Satisfaction • Employee ratings of satisfactionand corporate climate
• Employee ratings of internal communications
Performance Culture • Vision, mission, and values imple-mentation
• Scorecard implementation• Completion of individual annual
review sessions with staff• Assessment of corporate
performance against annual plan
Skills and Knowledge • Percentage of employees with pro-fessional development plans
• Organizational resource capacityto execute current and futurestrategic objectives

10
if the scorecard does not become institutionalized inthe culture of the organization, the benefits of a per-formance-based decisionmaking approach will not berealized.
• One of the most significant applications of performancemeasurement occurs in the safety field, although evenhere, a systems-level analysis of a safety program is notapparent. The Insurance Corporation of BritishColumbia, a crown corporation that provides universalauto insurance to motorists (2.6 million in BritishColumbia), invests CN$10 million to $15 million(US$7.4 million to $11 million) per year for roadimprovements, with special interest in leveraging thisinvestment to obtain other governmental support. Ofparticular interest in this initiative is that the corpora-tion looks for a minimum rate of return on proposedinvestments. High fatality and personal injury crashlocations are tracked and ranked for priority invest-ment. Road safety audits are also conducted to identifypotentially dangerous locations.
• The important linkage between top management sup-port and performance measurement effectiveness wasquite evident in this case. In both the TransLink andthe British Columbia Ministry of Transportation applica-tion, top management support occurred in the earlyproposal adoption stage. The Ministry ofTransportation’s efforts have picked up in recent yearsas the various business units have been required tofocus more on how best to report on key performanceareas. Ministry officials view this as an impetus forimproved reporting in the future. In 2004, theTransLink Executive Board reconfirmed its commit-ment to the performance scorecard and will use it asthe framework for its corporate business planningprocess.
• TransLink has recognized the importance of context-specific investment, in which the type of transporta-tion investment is linked to the region’s land use andpolitical context. The result has been an understandingthat transit investment is the right choice in urbanareas, and road investment is more appropriate in sub-urban areas.
JAPAN
Japan is a very populous country (127 million people)with much of the population concentrated in coastalcities. Because the country is highly urbanized, the scan
team was particularly interested in performance meas-ures that related to the urban character of the communi-ties in which transportation facilities are built and oper-ated. In addition, Japan is known for its leading-edgeapplication of technology in all aspects of daily life, sothe team was interested in identifying how the Japaneseuse intelligent transportation system (ITS) technologiesto collect data for its performance management efforts.The Japanese government adopted a performance-basedplanning approach to infrastructure decisions just a fewyears ago, so the team also wanted to see how fast theJapanese had implemented the approach and what theyhad learned from this experience.
Governmental ContextJapan is a parliamentary democracy with a PrimeMinister selected from the majority (or coalition) party.The Prime Minister selects the Cabinet. In transporta-tion, the primary national government agency for trans-portation is the Ministry of Land, Infrastructure, andTransportation (MLIT). Formerly separate agencies,MLIT consists of 13 bureaus plus the Minister’s secretari-at. In transportation, the key bureaus are the Road,Railway, Road Transport, Maritime, Ports and Harbors,and Civil Aviation Bureaus. In addition, MLIT has nineRegional Development Bureaus, which plan and manageroads and interact with 47 prefectures (or states).
The scan team spent most of its time with officials of theRoad Bureau, an agency of 212 employees with primaryresponsibility for the nation’s road system. The RoadBureau has eight regional offices. A National Institute forLand and Infrastructure Management, MLIT’s researcharm, has also been established to conduct research onleading-edge applications of technology and urban infra-structure issues. In addition, a semi-independentInstitute for Traffic Accident Research and Data Analysis,jointly controlled by MLIT and the National PolicyAgency, has been created to provide a central capabilityfor crash assessment.
In addition to the Road Bureau, Japan has created met-ropolitan and national toll agencies, including theMetropolitan Expressway Public Corporation and theJapan Highway Public Corporation. The government isconsidering privatizing the toll roads in Japan. The mostimportant high-capacity, high-speed roads in Japan arethe responsibility of these toll agencies, under the super-vision of the Road Bureau.
Use of Performance MeasuresThe Japanese government has been shifting to a perform-
C H A P T E R T W O

ance-oriented focus over the past several years. A 2002national law on policy evaluation and program perform-ance required that government ministries adopt such afocus in their activities. The road-oriented recommenda-tions made by a Cabinet-level InfrastructureDevelopment Council in 2002 that came from this lawwere the following:• Road program administration should shift to an out-
come-based approach.• Policy evaluation that links program and project conse-
quences to these outcomes should be incorporated intothis administration.
• Results of this policy evaluation and program monitor-ing should influence the budgeting process.
MLIT has followed a performance management schemesince its creation in 2001. Performance measurement isconsidered part of a policy evaluation system consistingof policy assessment, performance measurement, andprogram evaluation established in response to the 2002law (see figure 3). Policy assessment—what would becalled policy analysis in the United States—is a systemat-ic consideration of the consequences of alternative policychoices in relation to stated goals and objectives.Program evaluation focuses on ex post facto assessmentof program outcomes with special focus on understand-ing the cause-and-effect dynamics that led to these out-
comes. Performance measurement consists of monitoringtransportation system and organizational performance inrelation to a set of politically defined and publiclyreviewed performance indicators.
A major legislative mandate that has strongly influencedthe development of MLIT performance indicatorsoccurred in 2003 when the Japanese Diet (Parliament)passed the “Law for the Long-Term Plan on the MainDevelopment of Social Infrastructure.” This law requiredthe government to establish a plan for achieving perform-ance targets in several infrastructure areas, includingroads, railroads, ports, navigation channels, and actionsrelating to flood control and coastal conservation. TheMLIT plan, based on indicators listed in the law, included116 performance indicators, many with targets definedin cooperation with other ministries, including theMinistry of Finance. Long-term targets were establishedfor 2020 and intermediate targets for 2007. APerformance Management Office was created in the RoadBureau in 2003 as a center of responsibility for perform-ance measurement.
The Road Bureau developed a strategy for incorporatingan outcome-based road administration decisionmakingframework into the strategic and operational decisions ofthe agency. A set of 17 core indicators relating to five
Transportation Performance Measures 11
K E Y F I N D I N G S
Figure 3. Performance management in the Ministry of Land, Infrastructure, and Transportation in Japan.

12
policy themes was defined. Regional performance-basedplans for each prefecture were to be formulated byMLIT’s local National Highway Offices in cooperationwith prefecture officials, using selected indicators fromthese 17 core indicators, along with any others specificto their needs. By March 2004, 31 of 47 prefectures hadestablished their own performance indicators, including80 measures different from the national indicators. The17 core indicators are shown in table 4.
Several performance indicators in table 4 are of specialnote. The “percentage of electronic toll collection (ETC)use on the expressway system” represents an MLIT com-mitment to advance the use of technology in making net-work operations more efficient. (Note that this indicatoris found in the economic vitality policy category). Alsorelated to network efficiency is the “percentage of target-ed traffic flows that diverted to the expressway networkfrom currently used non-expressway roads” indicator.The quality of life indicators include the “percentage ofbarrier-free road near transit terminals” and the “per-centage of main roads in urban areas without utilitypoles.” Both measures were unique to Japan and reflectthe importance the Japanese place on walking as a modeof transportation and on community aesthetics. The“percentage of cities having evacuation routes” is notsurprising, given the risk from natural disasters in Japan.In the environmental category, the “percent compliancewith nighttime noise standards” also reflects the highlyurban nature of the country.
Although the scan team did not have the opportunity toreview all of the prefecture-specific performance plans, itsaw examples of the types of measures that have sur-faced from these efforts, including the following topics ofinterest to the scan team:
Each performance measure in a prefecture’s performanceplan has established targets and a list of projects to beundertaken in the coming year related to these targets.
To ensure consistent implementation of the perform-ance measurement concept nationally, the Road Bureauholds annual meetings with its regional offices. Thesemeetings focus on the performance of the road net-work, detailed analysis of key road facilities, the statusof current projects, and the reporting of outcomes ofimplemented projects.
The original law on administrative reform required theresults of performance evaluation to influence budgetallocation. It is too early in the process for identifiablechanges in the budget process to have occurred, but theRoad Bureau has changed its budgeting format fromrequests for specific road types to requests for outcomecategories. An illustrative budget was shown to the scanteam that divided the budget into categories on conges-tion relief, regional collaboration, maintenance andrepair, environmental mitigation, safety, and utility relo-cations. The budget requested for 2004 showed increasesfor environmental mitigation, safety, and utility locationefforts, and decreases for the other three categories.
CongestionWith a population of 127 million people primarily locatedin coastal cities, it is not surprising that traffic congestionis a major issue in Japan. It was estimated in 2003 that3.8 billion person-hours per year are lost because con-gestion, about 30 hours per person per year. Of thisnational total, one-third occurs in the Tokyo metropoli-tan area (or what is referred to as the Kanto RegionalDevelopment District of the Road Bureau). The Tokyomajor road network is primarily oriented radially intothe downtown, with several circumferential or ring roadseither completed, under construction, or in the planningstage. It was apparent from discussions with Bureau offi-cials that they consider completion of the freeway net-work, especially the ring roads, a critical element of theregion’s strategy to reduce congestion.
As shown in table 4, the key congestion measure is “timeloss due to congestion,” measured in million person-hours per year. The current value for the monitored sec-tions in the Kanto region is 610 million person-hours,and a target value of 530 million person-hours has beenestablished for 2007. It was not clear whether this targetwas referenced to current values of congestion orwhether natural growth in traffic volumes was alsoassumed as part of the reduction. Some officials
C H A P T E R T W O
Jurisdiction
Yamagata Prefecture
Aomori Prefecture
Aomori Prefecture
Niigata Prefecture
Toyama PrefectureNiigata Prefecture
Performance Topic
• Road sections with winter-related speed reductions
• Snow removal from roads inschool zones
• Population access within 60 minutes of advanced hospitalsfor newborn babies
• Safe passing areas on highways and local roads for motor vehicles and pedestrians
• Sidewalks with sufficient width• Existence of green space in road
right-of-way

Transportation Performance Measures 13
K E Y F I N D I N G S
Policy Theme Performance Indicator Current value(2002)
Target for2003
Target for2007
Economic vitalit Time loss due to traffic congestion 610 million person-hours
590 million person-hours
About 10% reduction
% of ETC use—National
Metropolitan Expressway
Hanshin Expressway
5% 15% 70%
6% 20% 85%
3% 15% 85%
Hours of roadwork 201 hours/km-year 193 hours/km-year 20% reduction
% of traffic diverted to expressways 13% 13% 15%
% of roads with access to airports/ports 59% 61% 68%
% of main cities connected to national road 72% 73% 77%
% of people having safe drive into city of lessthan 30 minute
63% 64% 69%
Quality of life % of barrier-free main roads near transit ter-minals with >5,000 passengers
17% 21% About 50%
% of urban trunk roads without utility poles 7% 8% 15%
Safety Incidence of death and injury accidents 118.4 mvkt 116 mvkt 108 mvkt
Road in safe condition—bridge
Pavement
86% 87% 93%
91% Maintain current levels
% of cities having safety evacuation routes 6% 68% 7%
Environment Reduction in CO2 emissions — Reduce transportation sector contributionto 250 million tons of CO2 by 2010
% of NO2 environmental goal achievement 64% 67% About 80%
% of suspended particulate matter goalachievement
— About 10% About 60%
% of compliance on nighttime noise stan-dards
61% 63% 72%
Road administration Level of road user satisfaction 2.6 points 2.7 points 3.0 points
Number of hits on homepage 15.46 million/year 26 million/year About 100 mil-lion/year
Table 4. Core performance indicators in Japan.

14
suggested that the target takes trafficgrowth into account, which makes iteven more ambitious.
Data collection necessary to esti-mate this congestion measureincludes traditional roadside surveys(23,000 locations in Japan), auto-mated traffic counters, ultrasonicloop detectors at 500 locations todetect travel speed, use of the float-ing car method along 33,700 sec-tions to determine travel speed, andan evolving program to use probevehicles for determining travel time.Japan has about 5,000 probe vehi-cles (3,000 in Tokyo), most of whichare buses. Through the use of globalpositioning system (GPS) satellites,the progress of buses through thearterial road network can be moni-tored and reported to a central data-base server. This data can be turnedinto several important pieces ofinformation—real-time arrival infor-mation for transit riders, operationscontrol for bus managers, and roadsystem management and perform-ance measurement for the RoadBureau. In addition, probe data havebeen used to evaluate the impact ofnetwork expansion on congestion.Figure 4a shows an example of howthis information is portrayed for oneof the ring roads circumventing cen-tral Tokyo. Figure 4b shows the useof this information to monitor sec-tions of an individual arterial route.
One of the most importantproviders of road service in theTokyo metropolitan area is theMetropolitan Expressway PublicCorporation (MEX), formed in 1959to improve traffic flow in theregion. Tokyo now has 281 km (175mi) of tolled expressways carryingabout 30 percent of all arterial traf-fic and 35 percent of truck volumesin the metropolitan area. Aboutone-third of toll receipts go to payfor new road construction, 37
C H A P T E R T W O
Figure 4. Visualization of performance data in Japan.
Figure 4b. Congestion on an urban arterial.
Figure 4a. Congestion on a beltway in Tokyo.

percent to interest on outstanding bonds, and 30 percent to ongoing road management.
MEX has estimated that 86 percent of expressway congestion is caused simply by lack of road capacity, 12percent by crashes and breakdowns, and 2 percent byroad maintenance and repair. This estimate has led tosome unsurprising proposed solutions. Most importantly,expansion of the expressway network, especially the ringroads, has become a key part of the road agencies’ strate-gy. The most recent report for MEX identifies just over32 km (20 mi) under construction. Road Bureau officialsconsider a proposed 86-km (53.4-mi) Tokyo Outer RingRoad, located about 15 km (9.3 mi) from downtown, theimportant missing link in the regional expressway net-work, but construction has been delayed by public oppo-sition to the disruption that would occur in the neighbor-hoods through which it passes. The proposal is to buildmuch of the road in tunnel sections, costing more thanUS$1 billion per kilometer. At this point, a finance planfor this road has not been developed.
Another ring road, the Metropolitan IntercityExpressway, about 40 to 60 km (24.9 to 37.3 mi) fromdowntown, is also under consideration. This project isbeing delayed by difficulties in obtaining right-of-way.
Besides constructing new expressways, MEX is wideninglanes, building new ramps to remove bottlenecks, andclosing ramps when circumstances require it. Because 30percent of the congestion on the national toll road net-work occurs at tollbooths, MEX also is encouraging roadusers to adopt ETC technology.
Congestion from road maintenance work is mitigatedthrough contract specifications on time and location ofthe work, advance release of public information, and in-vehicle traveler information systems.
MEX uses several performance indicators to measureservice delivery, including the following:
Indicator TargetAverage speed 44 km/h (27.3 mi/h) daytimeDuration of congestion <363 kilometer-hours/day
(226 mile-hours/day)Number of crashes <13,000 per yearAverage recovery time <60 minutesfor crashETC use >20 percentCustomer satisfaction >3.0 out of 5.0
SafetyTraffic safety has been a social concern in Japan forseveral decades. From 1960 to 1970, when the numberof automobiles owned in Japan increased twenty fold,annual traffic fatalities increased from 6,379 to 16,765.Even worse, the number of people injured increasedfrom 76,000 to 981,000 over the same period. With theimplementation of a variety of safety measures, fatali-ties have declined dramatically since 1970. MLIT offi-cials are concerned, however, because the number oftraffic-related injuries increased to an estimated1,168,000 in 2002. One important aspect of this safetyrecord is the percentage of crashes involving pedestri-ans and bicyclists. Close to 40 percent of the fatalitiesare either pedestrians or bicyclists, 60 percent are eld-erly, and 60 percent occur within 500 meters (1,640feet) of home.
As seen in table 4, several of the core 17 performanceindicators relate to safety. Besides those listed in thesafety category, MLIT considers measures relating to“barrier-free main roads for pedestrians” and the “per-centage of roads without utility poles” safety measuresas well. Several initiatives have been aimed at each ofthese measures. From 1996 to 2002, 3,200 locationswere identified on trunk roads where at least 24 injury-causing crashes had occurred in four years, where 40percent of all crashes resulted in fatalities, or wheremore than two fatalities had occurred in four years.Each location received appropriate measures aimed atreducing crashes. At 1,700 of the locations where treat-ments had been completed by 1999, the number oftraffic-related injury crashes had decreased by 30 per-cent, even taking into account the growth in traffic vol-ume.
Officials plan to continue this so-called “black spot”removal program in the future. An additional 4,000 loca-tions will be selected where the crash rate is five or moretimes the average crash rate for that road type. Figure 5(see page 16) shows how the locations are ranked andintersections selected.
Other initiatives to reduce crashes include removal ofillegally parked cars, promotion of safe and barrier-freepedestrian walking areas, and the use of safety reviewsby community volunteers to identify unsafe conditions.
Urban DesignCommunity design can be an important element of anoverall strategy for meeting many performance meas-urement goals. For example, urban design in the con-
Transportation Performance Measures 15
K E Y F I N D I N G S

16
text of making safer and more walkable neighborhoodsis an important initiative for enhancing safety. MLITparticipates in large-scale, multiuse development proj-ects with a significant transportation component. Oneproject the scan team visited was a redevelopment ofShinjyuku Station, a transit station in the heart of oneof Tokyo’s largest and most important office and retailclusters. With more than 3.2 million passengers per dayusing Shinjyuku Station, it has become a major node inTokyo’s transportation system, but one with significantvehicular and pedestrian congestion on the surroundingroad network. A narrow sidewalk in front of the stationhandles more than 430,000 people per day, a challengethat has led to unsafe and severely congested condi-tions. Given the need to reconstruct a bridge over thecommuter rail and subway tracks serving the station,MLIT, local government, neighborhood groups, and rail-way companies have developed a new intermodal ter-minal concept that includes significant amounts ofmixed-use development. The infrastructure elements ofthis project are nearing completion, with a new high-rise office complex to follow.
Although the impact and investment magnitude of thisproject makes it unique, it does illustrate how thenational road agency works with a community throughthe development process to alleviate transportation prob-lems. In such a highly urbanized country as Japan, thislinkage between land use/urban design and transporta-tion investment can be an important tool to help meettransportation goals.
Intelligent Transportation System TechnologiesOne reason the scan team wanted to visit Japan was toidentify how intelligent transportation system (ITS) tech-nologies could be used for data collection to support per-formance measurement. Japan is clearly one of the worldleaders in ITS technology development and implementa-tion. MEX uses a surveillance system to monitor road per-formance and has its own tow truck fleet (privately oper-ated) to respond to incidents. Information is conveyed toroad users via graphic information signs, variable messagesigns, congestion warning boards, local area radio advi-sories, remote travel kiosks, and in-vehicle navigation sys-tems for motor vehicles so equipped. The data from videocameras and loop detectors is updated every minute.Real-time data is combined with an historical record topredict where congestion is likely to occur in the immedi-ate future. Police agency representatives are located inthe traffic management center to coordinate response toan incident. Little of the data collected is archived forplanning or system performance management purposes; itis directed primarily to delivering road user information.
The use of electronic toll collection (ETC) technologieson the nation’s toll expressway network is a key MLITgoal. A national standard has been established for ETCtechnology, along with a capability to serve multiplecommunication functions. In February 2004, more than2.5 million ETC units were in operation.
A dedicated short-range communication (DSRC) systemhas been developed that works in conjunction with ETC
C H A P T E R T W O
Figure 5. Identification of priority locations for safety countermeasures in Japan.

technology to allow two-way communication between avehicle and a central command center. Officials expectthis DSRC system to eventually provide up-to-date infor-mation to road users on weather conditions, traffic con-gestion, traffic regulations and controls, and local servic-es, as well as an ability to make reservations at nearbyrestaurants. In addition, anticipated functionalitiesinclude Internet access, parking fee payment (and possi-bly fuel payment), and guides to local transit services.
One technology in use is the vehicle information andcommunication system (VICS). This system providesdrivers with real-time information on traffic conditions.The information is transmitted by a radio beacon,infrared or over FM radio. More than 12 million simplenavigation systems are found in the vehicle fleet, and asof June 2003, about 7.2 million VICS units had been sold.
Finally, the Japanese are conducting important researchon the development of advanced cruise-assist highwaysystems (AHS). AHS technologies will provide enhancedsensor capability for detecting and responding to obsta-cles in the road, vehicle control, and monitoring the con-dition of the road surface. The goal in the use of AHStechnologies is to reduce crashes by 50 percent.
The Japanese appear to be in the early stages of thinkingabout how data collected from ITS technologies could beused to support system performance measurement. Theuse of probe vehicles for congestion measurement is themost advanced use of such technologies for this purpose.Those involved with developing ITS applications believethey are ideally suited to support a system performance-monitoring concept, as long as the number of measuresis limited. The Japanese are also in the early stages oflooking at vehicle-to-vehicle communication applicationsthat would allow every instrumented vehicle to serve as avehicle probe. With the heavy investment in fixed sen-sors, however, the strategy seems to be to rely on theexisting infrastructure for data collection in the foresee-able future.
ObservationsSome of the more important observations resulting from
the team’s visit to Japan are as follows:• MLIT has in a very short time implemented a perform-
ance management decisionmaking structure, with theRoad Bureau as the leading expert. The performanceindicators have been narrowed to a small number (17)considered to be the most important. These 17 indica-tors are incorporated into each performance plandeveloped for the local offices of the eight Regional
Development Bureaus. Relatively quickly, MLIT hasestablished a performance management structure thatis consistent across the country.
• Even though the national indicators are found in allregional office and prefecture performance plans, eachjurisdiction was encouraged to identify indicators thatreflect its own needs and desires. This flexibility insubnational performance measurement has resulted inthe identification of numerous jurisdiction-specific per-formance indicators.
• Given the highly urban character of the country, it isnot surprising that several performance indicatorsemphasized qualities of the community environment,something not found elsewhere on the scan. In particu-lar, the measures for barrier-free roads near transit sta-tions and for removal of utility poles are unique.
• The Japanese are advanced in their application of ITStechnologies for conveying user information and payingtolls. Except for probe vehicles, however, ITS technolo-gies are not heavily used as data collection support forplanning or performance measurement.
• MLIT’s performance measurement framework usesbefore-and-after studies to assess the actual impact ofimplemented projects. Figure 6 (see page 18) showstwo examples where the consequences of projectimplementation are determined. This information is
used to identify the most cost-effective strategies tomeet transportation program goals.
• One of the most impressive aspects of the MLIT per-formance measurement effort was the highly visualnature of the presentation of the information. Asshown in figure 7 (see page 19), officials make an effortto convey the key points of a particular performancemeasure in an easily comprehensible manner. Officialssaid they viewed the use of performance indicators asquite limited unless the implications of the results wereclear to decisionmakers and the general public.
Transportation Performance Measures 17
K E Y F I N D I N G S
“Just by collectingdata, we do not
solve problems.”
—Ministry of Land, Infrastructure,and Transport Official

18
C H A P T E R T W O
Figure 6. Determining consequences of project implementation in Japan.

Transportation Performance Measures 19
• Although it is too early to tell what impact performancemeasurement will have on budget allocations, MLITofficials are trying to develop a budgeting scheme thatreflects the results of an outcome-based decisionmak-ing process. The true test of the value of the perform-ance measurement program will be when budget deci-sions are strongly influenced by system performancemeasurement.
AUSTRALIA
Roughly the same size as the United States, Australia is acountry of vast expanses punctuated by highly vibranturban areas. The concentration of population in urbanareas is due in part to how flat and dry most of the coun-try is. Australia consists of eight states and territories,each with its own unique culture and approach to infra-structure decisionmaking. Because of their long historyof innovative approaches to infrastructure planning, andin particular, the use of performance indicators for deci-sionmaking, the states of Queensland (Brisbane), NewSouth Wales (Sydney), and Victoria (Melbourne) wereidentified by the scan team as important sites to visit.
Governmental ContextAustralia is a parliamentary democracy with the majorityparty in Parliament choosing a Prime Minister. ThePrime Minister, in turn, selects members of the Cabinet.One characteristic of Australia important to understand-ing the focus and substance of transportation planningactivities in the country is that much of the responsibili-ty and power for such planning resides with the states.Most of the substantive use of performance indicatorsand its effects on budget decisions are found at the statelevel. The national government does have responsibilityfor a national highway network, even though it has sug-gested that its financial commitments to this networkshould devolve to the states, a suggestion state govern-ments oppose.
The major national transportation agency is theDepartment for Infrastructure Planning and NaturalResources, which provides policy advice to the ministersand parliamentary secretary for the transport and region-al services portfolio. It also administers funding programs(such as a national black spot program to reduce crash-es) and conducts research. The Australian TransportCouncil (ATC) consists of national, state, territory, and
K E Y F I N D I N G S
Figure 7. Visualization of network performance data in Japan.

20
New Zealand ministers responsible for transportation. It is primarily responsible for providing advice to all lev-els of government on issues important to transportationpolicy. The National Transport Commission focuses itsattention on driver and vehicle regulations, standards,and operating rules relating mainly to freight movement.It serves as an advisor to ATC.
Austroads is an association of road and traffic authoritiesin Australia and New Zealand whose purpose is to conductresearch and foster collaboration among its members.Established in 1989, Austroads consists of 11 members(including all three states and Transit New Zealand visitedduring the scan) with a rotating chairmanship. In 1993, inresponse to member concerns and interest in outcome-based planning and decisionmaking, Austroads undertookan effort to identify a set of performance indicators for theroad system. Each member is responsible for submittingits data annually. Seventy-two performance indicatorswere grouped into 10 categories shown in the box.
The 72 indicators, reported by jurisdiction, are on theWeb at www.austroads.com.au. Of these indicators, 21 have been identified as core indicators, or those most important to member jurisdictions:• Fatalities per 100,000 population• Dollar per vehicle registration and driver licensing record• Maintenance cost ($1,000s) per lane- kilometer to keep
road conditions below an acceptable roughness level of4.2 m/km IRI (International Roughness Index)
• Proportion of travel undertaken each year on all roadswith a roughness level condition of less than 4.2 m/km IRI
• Percentage of roadside dwellings exposed to noiseabove a specified level
• Greenhouse gas emissions per vehicle-kilometer• Percentage of expenditure specified to achieve benefit
coast ratios
• A.M. peak actual travel speed—urban• P.M. peak actual travel speed—urban• A.M. peak lane occupancy rate (persons/lane/hour)• P.M. peak lane occupancy rate• Off-peak lane occupancy rate• All-day lane occupancy rate• Operating costs per kilometer• Cost per ton-kilometer for freight• User satisfaction index• Total kilometers traveled by jurisdiction of registration,
normalized for economic activity• Total road ton-kilometers traveled, normalized for
economic activity• Average rate (all fuels) of vehicle fuel consumption in
liters per 100 kilometersFigure 8 provides an example of how this information ispresented for one core indicator. Austroads members usethis information not only to monitor trends in their ownjurisdiction, but also to support benchmarking compar-isons from one jurisdiction to another.
To provide consistency in measurement across jurisdic-tions, Austroads develops best-practice guides on howdata should be collected and interpreted for each meas-ure. For example, the scan team found the Austroadsmethodology for determining travel time measurementsbeing used at each site visited. This methodology focusedon a congestion indicator (minutes per kilometer) and atravel time variability measure.
Of interest as a possible model of nationally defined per-formance indicators, the Austroads approach clearly rep-resents a state- or jurisdiction-defined “bottoms-up”effort to determine what is really important to agenciesmost responsible for delivering the road program. Insome cases, data were missing from specific measures forcertain jurisdictions. When participants were asked why,the response was that these jurisdictions most likely nolonger considered such information important to theirplanning and decisionmaking. Several officials told thescan team that these 72 indicators were being reviewedfor relevance, and that some most likely would bedropped from the list, while others might be added. Theuser-defined characteristics of this national performanceindicator program were of great interest to many mem-bers of the scan team.
BRISBANE, QUEENSLAND
Queensland, located in northeastern Australia, is twotimes the size of Texas and five times larger than Japan,
C H A P T E R T W O
Austroads’ Categories for PerformanceMeasures• Road safety• Registration and licensing• Road construction and maintenance• Environment• Program/project assessment• Travel time• Lane occupancy rate• User cost distance• User satisfaction• Consumption of road transport, freight, and fuel

but has only 3.7 million residents, most of whom arelocated in southeastern Queensland (mainly inBrisbane). Large parts of Queensland are rural and unde-veloped, leading to active government provision of trans-port services (for example, the government has contract-ed for five long-distance intercity bus and two importantair services that serve 48 remote communities). Theheavy use of performance-based contracts for servicedelivery, as well as a long history of corporate strategicplanning, were motivations for the scan team to visitQueensland.
Governmental ContextThe Queensland government has set five priorities for itsactivities: provide safer and more supportive communi-ties, create more jobs that focus on technical skills andinnovation, enhance community engagement and qualityof life, develop rural areas, and protect and create valuein the natural environment. The Queensland parliamen-tary portfolio for transport has a defined vision statementthat places transport squarely in the economic and quali-ty-of-life future for the state. According to this visionstatement, the transport portfolio will “contribute to gov-ernment outcomes through consistent, coherent leader-
ship in the development and management of innovativetransport solutions for Queensland that connect people,goods, and services.”
The transport portfolio includes two organizations—Main Roads and Transport Queensland. Main Roadsowns and manages about 34,000 km (21,127 mi) ofroads and is responsible for all aspects of planning,designing, constructing, operating, and maintaining thisnetwork. Queensland Transport is the lead agency for“developing and managing the land, air, and sea trans-port environment” in Queensland, and is responsiblefor vehicle and vessel registration and licensing. Thegovernment has also created government-owned corpo-rations to provide passenger and freight rail services(Queensland Rail) and to manage ports and some air-port facilities. Queensland Transport provides overallpolicy guidance for these efforts.
Use of Performance IndicatorsFigure 9 shows the relationship among the different ele-ments of the decisionmaking process in Queensland.The government’s broad goals guide the development oftransport policies. They, in turn, result in certain levels
Transportation Performance Measures 21
K E Y F I N D I N G S
Figure 8. Austroads’ congestion indicator for states.
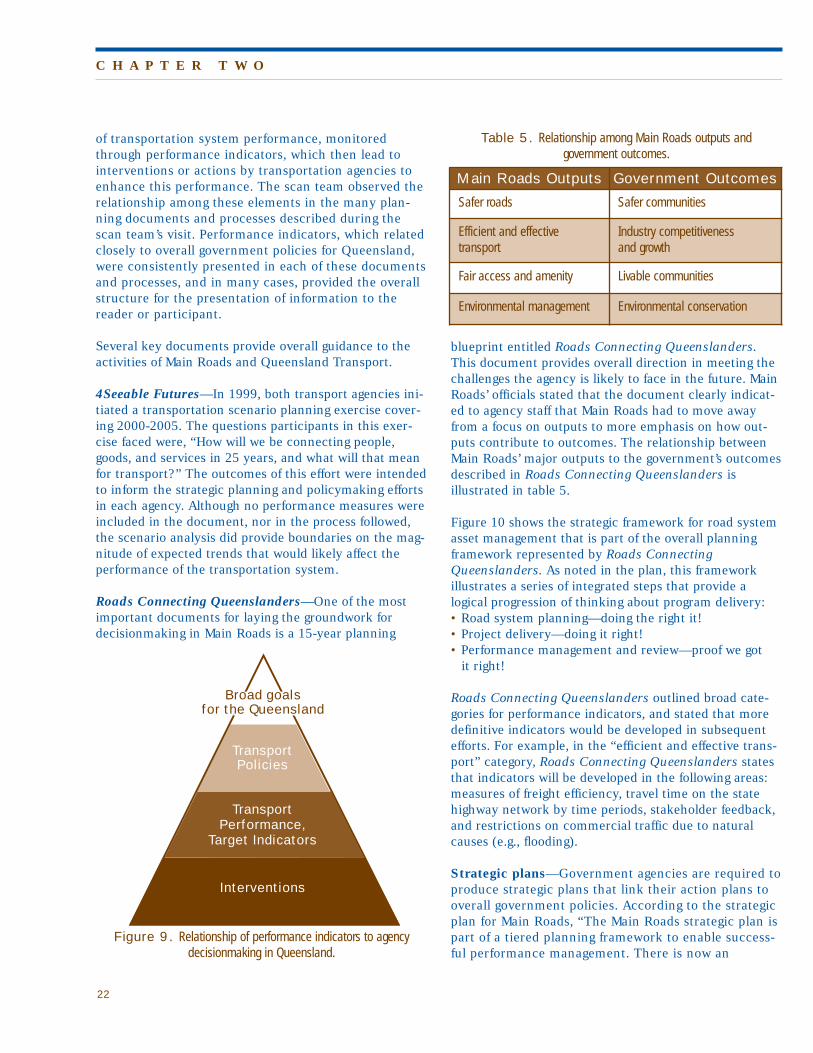
22
of transportation system performance, monitoredthrough performance indicators, which then lead tointerventions or actions by transportation agencies toenhance this performance. The scan team observed therelationship among these elements in the many plan-ning documents and processes described during thescan team’s visit. Performance indicators, which relatedclosely to overall government policies for Queensland,were consistently presented in each of these documentsand processes, and in many cases, provided the overallstructure for the presentation of information to thereader or participant.
Several key documents provide overall guidance to theactivities of Main Roads and Queensland Transport.
4Seeable Futures—In 1999, both transport agencies ini-tiated a transportation scenario planning exercise cover-ing 2000-2005. The questions participants in this exer-cise faced were, “How will we be connecting people,goods, and services in 25 years, and what will that meanfor transport?” The outcomes of this effort were intendedto inform the strategic planning and policymaking effortsin each agency. Although no performance measures wereincluded in the document, nor in the process followed,the scenario analysis did provide boundaries on the mag-nitude of expected trends that would likely affect theperformance of the transportation system.
Roads Connecting Queenslanders—One of the mostimportant documents for laying the groundwork for decisionmaking in Main Roads is a 15-year planning
blueprint entitled Roads Connecting Queenslanders.This document provides overall direction in meeting thechallenges the agency is likely to face in the future. MainRoads’ officials stated that the document clearly indicat-ed to agency staff that Main Roads had to move awayfrom a focus on outputs to more emphasis on how out-puts contribute to outcomes. The relationship betweenMain Roads’ major outputs to the government’s outcomesdescribed in Roads Connecting Queenslanders is illustrated in table 5.
Figure 10 shows the strategic framework for road systemasset management that is part of the overall planningframework represented by Roads ConnectingQueenslanders. As noted in the plan, this frameworkillustrates a series of integrated steps that provide a logical progression of thinking about program delivery:• Road system planning—doing the right it!• Project delivery—doing it right!• Performance management and review—proof we got
it right!
Roads Connecting Queenslanders outlined broad cate-gories for performance indicators, and stated that moredefinitive indicators would be developed in subsequentefforts. For example, in the “efficient and effective trans-port” category, Roads Connecting Queenslanders statesthat indicators will be developed in the following areas:measures of freight efficiency, travel time on the statehighway network by time periods, stakeholder feedback,and restrictions on commercial traffic due to naturalcauses (e.g., flooding).
Strategic plans—Government agencies are required toproduce strategic plans that link their action plans tooverall government policies. According to the strategicplan for Main Roads, “The Main Roads strategic plan ispart of a tiered planning framework to enable success-ful performance management. There is now an
C H A P T E R T W O
Interventions
Transport Performance,
Target Indicators
TransportPolicies
Broad goals for the Queensland
Figure 9. Relationship of performance indicators to agencydecisionmaking in Queensland.
Main Roads Outputs Government Outcomes
Safer roads Safer communities
Efficient and effective transport
Industry competitiveness and growth
Fair access and amenity Livable communities
Environmental management Environmental conservation
Table 5. Relationship among Main Roads outputs andgovernment outcomes.

integrated planning process with clear linkages toRoads Connecting Queenslanders, Strategic Plan, andall other business planning and policy developmentand clear accountabilities…. The integrated planningframework requires business plans for each divisionwithin Main Roads to demonstrate their contributionto the Strategic Plan. The budgeting framework alignswith the high-level services and products within theStrategic Plan.”
The strategic plan for Main Roads provides an exten-sive list of strategic issues, objectives, performancemeasures, strategies, and deliverables, and an imple-mentation timeline. The performance measures asthey relate to specific objectives are shown in table 6.The strategic plan for Queensland Transport alsoincludes a long list of objectives and correspondingperformance measures.
Road Implementation Program—The RoadImplementation Program is a five-year program thatincludes the priorities and policy choices that MainRoads will implement for the first two years, and “indica-tive funding and intentions” for the three years that fol-low. By law, the program must include the policies,financial provisions, and performance targets that guide
agency decisions. It also provides accountability for theprevious year’s performance by reporting on the attain-ment of stated targets. Performance indicators are listedfor 29 categories.
Annual reports—Both Main Roads and QueenslandTransport provide comprehensive annual reports thatoutline the progress made on each agency’s strategicplan. The performance of each agency’s core business
Transportation Performance Measures 23
K E Y F I N D I N G S
Figure 10. Strategic framework for road system asset management in Queensland.
“[Moving to a performanceorientation] has involved
a cultural shift inthe way the department
operates. It has meantmoving from collectingdata as audit material,to collecting data as part
of a conscious plan toimprove performance.”
—Main Roads Official
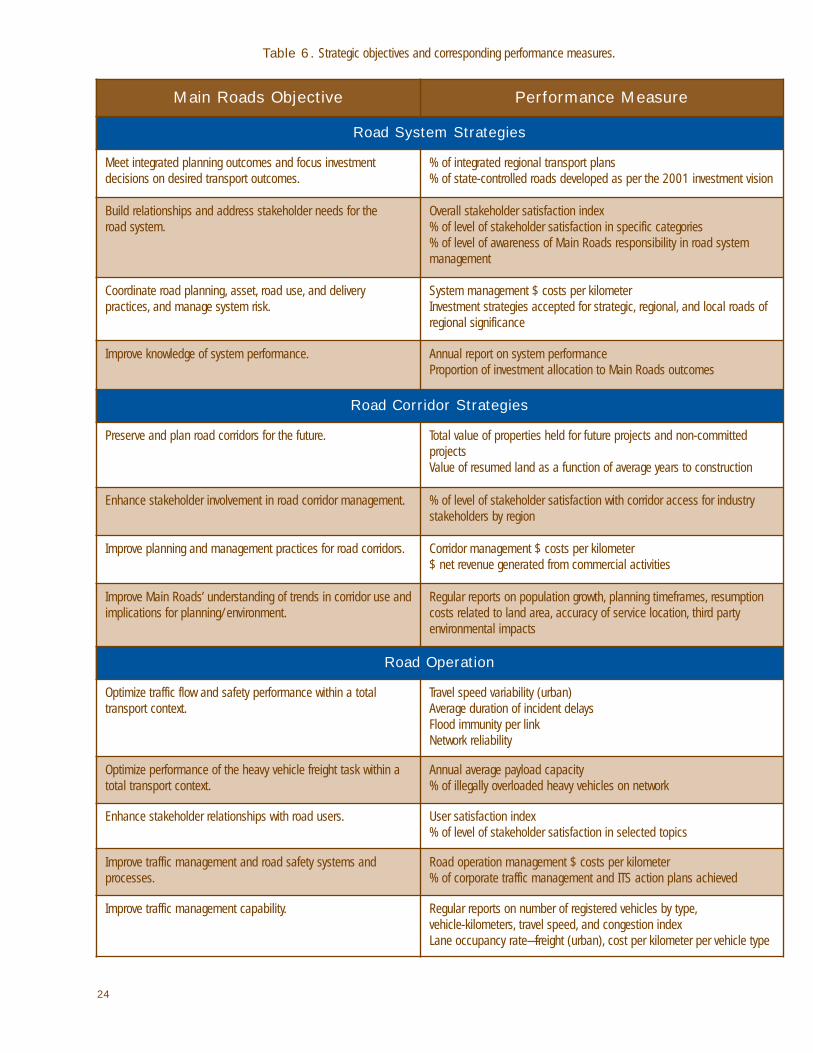
24
Main Roads Objective Performance Measure
Road System Strategies
Meet integrated planning outcomes and focus investment decisions on desired transport outcomes.
% of integrated regional transport plans % of state-controlled roads developed as per the 2001 investment vision
Build relationships and address stakeholder needs for the road system.
Overall stakeholder satisfaction index% of level of stakeholder satisfaction in specific categories% of level of awareness of Main Roads responsibility in road systemmanagement
Coordinate road planning, asset, road use, and delivery practices, and manage system risk.
System management $ costs per kilometerInvestment strategies accepted for strategic, regional, and local roads ofregional significance
Improve knowledge of system performance. Annual report on system performanceProportion of investment allocation to Main Roads outcomes
Road Corridor Strategies
Preserve and plan road corridors for the future. Total value of properties held for future projects and non-committed projectsValue of resumed land as a function of average years to construction
Enhance stakeholder involvement in road corridor management. % of level of stakeholder satisfaction with corridor access for industrystakeholders by region
Improve planning and management practices for road corridors. Corridor management $ costs per kilometer$ net revenue generated from commercial activities
Improve Main Roads’ understanding of trends in corridor use andimplications for planning/environment.
Regular reports on population growth, planning timeframes, resumptioncosts related to land area, accuracy of service location, third party environmental impacts
Road Operation
Optimize traffic flow and safety performance within a total transport context.
Travel speed variability (urban)Average duration of incident delaysFlood immunity per linkNetwork reliability
Optimize performance of the heavy vehicle freight task within atotal transport context.
Annual average payload capacity% of illegally overloaded heavy vehicles on network
Enhance stakeholder relationships with road users. User satisfaction index% of level of stakeholder satisfaction in selected topics
Improve traffic management and road safety systems andprocesses.
Road operation management $ costs per kilometer% of corporate traffic management and ITS action plans achieved
Improve traffic management capability. Regular reports on number of registered vehicles by type,vehicle-kilometers, travel speed, and congestion indexLane occupancy rate—freight (urban), cost per kilometer per vehicle type
Table 6. Strategic objectives and corresponding performance measures.
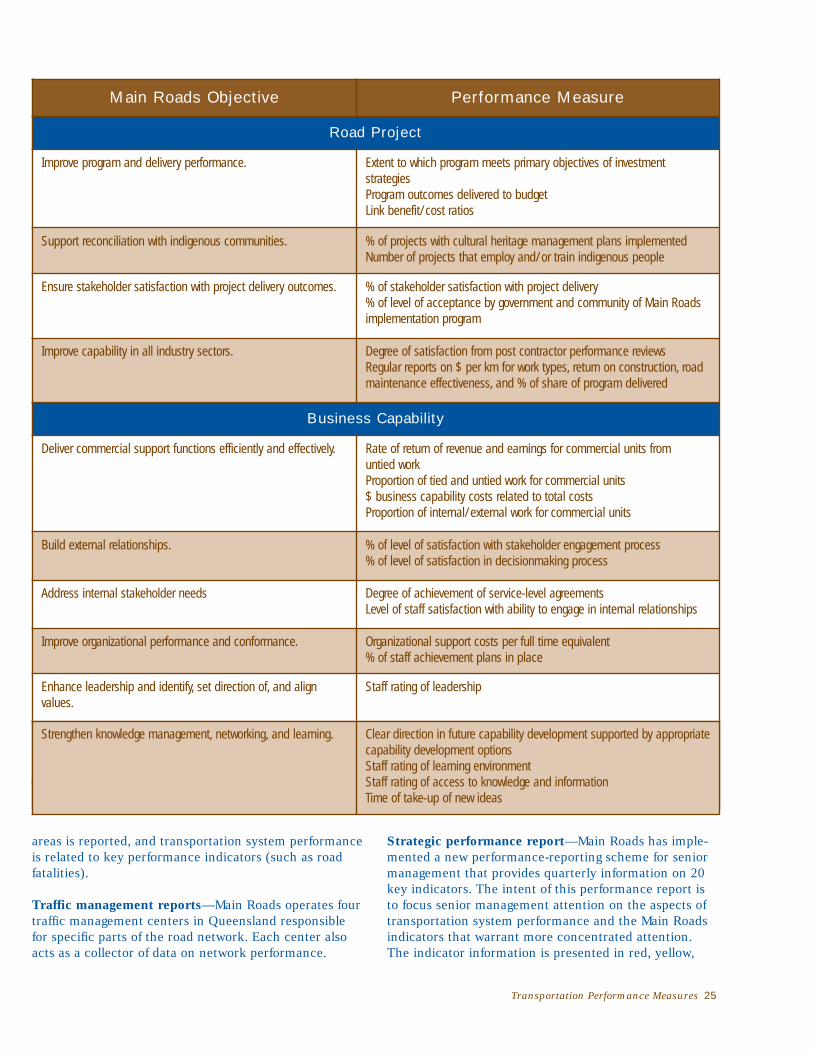
Transportation Performance Measures 25
Main Roads Objective Performance Measure
Road Project
Improve program and delivery performance. Extent to which program meets primary objectives of investment strategiesProgram outcomes delivered to budgetLink benefit/cost ratios
Support reconciliation with indigenous communities. % of projects with cultural heritage management plans implementedNumber of projects that employ and/or train indigenous people
Ensure stakeholder satisfaction with project delivery outcomes. % of stakeholder satisfaction with project delivery% of level of acceptance by government and community of Main Roadsimplementation program
Improve capability in all industry sectors. Degree of satisfaction from post contractor performance reviewsRegular reports on $ per km for work types, return on construction, roadmaintenance effectiveness, and % of share of program delivered
Business Capability
Deliver commercial support functions efficiently and effectively. Rate of return of revenue and earnings for commercial units from untied workProportion of tied and untied work for commercial units$ business capability costs related to total costsProportion of internal/external work for commercial units
Build external relationships. % of level of satisfaction with stakeholder engagement process% of level of satisfaction in decisionmaking process
Address internal stakeholder needs Degree of achievement of service-level agreementsLevel of staff satisfaction with ability to engage in internal relationships
Improve organizational performance and conformance. Organizational support costs per full time equivalent% of staff achievement plans in place
Enhance leadership and identify, set direction of, and align values.
Staff rating of leadership
Strengthen knowledge management, networking, and learning. Clear direction in future capability development supported by appropriatecapability development optionsStaff rating of learning environmentStaff rating of access to knowledge and informationTime of take-up of new ideas
areas is reported, and transportation system performanceis related to key performance indicators (such as roadfatalities).
Traffic management reports—Main Roads operates fourtraffic management centers in Queensland responsiblefor specific parts of the road network. Each center alsoacts as a collector of data on network performance.
Strategic performance report—Main Roads has imple-mented a new performance-reporting scheme for seniormanagement that provides quarterly information on 20key indicators. The intent of this performance report isto focus senior management attention on the aspects oftransportation system performance and the Main Roadsindicators that warrant more concentrated attention.The indicator information is presented in red, yellow,

26
and green to highlight the most serious performances,those deserving concern, and those meeting targets.
Performance indicators are also used to produce networkand route reports. Figure 11 shows how the data collect-ed for the performance measurement program can beused for more operational decisionmaking.
One interesting characteristic of the performancemeasurement strategy in Queensland is the continualreevaluation of the process and consequent efforts to
C H A P T E R T W O
“Performance measurementis fundamentally building
partnerships that havegone way beyond the
boundaries of ourindividual agencies.”
—Main Roads Official
Figure 11. Performance-related data for network and route planning in Queensland.
Figure 11a. Route performance report.

improve it. Research and thinking are examining dif-ferent ways of characterizing transportation systemperformance and how this performance relates tobroader goals. A multimodal performance framework isenvisioned that consists of modal characteristics byvehicle type, public and private sector, passenger ver-sus freight, freight task type (e.g., bulk, nonbulk, andlight commercial), urban versus rural, and destinationcharacteristics of transportation flows. All of theseinput dimensions are then related to outcomes, suchas system use, safety, pollutant emissions, anduser/community costs. The intent is to use thisinput/output/outcome matrix to monetize the value of
the relationships between cause-and-effect variables.By establishing this monetary relationship, QueenslandTransport will be able to prioritize proposed initiativesand projects by the expected value added to outcomes.In addition, the monetary values associated with keyinput/output/outcome relationships can be used tobenchmark Queensland’s performance with otherAustralian states.
Both Main Roads and Queensland Transport haveinternal audit units whose purpose is to identify opera-tional deficiencies, and to bring to management atten-tion matters relating to agency deficiencies on per-
formance accomplishment. Giventhe performance management cul-ture of both organizations, theinternal audit units have their ownperformance measures on the out-puts that contribute to organiza-tional success (e.g., number ofaudit reports generated, number ofworkshops conducted on corrup-tion prevention, and customerfeedback).
SafetyThe road safety program has benefited the most from a transport performance-based decisionmaking process inQueensland. A Road SafetyStrategy was adopted in 1993 that
outlined a long-term action planfor reducing fatalities and personalinjuries on Queensland’s road network. The approach adopted by Main Roads consisted of severalsteps based on a “knowledge management” structure developed
Transportation Performance Measures 27
K E Y F I N D I N G S
“You can haveall the indicators
you want, butsooner or later
you have tothink about it.”
—Main Roads Official
Figure 11b. Network performance report.
AM Peak Level of Service (Travel Efficiency) for StateControlled Roads in South Coast Hinterland District
28
in the mid-1990s at Harvard University. The stepsincluded the following:• Scan for needs, quantify, and rank.• Identify and assess actions to meet needs, focus on
largest needs first, and rank according to effectivenessin reducing the social cost of crashes.
• Monitor the implementation of actions.• Assess outcomes of actions implemented by comparing
macro outcomes to expected outcomes, comparing thescale of macro changes to the scale of changes fromroad safety actions, and benchmarking performancewith other jurisdictions.
The results of this multifaceted road safety strategyhave been impressive (and are reported on moreextensively in the chapter on safety). The performanceindicators used in the safety category include fatalitiesand serious casualty crashes per million vehicle-kilo-meters on state-controlled roads, social cost of crashes,and customer perceptions of safe travel.
CongestionPopulation growth in southeastern Queensland, primarily the Brisbane metropolitan area, has occurredfaster than in most other areas of Australia. In fact,Brisbane is predicted to have the fastest-growing congestion levels in Australia in the future. Not surprisingly, indicators of congestion and mobilitycomprise some of the core performance indicators for both Queensland Transport and Main Roads. The congestion/mobility indicators for both agencies reported in the 2002-2003 annual reports are as follows:
Queensland Transport• System stewardship• Implementation of a freight logistics strategy perform-
ance management framework• Community satisfaction with public transport services• Average private vehicle occupancy rates on key major
urban routes• Public transit patronage trend for buses, rail, and regu-
lated air and taxi services• Patronage trend in the corridor impacted by the South
East Busway• Travel times on select transport corridors during peak
hours of buses compared to autos• Proportion of Queensland’s public transport services
that are wheelchair accessible• Number of rail corridor sublease integrity breaches• Level of coordinated and integrated public transport
services in southeast Queensland
Main RoadsRoad corridors• Percentage of network that is multimodal• Percentage of stakeholder satisfaction with corridor
management
Road operations• Percentage of variability of travel time
For road operations, two additional measures relating totraffic flow performance and network use are beingdeveloped.
FreightBecause of the substantial expanse of Queensland andthe isolation of many rural communities, Queenslandhas adopted a proactive policy to provide rail and trucktransport services to these communities. Unlike the waveof privatization that swept other Australian states severalyears ago, Queensland has kept government involvementin many aspects of rail freight service and infrastructure.For example, a government-owned corporation calledQueensland Rail is responsible for the rail service onmany rail lines in the state. The rail infrastructure itself,called “below rail,” is owned by the government, whichhas established a Queensland Competition Authority toregulate competitive access to the rail network for third-party operators. Queensland Transport establishes trans-port service contracts with service providers that defineservice and performance requirements. These contractsalso specify “community service obligations,” activitiesor services that would not be normally undertaken by acommercial freight operator.
The rail infrastructure contract is for AU$1.5 billion(US$1.1 billion) over seven years and covers 6,540 km(4,064 mi) of track (about 70 percent of the rail network).Performance is measured against contractual requirementswith financial penalties charged for poor performance. Baseservice levels are established in the contract for an overalltrack condition index (OTCI), temporary speed restrictions(TSR), below rail delays, and below rail track availability.Quarterly and annual reports are provided to QueenslandTransport that present information on a wide range of per-formance indicators. The following are the most important: • Average trains per week (number)• Capacity use (percentage)• Average below rail delays (minutes)• Total below rail delay events (number)• Below rail track availability (percentage)• TSR variance against threshold (percentage)• OTCI last recorded number (number)
C H A P T E R T W O

Queensland Transport officials pointed to severalinstances when this performance and condition information led to targeted investments to improve the existing situation.
For passenger rail, Queensland Rail monitors ontime performance (with a desire to have 95 to 98 percent oftrains within three minutes of schedule), cancellations,safety, cleanliness, and number of passenger trips. Again,monitoring these indicators has led to specific actions,such as posting security guards in stations at night andpainting a blue line in terminals where patrons can standto be visible to security cameras.
Similar to the rail network, Queensland’s ports areowned by the state, with both the Minister of Transportand Main Roads and the state Treasurer as shareholders.Eight port authorities manage the 15 ports, which areoriented primarily toward export trade. The GovernmentOwned Corporations Act requires that ports operate asmuch as possible on a competitive basis, but the govern-ment can establish financial and nonfinancial perform-ance targets or require port managers to undertake com-munity service obligations, the same as for rail operators.Yearly statements of corporate intent and five-year cor-porate plans are required of port managers. Not surpris-ingly, given the competitive nature of the port industry,the performance measures reported to the shareholdingMinisters must include financial indicators (return onassets, and liquidity and leverage ratios), nonfinancialindicators (tonnage, berth occupancy, and vessel turn-around time), and compliance with public initiatives(labor relations issues, equal employment opportunity,and budgetary compliance with expenditure procedures).Ports are also permitted to develop their own indicatorson trade opportunities, security, logistics efficiency, andmaintaining competitive position in the market. Forexample, six ports report on environmental indicatorsbecause of local concern about the environmentalimpacts of port operations on sensitive nearby areas.
Environmental MonitoringPart of Main Roads’ vision includes “enhancing the envi-ronmental well-being of Queensland’s communities.” Toachieve this part of the vision, Main Roads has adoptedan environmental management policy and strategy thatcommits the agency to maintaining ecological processes,protecting biodiversity, improving equity within andbetween generations, and improving individual and com-munity well-being and welfare. In other words, the policycommits Main Roads to the basic principles of sustain-ability. Although the environmental record of Main Roads
is impressive—and is one of the better records forjurisdictions of comparable size—it was not clear to thescan team how environmental management has beenincorporated into the performance measurement regimeof Main Roads. Much of the performance measurementrelates to monitoring processes and procedures (e.g., 80percent of traffic management strategies should have anenvironmental component), as well as monitoring theperceptions of external and internal stakeholders. Theteam did not find any measures or indicators of ultimateoutcomes associated with good environmental manage-ment, an observation at almost all the sites it visited.
Queensland Transport has included in its performanceindicators several that relate to air quality, includinglevel of noxious motor vehicle emissions, trend ingreenhouse gas emissions, and percent of urban busfleet compliant with Euro 2 and Euro 3 emissionstandards. These indicators were listed under a “systemstewardship” heading.
Data SupportTransport officials in Queensland recognize the need fora strong data collection foundation for performancemeasurement efforts. One of the most extensive effortsobserved during the scan is Main Roads’ A RoadManagement Information System, known as ARMIS.ARMIS is an integrated computer data base managementsystem that processes data collected from numeroussources on Queensland’s state-controlled road network.The data collection and quality control for ARMIS occursin Main Roads’ 14 district offices, but the central officecoordinates format and operating procedures.Operational systems used in the districts to manage theirroad systems include road reference/road inventory,bridge information, pavement condition, traffic analysisand reporting, Road Crash 2, and road maintenance per-formance contracts management systems. The Road Crash 2 system is interesting in that it notonly records details of crash characteristics such as con-tributing circumstances, injuries, and locations, but italso ranks crash locations for remedial treatmentsthrough benefit-cost ratios and net present values of ben-efits and costs. The bridge information system also pro-duces a file exported to a whichbridge maintenance soft-ware package for prioritizing maintenance activities.
ObservationsImportant observations from the visit to Queenslandinclude the following:• The transport portfolio has developed an integrated,
comprehensive performance management framework
Transportation Performance Measures 29
K E Y F I N D I N G S

30
in which performance indicators are found consistentlyin the many plans and programs, reflecting differentlevels of decisionmaking in the agencies. A clear dis-tinction was made between outputs and outcomes,with a major research effort underway to assign mone-tary values to many relationships.
• An integrated regional transportation planningapproach coordinates the many different plans andprograms developed to improve transportation systemperformance in Queensland. Performance indicatorsare a major means of assuring that all planning effortsare coordinated.
• Top management commitment to performance manage-ment was evident in Queensland. This commitmentincludes not only directions to the organizations ondeveloping a useful performance management scheme,but a willingness to use the information it produces indecisionmaking. One high-ranking official noted that oneof the clear values of the performance management sys-tem was that it “got everyone on the same page.”
• Similar to other scan sites, an evolution in perform-ance measurement in Queensland appeared to lead tofocus on selected indicators as the most important.
• Public communication and dealing with the media arecritical in garnering public and legislative support forperformance management efforts. Main Roads, forexample, has about 20 staff members devoted to itsstrategic planning/performance measurement/publicoutreach activities. Working with a wide variety ofstakeholders and other government agencies requires astrong commitment to producing understandable infor-mation on what the agency is trying to accomplish andwhat progress it has made.
• Data collection and analysis are the foundation of thesuccessful performance management effort in Queens-land. Data are collected and analyzed on a large numberof indicators and factors affecting the economic andquality of life characteristics of Queensland. A data-richenvironment was one of the contributing factors to thesuccess of performance measurement in Queensland.
• Given the isolated nature of numerous Queenslandcommunities, the transportation agencies have devotedconsiderable attention in their performance indicatorsto impacts of transportation system performance onrural areas. This relates not only to outputs directlyunder Main Roads’ control, but also to the contracted
services under Queensland Transport’s responsibility.Part of this emphasis was also on freight movement. Ofall the groups the scan team visited, Queensland’stransport portfolio was most interested in the opera-tions performance of the freight and logistics system inits jurisdiction.
• Before-and-after analyses conducted on a sample ofprojects indicate the extent to which expected benefitsand costs were realized. This information is fed backinto the decisionmaking process so that expectationsfor similar projects in the future are realistic. In addi-tion, the concept of an “achievement index,” the ratioof benefits to costs before project implementation tothat after a project is in place, is one of the nationalperformance indicators for Austroads. It is not surpris-ing such a process is used in Queensland.
• As transportation officials noted, the process of devel-oping a performance measurement system is almost asimportant as the substance of the system itself in thata good development process can foster ownership inthe approach taken. With ownership, it becomes easierto ensure that performance measurement will influ-ence decisions. Along with this process is the need toinvest in the people who are part of the performancemeasurement system—those who collect and analyzethe data, and those who are the customers of the infor-mation produced.
SYDNEY, NEW SOUTH WALES
New South Wales is the most populous of the Australianstates, with seven million people. Between 1991 and2000, Sydney’s population increased 11 percent, andvehicle-kilometers traveled increased by 25 percent.Freight movement is expected to double in the next 10years. As the site of the 2000 Summer Olympic Games,Sydney and its transportation system received glowingmarks in handling the large numbers of visitors attendingthe event. The scan team visited New South Walesbecause transportation planning and decisionmaking inthis state has long been considered at the leading edgeinternationally. In addition, the state government hasadopted a performance-based approach to infrastructureinvestment that was worthy of investigation.
Governmental ContextThe Roads and Traffic Authority (RTA) is the agencyresponsible for road provision, maintenance, manage-ment, and use in New South Wales. The highway net-
C H A P T E R T W O

work in New South Wales consists of about 180,000 km(111,850 mi) of roads, including 14,500 km (9,010 mi)under state control, 3,100 km (1,926 mi) of nationalroads, and 18,500 km (11,496 mi) of regional roads forwhich the state provides some financial support. Theroad network includes 4,700 bridges, which are theresponsibility of RTA as well. In addition, RTA manages32 km (20 mi) of transit ways with 68 km (42 mi)planned. Also, 161 km (100 mi) of bus and transit lanesare on RTA-managed roads, and RTA is responsible for3,200 sets of traffic signals.
RTA is divided into five major service groups relating tothe agency’s core businesses: road safety, road mainte-nance, road development, traffic and transport, and reg-istration/licensing/enforcement.
Other important agencies in the governmental structureof New South Wales that affect transportation policyinclude the Ministry of Transport, which provides overallpolicy direction for transport agencies; Department ofInfrastructure, Planning, and Natural Resources, whichprepares the metropolitan plan for Sydney; RailCorp, agovernment-owned corporation, which provides passen-ger rail services; State Transit Authority, which is respon-sible for bus and some ferry services; and Department ofthe Treasury, which mandates procedures and processesfor performance management.
Use of Performance IndicatorsThe history of performance accountability in NewSouth Wales reflects some of the challenges that previ-ous transportation service providers have faced in liv-ing up to expectations. For example, New South Waleshad a plan for developing its rail infrastructure thatreflected an overestimation by elected officials of whatcould be delivered and an underestimation of costs bycivil service engineers. The plan, official for more thansix years, became discredited when some expectedoutputs were not delivered and others had unexpected-ly high costs. Dissatisfaction with unmet promises andconcerns about media monitoring of the lack ofprogress led to greater interest in developing a systemthat provided realistic estimates of transportation sys-tem performance and what steps needed to be taken toimprove performance.
The mission of RTA is to “deliver the best road trans-port outcomes, balancing the needs of public transportpassengers, cyclists, pedestrians, motorists, and com-mercial operators.” Outcomes are defined in two majorcategories, community outcomes and business out-
comes. Community outcomes are improving road safe-ty, moving people and goods efficiently, maintainingand renewing the road asset, developing sustainableland use and transport solutions, and serving frontlinecustomers. Business outcomes are building relation-ships, leading for performance, developing the agency’speople, being accountable, valuing the environment,and making the best use of resources.
The overall planning framework for RTA’s performancemeasurement is shown in figure 12 (see page 32). As thefigure shows, RTA has several reporting linkages to otherplanning elements and governmental agencies. The legis-lature requires an annual report, which must show thepast year’s activities and their alignment with theagency’s corporate plan (updated every two years).Budgets are established with specific performance agree-ments put in place to assure the linkage between themonies provided and the program activities. Each unit isexpected to have a business plan, and senior executivessign performance agreements that indicate expectedannual achievements.
As seen in figure 13 (see page 33), RTA’s corporateplan, The Journey Ahead, provides a five-year strategyfor RTA, including identification of performance indi-cators that guide investment decisions. Each RTA corebusiness area has a set of performance indicators thatprovides an overall framework for operating decisions.For example, the following performance indicatorswere identified for two areas:
Infrastructure DevelopmentNetwork and route performance measures• Rural levels of service (A to F), total crashes, injury
crashes per 100 motor vehicle-kilometers traveled,total crashes per kilometer
• Metropolitan area travel time surveys and modeled volume-to-capacity ratios
Project and program delivery measures• Scope control (project as originally proposed plus
variations)• Cost control (estimates versus actual costs)• Expenditure control (expenditure versus forecasts)• Monthly program reviews
The manner of collecting this data provides RTA withthe capability of disaggregating performance informa-tion to the individual route level. For rural areas, theroad network sample consists of 1,000 sections, whichare classified by similar functional characteristics. The
Transportation Performance Measures 31
K E Y F I N D I N G S

32
C H A P T E R T W O
Figure 12. Performance planning framework for the Roads and Traffic Authority in New South Wales.
urban network is divided into links, and the data col-lected for each link includes a.m. and p.m. peak travelspeed (by the floating car method), business hourstravel speed, current and forecast volume/capacityratios, current and forecast crashes per kilometer, anda composite performance indicator. With such a disaggregation, RTA can develop visuals such as figure13, which shows performance for a rural highway.
According to RTA officials, these measures are used to develop route-level strategies as well as an overallinvestment program. Strategic plans are created for roadcorridors with different options considered for highlydeficient links.
Business Area: Road MaintenanceThe government has adopted a policy of asset manage-ment that views infrastructure as a long-term renew-able asset, and that requires agencies to manage assetson a life cycle basis. RTA has developed a road assetpolicy that links maintenance decisions to networkperformance. A hierarchy of outcomes and outputs hasbeen developed for measuring performance of mainte-nance efforts. This hierarchy consists of the following:
Commitments• Business management
• Financial assistance• Disaster repairs
Safety• Availability for travel• Provision of safe travel
Retained value• Minimization of risks to asset integrity
Reliability• Provision of consistent route conditions• Productivity/level of service
The performance framework for infrastructure mainte-nance includes the specific measures shown in table 7.
Performance reporting, which covers all of the perform-ance measure categories shown in table 7, includes suchmeasures as community satisfaction levels, number ofstructurally deficient bridges on state roads, asset valua-tion, distribution of construction period for state andnational roads, average age of bridges, ride quality, pave-ment, and durability of paved rural roads. Contractorassessments are also part of the maintenance programassessment, including quality of work, time management,environmental management, contract administration,

Transportation Performance Measures 33
K E Y F I N D I N G S
Figure 13. Rural highway performance in New South Wales.
Infrastructure Maintenance Program Performance
Network PerformanceCustomer Outcomes
• Achievement of Customer Needs• Delivery of Government Commitments
Client PerformanceStrategy, Policy, Standards, Program
• Adherence to Govt’s Total Asset Management Policy• Process Benchmarking
Purchaser PerformanceAsset Management
— Planning— Pre-construction
Contract Management
• Adherence to Policies• Adherence to Management System• Program Administration/Project Management Measures
Contractor PerformanceTime, Cost, Quality of Outputs
• Delivery of Planned Outputs• Compliance to System and Standards• Price Competitiveness of Works
Table 7. Maintenance program performance measures.

34
and level of cooperation with RTA engineers. Figure 14provides an example of how this information is presentedto agency decisionmakers.
The New South Wales Treasury provides guidelines forreporting government agency outcomes. Each agency isrequired to develop a results and services plan (RSP) to“demonstrate the relationship between the services theagency delivers and the results it is working towards.”The questions the RSP is supposed to answer include thefollowing:• What results for the community is your agency trying
to achieve? What services does your agency provide,and how much do those services cost?
• How do you know that your agency is doing a good job?
• How can your agency do better? How will you measure“better” and what are your targets? What processimprovements can you make?
• What are your agency’s least important services? Whatservices can be scaled back or temporarily suspended?
• What policy and regulatory constraints does youragency face?
• What are the major risks your agency faces and how doyou manage them?
To make this reporting more user-friendly and under-standable to nontechnical audiences, the Treasury has
developed a new “results logic” that each agency mustfollow in its reporting (see figure 15). The majorchanges from the old approach and terminology areshown in table 8.
In this approach, the terms are defined in the following way:
Results• Are end points to be aimed for, rather than individual
activities or strategies.• Will be influenced by a broad range of factors, many of
which are beyond the control of an individual agency.
Services• Are the end products that the agency delivers to
society.
Intermediate results• Are concrete objectives that the agency can contribute
to in the short to medium term (12 months to threeyears).
Result indicators• Indicate a change in the community, environment, or
economy.• Reflect the effectiveness of the agency’s services in con-
tributing to results.
C H A P T E R T W O
RTS’S Aging Bridges
Figure 14. Sample presentation of asset management information in New South Wales.

• Help determine whether anyone is better off as a resultof the services delivered.
• Will probably be influenced by more than just theagency.
Service measures• Look at how efficiently the agency delivers its services,
as well as quality, access, and timeliness of servicedelivery.
The key philosophy of this approach to performancereporting and budget approval is that each agency mustconstantly demonstrate value received for the money itgets from the government.
Other performance accountability documents used aspart of this framework include an annual report, budgetsubmittals, and individual employee performance agree-ments (usually targeted at advancing specific projectsthrough the project development process).
RTA officials stated that the performance managementframework provides a constant, high-level focus on roadsafety, customer interaction, network reliability, infra-structure asset condition, and employee time lostbecause of injuries.
CongestionThe 2000 Olympics provided Sydney with a great incentive to upgrade its traffic management system.With the expected surge in vehicles and people usingSydney’s transportation system, RTA officials put inplace advanced traffic surveillance and control systemsthat are a legacy of the Olympic Games. Perhaps thegreatest benefit was an enhanced traffic managementcenter (TMC) that provides 24-hour-a-day, seven-days-a-week management of the road network. TMC has 170staff members, with up to 18 traffic controllers workingper shift. More than 400 closed-circuit cameras feedinginto TMC monitor and control traffic flows. Electroniclane changing (with actual movement of low-rise barri-ers from one lane to another controlled from TMC) isused to optimize throughput at key bottleneck points,such as the Sydney Harbor Bridge. Variable messagesigns, variable speed limit signs, radio communicationwith all public transit buses, and rapid response inci-dent management patrols are all managed from theoperations center. A memorandum of agreement hasbeen signed with the police for handling incidents onthe state road system. Transit and police representa-tives at the center coordinate responses to incidentsrequiring a multiagency response. In addition, TMC has
Transportation Performance Measures 35
K E Y F I N D I N G S
Old NewOutcomes Results
Intermediate outcomes Intermediate results
Outcome achievement indicators Result indicators
Outputs Services
Output performance measures Service measures
Intervention logic Results logic
Table 8. Change in performance terminology in New South Wales.
Result
Which requires
Service Groups
IntermediateResult
IntermediateResult
IntermediateResult
Which requires
Which requires
Which requires Cap
acity
to
influ
ence
res
ults
incr
ease
s
Leve
l of
acco
unta
bilit
y in
crea
ses
Figure 15. Results logic for performance monitoring usedby the New South Wales Department of Treasury.

36
adopted a policy of sending customer calls directly tooperators on the TMC floor. As might be expected fromthis wide-ranging data collection capability, much ofthis network control is accompanied by the ability tocollect data on network performance.
Another substantial data collection asset is the SydneyCoordinated Adaptive Traffic System (SCATS), developedby RTA to provide coordinated traffic signal strategies forthe road network. Not only does SCATS allow for theoptimal control of a signal network, but it also can beused to provide a “green light corridor” that expeditesemergency vehicles through the network by giving thema green light progression. For the recent rugby worldchampionship in Sydney, this capability was used tospeed teams and other officials to different locations inthe city (100 green light corridors were used in one day).Through its commercial unit, RTA has sold SCATS to 85metropolitan areas in 15 countries. Because of the ubiq-uitous nature of the SCATS application at intersectionsin Sydney, RTA is able to collect a range of data on trafficflows and delays.
The final ITS-related data collection capability for RTAcomes from the widespread use of electronic toll collec-tion (ETC) technology for toll roads and bridges in thestate. Dual protocol systems allow interoperability withETC systems in Brisbane and Melbourne. Sydney has
about 450,000 ETC tags, a number expected to grow to1.5 million in two years. More than 900,000 ETC tags arein use in Melbourne. All buses use ETC technology, as do85 percent of Sydney’s taxis.
The Roads and Traffic Management section of RTA hasestablished several outcome and output measures thatrelate to the operational performance of the road net-work. Outcome measures include travel speeds, conges-tion, traffic volumes, and community satisfaction.Congestion measures were the same as those provided tothe Austroads national performance indicator database.The team noted that, given the data-collecting capabilityof SCATS, RTA also monitors intersection congestion fortotal minutes of delay (see figure 16). Output measuresincluded the following: • Number of incidents on the road network • Time taken to respond to and clear incidents on the
network • TMC telephone call statistics for the average 3,000
calls per day (e.g., number of calls responded towithin 30 seconds, with a target of 75 percentanswered within 30 seconds and 95 percentanswered within 60 seconds)
• Provision of bus lanes/transit lanes/transit ways in kilometers
• Enforcement of bus priority lanes • Provision of bicycle ways in kilometers
C H A P T E R T W O
Figure 16. Monitoring intersection delay in Sydney.

• Number of minutes without signal detection capability • Development of pedestrian facilities and access plans
Most measures are reported on a monthly basis, althoughthe number of kilometers provided for certain facilitytypes is reported annually.
For other modes of transportation, SCATS is used proac-tively to monitor and manage bus reliability. Bus lanemonitoring is used to measure bus travel speeds, andvehicle occupancy data is collected as well.
SafetyRTA is the lead agency for road safety in New SouthWales, spending about AU$120 million (US$87.6 million)each year. The safety program emphasizes engineering,behavioral, enforcement, and regulatory strategies.Although RTA focuses on engineering design as a strategyto improve safety (e.g., divided highways, guardrails,rumble strips, etc.), it also funds police to enforce speedlaws on the state road network.
Over the past 50 years, New South Wales has had a sig-nificant impact on road fatalities, recording only 553deaths in 2003, the second lowest fatality level since1949, even though population, vehicle-kilometers trav-eled, and number of drivers have grown significantly. Toachieve this impressive record, RTA has developed closepartnerships with the New South Wales Police, MotorAccidents Authority, Department of Corrective Services,Department of Education and Training, Department ofHealth, local governments, and many others.
Key performance indicators for safety include the following:• Fatalities and fatality crashes• Injuries and injury crashes• Fatalities per 100,000 population• Fatalities per 100 million vehicle-kilometers• New South Wales fatality rates benchmarked against
other states and countries• Year-to-date and 12-month trends compared to previ-
ous-year and three-year averages• Measurements by road types, speed zones, age groups,
class of road user, and RTA regions
For program goals, one purpose of national and stateroad safety plans is to define achievement targets. Forexample, the National Road Safety Strategy for 2001-2010 states that the number of road fatalities per100,000 population should be reduced by 40 percentfrom 9.3 in 1999 to no more than 5.6 in 2010. The New
South Wales Road Safety 2010 strategy has a moreaggressive target of reducing the number of fatalities onNew South Wales’ roads by 50 percent by 2010.
Similar to the United States, fatality and injury data arecollected by the police and forwarded to RTA. Crash dataare analyzed to discern significant causal factors (e.g.,speed, fatigue, drunk driving, etc.) and programs areredirected or created to deal with the most significantfactors. For established programs, RTA conducts benefit-cost analyses to determine which are most effective inhelping RTA achieve its safety goals. For example, RTAofficials state that crash statistics show that the mosteffective prevention strategies have been compulsoryseatbelt use and random breath testing.
RTA officials stated that the key lessons from manyyears of aggressive safety programs are that engineer-ing solutions are the ultimate consideration for devel-oping a safe system, agencies should target resources(people and dollars) at problems identified throughanalysis of crash data, and “silver bullets” are rare.They emphasized that it takes a lot of work and com-mitment to make a difference.
Post-Construction ReviewsAll of the sites visited conducted post-construction andpost-implementation reviews of a sample number of proj-ects. The New South Wales approach is a good exampleof the process followed in this review program. As notedin the RTA guidelines, “project post completion reviewsprovide a principal means of obtaining lessons learnedfrom previous projects. They represent a feedback loopto inform future projects and facilitate a culture of con-tinuous improvement for both project delivery and proj-ect outcomes.”
The process for post-construction reviews (PCRs) isshown in figure 17 (see page 38). The review is under-taken about two years after construction has beencompleted. Teams of reviewers are used to assess dif-ferent stages of project development, delivery, andimpact. Each team is involved with some aspect oftotal project review. For example, team A could assessproject development, and team B could conduct boththe project implementation and outcomes assessmenteffort. Team C might participate in the assessment ofsome portions of the project development process, aswell as work with team B on the outcomes assessment.The primary method for conducting a PCR is to hold aworkshop at which officials and engineers answer specific evaluation questions.
Transportation Performance Measures 37
K E Y F I N D I N G S
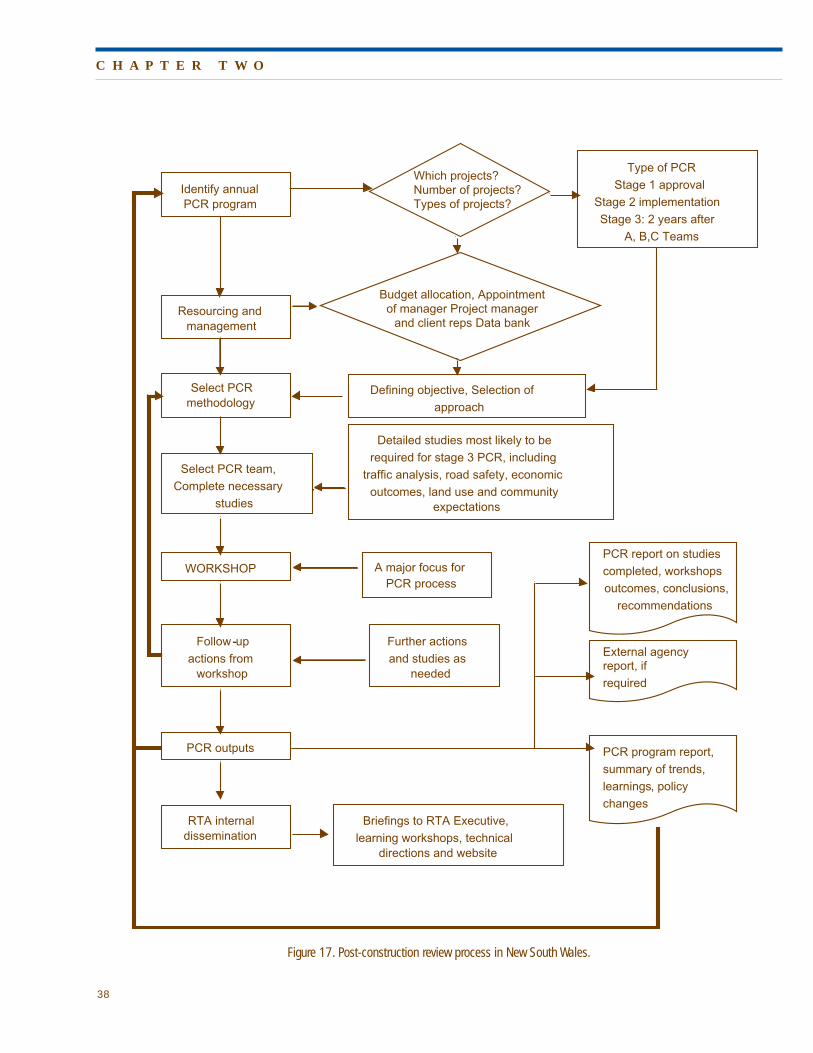
38
C H A P T E R T W O
Figure 17. Post-construction review process in New South Wales.
Identify annual PCR program
Resourcing and management
Select PCR methodology
Select PCR team,
Complete necessary
studies
WORKSHOP
Follow-up
actions from workshop
PCR outputs
RTA internal dissemination
Defining objective, Selection of
approach
Detailed studies most likely to be
required for stage 3 PCR, including
traffic analysis, road safety, economic
outcomes, land use and community expectations
A major focus for PCR process
Further actions
and studies as needed
Briefings to RTA Executive,
learning workshops, technical directions and website
Type of PCR
Stage 1 approval
Stage 2 implementation
Stage 3: 2 years after
A, B,C Teams
PCR report on studies
completed, workshops
outcomes, conclusions,
recommendations
External agency report, if
required
PCR program report,
summary of trends,
learnings, policy
changes
Which projects?Number of projects?Types of projects?
Budget allocation, Appointmentof manager Project manager
and client reps Data bank

ObservationsThe scan team’s most important observations from thevisit to New South Wales include the following:
• As with other scan sites, the best example of applyingperformance measurement in a decisionmaking or poli-cymaking context was found in RTA’s safety program.With many years of historical data, the cause-and-effect linkage between actions taken by RTA and otheragencies in response to analysis and system monitoringhas been shown decisively. The effectiveness of theseefforts is impressive.
• RTA devotes considerable effort to identifying customerneeds, which several officials said drives their businessmodel. Surveys are conducted not only on the per-ceived effectiveness of RTA, but also to determine whataspects of transportation system performance need themost improvement. This information is fed into thecorporate decisionmaking process.
• RTA uses benchmarking in several core business areasto identify how its activities compare with other juris-dictions. In addition, benchmarking of maintenancecontractors is used to assess the performance of eachcontractor compared to others working for RTA.
• RTA is advanced in its use of ITS technologies for sur-veying system performance. Both the existence of astate-of-the-art traffic management center and theextensive use of the SCATS traffic signal monitoringprogram provide RTA with substantial data-collectioncapabilities, which it uses to good effect in monitoringsystem performance.
• Asset management and the information producedthrough RTA’s asset management system are becomingmore important in the overall scheme of RTA decision-making.
• RTA has developed an extensive and structuredapproach to post-construction review to assess theeffectiveness of implemented projects. This processrequires significant commitments of time and effort byRTA to provide this feedback information to the deci-sionmaking process in the agency.
• RTA has made considerable progress in developing anenvironmental policy that relates to the goals andobjectives of the organization. In fact, in 2002 the NewSouth Wales Audit Office gave RTA accolades for theprogress it has made with such linkage. Since 1998, the
RTA annual plan has reported on the progress made inthe environmental management arena. The issues ofgreatest importance were listed as air quality/green-house gases, water quality, biodiversity, noise, land use,waste, and cultural heritage. As the team noted atother scan sites, however, RTA has not developed indi-cators that link transportation system performance toenvironmental outcomes. The RTA staff has decided toadopt a top-down approach by asking the RTA director-general and other key agency officials what is reallyimportant to measure for environmental management.Some indicators under consideration include theextent of externalities caused by transportation recov-ered in fees, level of resource recycling and substitu-tion in construction activities, and degree of roadsidequality maintenance. For the latter issue, any contrac-tor with a maintenance contract with RTA of morethan $1 million must have an environmental manage-ment system as part of its business operations.
MELBOURNE, VICTORIA
Victoria is a relatively small state geographically, repre-senting just three percent of Australia’s landmass, but itis Australia’s second most populous state, with 4.8 mil-lion people (24 percent of the country’s population). Justover 70 percent of these 4.8 million live in theMelbourne metropolitan area. Victoria has more than 3.3million licensed drivers driving 4.1 million vehicles, one-third of Australia’s motor vehicle fleet. Victoria also han-dles one-quarter of Australia’s road freight (or as theAustralians call it, “road freight task”). Victoria has along history of being at the cutting edge of transportationpolicy and planning, including the use of performancemeasures, which is why the scan team visited the state.
Governmental ContextTwo agencies in particular are important actors in transportation planning and decisionmaking in Victoria.VicRoads, the state road and traffic management authori-ty, has five goals: 1) assist economic and regional devel-opment by improving the effectiveness and efficiency ofthe transport system; 2) assist the efficient movement ofpeople and freight, and improve access to services for alltransport system users; 3) achieve a substantial reduc-tion in the number and severity of road crashes and theresultant cost of road trauma; 4) be sensitive to the envi-ronment through responsible management of the trans-port network; and 5) provide efficient, effective, national-ly consistent, customer-oriented driver licensing, vehicleregistration, revenue collection, and driver and vehicle
Transportation Performance Measures 39
K E Y F I N D I N G S

40
information services. The chief executive of VicRoadsreports to the Minister of Transport. Four core businesseshave been defined for VicRoads—road system manage-ment, road safety, traffic and transport integration, andregistration and licensing.
The Department of Infrastructure (DOI) is responsiblefor essential infrastructure in Victoria, including trans-port, major development, information and communica-tion technology, energy and security. DOI’s primaryobjectives are 1) linking the transport system of road,rail, air, and sea channels to promote economic andsocial development through increased mobility andaccess, and a more cost-effective freight and logisticssector; 2) promoting efficient and integrated transportservices across different modes while managing roadand freight traffic growth to address the needs of thetraveling public and industry; 3) delivering the govern-ment’s major transport infrastructure investments; 4)providing strategic policy advice, analysis, and supportto government, stakeholders, and communities onenergy policy, information and communication tech-nologies, and transport systems; and 5) delivering awide range of other major projects on behalf of govern-ment departments and agencies.
Use of Performance IndicatorsThe Victorian government has adopted a performance-based approach to government delivery of services.Government policy is intended to drive state agency strategic planning (known as corporate
planning), which, in turn, drives the business or shorter-term output planning. Figure 18 shows howDOI views the relationship among these three levels ofdecisionmaking. Note the relative location in this pyramid of both outcomes and outputs. Investments in infrastructure, according to DOI officials, are drivenby performance indicators and system performancegaps determined through a continual monitoring ofthese indicators.
Government policy stands at the apex of the pyramidin figure 18. For Melbourne, two such policies provideimportant guidance to infrastructure planning anddecisionmaking—Growing Victoria Together, a state-ment of desired future directions for Victoria, andMelbourne 2030, a land use/transport plan developedby Victoria’s Department of Sustainability andEnvironment. The DOI corporate plan includes modalinvestment strategies aimed at meeting governmentpolicy targets. The government has set targets as partof a public process, to some extent supported by tech-nical analysis. Although these targets are consideredaspirational, they reflect government leaders’ under-standing that they are based on some level of assess-ment of technical and political feasibility.
The key targets for transport include the following:• Public transport mode share in Melbourne will reach
20 percent of motorized trips by 2020.• Road fatalities and serious injuries will decline 20 per-
cent by 2007.• Freight tonnage to andfrom commercial ports willhave a 30 percent railmodal share by 2010.
Of these three targets,achieving the 20 percentmode share for publictransport appears to be themost ambitious and chal-lenging. As noted by someVicRoads officials, quanti-fying the costs of conges-tion for travelers, for thefreight sector, and on theeconomy is considered keyin convincing governmentleaders that the potentiallymost controversial strate-gies might be necessary. Toachieve such a share would
C H A P T E R T W O
Figure 18. Role of performance measurement in corporate planning in Victoria.
DOI Corporate Planning Elements

most likely require some type of congestion pricingscheme, similar to that implemented in London.
DOI transportation-related performance indicatorsinclude the following:
Public Safety and Security• Road deaths and serious injuries• Public transport passenger deaths, incidents near
railway station, and customer satisfaction• Marine deaths and serious injuries• Adequacy of security risk management of cities’
infrastructure
Infrastructure Delivery and Management• Percentage of projects delivered within plus or minus
10 percent of budget, time, and scope• Completion of key projects by specified completion
dates• Rail track condition (network temporary speed
restrictions)• Rail signal condition (signal equipment failures)• Rail traction power condition (traction power
equipment failures)• Road travel undertaken on “smooth” roads
Access and Mobility• Public transport
– Percentage of motorized trips in Melbourne– Compliance with law requiring access to the public
transport system and vehicles for disabled persons– Response times for taxis for the disabled– Reliability of service provision and customer services
(level of fully operating ticketing machines)– Customer satisfaction– Network average speed for trams and buses
• Road congestion delays on urban arterial roads
Rural and Regional Development• Proportion of specified roads developed for minimum
safe travel time• Public transport
– Reliability of service provision– Customer satisfaction– Compliance with law requiring access to the public
transport system and vehicles for disabled persons
Seamless Freight and Logistics System• Freight productivity
– Share of freight tonnage transported to and from Victoria’s commercial ports by rail
– Freight rates for containers by road and rail
– Freight rates for specified commodities– Container movements to and from freight terminals
(percent empty vehicles and percent empty containerslots on vehicles)
• Freight Infrastructure– Percentage of travel undertaken on “smooth” roads– Rail track condition (network temporary speed
restrictions)– Percentage of arterial road network accessible to legal
freight vehicles– Traffic delays because of congestion on urban arterial
roads
Organizational Capability Building• Completion of a workforce management framework• Staff profiles that match desired profiles• Percentage of staff managing projects greater than $50
million who have contract management accreditation• Participation rates by women in senior executive pro-
fessional development programs• Number of government agencies contracting with DOI
for corporate service
Several performance indicators are different from thosefound in other locations, mainly because of DOI’s uniquerole in Victoria’s government. DOI was the only agencythe scan team visited that attempted to incorporateinfrastructure security into its performance managementframework. The issue of security has been a complicatedone from the perspective of performance measurementin that it is not clear how security can be measured. TheDOI indicator is simply the degree to which agencies arein compliance with their risk management plans, certain-ly not a measure of actual security, but rather a measureof preparedness for potential incidents.
The emphasis on mobility and vehicle access needs ofdisabled persons was also an unusual performance meas-ure, compared to other scan sites. This emphasis wasprovided for both urban and rural areas of Victoria.
The focus on rural areas was another interesting charac-teristic of the DOI performance indicators. In addition tomobility opportunities for disabled persons, rural empha-sis was also given to road development and provision oftransit services for the general public.
Another interesting set of performance indicators is seenin the category for freight and logistics. Although otherjurisdictions had freight-related measures, DOI had amuch higher level of detailed indicators (except possiblythose found in Queensland), again reflecting the unique
Transportation Performance Measures 41
K E Y F I N D I N G S

42
role of DOI and the government in freight infrastructure.The concern about freight reflected both the issue of eco-nomic competitiveness (e.g., freight rates) and the envi-ronmental consequences associated with freight move-ment (mode share to commercial ports).
The final category emphasized the organization’s capabil-ity to deliver promised services and products. The teamobserved concern about training and professional devel-opment in other cases, but the focus on participationrates for women in professional development programswas unique.
Figure 19 illustrates DOI reporting of key performanceindicators.
DOI became involved in another performance-relatedapplication when the tram and passenger rail systemwas privatized in 1999. Because a significant reductionof the transit agency’s size in the 1990s affected itsperformance and a transit strike disrupted transporta-tion in Melbourne, the government decided to privatizethe rail systems serving metropolitan Melbourne. Fivefranchises were awarded to three companies, with fair-ly stringent patronage, revenue, cost, and subsidy fore-
casts (and thus economic justifications) incorporatedinto 10- to 15-year contracts. The philosophy at thetime was to transfer as much risk as possible to thefranchisees. Minimum service levels were specified,financial incentives were provided to improve reliabili-ty, and franchisees were required to own or lease theinfrastructure. The franchisees were required to main-tain the infrastructure in good long-term condition,and to purchase AU$1.5 billion (US$1.1 billion) in newvehicles. Although service performance improvedunder the franchise agreements, revenue expectationsdid not materialize, leading one franchisee operatingthree systems to withdraw from its contract. Inresponse, the government refranchised the rail systemwith new conditions.
What to include in the new agreements became animportant part of the negotiations with the franchisees.Many considerations became performance require-ments in the new franchise agreement. Because performance-based service contracts are an importantmeans of institutionalizing performance measures, it interesting to note the reasoning behind the inclusion or exclusion of these measures in the franchise agreement.
C H A P T E R T W O
Figure 19. Illustrative reporting of key DOI performance indicators in Victoria.
Key Performance Indicators Reporting
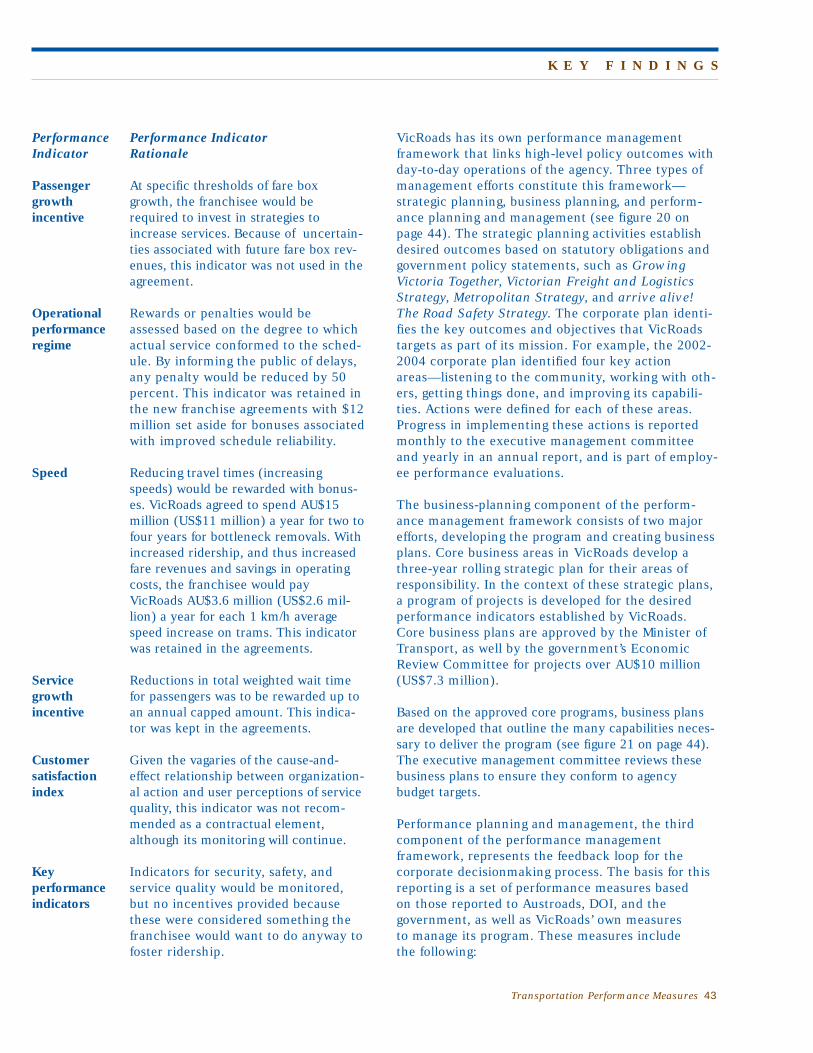
VicRoads has its own performance managementframework that links high-level policy outcomes withday-to-day operations of the agency. Three types ofmanagement efforts constitute this framework—strategic planning, business planning, and perform-ance planning and management (see figure 20 onpage 44). The strategic planning activities establishdesired outcomes based on statutory obligations andgovernment policy statements, such as GrowingVictoria Together, Victorian Freight and LogisticsStrategy, Metropolitan Strategy, and arrive alive!The Road Safety Strategy. The corporate plan identi-fies the key outcomes and objectives that VicRoadstargets as part of its mission. For example, the 2002-2004 corporate plan identified four key actionareas—listening to the community, working with oth-ers, getting things done, and improving its capabili-ties. Actions were defined for each of these areas.Progress in implementing these actions is reportedmonthly to the executive management committeeand yearly in an annual report, and is part of employ-ee performance evaluations.
The business-planning component of the perform-ance management framework consists of two majorefforts, developing the program and creating businessplans. Core business areas in VicRoads develop athree-year rolling strategic plan for their areas ofresponsibility. In the context of these strategic plans,a program of projects is developed for the desiredperformance indicators established by VicRoads.Core business plans are approved by the Minister ofTransport, as well by the government’s EconomicReview Committee for projects over AU$10 million(US$7.3 million).
Based on the approved core programs, business plansare developed that outline the many capabilities neces-sary to deliver the program (see figure 21 on page 44).The executive management committee reviews thesebusiness plans to ensure they conform to agency budget targets.
Performance planning and management, the thirdcomponent of the performance management framework, represents the feedback loop for the corporate decisionmaking process. The basis for thisreporting is a set of performance measures based on those reported to Austroads, DOI, and the government, as well as VicRoads’ own measures to manage its program. These measures include the following:
Transportation Performance Measures 43
K E Y F I N D I N G S
PerformanceIndicator
Passenger growth incentive
Operational performanceregime
Speed
Service growth incentive
Customer satisfactionindex
Key performanceindicators
Performance IndicatorRationale
At specific thresholds of fare boxgrowth, the franchisee would berequired to invest in strategies toincrease services. Because of uncertain-ties associated with future fare box rev-enues, this indicator was not used in theagreement.
Rewards or penalties would beassessed based on the degree to whichactual service conformed to the sched-ule. By informing the public of delays,any penalty would be reduced by 50percent. This indicator was retained inthe new franchise agreements with $12million set aside for bonuses associatedwith improved schedule reliability.
Reducing travel times (increasingspeeds) would be rewarded with bonus-es. VicRoads agreed to spend AU$15million (US$11 million) a year for two tofour years for bottleneck removals. Withincreased ridership, and thus increasedfare revenues and savings in operatingcosts, the franchisee would payVicRoads AU$3.6 million (US$2.6 mil-lion) a year for each 1 km/h averagespeed increase on trams. This indicatorwas retained in the agreements.
Reductions in total weighted wait timefor passengers was to be rewarded up toan annual capped amount. This indica-tor was kept in the agreements.
Given the vagaries of the cause-and-effect relationship between organization-al action and user perceptions of servicequality, this indicator was not recom-mended as a contractual element,although its monitoring will continue.
Indicators for security, safety, andservice quality would be monitored,but no incentives provided becausethese were considered something thefranchisee would want to do anyway tofoster ridership.

44
C H A P T E R T W O
Figure 21. Business plan development for VicRoads.
Figure 20. Performance-based management activities at VicRoads.
ExternalRoad system • Safety• Travel times/congestion• Road smoothness• Lane/vehicle occupancy • Environment• User costs• User satisfaction
Programmed project delivery• Achievement index• Expenditure versus budget• Project scope and cost control
Program effectiveness• Road maintenance effectiveness• Smooth travel exposure• Return of construction expenditure• Return on nonconstruction-related initiatives
Customer service• User satisfaction• Customer waiting times• Responding to priority correspondence• Calls lost and time taken to answer telephone
InternalBusiness efficiency• User transaction efficiency for registration and
licensing transactions and benchmarking unit costs of road maintenance
Business unit profitability (VicRoads has developed anaffiliated technical consulting group that works interna-tionally on a competitive basis.)• Current and forecast profit and loss for off-budget
business areas• Return-on-asset indicators monitor the effective use of
assets
Team and individual capability and performance• Individual and/or team key result areas, linked to
business plans
Workforce productivity, health, and safety• Overtime use, annual leave, sick leave, accidents
Several performance management systems are used tocollect the data to support this framework. An assetmanagement system collects data on road and bridgeconditions, a traffic management system collects data on
traffic flows, and a customer service management systemkeeps track of customer service characteristics.
SafetyThe scan team observed perhaps the most impressiveapplication of a performance-based planning and deci-sionmaking process of any site visited in Victoria’s roadsafety program. The program has existed for many years,providing the opportunity to identify through absolutenumbers and trends what impact it has had in achievingsafety goals. The specific characteristics of Victoria’s safe-ty program are so impressive (by U. S. standards) thatthey are described in more detail in the chapter on safety.
As noted previously, VicRoads monitors a large numberof performance measures on road safety, classifyingthese measures by total amount and rate of incidence,user type, and fatality-related causal factors (e.g., ille-gal blood-alcohol concentrations). Victoria’s road safetystrategy—called arrive alive!—represents a five-yearplan to improve road safety in the state. Three government ministers have supported the plan, whichin essence becomes the guiding strategy for all roadsafety-related agencies in the government. The government has established a 2007 target of a 20 percent reduction in fatalities and serious injuries, and has created a ministerial coordinating group tooversee the program.
Figure 22 (see page 46) shows the status of road safety inVictoria and the goals established. VicRoads has beendesignated the lead agency in coordinating the activitiesof various agencies to achieve these outcomes. In con-junction with achieving these outcomes, VicRoads is alsoinvolved with 17 safety challenges outlined in arrivealive! (See table 9 on page 46.)
An important foundation for safety performance monitoring efforts is a database and data analysis sys-tem that provides VicRoads and others with, in theirterms, “knowledge.” To support the safety-related plan-ning and decisionmaking process, data are collectedfrom VicRoads, Victoria Police, Transport AccidentCommission, Department of Justice, Institute ofForensic Medicine, hospitals, research agencies, and alimited number of local governments. To be useful inthe VicRoads performance framework, crash data musthave associated with it a large number of attributes(e.g., location details, participant characteristics, pre-vailing conditions, vehicle characteristics, etc.). Inaddition, this data must be input into a data manage-ment system called the Road Crash Information
Transportation Performance Measures 45
K E Y F I N D I N G S

System (RCIS), which provides numerous crashreports to VicRoads. The director general, for example,gets daily updates on fatalities, with a one-day turn-around for data from the originating authority to arriveon the director general’s desk. RCIS is also used toestablish priorities, understand types of crashes andtheir locations (e.g., run-off-the-road crashes), allowthe public to conduct its own analysis of crash data,and benchmark different communities in Victoria.
The performance measures discussed above are reportedprimarily to the VicRoads leadership and, throughVicRoads, to the public and elected representatives. AMinisterial Council for Road Safety—consisting of theMinisters of Transport, Police/Emergency Services, andthe Transport Accident Commission—has a much high-er-level perspective on performance measures andincludes additional measures of concern. For example,the council monitors the number of hours of actual oper-ation for mobile blood-testing laboratories compared torequired hours of operation during expected high-risktimes (e.g., holidays). This is really more an outputmeasure than one focusing on outcomes, but somethingthat the council believes it can control.
Another output-oriented measure relates to a VicRoads-led partnership with local governments, Victoria Police,Transport Accident Commission, Municipal Associationof Victoria, and Royal Automobile Club of Victoria.Called the Saferoads Partnership, the program encour-ages (with $5,000 and a required one-to-one match)development of local road safety strategies, such as older
driver safety programs,child restraints, land useplanning, young driversafety education, andmotorcycle safety. TheVicRoads’ performancemeasures associatedwith this programinclude the following:• Number of local gov-
ernments participating(78 of 79)
• Number of road safetyofficers/coordinatorsemployed by localgovernments (22)
• Number of areas withsafe driving policies (15 of 24)
Increased investment on high-crash local road sections A similar program for 24 Community Road SafetyCouncils (CSRCs), in which each council is eligible toreceive up to AU$35,000 (US$25,620), has the followingtypes of performance measures: number of programs thattarget key issues and have sustained effort, number ofprograms that support statewide initiatives, and numberof joint programs involving CSRS, local government, and schools.
FreightAs noted above, the Victoria government has incorporat-ed a policy concern for freight movement into the DOI
46
C H A P T E R T W O
0.951.2↓32%0.841.24
Deaths per
10,000
vehicles
6.728.15↓24%6.68.7
Deaths per
100,000
population
330397↓20%331414Deaths
Actual
2003
Actual
2002
%
Change
Needed
Target
2007
Before
(1999-
2001 Av)
The arrive alive! Challenge
Figure 22. VicRoads’ safety targets.
Safety challenges forVicRoads.
Enhanced crash information
Speed and speeding
Road design and roadside safety
Drunk driving
Fatigue
Drugs and driving
Occupant protection
Post-crash trauma
Young/novice driver safety
Older driver safety
Pedestrian safety
Motorcycle safety
Bicycle safety
Heavy vehicle safety
Driver issues
Working with the community
Public transport safety
Table 9. Seventeen safetychallenges for VicRoads.
performance indicators. The corporate plans for bothVicRoads and DOI include references to governmentpolicies that encompass freight issues, such as GrowingVictoria Together, Victorian Freight and LogisticsStrategy, and Metropolitan Road and TrafficManagement Strategy. With an expected 70 percentincrease in freight movement over the next 20 years,Victoria will face significant bottlenecks in its rail androad logistics network unless this network is, inVicRoads’ terms, “optimized.” Such optimizationincludes managing congestion, facilitating freight in theexisting transportation system, giving priority to freightand public transport on transportation networks, andadopting a full societal cost recovery pricing scheme.
Besides DOI and Austroads performance indicators, theVictorian Road Freight Advisory Council, an advisorygroup to the Minister of Transport, publishes a set ofindicators every three years relating to road freight effi-ciency, road safety, regulatory compliance, industrytrends, and environmental quality. These indicators,however, are simply reported and not used by VicRoadsin management decisionmaking.
CongestionVicRoads was one of the major proponents for develop-ing Austroads’ National Performance Indicators, soAustroads’ indicators on road network performance serveas the core measures for VicRoads’ efforts. These indica-tors include urban and rural average travel time and roaduse for people (person-kilometers) and freight (ton-kilometers). These indicators are determined for sevenroad categories: freeways; divided and undivided arterialsand undivided arterials with trams for an inner area; andfreeways, divided arterials, and undivided arterials in theouter areas of Melbourne. For each road category, a rep-resentative sample of at least 15 percent of total traveland network length is used for data collection. Data arecollected twice a year in each direction for three timeperiods and for each weekday. Four indicators are calculated from this data—actual travel time (minutesper kilometer), nominal travel time (min/km), congestion(min/km) and variability of travel time (percentage).Figure 23a shows a typical reporting of this information.
VicRoads operates a traffic management center (TMC)that serves as a major source of data for performanceindicators. The center operates 24 hours a day, sevendays per week, and requires 12 staff members working12-hour shifts. TMC connects to 2,500 SCATS-controlledtraffic signals, and uses 170 surveillance cameras, withaccess to another 240 cameras on the regional toll road
network. Freeways have loops every 500 meters (1,640feet), 320 in all, that collect data on vehicle speeds, vol-umes, and lane occupancy. This data is updated every 20seconds. Speed cameras are used throughout the regionto enforce speed limits. VicRoads is also developing anapproach to track trucks on Victoria roads and to equipall buses and taxis with global positioning system (GPS)units that, in essence, would turn them into probe vehi-cles. All of these ITS applications will provide VicRoadswith a strong data collection capability to support its per-formance measurement efforts.
VicRoads has developed a performance monitoring systemfor the freeway system that relies on data collected fromloop detectors. The data are blocked into 15-minute timeintervals, with performance reporting on crash rates,speeds, volumes, free-flow speed, travel times, hours ofdelay, all per segment or, in the case of crash rates, per100 million vehicle-kilometers traveled and per kilometer(see figure 23b). The next version of this system will allowa lane-by-lane analysis. VicRoads’ officials stated that thisperformance monitoring system strongly influencedinvestment priorities by providing for the first time a systems view of trouble spots. Before this, the use of thetraffic management center as a data input to such prioriti-zation naturally focused attention on the specific locationsmonitored. It was clear to the scan team that VicRoads isusing ITS applications most effectively as a source of datafor performance indicators, and is developing additionalapplications that could be important in the future.
Multimodal TransportationMelbourne is one of the most multimodal cities in theworld. With an extensive tram system (third largest inthe world) and a large bus network, public transportplays an important role in providing mobility to city resi-dents (90 million boardings per year representing 9 per-cent of total motorized trips). As noted earlier, the gov-ernment has established a target of 20 percent publicmode split by 2020. Operations measures used to moni-tor service delivery include tram and bus travel time(targets are 25 percent reduction for trams and 10 per-cent reduction for buses). The transit agency collectsdata on service reliability, while VicRoads monitors trav-el time variability for roads carrying transit vehicles.
The government’s transportation policy also includes a commitment to enhance the bicycle network in the state. Bicycle projects will be provided as part ofmajor road projects, with a target value of one kilometer of off-road bike lanes per 1,000 population.The types of performance indicators developed
Transportation Performance Measures 47
K E Y F I N D I N G S

for this program include level of program expenditure,number of kilometers in place, bicycle as a mode forwork travel, bicycle as a mode for recreational andsport activities, crashes, and hospital admissions.
Road System ManagementOne of the most important core businesses in VicRoadsis the Road System Management (RSM) group, the unitresponsible for the strategic development of the road
network. Besides DOI and otherindicators described previously, theRSM unit has its own set of coreperformance indictors, several ofwhich are benchmarked against other Australian states. These indicators include the following:
Road maintenance effectiveness• Cost per kilometer to maintain
sealed urban and rural roads insmooth condition
• Ratio between total maintenanceexpenditures and length of roadwith surface roughness less thandefined levels of roughness (4.2 IRI)
Smooth travel exposure• Proportion of travel undertaken
each year on urban or rural roads with surface roughness less than 4.2 IRI
Return on construction expenditure• Benefit-cost ratio based on
discounted community benefitsdivided by the difference in discounted road life cycle costs
Achievement index• The ratio of the benefit-cost ratio
before a project to the calculatedbenefit-cost ratio after projectcompletion
A review of the achievement indexsuggests that the benefit-cost analysis in recent yearshas been a valid exercise in estimat-ing what will actually occur (basedon a sample of 80 projects out ofabout 1,200 per year).
VicRoads uses a road asset system (RAS) to collect dataon the condition of road assets. Data collected includebridge condition and risk rating, pavement surface condi-tion (updated yearly), and pavement roughness (or whatis called “smooth travel exposure”). Other data sourcesused for performance measurement include results fromregional models, census data, public input, land use, andtraffic surveys. VicRoads officials stated that for asset
48
C H A P T E R T W O
Melbourne’s Travel Time Results
Figure 23a. System performance measurements.
Figure 23. Examples of congestion reporting in Victoria.
Figure 23b. Freeway performance measurements.

management, priorities are driven by pavement condi-tion modeling, reducing roughness, preventive mainte-nance treatments, resurfacing low skid resistance sites,bridge conditions, and roadside inventory problems.
VicRoads is undertaking several initiatives to enhanceprogram delivery. For example, new legislation has beenintroduced to clarify the responsibility for managing arte-rial roads. VicRoads is also evolving to a triple bottomline approach to project evaluation, defining new indica-tors that are more relevant to decisionmaking, and intro-ducing a new risk management framework for benefitand cost estimation. In addition, VicRoads is makingefforts to develop new indicators for social and environ-mental concerns, use new data collection methods, andcreate multimodal evaluation methodologies.
In response to questions posed by the scan team,VicRoads officials stated that the key barriers to a per-formance-oriented decisionmaking process are that 1)many indicators are not understood by those outside ofVicRoads, and 2) supporting data are difficult (andexpensive) to collect for some indicators. Inherent con-flicts also exist between several performance categories.For example, reducing speeds for safety purposes couldconflict with desired higher speeds for improved regionalaccessibility, or enhancing freight access could conflictwith community preservation desires. Key lessons forothers engaged in performance measurement includeassuring that performance indicators can be readily andcost effectively obtained, are closely tied to program andinvestment decisions, and are outcome-oriented.
ObservationsThe scan team’s most more important observations fromthe visit to Victoria are as follows:• Victoria’s approach to performance-based management,
as seen in its transportation program, is probably themost advanced such effort found during this scan. Greatthought has been given to what measures are mostimportant, as well as to realizing that many politicallydefined targets could be difficult to attain. The scan teamfound a performance measurement mindset integratedinto planning and decisionmaking at VicRoads and DOI.
• The most advanced application of a performance-based policy, planning, and decisionmaking structurewas found in road safety. The approach to achievingthe government’s safety targets illustrates well how important performance indicators can be used to focus governmental efforts. The results are impressive.
• The targets established for key performance indicatorsappear ambitious, but VicRoads officials stated thatthese targets, although defined politically, did benefitfrom technical analysis before they were established.This was in contrast to other locations, where targetvalues appeared to represent the desires of politicians.To the extent that targets are useful in a performancemeasurement scheme, the way Victoria has establishedits targets is worthy of imitation.
• Although other scan sites incorporated freight into theperformance framework, DOI has devoted much moreattention to the important role that freight movementplays in Victoria’s economy and its performance indica-tors. The level of attention to freight, especially givenexpected growth in freight movement, is commendableand worthy of application elsewhere.
• Using performance-based service contracts is one waygovernment agencies can institutionalize performanceconcerns in service delivery. Victoria is not unique, butthe thought process associated with renegotiating thetransit franchises in Melbourne and identifying per-formance indicators to include in the new contractswas an excellent example of how such agreementsshould be constructed. DOI clearly learned from theproblems associated with earlier agreements, andapplied these lessons in renegotiations that have placedpublic transit in Melbourne on a strong foundation.
• Because of the multimodal nature of Melbourne’s tran-sit system, coordination on investments and operationsappears to be close among DOI, VicRoads, and thetransit franchisees. This coordination also appears tobe part of the performance measurement structure ofeach agency or firm. For example, VicRoads under-takes road improvements as part of its performancemeasurement structure to reduce bottlenecks for thetram system, which is a performance target for DOI.
• Although the concept of an “achievement index” isfound in the Austroads national performance indica-tors, the application in Victoria is impressive. VicRoads
Transportation Performance Measures 49
K E Y F I N D I N G S
Internal Monitoring of VicRoads’ Program• Financial progress against forecast• Physical works against program• Initial versus final project cost• Post project evaluation for major improvements• Environmental impact
Source: VicRoads

50
conducts about 80 post-implementation evaluationsannually to determine how close the actual benefitsand costs are to those forecast by the initial analysis.This interesting concept provides important feedbackto the decisionmaking process and credibility to thetechnical analysis that precedes decisionmaking.
• VicRoads is much further along than others in deter-mining how ITS technologies can be used to supportperformance management through their data collectioncapabilities. Not only are ITS applications used for datacollection, but the scan team also learned aboutplanned expansions of this capability that will makeMelbourne one of the most monitored transportationsystems in the world. VicRoads understands the neces-sity of having the most cost-effective and flexible datacollection program feasible to support performance-based planning and decisionmaking.
NEW ZEALAND
The mission statement for the national road agency inNew Zealand states that it wants to be a world leader intransportation service provision. In many areas, NewZealand has accomplished this, earning a reputation forinnovative and forward-looking approaches to transporta-tion system management. In combination with its publicand governmental concern for natural resources, NewZealand includes many best practices on how the trans-portation system can best be developed and managed tosupport much broader community goals. The scan teamwas particularly interested in how transportation officialsin New Zealand used performance measures to managetheir transportation system, and the extent to which per-formance measures have been identified for social, envi-ronmental, and cultural outcomes.
Governmental ContextNew Zealand is a parliamentary democracy with a uni-cameral Parliament. The country is divided into 16administrative regions and 74 territorial authorities, all ofwhich are road-controlling authorities. A minister over-sees a Ministry of Transport that consists of six agen-cies—Civil Aviation Authority, Transport AccidentInvestigation Commission, Maritime Safety Authority,Land Transport Safety Authority, Transfund NewZealand, and Transit New Zealand. Three agencies inparticular were of interest to the scan team. Transit NewZealand is the agency responsible for a national highwaysystem consisting of 10,786 km (6,702 mi) of a road net-work of 92,600 km (57,450 mi). About 48 percent of
New Zealand’s 38 billion vehicle-kilometers per year(23.6 billion vehicle-miles) use the national highway net-work. About NZ$674 million (US$493 million) will bespent on the national road network in 2004.
Transfund New Zealand is the agency that allocates allrevenues collected from the fuel excise tax, gas taxes,and vehicle registration fees to national transport andsafety agencies. The initial allocation from the NationalRoads Fund (similar to the U.S. Highway Trust Fund)goes to the New Zealand Police and the Land TransportSafety Authority for road safety enforcement. Theremaining funds are transferred to the National RoadsAccount, which provides full funding of the road programof Transit New Zealand, together with financial assis-tance to the programs of the local government road-con-trolling authorities. Transfund New Zealand uses its ownperformance measures to monitor progress on govern-ment and agency goals.
The Land Transport Safety Authority (LTSA) is a crownentity with a mandate to promote land transport safety,including safety on New Zealand’s road and rail network.LTSA is governed by a government-appointed board.With its responsibility targeted to safety, LTSA has estab-lished goals on the number of annual deaths and hospi-talizations in New Zealand. Its outreach efforts are divid-ed among education, enforcement, and engineering.Given that it must rely on achieving its goals through theactions of other agencies (e.g., New Zealand Police andTransit New Zealand), LTSA develops and nurtures part-nerships with many other agencies at the national, state,and local levels.
Use of Performance IndicatorsSimilar to Australia, New Zealand has developed an inte-grated approach to performance-based planning anddecisionmaking. Consistent performance measures arefound in documents ranging from its corporate strategicplan to performance specifications in private service con-tracts. Figure 24 shows the hierarchy of managementdecisionmaking and its relationship to performancemeasurement. Several inputs and products of thisprocess merit special attention.
Enabling legislation—More than in many other coun-tries, the New Zealand government has establishedstrong goals for the transportation sector as it relates tothe general well being of the country. For example, aLand Transport Management Act passed in 2003 requiresTransit New Zealand (and other major agencies) to oper-ate in a way that “contributes to an integrated, safe,
C H A P T E R T W O

responsive, and sustainable land transport system.” Theimportant word in this phrase is “sustainable,” becausethe government has set a June 30, 2005, target date forall land transport programs to be fully compliant with thepolicy directions in the act. At the time of the scan visit,Transit New Zealand officials were struggling with howthe transportation program should be restructured andsystem performance measures defined to lead to a moresustainable land transport system for New Zealand.
A law expected to pass shortly after the scan visit wouldchange the way transportation governance occurs inAuckland, New Zealand’s largest city. Under the law, anew planning organization would be established for theregion with a requirement for local land use plans to beclosely tied to roads and public transport plans. This newlaw was expected to change in significant ways howtransportation planning occurs in Auckland, and onceagain, challenge planners and decisionmakers to developa performance measurement scheme that measuresprogress toward this goal.
New Zealand Transport Strategy—The government pro-duced a strategy document in 2002 that outlined itsstrategic vision for transportation: “By 2010, NewZealand will have an affordable, integrated, safe, respon-sible, and sustainable transport system.” Four principlesunderpinned this vision—sustainability, integration, safe-ty, and responsiveness. Although no specific performanceindicators were identified in thisdocument, the Land TransportManagement Act required thatall related actions by the nation-al transportation agencies beconsistent with this strategy.
Strategic Plan—Each agencymust develop a strategic planthat describes what the agency istrying to achieve and how it willachieve it. The most recentstrategic plan for Transit NewZealand, for example, stated itsmission, vision, values, keystrategic areas, and key goals. Asthe plan noted, Transit NewZealand is focused on perform-ance in several areas, includingstate highway network manage-ment, social and environmentalresponsibility, funding, industryleadership, communication, and
working relationships. The strategic plan observed thatTransit New Zealand wanted to reexamine its perform-ance measures, which it concluded focused primarily ondelivering physical outputs. Instead, Transit NewZealand’s aim was to develop performance measures thatreflected “the full range of Transit New Zealand’s role,accountabilities, and performance; performance targetsin the Strategic Plan and the National State HighwayStrategy; and Triple Bottom Line reporting.”
Statement of Intent—A 1989 public finance law requiredall government agencies to prepare a document that pro-vided information on a range of corporate managementfactors, including performance targets, objectives, andscope of activities. For example, the Ministry ofTransport’s Statement of Intent for 2003/2004 observedthat, “Sustainable Transport is the Ministry’s vision. Asthe government’s principal transport advisor, we will con-tinue to identify solutions with longer-term benefits.Decisions will be based not only on monetary costs andbenefits, but will also take into account the social,regional, economic, health, and environmental impactsof all projects.”
Transit New Zealand’s statement of intent provides amore detailed set of performance measures that relateto the goals established in the strategic plan. In addi-tion, these performance measures include measuresthat are part of a performance agreement between the
Transportation Performance Measures 51
K E Y F I N D I N G S
Figure 24. Role of performance measures in management decisionmaking in New Zealand.
Management Systems

52
Minister of Transport and Transit New Zealand (seebelow). As noted in the statement of intent, given thechanges in the law and increasing pressure on TransitNew Zealand to broaden its interests, these perform-ance measures are a starting point for future perform-ance measure evolution. Indeed, during the scan meet-ing, it became clear that some measures were consid-ered placeholders until more substantive measurescould be defined. One consequence of this was thatcustomer surveys are used in Transit New Zealand’sperformance measurement system more than in othercases the team observed. The performance measuresfor Transit New Zealand are found in Appendix C, iden-tified by the three areas found in the triple bottom lineapproach to performance measurement.
Performance Agreements—The Land TransportManagement Act requires that Transfund and TransitNew Zealand provide the Minister of Transport with anannual performance agreement that specifies how theagency will conduct its activities during that year. Ofthe 11 topics covered in this agreement, eight relate tosome form of performance measurement, including aproposed statement of output objectives, how theagency will measure achievement of the government’sgoals, management and financial systems that will guideagency action, and an assessment of the agency’sactions on achieving an integrated, safe, responsive,and sustainable highway system.
The latest performance agreement between the Ministerof Transport and Transit New Zealand sets targets forseven measures during the year covered by the agree-ment, and commits to information-gathering activitiesfor other performance measurement areas that will leadto identified targets for the following year. An example ofa performance agreement target is that the variancebetween actual and forecasted expenditures for mainte-nance should not be more than 2 percent. Given thefocus of the performance agreement, the scan team wasnot surprised to find that all quantifiable targets werefocused on organizational outputs, although indicationswere strong that system performance measures would beincorporated into future performance agreements.
Ten-Year Highway Plan—Transit New Zealand isrequired to develop a 10-year plan that consists of anannual work program and an “indicative” plan for theremaining nine years. The relationship between this planand all other performance-based planning documents isfound in its linkage to the New Zealand TransportStrategy and Transit New Zealand’s National Highway
Strategy. In both cases, the 10-year plan states the spe-cific goals the plan is helping to achieve.
Annual Program—An annual program of activities is pre-pared for each government agency. For example, in thesafety area, the annual program includes the engineering,education, and enforcement efforts the government willconduct. Specific performance measures are used togauge the level of program activity. In the area of speed control, for example, the New Zealand police (all police are part of a national police force) are chargedwith delivering enforcement efforts that meet the following performance criteria:
The strategic framework for safety performance has ledthe Land Transport Safety Authority to expand thefocus of performance management beyond road usermeasures to measures relating to the roads themselves.To some extent this was done in recognition of howdifficult it might be to use additional behavioral strate-gies to reduce fatalities. As noted in the safety programdocument, “roads must be used properly if they are tobe safe, and it is up to the engineers who design them
C H A P T E R T W O
Standard
100%
275,000 to 325,000400,000 to 460,000
100%Equal to or betterthan previous year
Equal to or betterthan previous year
100%
100%
Measure
Quantity• Number of speed control
campaigns and specified police hours compared to target number
• Tickets issued from – On-road speed enforcement– Traffic camera operations
Quality• Number of approved plans• Percentage of local authorities
and Transit New Zealand satisfied with effort
• Percentage of annual surveyrespondents who believe theprobability of being detectedfor illegal speeding is high
Timeliness• Speeding tickets issued no
later than 30 days after camera detection
Cost• Delivery within budget

to make them as safe as possible and to inform us ofthe limitations so that we can use the roads safely.”
SafetyAs in Australia, safety was one of the best examples ofthe application of performance measurement the scanteam observed in New Zealand. Figure 26 shows theoverall framework of performance management adopt-ed by the Land Transport Safety Authority, includingidentification of performance targets for variouslydefined outcomes and outputs. These different levels ofoutcomes relate to targeted interventions by the gov-ernment, and to better measurement of the effective-ness of safety programs on different user groups. Figure25 also shows the hierarchical nature of the relation-ship among these outcome levels. The Road Safety to2010 strategic plan for the Land Transport SafetyAuthority provides more detail on desired levels ofachievement. For example, the following outcome cate-gories are found in this strategic plan:
Overall OutcomesThe social cost of a crash is the measure of all costs thatthe crash inflicts on a community.
Intermediate OutcomesThe focus of the intermediate outcomes is to be able to determine the effect of interventions in three keyareas—speed management, drunk driving, and passenger/driver restraints.
Transportation Performance Measures 53
K E Y F I N D I N G S
Figure 25. Hierarchical relationship of safety performancemeasures in New Zealand.
Target Types Required
Measure How Measured 2004 NotExceeding
2010 NotExceeding
SocialCosts
• $ billion (US$)• ¢ per vehicle-kilometer
(US¢ per vehicle-mile)• $ per person (US$)• $ per vehicle (US$)
2.75 (2.01)
6.7 (3.1)700 (512)
1,020 (747)
2.15 (1.57)
4.4 (2.0)650 (476)945 (692)
Deaths • Total not greater than• Rate per billion vehicle-kilometers (per billion vehicle-miles)
• Rate per 100,000 persons• Rate per 10,000 vehicles
4009.9 (6.2)
10.21.5
3006.1 (3.8)
7.31.1
Hospital-izations
• Total not greater than• Rate per billion vehicle-kilometer (per billion vehicle-miles)
• Rate per 100,000 persons• Rate per 10,000 vehicles• Hospitalizations >1 day• Hospitalizations >3 days
5,870140 (87)
15022
2,7501,750
4,50090 (55.4)
11016
2,2001,400
Note: Values in parentheses indicate comparable U.S. amounts
IntermediateOutcome
Measure Units2004 NotExceeding
Speed (Open Road)
• Mean speed • 85th percentile speed
km/h (mi/h)km/h (mi/h)
99 (61.5)107 (66.5)
Speed (Urban Road)
• Mean speed • 85th percentile speed
km/h (mi/h)km/h (mi/h)
55.2 (34.2)61 (37.9)
Alcohol • Driver deaths with excessalcohol
Number 48
% of alldriver deaths
21%
Restraints Vehicle occupantswearing safety belts
% in front% in back
At least 92%At least 75%
Children <12restrained
% 90%

54
User Group OutcomesThese outcomes focus on the social costs associated withcrashes in two groups—pedestrians and cyclists—because of their particular vulnerability when involvedwith motor vehicles.
Regional OutcomesOutcomes can also be disaggregated by region to deter-mine the effectiveness of regional and local road safetyprojects.
A similar outcomes hierarchy is being developed forrail safety.
Safety PartnershipTransit New Zealand is an important implementing part-ner with the Land Transport Safety Authority, as is theNew Zealand police agency. Indeed, before the mostrecent redefinition of Transit New Zealand’s goals asmanifested in the Land Transport Management Act of2003, the principal purpose of the agency was defined asproviding “a safe and efficient state highway system.” Inresponse, Transit New Zealand undertook several initia-tives to incorporate a concern for safety into its dailyactivities.
Of interest to the scan team was development of a statehighway safety management system, defined as “a sys-tematic process that has the goal of reducing the numberand severity of road crashes by ensuring all opportunitiesto improve state highway safety are identified, consid-ered, implemented, and evaluated as appropriate, in allphases of highway planning, design, construction, opera-tion, and maintenance.” This management system hasthree major elements—primary components, secondarycomponents, and partnerships. Figure 26 shows how themanagement system functions in influencing decisionsand budgets. Because many of Transit New Zealand’soperations and maintenance activities are contracted toprivate firms, many contracts include specifications andperformance targets that relate to the measures identi-fied in the National Road Safety Plan. Transit NewZealand conducts annual reviews of the State HighwaySafety Management System manual, hires independentauditors to conduct random audits every year and a fullaudit every three years of compliance with the safetymanagement system, and annually certifies the statehighway network on its safety performance.
Agency strategies are used in particular for integratingsafety concerns into both ongoing maintenance activitiesand new construction. The key safety strategies are safe-ty inspections (both day and night), crash databases byhighway location, “gray spot” analysis (locations withthree crashes), crash reduction studies (conductedwhere gray spot analysis/treatment has not reducedcrashes), road safety audits of new and existing net-works, and a strong focus on maintenance of wet roadskid resistance.
CongestionThere was a growing sense in the late 1990s that roadsin Auckland and Wellington were becoming severely
C H A P T E R T W O
User Group Measure2004 Deaths plus
hospitalizationnot exceeding
Pedestrians TotalMore than 1 day hospitalizedMore than 3 days hospitalized
700390290
Pedestriansper millionhours traveled
TotalMore than 1 day hospitalizedMore than 3 days hospitalized
3.11.71.3
Cyclists TotalMore than 1 day hospitalizedMore than 3 days hospitalized
27013090
Cyclists per 100 million km
TotalMore than 1 day hospitalizedMore than 3 days hospitalized
1005035
Region2004 deaths
plushospitalization
2004 deathsplus
hospitalizationof >1 day
2004 deathsplus
hospitalizationof >3 days
NorthlandAucklandWaikatoBay of PlentyGisborneHawke’s BayTaranakiManawatu-Wanganui
WellingtonNelson-
MarlboroughWest Coast
4402,12074049070250120390
320140
90
2008404202704014070240
20080
40
1206003201603010050160
12050
20
CanterburyOtagoSouthland
700250150
380150100
26010060

congested. Although Transit New Zealand had conduct-ed travel time surveys over many years, this data col-lection had not occurred in the context of a clearlydefined congestion performance indicator. In 2002,Transit New Zealand and the Regional Councils inAuckland and Wellington introduced a data collectionprogram that would systematically feed into an annual-ly measured congestion indicator. The Austroads defini-tion of this indicator—actual travel time minus speedtravel time divided by distance traveled—andAustroads’ floating car methodology are used in thisperformance-monitoring effort. The road sample forAuckland included 70 percent of the freeway length,100 percent of state highways, and 44 percent ofregional arterials. In Wellington, the sample included100 percent of the freeway, 45 percent of state high-ways, and 21 percent of regional arterials. The resultsfor Wellington are shown in table 10. The results forAuckland were considered unreliable because ofmethodological issues that are being addressed (conges-tion was so bad that the floating car method could notmeet its quality control standards). Note in table 10 theuse of travel time variability (or in U. S. terms, reliabili-ty). Given the successful experience in Wellington, the
urban congestion indicator approach is being implemented in two additional cities, Tauranga andChristchurch.
Customer SatisfactionTransit New Zealand gives considerable attention in itsperformance management framework to customer satis-faction. In 1998, road users, as a generic group, weresurveyed on a range of desirable and undesirable char-acteristics of the road network and overall level of satisfaction. In 2000, the survey focus was changed
Transportation Performance Measures 55
K E Y F I N D I N G S
Figure 26. Safety management system’s impact on planning and decisionmaking.
Table 10. Congestion measurement in Wellington.
Period Nov. 2002
CongestionIndicator
A.M. Peak 0.27 min/km
Interpeak 0.11 min/km
P.M. Peak 0.29 min/km
All Day 0.20 min/km
Variability A.M. Peak 16%

56
C H A P T E R T W O
to identify satisfaction and dissatisfaction by marketsegment, such as commercial truck drivers and short-and long-distance travelers. In 2003, fewer, more target-ed questions were incorporated into the survey to “gaina better understanding of the prioritization” of keycharacteristics of the road system by road users. Asnoted in the report summarizing the 2003 surveyresults, “this would lead to the overall performance rat-ings of Transit New Zealand being more transparent.”In addition, “reasons for dissatisfaction were sought, toensure results were actionable.”
The survey was conducted on a regional basis, with aminimum of 200 surveys per region. A total sample sizeof 1,500 usable surveys formed the basis of the results,and conclusions were drawn only where a 95 percentconfidence level could be obtained.
The survey results provided important information toTransit New Zealand. Only 22 percent of the respondentsrated the state highway network as either fair or poor,while 78 percent rated it good, very good, or excellent.The survey showed a clear linkage between overall satis-faction with the state highway network and satisfactionwith safety, pavement quality, and congestion. In 2000,of all user groups, the one showing the most dissatisfac-tion was commercial truck drivers, where dissatisfactionwas most related to poor ride quality. In response,Transit New Zealand developed a truck ride indicatorthat measured the pitch-and-roll response of trucks tothe road surface. Segments of the road network thatfared poorly by this new indicator were targeted forimprovement through Transit New Zealand’s mainte-nance program. More than NZ$7 million (US$5.1 mil-lion) has been spent specifically on poor truck ride sec-tions of highway. This so-called “truckie survey” andTransit New Zealand’s proactive response to the resultswon national honors in the Market ResearchEffectiveness Award program of New Zealand’s MarketResearch Society.
Asset ManagementTransit New Zealand is a world leader in the use of assetmanagement for guiding road investment decisions. AState Highway Asset Management Plan links the day-to-day activities of asset management with the strategicframework represented by the National State HighwayStrategy and the statement of intent. The performancemeasures incorporated into the asset management planare referred to as “levels of service.” The definition ofthese levels of service is directly tied to the values associ-ated with different customer groups. Transit New Zealand
uses a variety of mechanisms to gather input on thesevalues, including customer surveys, corridor manage-ment plans, input from targeted user groups, and inputfrom other national agencies such as Transfund and theNew Zealand Police.
The asset management plan includes an extensive list oflevel of service measures for all facets of the road infrastructure business. Many measures are used at theoperating levels of the organization to guide maintenancedecisions, while others include those identified in thestatement of intent. Some level of service measures highlighted in the plan include the following:
Safety• Number and cost of crashes• Number of curves per kilometer compatible with speed
environment• Number of bridges with inadequate width• Percentage of state highway system that conforms
to paved width standards• Number of passing lanes
Efficiency• Percentage of curves that meet the threshold ratio
of “travel time if all curves meet target design speed to current travel time”
• Percentage of compliance with the target of restoringsingle-lane access within 12 hours of a substantial endto an emergency event (such as avalanches, rock falls,washouts, and flooding)
• Number of bridges that are weight restricted belowwhat is legally permitted without an overweight permit
• Percentage of the state highway network meeting pavement condition thresholds for roughness, rutting,skid resistance, and texture
Road users• Percentage of satisfied (“good” or “better”) users for
overall network, traffic flow, road safety, road surface,road markings, rest areas, and environment
Table 11 shows how the asset management plan is rele-vant to the key goals adopted by Transit New Zealand.
Transit New Zealand values its asset base at close toNZ$15 billion (US$11 billion) for replacement cost andNZ$12 billion (US$8.8 billion) for depreciated replace-ment cost. The sense of the scan team was that TransitNew Zealand has a much better handle on asset valuation and asset management than most U.S. Statehighway agencies.

Private Delivery of ServicesWhen Transit New Zealand was created by the TransitNew Zealand Act of 1989, the legislation also required allhighway maintenance and construction contracts to becompetitively bid. With more than NZ$500 million(US$366 million) of maintenance and capital improve-ment projects each year, the requirement to bid all main-tenance services competitively presented a significantchallenge to Transit New Zealand. For maintenance, theagency identified three types of procurement models,and made a strategic decision to target by expenditureabout one-third of all maintenance work for each model.These three models were the following: • Traditional—Transit New Zealand staff supervise
professional service consultants who manage mainte-nance service contracts, known as NetworkMaintenance Management Contracts. These servicecontracts were written to require specific activities(such as maintenance, vegetation control, pavementmarking, etc.), each subject to a physical works con-tract, making this an output-based model. Contractlength was for three years.
• Hybrid—This model used a similar tiered structure
for responsibility, but the lump-sum service contractswere written as outcome-based contracts that reliedon performance measurement, reporting, and self-auditing. These contracts were designed for a five-year timeframe.
• Performance Specified Maintenance Contract(PSMC)—These lump-sum, 10-year contracts cover allproducts or services associated with road maintenance.Similar to the hybrid model, performance criteria areincorporated into the contract that relate to the overallgoals of Transit New Zealand.
The differences in these three types of models are shownin table 12 (see page 58).
The interest of the scan team in these different formsof service delivery relates to the linkage between organizational outcomes and strategic performancemeasures defined by corporate management. By using performance-based contracts, Transit NewZealand is providing a means for vertically integratingstrategic corporate directions and decisionmaking with the day-to-day operations of the organization,
Transportation Performance Measures 57
K E Y F I N D I N G S
Table 11. Relationship between asset management and Transit New Zealand’s goals.
Key Goal Asset Management Plan Relevance Key Customer Values
Plan and develop an integrated, safe,responsive, and sustainable state highway system.
The goal establishes the need for sound asset management planning with a focus on long-term asset sustainability.
AccessibilityAesthetics
AffordabilityCommunication
ConsistencyConvenience
Core EffectivenessEfficiency
Environmental StewardshipIntegrationInvolvement
Knowledge and SkillLeadershipNavigation
No SurprisesProtection of the Asset
RelationshipsReliability
ResponsivenessSafety
Social BenefitsSustainabilityUnderstanding
Maintain, operate, and protect the state highway system.
Achieving this goal is the purpose of the life cycle management section of the plan—asset integrity is a fundamental outcome.
Exercise social and environmental responsibilityin all our activities.
Triple bottom line reporting measures for assets—social,environmental, and economic.
Obtain funding that is adequate to ensure anaffordable, integrated, safe, responsive, andsustainable state highway system.
Long-term funding requirements to achieve this goal are documented in the 10-year plan.
Lead the transport industry in terms of roadingsolutions and the skills of our people.
The plan is a means of demonstrating best-practiceasset management.
Interact and communicate effectively with roadusers, communities, and their representatives.
The levels of service need to be based on effective consultation about tradeoffs and available alternatives.
Maintain good relationships and work effectivelywith stakeholders and related organizations.
The plan is a means of communicating with stakeholders about state highway assets.
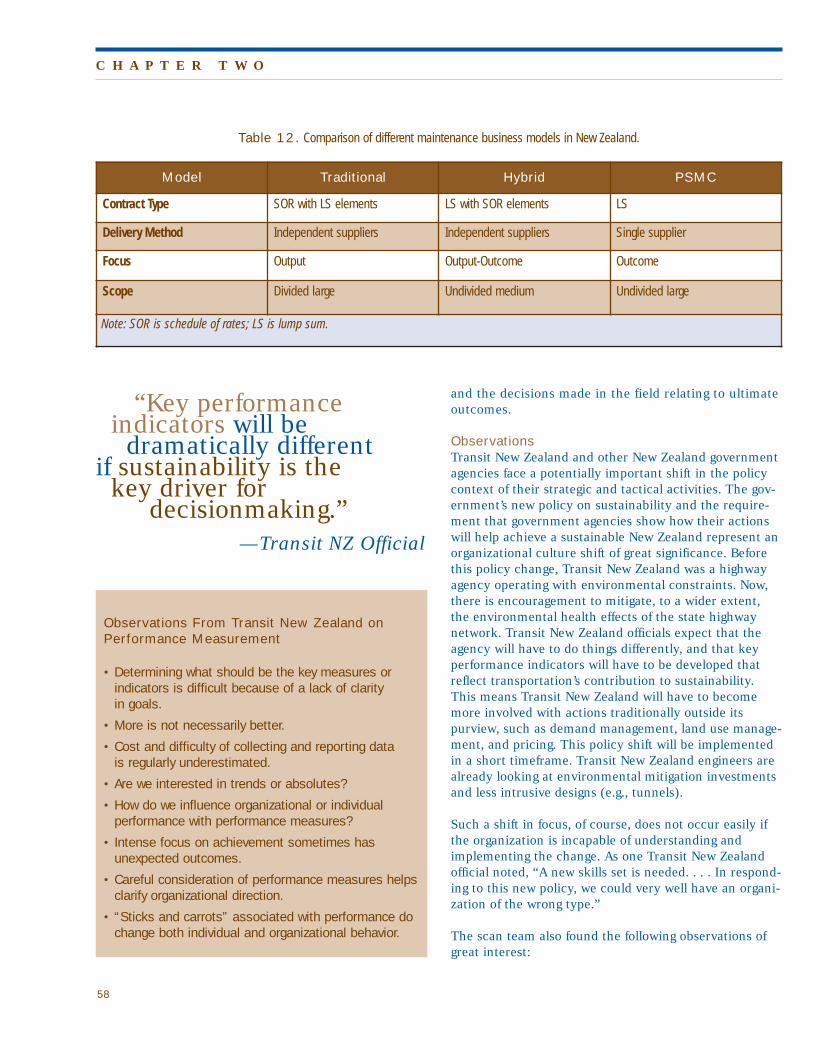
58
and the decisions made in the field relating to ultimateoutcomes.
ObservationsTransit New Zealand and other New Zealand governmentagencies face a potentially important shift in the policycontext of their strategic and tactical activities. The gov-ernment’s new policy on sustainability and the require-ment that government agencies show how their actionswill help achieve a sustainable New Zealand represent anorganizational culture shift of great significance. Beforethis policy change, Transit New Zealand was a highwayagency operating with environmental constraints. Now,there is encouragement to mitigate, to a wider extent,the environmental health effects of the state highwaynetwork. Transit New Zealand officials expect that theagency will have to do things differently, and that keyperformance indicators will have to be developed thatreflect transportation’s contribution to sustainability.This means Transit New Zealand will have to becomemore involved with actions traditionally outside itspurview, such as demand management, land use manage-ment, and pricing. This policy shift will be implementedin a short timeframe. Transit New Zealand engineers arealready looking at environmental mitigation investmentsand less intrusive designs (e.g., tunnels).
Such a shift in focus, of course, does not occur easily ifthe organization is incapable of understanding andimplementing the change. As one Transit New Zealandofficial noted, “A new skills set is needed. . . . In respond-ing to this new policy, we could very well have an organi-zation of the wrong type.”
The scan team also found the following observations ofgreat interest:
C H A P T E R T W O
Model Traditional Hybrid PSMC
Contract Type SOR with LS elements LS with SOR elements LS
Delivery Method Independent suppliers Independent suppliers Single supplier
Focus Output Output-Outcome Outcome
Scope Divided large Undivided medium Undivided large
Note: SOR is schedule of rates; LS is lump sum.
Observations From Transit New Zealand onPerformance Measurement
• Determining what should be the key measures or indicators is difficult because of a lack of clarity in goals.
• More is not necessarily better.
• Cost and difficulty of collecting and reporting data is regularly underestimated.
• Are we interested in trends or absolutes?
• How do we influence organizational or individual performance with performance measures?
• Intense focus on achievement sometimes has unexpected outcomes.
• Careful consideration of performance measures helpsclarify organizational direction.
• “Sticks and carrots” associated with performance dochange both individual and organizational behavior.
“Key performanceindicators will be
dramatically differentif sustainability is the
key driver fordecisionmaking.”
—Transit NZ Official
Table 12. Comparison of different maintenance business models in New Zealand.

• Transit New Zealand uses customer/stakeholder sur-veys to provide data for certain performance measures.In some cases, officials admitted that the survey datawas a placeholder until other types of measures couldbe defined. They made the point, however, that thesurvey results of greatest interest relate to customerdissatisfaction and, in particular, agency activitiesthose surveyed were most dissatisfied with.
• Transit New Zealand’s performance measures arealigned with the levels of decisionmaking that occurin the organization. For example, more strategicmeasures are used in reports to the Minister ofTransport (and agreed on in the annual performanceagreement between Transit New Zealand and the min-ister). Organizational measures are used internally todetermine how well Transit New Zealand is doing.Operations-level performance measures are used toassess specific types of performance (e.g., pavementcondition measures). Finally, some performancemeasures are used simply as a reporting means toother organizations, such as Transfund and Austroads.
• Transit New Zealand has undertaken a process overtime of focusing on the most important targetedmeasures. In the 1990s, for example, officials identi-fied about 240 different performance measures/indica-tors being used in the organization. This was filtereddown to 34 key measures, with five ministerial meas-ures at the top of the list. As the scan team observedat other sites, Transit New Zealand was trying todefine what was really important to the organization.
• The Land Transport Safety Authority has adopted atotal social cost approach to estimating crash costs aspart of its performance indicator effort. Thus, morethan just the immediate costs of crashes are incorpo-rated into its monitoring of transportation system performance.
• Uncertainty surrounding the measurement of govern-ment-defined policy goals (e.g., sustainability) has ledto questions on whether the current suite of perform-ance monitoring can realistically provide a sense ofwhether the transportation sector is contributing totheir achievement. As noted above, Transit NewZealand officials are struggling with this issue. Nomatter how this effort turns out, the desire to achievehigher levels of sustainability and the implications toprograms such as those in the Ministry of Transport’sportfolio provides Transit New Zealand with a licenseto engage in a national dialogue that can lend clarity
to the issues. As one Transit New Zealand officialnoted, “Simply measuring the trend toward sustain-ability achievement is perhaps more valid than measuring absolutes.”
• Having the right people involved with an outcome-ori-ented organization becomes a critical challenge tocorporate management. Transit New Zealand hasinstituted a graduate training program designed toexpose its employees to different customer/stakehold-er perspectives on road program development andmanagement. A new graduate rotates on an annualbasis within the agency, then with a contractor orconsultant to gain external experience in design andproject management, before final placement at theagency. Through each rotation, the respective organi-zations agree on the trainee’s employment arrange-ments. Although officials noted that some traineesleave the agency for higher-paying jobs, the desire towork overseas and gain wider experience was themain driver for leaving. They believe this exposure todifferent perspectives serves the long-term growth ofthe agency well.
Transportation Performance Measures 59
K E Y F I N D I N G S
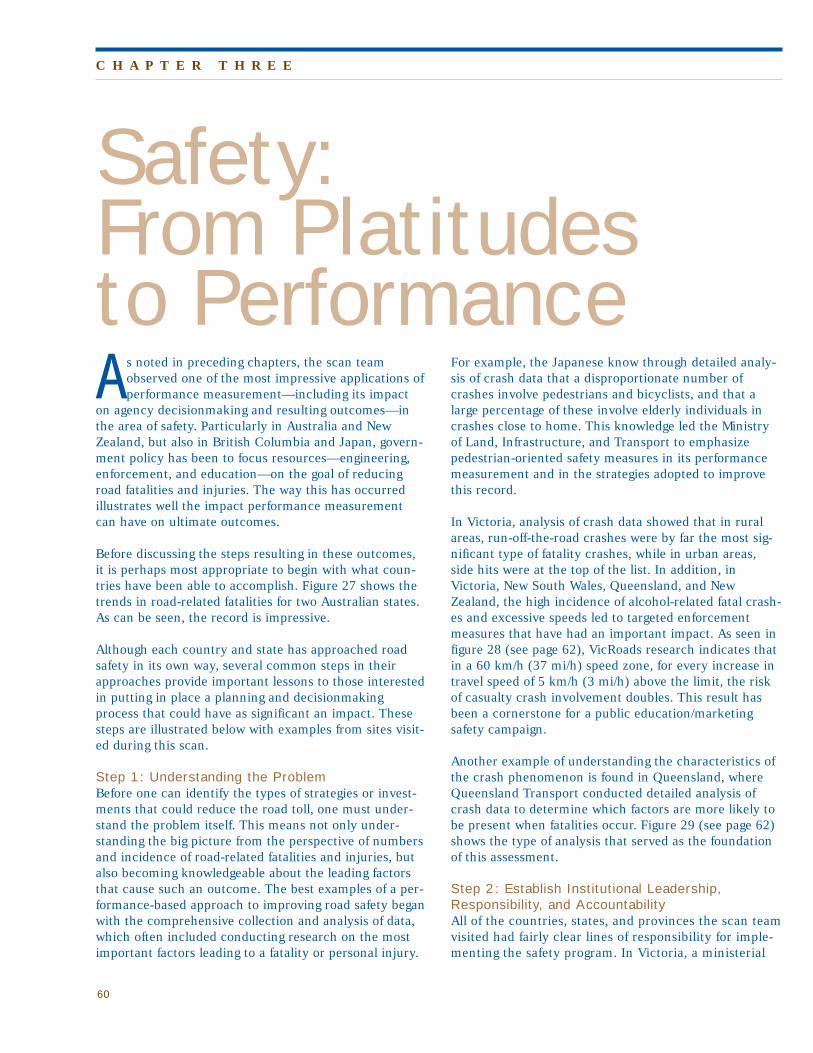
60
As noted in preceding chapters, the scan teamobserved one of the most impressive applications ofperformance measurement—including its impact
on agency decisionmaking and resulting outcomes—inthe area of safety. Particularly in Australia and NewZealand, but also in British Columbia and Japan, govern-ment policy has been to focus resources—engineering,enforcement, and education—on the goal of reducingroad fatalities and injuries. The way this has occurredillustrates well the impact performance measurementcan have on ultimate outcomes.
Before discussing the steps resulting in these outcomes,it is perhaps most appropriate to begin with what coun-tries have been able to accomplish. Figure 27 shows thetrends in road-related fatalities for two Australian states.As can be seen, the record is impressive.
Although each country and state has approached roadsafety in its own way, several common steps in theirapproaches provide important lessons to those interestedin putting in place a planning and decisionmakingprocess that could have as significant an impact. Thesesteps are illustrated below with examples from sites visit-ed during this scan.
Step 1: Understanding the ProblemBefore one can identify the types of strategies or invest-ments that could reduce the road toll, one must under-stand the problem itself. This means not only under-standing the big picture from the perspective of numbersand incidence of road-related fatalities and injuries, butalso becoming knowledgeable about the leading factorsthat cause such an outcome. The best examples of a per-formance-based approach to improving road safety beganwith the comprehensive collection and analysis of data,which often included conducting research on the mostimportant factors leading to a fatality or personal injury.
For example, the Japanese know through detailed analy-sis of crash data that a disproportionate number ofcrashes involve pedestrians and bicyclists, and that alarge percentage of these involve elderly individuals incrashes close to home. This knowledge led the Ministryof Land, Infrastructure, and Transport to emphasizepedestrian-oriented safety measures in its performancemeasurement and in the strategies adopted to improvethis record.
In Victoria, analysis of crash data showed that in ruralareas, run-off-the-road crashes were by far the most sig-nificant type of fatality crashes, while in urban areas,side hits were at the top of the list. In addition, inVictoria, New South Wales, Queensland, and NewZealand, the high incidence of alcohol-related fatal crash-es and excessive speeds led to targeted enforcementmeasures that have had an important impact. As seen infigure 28 (see page 62), VicRoads research indicates thatin a 60 km/h (37 mi/h) speed zone, for every increase intravel speed of 5 km/h (3 mi/h) above the limit, the riskof casualty crash involvement doubles. This result hasbeen a cornerstone for a public education/marketingsafety campaign.
Another example of understanding the characteristics ofthe crash phenomenon is found in Queensland, whereQueensland Transport conducted detailed analysis ofcrash data to determine which factors are more likely tobe present when fatalities occur. Figure 29 (see page 62)shows the type of analysis that served as the foundationof this assessment.
Step 2: Establish Institutional Leadership,Responsibility, and AccountabilityAll of the countries, states, and provinces the scan teamvisited had fairly clear lines of responsibility for imple-menting the safety program. In Victoria, a ministerial
C H A P T E R T H R E E
Safety:From Platitudesto Performance
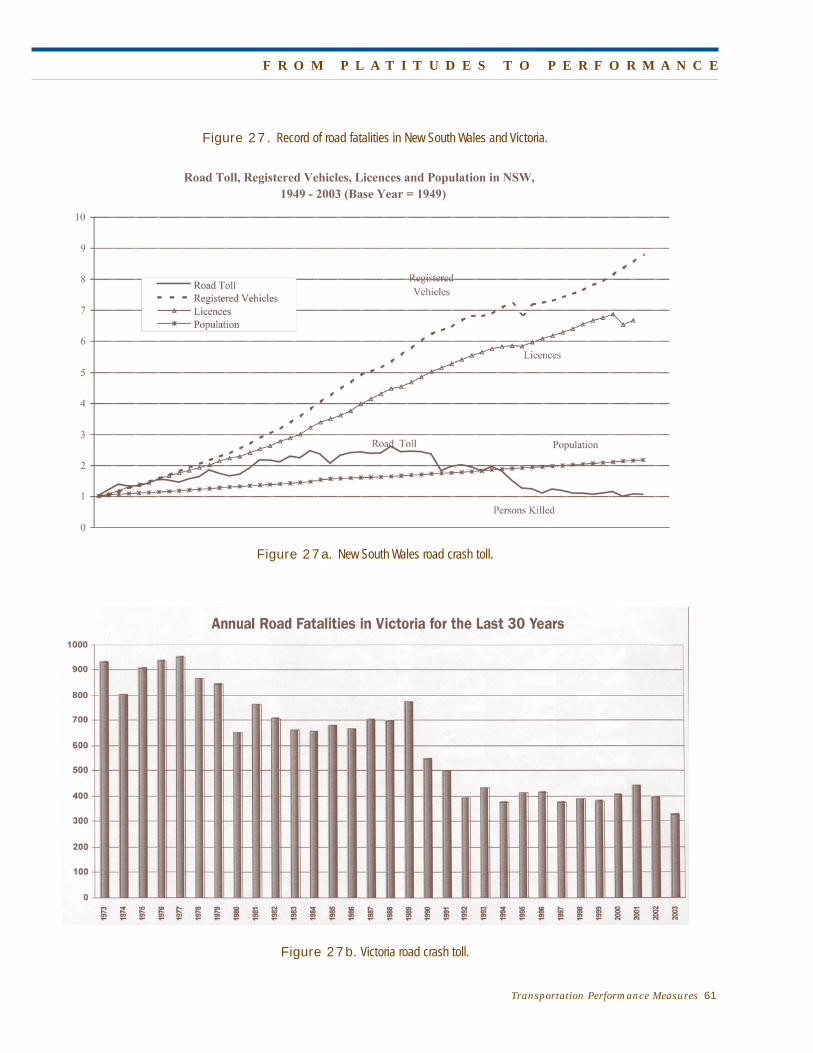
Transportation Performance Measures 61
F R O M P L A T I T U D E S T O P E R F O R M A N C E
Figure 27a. New South Wales road crash toll.
Figure 27. Record of road fatalities in New South Wales and Victoria.
Figure 27b. Victoria road crash toll.

road safety executive committee hasbeen established consisting of theMinisters for Roads, Transport, Police,and the Transport AccidentCommission. In New Zealand, aNational Road Safety Committeeincludes representatives from theLand Traffic Safety Authority,Ministry of Transport, Transit NewZealand, Transfund New Zealand,New Zealand Police, AccidentCommission, and local governments.The purpose of this committee was toact as a forum for “communicating,coordinating, and agreeing to top-level strategy between agencies onroad safety issues.” In New SouthWales, RTA is the lead road safetyagency, and to carry out its mission ithas developed strong partnerships
62
C H A P T E R T H R E E
Crash Risk by Travel Speed in a 60km/h Zone
Figure 28. Crash research results in Victoria.
Figure 29. Ranking crash-related factors in Queensland.

with the New South Wales Police for enhanced enforcement, Motor Accidents Authority for educationcampaigns, Department of Corrective Services for alco-hol programs, Department of Education and Trainingfor school and youth education programs, local govern-ments for a Road Safety Officer program, Departmentof Health for injury risk management research, andmany others such as the attorney general, transportservice providers, and community groups.
In British Columbia, the Ministry of Transport meetsregularly with representatives of the InsuranceCorporation of British Columbia (ICBC) and RoyalCanadian Mounted Police (RCMP) and other agenciesto coordinate approaches to enhancing highway safety.The Ministry of Transport and ICBC use a commondatabase derived from police reports. The Ministry ofTransport’s Highway Accident System is both a data-base and a main analysis tool to support businesscases for capital improvement projects. RCMP and theMinistry of Transport have been proactive about shar-ing experiences and conclusions to advance safety ini-tiatives. ICBC prepares an exhaustive annual report ontraffic collision statistics (available at www.icbc.com/Library/research_papers/Traffic/index.html.)
Two observations from the scanning study on the insti-tutional structure for safety are of interest. The firstrelates to the role of the police in the safety program.Similar to the United States, police agencies are criticalpartners in any road safety program and, in Australiaand New Zealand in particular, work closely with thetransportation agencies to implement the government’ssafety policy. The team’s impression was that this coor-dination is much closer than often found in the UnitedStates, most likely because in several instances thepolice agency is a state (or in New Zealand’s case, anational) organization. That means police agenciesanswer to the same executive authority as transporta-tion agencies, and have their own performance meas-ures linked to the desired outcomes of the government’spolicy. Second, in British Columbia, Australia, and NewZealand, government-created third-party insurance cor-porations play important roles in road safety. In bothBritish Columbia and Victoria, for example, these pub-lic corporations annually invest in projects aimed atimproving the safety record, including road safety con-struction projects.
Step 3: Define Desired OutcomesThe best examples of performance-based safety planningwere based on clear desired outcomes, most often ema-
nating from government policies. In Japan, the govern-ment has established a target of 30 percent reduction ininjury crashes at the country’s top crash locations. InVictoria, the government has established a 20 percentreduction in road-related fatalities as its 2007 goal. Insome cases, desired outcomes could relate to specificmarkets or user groups, such as reducing fatality andpersonal injury crashes involving young drivers, while inothers they could focus on specific causes of crashes,such as reducing alcohol- or drug-related crashes. Nomatter the focus of the desired outcome, a key factor inall of the effective performance measurement effortsfound in this scan was establishment of an achievementtarget. By setting such a target, the agencies responsiblefor helping achieve this outcome became more involvedin understanding how their actions could help itsachievement.
Step 4: Identify Performance IndicatorsOnce a goal has been established or articulated, the nextstep is to identify performance indicators that relate toboth the desired outcome and the organizational out-puts expected to lead to that outcome. Chapter Twodescribed the types of indicators used to monitor bothtransportation system performance and process accom-plishment in the countries the team visited. In mostcases, transportation agencies have adopted a range ofindicators, usually with “number of fatalities” as themost important measure. In several cases, this wasreported along with fatalities per 100,000 inhabitants,fatalities per 10,000 motor vehicles, and crash rate permillion vehicle-kilometers traveled.
Another important observation on fatality indicators isthat, in some instances, the agencies have adopted atotal societal or social cost approach to measurement.This implies that the impact on society of a death is valued in a fairly broad context.
Step 5: Compare With Other ExperiencesAll of the sites the team visited compared their safety(as well as other) performance measures with thosefound in other jurisdictions. This was done primarily todetermine whether the record was out of the ordinary.In most cases, this comparison became a screening toolto identify major differences. If significant differenceswere found, this led to further examination to deter-mine why. Was it simply because such significant differ-ences existed among the jurisdictions that the compar-isons were invalid? Or could the differences in theresults be linked to government actions that had affected the outcomes?
Transportation Performance Measures 63
F R O M P L A T I T U D E S T O P E R F O R M A N C E
64
A typical comparison effort is shown in figure 30. In thiscase, VicRoads compared the safety experience inVictoria with that of other Australian states and selectedother countries. It is interesting to note that Australianofficials looked mainly at the Netherlands, Sweden, andthe United Kingdom as models to emulate.
Step 6: Develop and Implement a SystematicSafety Data Collection and Analysis ProcessA key to the success of national and state road safetyprograms is the existence of a data collection andanalysis system that provides continual information onthe safety performance of the transportation system.
This information is used to monitor progress towardperformance targets, identify topics or areas where fur-ther action is necessary, educate officials and the publicon the importance of the topic, and evaluate the effec-tiveness of implemented projects and strategies. Thebest road safety programs had at their foundation a sys-tematic and comprehensive database management andanalysis program. These programs were called by differ-ent names, including the Crash Analysis System in NewZealand and the Road Crash Information System inVictoria. The key was to take the data being collectedon a wide range of factors linked to road safety andturn it into information that transport and road safetyofficials could use to determine the most cost-effectiveactions to meet their performance targets (see figure 31on page 66).
In each case where this database management capabili-ty existed, it used geographic information system (GIS)technology to portray the locations and characteristicsof the most recent crash history. In Victoria’s case, thiswas done daily. VicRoads’ Road Crash InformationSystem provided up-to-date information on the status ofprogram and project implementation, identification ofthe worst locations for different types of crashes (e.g.,where did most of the run-off-the-road crashes occur?),
public information on crash statistics, updates on thegovernment’s performance indicators, and trends insafety characteristics that allow transport, safety, electedofficials, and the public to determine the severity of theroad safety challenge.
Step 7: Develop a Safety Plan and Integrate it intoAgency DecisionmakingIn the Australian states and New Zealand, the govern-ment developed a road safety plan that outlined the roadsafety problem, challenges being faced, performance tar-gets that had been established, actions being considered,and institutional responsibilities for carrying out theplan. Often, these plans were not developed by the trans-portation agencies, but by the government. Because ofthe way government is structured, these policies havebeen incorporated into the planning, program develop-ment, and performance monitoring activities of thetransportation and safety agencies in each jurisdiction.As noted in the VicRoads’ Road Safety Strategic Plan2004/05, the government’s strategy called arrive alive!“continues to provide the overarching strategic directionfor VicRoads’ Road Safety Program, with a target toreduce annual death and serious injuries from roadcrashes by 20 percent by 2007.”
Safety plans usually consisted of a range of strategies,actions, and projects. Identifying the most appropriatecombination of actions comes from both a technicalprocess that identifies the likely effectiveness of differentstrategies and a political/public assessment of what mightbe feasible. Figure 32 (see page 66) illustrates conceptu-ally the process that the Land Transport Safety Authorityin New Zealand went through to identify the most appro-priate direction for its safety program. This processincluded a technical analysis of strategies most likely tohave the greatest impact, and a public outreach effortthat sought feedback from groups on what they thoughtwas the best direction. In this case, the package ofactions chosen included a mix of enforcement and engineering strategies.
Step 8: Monitor Effectiveness of ImplementedStrategies and ActionsOne of the most important (and impressive) actionsundertaken by the Japanese, Australians, and NewZealanders was determining the effectiveness of imple-mented strategies and actions. For example, in NewZealand and all of the Australian states visited, trans-portation officials had a good sense of the impact eachimplemented strategy had on reducing fatalities and per-sonal injuries. Figure 33 shows an assessment from
C H A P T E R T H R E E
“There is no need tocollect all of this data
on crashes if you arenot going to use it to
make decisions!”—VicRoads Official

Transportation Performance Measures 65
F R O M P L A T I T U D E S T O P E R F O R M A N C E
8.868.978.951.401.401.37AUST
minus Vic
8.898.768.361.371.331.25AUST
3.754.043.100.580.620.46ACT
24.2728.7826.214.655.484.98NT
11.657.609.631.651.071.35TAS
8.829.539.151.211.301.23WA
10.4410.1210.141.501.441.43SA
8.928.498.791.361.271.29QLD
8.998.116.581.291.150.92VIC
8.068.578.441.401.471.42NSW
200220032004200220032004
(12 months to Feb)(12 months to Feb)
Deaths per 100,000 popDeaths per 10,000 vehiclesState
2002 International Comparisons Fatalities
per 100,000 population in
8.758.15
10.3
6.76 6
14.8
0
2
4
6
8
10
12
14
16
Australia
Victoria USAUK
Sweden
Netherla
nds
New Zealand
National Comparisons
Benchmarking
Figure 30. Examples of crash data comparison by VicRoads.

66
Queensland and Victoria thatrelates reduction in fatalities togovernment action.
The team observed anotherinteresting example showing theeffectiveness of safety actions inMelbourne, where Victoriapolice use speed cameras (withadvance warning signs) andticketing through the mail toreduce the high levels of speed-ing occurring on Melbourneroads. When research showedthat high speeds were a majorcontributor to fatalities, the gov-ernment implemented anaggressive speed-enforcementeffort. Using of both fixed andmobile speed cameras has had asignificant impact on speeds, asfigure 34 ( see page 68) shows.
C H A P T E R T H R E E
Figure 31. Creating road safety knowledge from data at VicRoads.
Figure 32. Safety program analysis in New Zealand.
Creating Knowledge from Data
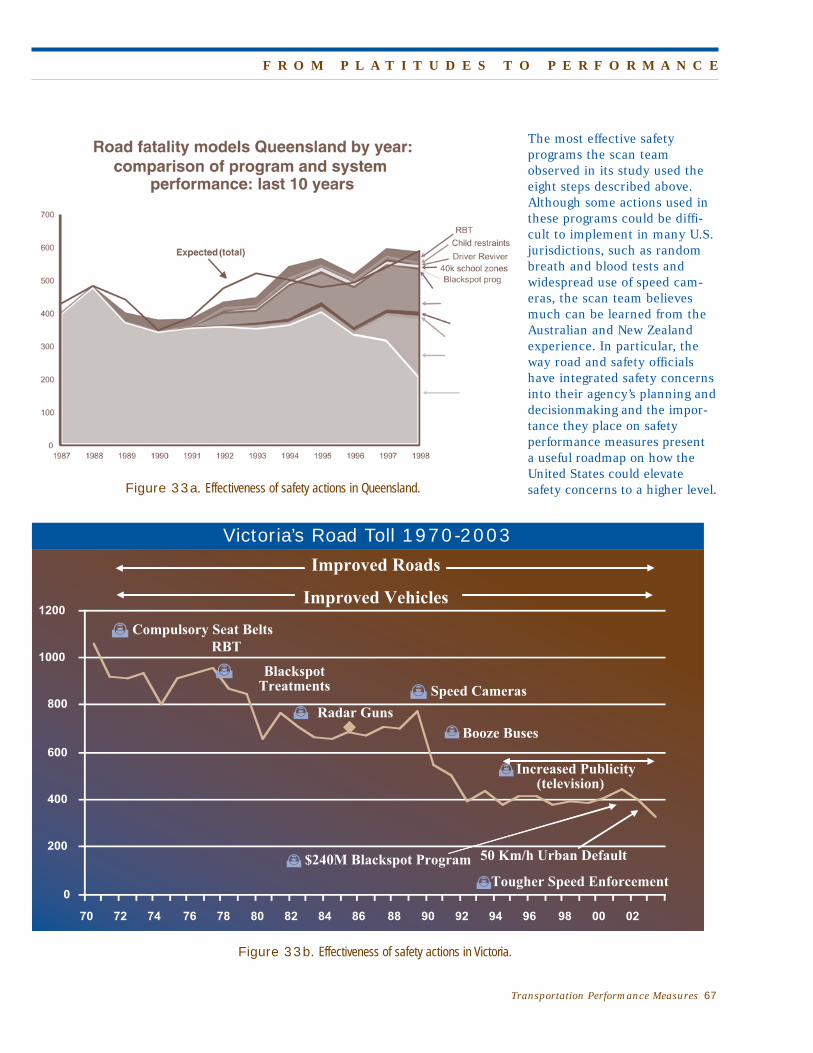
The most effective safety programs the scan teamobserved in its study used theeight steps described above.Although some actions used inthese programs could be diffi-cult to implement in many U.S.jurisdictions, such as randombreath and blood tests andwidespread use of speed cam-eras, the scan team believesmuch can be learned from theAustralian and New Zealandexperience. In particular, theway road and safety officialshave integrated safety concernsinto their agency’s planning anddecisionmaking and the impor-tance they place on safety performance measures present a useful roadmap on how theUnited States could elevate safety concerns to a higher level.
Transportation Performance Measures 67
F R O M P L A T I T U D E S T O P E R F O R M A N C E
0
200
400
600
800
1000
1200
Radar Guns
�
BlackspotTreatments
�
� Speed Cameras
� Booze Buses
� Compulsory Seat Belts
� Increased Publicity(television)
RBT
�
Improved Roads
Improved Vehicles
� $240M Blackspot Program 50 Km/h Urban Default
�Tougher Speed Enforcement
70 72 74 76 78 80 82 84 86 88 90 92 94 96 98 00 02
Figure 33b. Effectiveness of safety actions in Victoria.
Figure 33a. Effectiveness of safety actions in Queensland.
Victoria’s Road Toll 1970-2003

68
C H A P T E R T H R E E
Figure 34. Impact of speed camera enforcement on road speeds in Melbourne.
General ObservationsThe scan team has identified the following observationson the use of performance measures that would be of interest to officials in the United States. Many of these observations are of broad interest to trans-portation professionals, while others are of interest in a specific context.
1.The scan team found examples in which the process-es of setting priorities and making planning, invest-ment, and management decisions use performancemeasures to a much greater extent than is typical inthe United States. In cases where performancemeasures were used for priority setting, the processof using such measures represented a new level oforganizational behavior. The vertical integration ofinformation flow represented in the use of perform-ance measures for different levels and purposes ofdecisionmaking characterized the better examples ofperformance measurement. The scan team did notethat where overall policy goals and important per-formance measures were set primarily in a politicalprocess, transportation agencies often struggled todetermine how the desired performance could beachieved.
2. Perhaps the most impressive application of perform-ance measurement, in terms of showing how theprocess can influence governmental policy and budgetdeterminations, was in the area of road safety.Impressive results in reducing fatalities and injurieshave occurred in some of the sites the team visitedthrough a comprehensive program of engineering,enforcement, and education. Especially in Australia,the team noted that performance measurement activi-ties of VicRoads in relation to safety were impressive,and should be understood and considered carefully byU.S. officials.
3. A common framework to performance measurementwas apparent in all cases the team examined. Each
effort was related to a broader set of goals and objec-tives defined either by a legislative body or through apublic visioning process. These goals and objectivesled to the identification of transportation system-spe-cific performance measures, often tied to the targetvalues to be achieved in a future year. Strategies andinvestment actions were then chosen on their effec-tiveness in achieving desired performance outcomes,as well as on political considerations.
4. Transportation officials in the countries visitedappeared to have a general understanding of the dif-ference between the concepts of outcomes and out-puts. Outcomes were viewed as the ultimate charac-teristic of transportation system performance, whileoutputs were the products and services of the organi-zations that led to these outcomes.
5. In each case, transportation officials explained the ini-tial movement toward performance measurement as ameans of providing greater accountability and visibil-ity to the public of the agency’s activities. Differenttargets for credibility were apparent in the approachtaken to performance measurement. In some cases,the initiative to enhance agency credibility reflected adesire to show legislative bodies that the agency wasmanaging the transportation program efficiently andeffectively. In others, the performance managementeffort targeted the general public to increase percep-tion of agency performance. In still others, the effortresulted in enhancing the credibility of agency activi-ties in the eyes of other agencies that held an impor-tant place in transportation program development(e.g., the environmental protection agency in Brisbaneallowed transportation agencies to self-certify theirenvironmental activities).
6. In addition to accountability and public visibility,many officials commented that performance meas-urement can be used to educate both elected deci-sionmakers and the general public on the role trans-
Transportation Performance Measures 69
C H A P T E R F O U R
Observations andLessons Learned
70
portation plays in society and/or the need for addi-tional investment.
7. Performance measurement was applied at severaldifferent levels of planning and decisionmaking.For example, many measures were targeted atstrategic investment decisions on long-termimprovements to the transportation system. Inother cases, performance measures were used tomanage network operations (e.g., the rail system inQueensland and the tram system in Melbourne).Different levels of application usually meant the useof different performance measures.
8. In Japan, the national ministry established a coreset of 17 performance measures as a guide for allregional offices and prefectures (states) in thecountry. In addition, the prefectures could establishtheir own measures appropriate to their circum-stances. This was an example of a phenomenoncommon to all applications—the need and desire todetermine a small set of measures that were reallyimportant to an agency.
9. All of the sites visited used measures commonlyused in the United States. Road network conges-tion was a transportation system measure found inall of the performance measurement applicationsexamined. Officials often viewed this as one of theimportant issues facing their region and agency.Other network measures included accessibility andmobility provided by the transportation system,road safety, travel time, and trip reliability. Thelatter measure was found in the performance meas-ures in Australia, British Columbia, and NewZealand. Understanding trip and travel time relia-bility is an important underpinning for developingincident management programs and implementingother actions to deal with nonrecurring congestion.
10. Environmental measures were also present in all ofthe performance measure efforts the team exam-ined. Of all the performance measurement cate-gories examined in this scan, environmental meas-urement was the one creating the greatest chal-lenge to transportation agencies. The team foundfew examples in which environmental outcomeshad been identified and the relationship betweenoutcomes and transportation system performancehad been defined, although Transport Canada hasdeveloped an important framework for establishingthis relationship. An interesting challenge is occur-
ring in New Zealand, where government policyrequires transport agencies to define how their pro-grams will help achieve a sustainable land transportsystem for the country.
11. Measures of customer satisfaction were found in allof the sites visited. The measures most often relat-ed to the average scores obtained from public sur-veys (target values in some cases were quite low,e.g., exceeding 50 percent public acceptability inVancouver). Also, New Zealand’s approach to cus-tomer satisfaction measures focused on identifyingissues for which the customers were dissatisfied,and targeting organizational action to deal withthose issues. One concern expressed by scan mem-bers was that customer surveys seemed to be usedby many as a placeholder or crutch when morequantifiable measures could not be defined.
12. Measures relating to transportation system securitywere not found in any of the highway and port per-formance measurement examples. In many ways,this was viewed as an American issue, althoughtransportation officials in Queensland and NewSouth Wales did say that security was becoming amore important issue and that a security indicatorwould most likely be incorporated into their per-formance management regime in the future. Also,the scan team did not interview many transit offi-cials; the transit industry has made greater stridesin measuring security than the highway sector.
13. Many performance measurement applications tar-geted rural transportation network performance asa specific category for measurement. This was par-ticularly true in the Australian states visited, whereeach state has one major urban area dominatingthe state’s economy. This was viewed primarily as aregional equity issue.
14. The level of integrated data collection strategies asthey related to performance measurement variedfrom one site to another. In Japan, ITS technologieswere used to collect data to support operationsplanning and decisionmaking, and they fed intosystem performance measurement (e.g., the use ofprobe vehicles). In Queensland, a data collectionstrategy is related to each performance measure-ment category that defines the overall performancemeasurement program. In New South Wales, a traf-fic management center is the cornerstone of RTA’sefforts to collect data for system performance meas-
C H A P T E R F O U R
urement. In Victoria, VicRoads has an extensivedata collection program that relies on ITS-typetechnologies. Some of the more successful per-formance measurement programs occurred indata-rich environments with a history of strongdata collection and analysis.
15. Before-and-after studies were important elementsof the performance measurement systems in Japanand Australia. The performance measurement casesthe team examined in those countries paid consid-erable attention to discovering what impacts adopt-ed or implemented actions have had on selectedperformance measures. The results of these studiesact as feedback to the decisionmaking process andto determine the likely results of similarly adoptedactions in other parts of the region.
16. Graphic (and visual) presentation of performanceresults was viewed as a key component of the per-formance-management process, as was the identifi-cation of measures that the public can relate to.Most officials involved in managing performancemeasurement efforts stated that unless top deci-sionmakers understand the information presented,performance measurement efforts will be ineffec-tive. Visualization of information is thus critical tosuccessful performance measurement.
17. Comparing performance against peer organizationsand jurisdictions was used in Japan, Australia, andNew Zealand to understand better the key factorsdistinguishing economic and transportation per-formance, compared to other states. This compari-son effort was used simply as a screening tool toidentify differences (in both quantity per capita andrelative ranking), which then led to a more detailedexamination of why those differences occurred.
18. The key measure of success for performance meas-urement itself is the degree to which it influencesdecisions and budget allocation. This was a diffi-cult linkage to pin down during the scan visits. Themost advanced application appeared to be inQueensland and Victoria, where the performancemeasurement process was important in determin-ing program priorities for safety actions.
19. Few examples were found where performancemeasurement resulted in multimodal investmenttradeoffs. In most cases, performance measurementwas implemented in a modally focused agency, so
performance measures were targeted at decisionsrelating to the performance of the respective modalnetwork.
20. Measures relating to freight movement were foundin many performance measurement efforts.Examples of measures included commercial trucking travel time between economic gateways(British Columbia); mode split for goods movement(Vancouver); increase in average annual truck pay-load capacity, percent of illegally overloaded trucks,and freight rail delays and travel time variability(Queensland); and freight productivity, access toports, freight rates, freight-related infrastructurecondition, and congestion effects on freight move-ment (Victoria).
21. Organizational productivity measures were foundin all of the performance measure applicationsstudied. Agency managers viewed these asa critical element of the performance measurementexercise because they indicated the degreeto which their agency was delivering the productsand services needed to meet other performanceobjectives.
22. Monitoring project delivery through performancemeasures was also a common approach in most ofthe sites visited. An interesting aspect of this proj-ect delivery monitoring was the effort to assessproject performance against project expectations.
23. In cases where performance management was mostsuccessfully institutionalized in agency operations,top management leadership of and commitment tothe process of development and continuous usewere essential to get performance measurementpast its infancy. This was particularly important foragencies where the organizational culture and eventhe culture of the society itself were not conduciveto open and responsive performance-based plan-ning and decisionmaking.
Lessons for the United StatesSimilar to scan team observations, a large number of“lessons learned” came out of this scan:
1. Safety was viewed as a strategic use of performancemeasurement that has resulted in a significant declinein fatalities. The team believes a great deal can belearned from this application of performance measure-ment, especially as it relates to identifying strategies
Transportation Performance Measures 71
O B S E R V A T I O N S A N D L E S S O N S L E A R N E D

72
and actions that need to be in place to achieve reduc-tions in road fatalities.
2. Meaningful performance measurement is a product ofextensive outreach and discussion and collaborationwith partners. Performance measures are readilyavailable and easy to create, but without a compre-hensive (internal and external) outreach process, theirvalue as a behavioral influencer is limited. Open,inclusive planning processes are fundamental to goodmeasurement of performance.
3. In the best examples of performance measurement,officials were still refining what measures to use andhow to make sense of the political guidance theyreceived. This suggested that performance-basedplanning and decisionmaking are never-endingprocesses, and must be viewed as such by top agencyofficials. This also implied that an agency should notmeasure too many objectives, only what it needs tomake business decisions. Too many measures can bea burden on staff.
4. The key to success for measurement is accountability.This translates into the need for understandable meas-ures, and a systematic followthrough to determine thelevel of failure or success in meeting the objectivesdefined by the measure. This issue is important acrossall transportation areas, but has particular short-termrelevance and application in the safety area.
5. Performance measurement is most relevant whenlinked to decisionmaking, especially resource allo-cation. Elements to consider include allocation offunding at the program and project level, multimodaltradeoffs, and distributional equity. A multimodalapproach is best, although the team found few exam-ples of such an approach. Performance measuresposition agencies well to engage in debate, but maynot necessarily be the determining factor in a deci-sion, especially in the legislative arena. Measuressharpen and focus the debate, and help clarify orga-nizational direction.
6. Quality systems have been put in place and appearto be replacing externally defined quality criteria (e.g.,ISO 9000). Many agencies are redefining quality andfinding that the ISO process does not meet theirneeds.
7. For safety, enforcement strategies were the key tochanging driving behavior and affecting overall
success. The best-case examples go beyond themandatory use of seatbelts (alcohol testing andspeed enforcement) and are succeeding at reducingfatalities. In addition, the team found that engi-neering strategies were important elements of anoverall safety program resulting in significant short-and long-term improvements.
8. Analysis is an important underpinning for settingtargets and determining the effectiveness of actionsto reach these targets. The scan team found a muchgreater use of benefit-cost analysis as a method todetermine desirability of projects, and a desire todetermine after the project was implementedwhether the initial benefit-cost analysis was closeto the resulting performance.
9. Customer surveys are an important element ofdetermining organizational performance, if doneappropriately and in a valid manner. Many coun-tries appeared to be most successful at getting use-ful data from customer surveys by asking morefocused questions on specific aspects of transporta-tion system performance. Many survey effortsfocused on getting feedback from users on whatshould be changed and how it should be changed.
10. A strong linkage exists between performance meas-urement and asset management in Australia andNew Zealand. Scan participants had a sense that, inboth cases, transportation officials have a much bet-ter handle on the changing value of their asset basethan most transportation agencies in the UnitedStates. The team believes U.S. agencies could learnfrom these examples of how to better link asset valueto decisionmaking via performance measurement.
11. Although all of the sites visited professed interestand concern for environmental quality, all found itdifficult to come up with area-wide environmentalmeasures. This was the most disappointing aspectof the site visits for the scan team. New Zealandfaces a significant challenge because recent legisla-tion requires the national transportation agency toredefine its mission in the context of sustainability,or how its actions will contribute to a more sustain-able land transport system for the country. Theresulting actions over the next six months will beworth watching.
12. Do not measure too many things. The most impor-tant measures are those needed to influence budget
C H A P T E R F O U R
allocations and investment decisionmaking. In situations where large numbers of performancemeasures were considered, a lack of focus resultedin little influence on the decisionmaking process.
13. Post evaluations/assessments should be part of per-formance measurement. In many cases in the UnitedStates, little effort is made to determine the afteref-fects of transportation investment. One of the sur-prising results of this scan was the widespread use ofbefore-and- after studies as a means of determiningthe effectiveness of implemented actions.
14. Performance measurement is a complex, evolvingarea of opportunity. The U.S. transportationindustry is advanced in many areas of performance measurement, but still has much to learn. A coordinated, structured approach to sharing and advancing in the performance measurement area would serve the U.S. transportation industry well. This approach should emphasize the business model approach to assessing performance, which represents a shift to a corporate business model for management.
Transportation Performance Measures 73
O B S E R V A T I O N S A N D L E S S O N S L E A R N E D

74
The timing of this scan is most conducive to imple-menting the scan results because many opportuni-ties exist for disseminating them. For example, the
scan results were reported to several AASHTO commit-tees during 2004, including the Standing Committee onQuality in April, Standing Committees on Planning andon Highways and Traffic Safety in May, and others atthe annual meeting in September. The team alsoplanned to contact the Association of MetropolitanPlanning Organizations, National Association ofRegional Councils, and other groups to present resultsat relevant meetings. Several scan team members werescheduled to make presentations at the TransportationResearch Board’s second national conference on per-formance management in August 2004.
The scan team has developed the following preliminaryrecommendations on further activities that should fol-low from the scan:
1. National emphasis area demonstration on safety(FHWA). The most integrated and impressive applica-tion of a performance measurement framework thescan team observed was in the safety area. Among thefour countries, Australia demonstrated the mostadvanced process of understanding the problems,benchmarking against others, setting targets, identify-ing strategies, monitoring effects, and feeding resultsinto future planning efforts. The scan team believesthat the Australia model and the significant resultsachieved in the safety area are worthy of sharing andultimately implementing in the United States. Twosafety implementation strategies are recommended:• Bring Australian safety leaders to the United States
to tell their story to key groups.• Encourage States to implement the best practices
learned.
2. Data exchange and warehousing consortium forbenchmarking (AASHTO). Develop an action plan toinitiate a data exchange and warehousing consortiumfor benchmarking performance among participatingStates. The goal is to export State-level performancedata to an external source for the purpose of compar-ing performance in a variety of service areas. It wouldalso be a forum for sharing performance objectives,measures, and targets, and the rationale behind them.
3. Performance measure (PM) research. Initiateresearch and disseminate findings (through FHWAand AASHTO) on several PM-related topics:• Monetizing PMs—Initiate a study on converting
measures into cost-based numbers and targets byidentifying the cost and/or benefit of providing theimprovement on a monetary basis.
• Interrelationship of PMs—Initiate a study on thecause-and-effect impacts between PMs that exam-ines the correlation between improving possiblycompeting transportation attributes.
• Multimodal tradeoffs—Initiate a study on the inter-relationship between modal PMs. The study wouldexpand on the “interrelationship” issue to includetradeoffs between modes.
• Outcome/output empirical relationships—Initiate astudy on translating output indicators to outcomeconsequences. Since output PMs tend to be morequantitative (versus a more subjective outcome),the tendency is to gravitate toward them. Mosttimes, however, the service improvement is diffi-cult to recognize. This area of study would identifythe relationship between one or more output PMsand relate them to a desired outcome target.
4. Training (National Highway Institute) or guidancepapers (AASHTO). Develop performance measure-
C H A P T E R F I V E
ImplementationStrategies andRecommendations

ment courses and instruction aimed at executive andmidlevel leadership. Topics could include the following:• Development and use of performance measures• Outsourcing of products and services• Best practices• Before-and-after analysis of implemented actions
and their relationship to performance measure-ment
• Relationship between the practices of asset man-agement (self-assessment tool) and performancemeasurement
5. Stand-alone overview document on the scan team’sfindings related to congestion and reliability perform-ance measures. Develop a resource document oninternational and domestic practices on measuringcongestion and reliability. Related publications couldinclude an abbreviated pamphlet for distribution atconferences and meetings.
6. Conferences or meetings. Plan, develop, and imple-ment conferences or meetings specifically orientedto presenting the scan findings and recommenda-tions to transportation professionals, State commis-sioners and DOT senior staff, top representatives ofUSDOT, State governors, local mayors and other offi-cials, and members of Congress and their staffs. Thepurpose of these meetings would be to increaseawareness of performance measures (how and wheretransportation agencies use them) and present thefindings, lessons learned, and recommendations ofthe performance measures scan.
7. Technical guidance. Develop and distribute throughAASHTO, FHWA, and other stakeholder organizationsguidance on various secondary PM topics:• Auditable PMs—Provide PM design and tracking
methodology for developing verifiable measurenumbers and associated impacts.
• Before-and-after analysis—Prepare best-practicematerials on this type of analysis. This would beon implemented actions and their relationship toperformance measurement improvement.
8. Presentations of findings from the scan at appropri-ate regional and national meetings and conferencesthroughout the United States over the next year.Candidate venues include AASHTO annual, commit-tee, subcommittee, task force, and regional organiza-tion meetings; Transportation Research Board annualand committee meetings; and meetings of organiza-tions such as the Institute of Transportation
Engineers, Association of Metropolitan PlanningOrganizations, and International Bridge, Tunnel,and Turnpike Association. Develop a core presenta-tion and a frequently asked questions sheet thatcould be customized, depending on the venue.Initial versions of this material have been producedfor use by team members. Team members wouldmake the presentations, starting with those whowould normally be at the meetings to minimizecosts.
9. Web-based distribution of materials. Investigateand select a logical Web-based home for the materi-als emanating from the scan, including reports, pre-sentations, and implementation actions. Optionsinclude AASHTO, FHWA, or a university. Requestlinks to the site on home pages of a number oforganizations and launch the site with a notifica-tion posted on these home pages. Disseminate scanfindings and recommendations via various organi-zations’ Web sites. Develop information packets,sample Web pages, and use guidelines.
10. Followup review on the sustainability concept.New Zealand is attempting to incorporate sustain-ability into transportation decisionmaking. At thetime of the scan, the national transport agency wassix months away from proposing how it wouldincorporate sustainability goals into its perform-ance measurement system. The team recommendsthat a Transit New Zealand representative be invit-ed to visit the United States after implementationto discuss the topic.
Transportation Performance Measures 75
I M P L E M E N T A T I O N S T R A T E G I E S A N D R E C O M M E N D A T I O N S

76
Contact Information (at time of scan)
Douglas MacDonald (AASHTO Co-Chair)Secretary, Washington StateDepartment of TransportationPO Box 47316Olympia, WA 98504–7316 Telephone: 360/705–7054E-mail: [email protected]
Connie P. Yew (FHWA Co-Chair)Highway Engineer, Office ofProfessional and CorporateDevelopment, Federal HighwayAdministrationHCM, Room 4208400 Seventh Street, SWWashington, DC 20590Telephone: 202/366–1078E-mail: [email protected]
Dr. Michael (Mike) Meyer (Report Facilitator)Professor, School of Civil &Environmental Engineering Georgia Institute of Technology 790 Atlantic Drive Atlanta, GA 30332 Telephone: 404/385–2246 E-mail: [email protected]
Robert (Bob) ArnoldDivision AdministratorFederal Highway AdministrationNew York DivisionLeo W. O’Brien Federal Building,Room 719Albany, NY 12207Telephone: 518/431–4127E-mail: [email protected]
John R. BaxterDirector, Office of Safety DesignHAS–10, Room 3419Federal Highway Administration400 Seventh Street, SWWashington, DC 20590Telephone: 202/366–9198/1795E-mail: [email protected]
Randall K. HalvorsonDirector, Program ManagementDivision, Minnesota Department of TransportationMail Stop 120395 John Ireland BoulevardSt. Paul, MN 55155–1899Telephone: 651/296–1344E-mail: [email protected]
Hal KassoffSenior Vice President, Parsons Brinckerhoff1401 K Street, NWWashington, DC 20005Telephone: 202/783–0241, ext. 271E-mail: [email protected]
Ken PhilmusDirector, Tunnels, Bridges, and BusTerminals, Port Authority of New York and New Jersey1 Madison Avenue, 5th FloorNew York, New York 10010Telephone: 212/435–4800E-mail: [email protected]: International Bridge,Tunnel, and Turnpike Association
Dr. T. Jeffrey PriceSenior Policy Analyst, VirginiaDepartment of Transportation1401 East Broad StreetRichmond, VA 23219Telephone: 804/786–2826E-mail: [email protected]
Douglas (Doug) R. RoseDeputy Administrator,Chief Engineer for OperationsMaryland State HighwayAdministration707 North Calvert Street (MS C–402)Baltimore, MD 21202Telephone: 410/545–0360Fax: 410–209–5010E-mail: [email protected]
Dr. C. Michael (Mike) WaltonProfessor, Department of CivilEngineeringThe University of Texas at Austin1 University Station C1761Austin, TX 78712Telephone: 512/471–1414E-mail: [email protected]
William R. (Gary) WhiteManager, Federal HighwayAdministration Midwest Resource Center19900 Governors Drive, Suite 301Olympia Fields, IL 60461Telephone: 708/283–3507E-mail: [email protected]
A P P E N D I X A
Scan TeamMembers

Biographic Sketches
Douglas MacDonald (AASHTO co-chair) is the secre-tary of transportation for Washington State. MacDonalddirects 6,500 employees of the Washington StateDepartment of Transportation responsible for operation,maintenance, and capital planning and projects for theState highway system and Washington State Ferries, thelargest passenger and auto ferry system in the country,as well as programs supporting other transportationmodes. Before joining the department in 2001,MacDonald served for nine years as executive director ofthe Massachusetts Water Resources Authority, where heimplemented a $6 billion program of new facilities forsewage treatment and drinking water delivery and treat-ment for 61 communities in the greater Boston area.MacDonald holds bachelor’s and law degrees fromHarvard University. He serves as chair of the AmericanAssociation of State Highway and TransportationOfficials’ Standing Committee on the Environment.
Connie Yew (FHWA co-chair) is a highway engineer forthe Federal Highway Administration in the Office ofProfessional and Corporate Development in Washington,DC. Yew works with various program offices to develop,analyze, and report on key agency performance meas-ures. She recently led an agency-wide effort to develop acorporate strategy on obtaining and responding to cus-tomer feedback. Before joining the Office of Professionaland Corporate Development in 1999, she was the specialassistant to the FHWA executive director. Yew holds abachelor’s degree in civil engineering from the Universityof Maryland and a master’s degree in public administra-tion from The George Washington University. Yew is aregistered professional engineer in Maryland and serveson several technical committees of the TransportationResearch Board and the World Road Association.
Dr. Michael Meyer (report facilitator) is professor andformer chair of the School of Civil and EnvironmentalEngineering at the Georgia Institute of Technology.From 1993 to 1998, Meyer was director of transporta-tion planning and development for the State ofMassachusetts, where he was responsible for statewideplanning, project development, traffic engineering, andtransportation research. Before that, he was a professorin the Department of Civil Engineering at theMassachusetts Institute of Technology (MIT). Meyer haswritten more than 120 technical articles and hasauthored or coauthored numerous textbooks on trans-portation planning, policy and education, environmen-tal impact analysis, and intermodal transportation. He
received a bachelor’s degree in civil engineering fromthe University of Wisconsin, a master’s degree in civilengineering from Northwestern University, and a Ph.D.in civil engineering from MIT. He is a registered profes-sional engineer in Georgia.
Robert (Bob) Arnold is the New York Division adminis-trator for the Federal Highway Administration. Theoffice works primarily with its partner, the New YorkState Department of Transportation (NYSDOT), toensure the State’s highway system is an integrated,effective, and efficient part of the Nation’s transporta-tion system. As unit leadership, Arnold identifies rele-vant performance objectives, measures, and goals forthe office. This is done in conjunction with NYSDOTand other highway partners when appropriate. He hasworked on several FHWA performance measure andquality improvement initiatives, including developingand teaching the FHWA Performance Measures course,serving on the FHWA Environmental “Vital Few” team,and speaking on these topics at numerous nationaltransportation conferences. He received a bachelor’sdegree in civil engineering from Ohio NorthernUniversity, and he has worked for FHWA since 1983.Arnold is a member of the American Society forQuality, an organization dedicated to the advancementof the theory and practice of quality.
John R. Baxter is the director of the Office of SafetyDesign at the Federal Highway Administration. He leadsa multidisciplinary staff in developing and incorporatingroad and roadside features that impact highway safetyperformance. Before this appointment, he was FHWA’sIndiana Division administrator. Baxter has held numer-ous FHWA positions during his 21-year career. From1988 to 1992, he held positions in traffic operations andintelligent transportation systems at the national level.From 1992 to 1995, he was a planning and programmanagement engineer in New Mexico, working with NewMexico’s metropolitan planning organizations and nation-al laboratories. From 1995 to 1999, he served as assis-tant division administrator in the Utah Division, assistingin the development of plans for the 2002 Winter OlympicGames and delivering the $1.59 billion Interstate 15megaproject. As Indiana Division administrator, headministered a $700 million-plus Federal-aid highwayprogram in partnership with the Indiana Department ofTransportation, metropolitan planning organizations, andothers. Baxter has a bachelor’s degree in civil engineeringand a master’s degree in transportation engineering fromClemson University in South Carolina. He is a registeredprofessional engineer in Utah.
Transportation Performance Measures 77
S C A N T E A M M E M B E R S

78
Randy Halvorson is director of the MinnesotaDepartment of Transportation’s (Mn/DOT) ProgramManagement Division. This group is responsible for abroad range of planning and operational activities,including all statewide highway investments and modalprograms. Before assuming the position in January 2003,Halvorson held a number of positions at Mn/DOT, includ-ing assistant director of program delivery (1999-2002),assistant commissioner for the Transportation Researchand Investment Management (TRIM) Division (1998-1999), assistant division director for TRIM (1994-1998),director of the Transit Office (1985-1994), and directorof national relations (1983-1985). Halvorson has master’sand bachelor’s degrees in political science from theUniversity of Minnesota. He is a member of severalnational transportation organizations, including theTransportation Research Board’s Committee onPerformance Measures and the American Association ofState Highway and Transportation Officials’ StandingCommittee on Planning.
Hal Kassoff is a senior vice president and director of theHighway Practice Area with Parsons Brinckerhoff.Among his varied responsibilities, Kassoff is an instructoron performance measurement at the AmericanAssociation of State Highway and TransportationOfficials’ National Transportation ManagementConferences, held five times a year. Kassoff has writtenarticles and delivered talks on performance measure-ment. In October 2000, he participated in theTransportation Research Board’s National Conference onPerformance Measures and presented one of the majorpapers, “Implementing Performance Measures inTransportation Agencies.” He also served on the teamthat developed the recent AASHTO-adoptedTransportation Asset Management Guide. From 1984 to1996, Kassoff served as administrator of the MarylandState Highway Administration, where he introduced totalquality principles, including performance measurement.Kassoff is a civil engineer with a bachelor’s degree fromthe City University of New York and a master’s degree intransportation from Northwestern University. He isinvolved in numerous national organizations, includingthe American Council of Engineering Companies,American Road and Transportation Builders,International Road Federation, and Institute ofTransportation Engineers.
Ken Philmus is director of the Port Authority of NewYork and New Jersey’s Tunnels, Bridges, and BusTerminals in New York, NY. Philmus oversees operations,capital, and planning for the George Washington Bridge,
Lincoln Tunnel, Holland Tunnel, Goethals Bridge,Bayonne Bridge, Outerbridge Crossing, Port AuthorityBus Terminal, and George Washington Bridge BusStation. The facilities under Philmus’ responsibility seeabout 1.5 million travelers per day between New Yorkand New Jersey and collected more than $750 million inrevenue in 2003. The George Washington Bridge is thebusiest bridge in the world with upwards of 350,000vehicles per day, and the Port Authority Bus Terminal isthe busiest bus terminal in the world with more than200,000 travelers per day. To carry out the effectivemovement of both people and goods across the NewYork/New Jersey metropolitan region, Philmus managesmore than 1,500 employees, $360 million in operatingexpenses, and a $1.1 billion five-year capital investmentplan. Earlier, Philmus served as the deputy general man-ager of John F. Kennedy International Airport, one of thepremier airport gateways in the United States and thebusiest international cargo airport in the country.Philmus has a bachelor’s degree in industrial engineeringfrom the State University of New York at Buffalo and amaster’s degree in public administration from New YorkUniversity. He serves on the Executive Board of theInternational Bridge, Tunnel, and Turnpike Association,Intelligent Transportation Society of America, E-ZPassInteragency Group, and TRANSCOM, and is vice chair-man of the I-95 Corridor Coalition.
Dr. T. Jeffrey Price is a senior policy analyst in theManagement Services Division of the VirginiaDepartment of Transportation (VDOT). In his position,he performs planning and development functions, devel-ops policies, and conducts organizational, process review,and re-engineering studies. He brings a breadth of experi-ence to the division, including two years’ experience withthe U.S. Department of Agriculture, conducting policyanalysis for the Office of the Chief Economist (focusingprimarily on motor fuels and other energy issues), and10 years’ experience as a consultant, conducting energymarket research and cultural resource managementstudies. In addition, Price spent a year teaching econom-ics at Ambo College in Ethiopia. His areas of expertiseinclude statistics, econometrics, productivity analysis,public policy development, and project management.Since joining VDOT, Price has developed presentationsand written letters and reports for the commissioner andhis staff, contributed to the 2003 VDOT WorkloadAssessment, conducted a review of the AssetManagement Division, assisted in developing the AssetManagement System’s Paving Schedule module, conduct-ed statistical analyses of work orders and their relation-ship to contract schedules, and contributed to agency-
A P P E N D I X A

wide performance reports. He is familiar with theHighway Economic Requirements System (HERS) modeldeveloped by FHWA, as well as the planning model usedby VDOT and the agency’s performance measures. Priceholds bachelor’s and master’s degrees in anthropologywith specialization in archaeology from the University ofGeorgia, and a Ph.D. in agricultural and applied econom-ics with specialization in decision modeling and policyanalysis from the University of Georgia.
Douglas (Doug) R. Rose is the deputy administratorand chief engineer for operations at the Maryland StateHighway Administration (SHA). Rose directs SHA’s sevendistrict offices, traffic and safety operations, materialsand research operations, maintenance, construction, andITS program. Rose was recently named a member of theAmerican Association of State Highway andTransportation Officials’ new Subcommittee onOperations and Management and is chair of thePerformance Measurement Task Team. Rose graduatedfrom Clarkson College of Technology with a bachelor’sdegree in civil and environmental engineering, and hehas a master’s degree in civil engineering from theUniversity of Maryland. Rose is active in AASHTO, mostrecently serving as executive member of the AASHTO-AGC-ARTBA Joint Committee of the AmericanAssociation of State Highway and TransportationOfficials, Associated General Contractors of America,and American Road and Transportation BuildersAssociation. He also served for four years on the TaskForce on Strategic Highway Research Program (SHRP)Implementation and is a member of AASHTO’sTechnology Implementation Group. He chairs theTransportation Research Board Committee on SuperpaveEducation and Communications. Rose is vice presidentof the Maryland Association of Engineers and is a mem-ber of the American Society of Civil Engineers, AmericanSociety of Highway Engineers, and American PublicWorks Association.
Dr. C. Michael (Mike) Walton is professor of civil engi-neering and holds the Ernest H. Cockrell CentennialChair in Engineering at the University of Texas at Austin.Walton’s research focuses on intelligent transportationsystems and intermodal freight logistics, in addition totransportation systems engineering, planning, operations,and policy analysis. He holds a master’s degree and aPh.D. in civil engineering from North Carolina StateUniversity. Walton is a member of the National Academyof Engineering, the nation’s highest honor for engineeringprofessionals. He has served on or chaired a number ofnational study panels, including serving as past chair of
the Transportation Research Board’s (TRB) ExecutiveCommittee and current chair of the Research andTechnology Coordinating Committee. Walton is a found-ing member of the Intelligent Transportation Society ofAmerica. He is also a member of the American Society ofCivil Engineers and the Institute for Operations Researchand the Management Sciences, to name a few. Waltonhas also served as senior editor or contributing authorfor a variety of technical reference books and manuals,and as a member of the editorial board for several inter-national journals. He has published more than 200 arti-cles and reports, and has presented more than 250 tech-nical lectures, presentations, and keynote addresses.
William R. (Gary) White is a Resource Center managerin Olympia Fields, IL, for the Federal HighwayAdministration. White is responsible for two of theResource Center’s technical service teams, theOperations Team and the Safety and Highway DesignTeam. The Resource Center is charged with providingtraining, technical assistance, and technology deploy-ment to its transportation partners and customers. A sig-nificant part of the Resource Center’s responsibility isproviding technical assistance and technology deploy-ment to the transportation industry to assess the per-formance of the highway system to determine where it isbest to focus the available resources. In the past, Whitespent five years as an assistant division administrator inthe Indiana Division Office of FHWA, where performancemeasurement became a key element in the operation ofthe office. The Indiana Department of Transportation,FHWA’s principal partner in carrying out the Federal-aidHighway Program in Indiana, also was just beginning todevelop performance measures to assess its program.White has a bachelor’s degree in civil engineering fromthe University of Illinois, and a master’s degree in civilengineering from Ohio State University. White is a regis-tered professional engineer in Ohio.
Transportation Performance Measures 79
S C A N T E A M M E M B E R S

80
Overview of Performance Measures1. Please briefly describe the process of transportation
system performance measurement used by youragency. Why did your organization begin using per-formance measures? How long has system perform-ance measurement been used in your agency? What do you consider innovative about the processyou are using for measuring transportation systemperformance?
2. What performance measures are being used by yourorganization to monitor transportation system per-formance? Why were these measures selected?
3. For what purposes have these measures been used(e.g., reporting to the public, reporting to oversightgroups, internal management, prioritizing programsand projects, etc.)? How would you describe the bene-fits your agency gets from using performance measures?
4. Which measures have you found to be the mostimportant to your agency for the purposes identifiedin question 3 above? Which measures have notproved to be very successful for the purposes identi-fied in question 3 above?
5. Some agencies use measures simply to monitor trans-portation system performance over time. Othersestablish desired targets or goals for each measure-ment category (e.g., for safety, a national goal ofreducing fatalities by x percent). Do you establish tar-gets or goals for any of your system performance cate-gories? If so, who established these targets and whywere these target values chosen?
6. Does your agency use measures that describe the link-age between transportation system performance andthe economy, (e.g., contribution of transportation togross domestic product)? Are measures defined forany other non-transportation areas, such as trans-portation’s impact on environmental quality or inter-national trade?
7. To what extent is performance measurement com-mon in other agencies in your government? If otheragencies use performance measurement, do thoseagencies that have some policy linkage to trans-portation (for example, agencies relating to safetyand enforcement, trade, environmental quality) usetransportation-related performance measures?
8. If your agency is focused on only one part of thetransportation system (for example, the road net-work), are you aware of other agencies that usemeasures to monitor the performance of otherparts of the transportation system, such as airports,ports, rail services, urban transit, etc.?
9. If you represent a national organization, do youhave agencies at the provincial/state or metropoli-tan levels that also use performance measures? Ifso, to what extent are these measures similar or dif-ferent from the measures you use?
10. Do you believe that the use of performance meas-ures has measurably changed how your agencydoes business? If so, which measures have beenmost important to your agency? Do you think thatthe monitoring of a selected number of measurescould appreciably affect transportation system per-formance over the long term?
11. Given the importance of transportation to societyand to individuals, are you using (or thinking ofdeveloping) performance measures that track “howmuch transportation costs?” To individuals? Tocommunities? To different sectors such as thefreight sector? Do you make a distinction (or envi-sion making one) between private costs to the indi-vidual (e.g., vehicle, fuel, insurance, etc.) and pub-lic costs (e.g., infrastructure, control systems, andmaintenance)? Do you track the share of varioususers’ contributions to the costs of transportation(e.g., the revenues generated for transportationfrom trucking fees)? To the share of economic
A P P E N D I X B
AmplifyingQuestions
benefit they derive from investment in the transportation system?
12. In the United States, we often measure the costs ofcongestion as the value of time lost. Do you measurecongestion costs? Do you use, or are you consider-ing, system performance measures that go beyondcongestion measures, for example, measures ofurban mobility, accessibility, and system reliability?
13. How are transportation costs tracked or consideredin assessments of economic productivity and eco-nomic health in your country, state/province, ormetropolitan area, if at all?
14. To what extent is a “customer focus” included in yourperformance measures? How do you define your cus-tomers? What strategies or techniques are used tocollect data on customer satisfaction or dissatisfac-tion with transportation system performance?
15. From your experience, what are the key lessons inusing performance measures in your agency’s plan-ning and decisionmaking processes? What has beenyour greatest success?
16. From your experience, what are the key barriers toeffective use of performance measures in youragency’s planning and organizational decisionmak-ing processes?
17. From what you know about how transportation sys-tem performance measurement is done in theUnited States, what do you consider to be the bestparts of our approach toward performance meas-urement? What do you do better than the UnitedStates?
System Performance Measurement andDecisionmaking
1. If your agency has a strategic plan, business plan,or core business strategy, to what extent are yoursystem performance measures integrated into thisplan? To what extent have performance measuresactually affected investment decisions? How do youmake sure that the agency’s decisions and actionsreflect the desired performance outcomes?
2. Do you use performance measures to determine theoverall effectiveness of investment in the transporta-tion system? If so, to what extent do you believesuch performance measures are meaningful or useful
to your agency? To important stakeholders? To topdecisionmaking officials outside your agency?
3. If targets or performance goals are used as part of youragency’s performance measurement (e.g., a maximumlevel of crashes on the road system), how are thesetargets or goals chosen? Who decides what these val-ues should be?
4. Are you using any methodology that is based on a“benefit/cost” to choose investment strategies amongdifferent modes of transportation?
5. Does your performance measurement system allow fora direct comparison between investment for newinfrastructure versus rehabilitation and operations-ori-ented investment?
6. Does your jurisdiction use an asset managementapproach to capital planning and investment decision-making? If so, what measures are used to track infra-structure condition? Do you track “system needs”over time? If so, how do you forecast future demandsfor transportation services?
7. Do you track how transportation investment is made(e.g., how much is financed through debt as contrast-ed to other forms of investment)? How much is borneby user costs versus costs of general government?Have you noticed a change in the mix of financingover time? Does your agency have performance tar-gets for cash balances, revenues, expenditures, etc.?
8. Have you faced a situation where two or more per-formance measures might have been incompatiblefrom the perspective of agency decisionmaking (e.g., asafety performance measure that results in slowingtraffic that might be in conflict with a performancemeasure oriented to improving vehicular flow)?
9. To what extent are decisions relating to human andcapital resource allocation in your agency tied todesired levels of system performance as specified byyour performance measures? For example, if infra-structure condition is an important performancemeasure, do you think a higher level of staff resourcehas been dedicated to system maintenance because ofthis measure?
Specific Types of Performance MeasuresSafety1. What are the types of measures used to monitor trans-
portation system safety? Why have you defined these
Transportation Performance Measures 81
A M P L I F Y I N G Q U E S T I O N S

82
measures as you have (e.g., some countries use fatali-ty rates while others simply use number of fatalities)?Do you have different measures as a function of geo-graphic scale (e.g., national versus state/provincial ver-sus metropolitan), or by level of congestion?
2. Which of the measures identified in question 1 havereally made a difference in the way your agencymakes investment decisions?
3. Improving highway safety requires many differenttypes of strategies (e.g., actions relating to engineer-ing, education, enforcement, and emergency servic-es). In most countries, this means that many differ-ent organizations are important participants in theroad safety program. Are there other agencies (e.g.,police, civil aviation, maritime security, etc.) thatuse safety-related transportation system perform-ance measures? To what extent have governmentand nongovernment organizations in yourcountry/state/province/region adopted a common setof safety-related performance measures?
4. Are these performance measures primarily used forengineering decisions (e.g., what types of crashes dowe need to focus on), or are they used by agency lead-ers and political decisionmakers (e.g., how muchmoney do we need to devote to transportation systemsafety)? Are the performance measures used tobenchmark your system’s performance with that ofother countries or other agencies?
5. Has your agency or government established specificsafety targets or goals? If so, what are they, andwhat has been your recent experience in meetingthese targets?
6. What data do you collect for the performance meas-ures identified in question 1? Who collects thisdata? What type of data management system orinformation technology do you use to collect andmanage safety-related data as it relates to systemperformance measurement? Do you use the Internetfor reporting safety data?
7. Are you tracking performance of the total transporta-tion system or are you classifying your data by type ofcrash or geographic area? Do you have the capabilityto do both?
8. To what extent is safety performance recorded andreported in relation to the cause of the incident (e.g.,
driver performance or pedestrian behavior, engineer-ing design or other human factors issues)?
9. Do you collect data on pedestrian and bicycle injuriesand/or fatalities? Do you collect data on freight-relatedinjuries and/or fatalities (e.g., truck crashes)? Does thedata identify who or what caused the incident?
10. Is your tracking of safety data used to predict whatmight happen in the future with respect to expect-ed safety performance, given changing design anddemographic characteristics? For example, is thechanging age distribution of the population at allconsidered as a possible factor in future safetyexperience?
11. Have you been able to demonstrate cause and effectbetween system investments and changes in systemsafety performance?
12. To what extent has safety performance monitoringaffected program decisions at the administrative orlegislative level? To what extent has the use of per-formance measures led to improved safety on yourtransportation system? Have specific safety strate-gies or project designs been adopted by your agencybecause of safety performance measurement?
13. From your experience, what are the key lessons inusing safety performance measures in your agency’splanning and decisionmaking processes? What hasbeen your greatest success?
14. From your experience, what are the key barriers toeffective use of safety performance measures in youragency’s planning and organizational decisionmakingprocesses?
System Optimization1. How do you measure desired system operational
performance? For example, do you use some indi-cator of level of service such as travel speed, delay,maximum throughput, congested hours, etc?
2. Have you developed a measure of transportationsystem reliability that responds to the needs anddesires of system users (both freight and publicusers)? Reliability is defined as the degree to whichtravel time on a particular transportation facility oron a transportation system is similar over repeatedtrips, that is, the variance of travel time for repeat-ed trips is quite small.
A P P E N D I X B

3. If such measures are used, how useful are they in con-veying to administrators and/or legislators in yourjurisdiction the magnitude of the problems facing thetransportation system?
4. If some indicator of delay is one of the measures used,how is delay defined (e.g., as a matter of time or costor both)? Is the delay for shipping, goods delivery,and other freight movement included in your systemperformance determination?
5. Do you make a distinction in your performance meas-urement between delay that is caused by accidentsand vehicle breakdowns (referred to as nonrecurringdelay), and recurring delay due to high levels ofdemand and insufficient capacity?
6. In several countries of the world, data collection isbeing conducted by both public agencies and privatefirms to provide better information to the users of thetransportation system. To what extent are public andprivate organizations involved with providing travelinformation to travelers in your country?
7. Do you have information that indicates the amount ofimprovement that will occur when a particular type ofchange is made to the transportation system (thiscould result from physical improvements or changesin pricing and demand management)? For example, ifyour country/province or state/metropolitan area hasimplemented intelligent transportation system tech-nologies, how are you tracking the performance andbenefits of these investments?
8. From your experience, what are the key lessons inusing system optimization performance measures inyour agency’s planning and decisionmaking process-es? What has been your greatest success?
9. From your experience, what are the key barriers toeffective use of system optimization performancemeasures in your agency’s planning and organizationaldecisionmaking processes?
Transportation System Performance andEnvironmental Quality1. Do you measure the impacts of transportation system
performance on the natural environment and on com-munities? For example, do you track the transporta-tion system contribution to the following:a. To air quality such as greenhouse gases? By mode
or region? Changes in fleet performance and mix
(e.g., increasing use of alternative fueled vehicles)?b. To habitat and species preservation? Have perform-
ance measures begun to emerge from the COSTAction 341 initiative of the European Community?
c. To water quality? Do you have measures relating tothe amount of impermeable surface associated withtransportation facilities? If your agency deals withsnow and ice removal, how do you monitor theenvironmental impacts of your removal strategies?
d. To noise levels? Do you have measures that trackthe extent and severity of noise impacts on commu-nities or on sensitive land uses?
e. To environmental compensation (e.g., the numberof wetlands replaced or restored due to transporta-tion construction)?
f. To land use? Is the relationship between transporta-tion investment and urban form an important social,economic, or political issue in your jurisdiction?
Program Delivery and Accountability1. Do you monitor specific characteristics of your
agency’s program delivery (e.g., time for project devel-opment, project quality, project cost, use of consult-ants versus your own staff, etc.)? Do you have inter-mediate steps in the project development process thatserve as benchmarks allowing you to monitor projectprogress? What are your greatest barriers to efficientprogram/project delivery?
2. Have you changed agency project delivery proceduresin response to monitoring of program progress (e.g., agreater use of value engineering, increased use ofdesign/build consultants, use of incentive/disincentiveclauses, etc.)?
3. How are agency managers held accountable, if at all,for obtaining improved system performance as definedby your performance measures?
4. How do you report your agency’s financial perform-ance (a public sector version of a balance sheet, cashflow tables, return on investment, etc.)?
5. How do you convey to the public that you are account-able for delivering and maintaining a good transporta-tion system? How do you evaluate whether your infor-mation-disseminating strategy is being successful (e.g.,through the number of hits on your Web site)? If youhave a customer-focused set of performance measures,do you think that the public has a more positiveimpression of your agency’s activities because of thepublic reporting of system performance?
Transportation Performance Measures 83
A M P L I F Y I N G Q U E S T I O N S

84
A P P E N D I X C
New Zealand Transit’sStrategic Plan andPerformance MeasuresThe Key Goals of Transit New Zealand’s Strategic Plan (as of October 2003)
Key Goal 1
Plan and develop an integrated, safe, responsive and sustainable state highway system.
Key Goal 2
Maintain, operate and protect the state highway system.
Key Goal 3
Exercise social and environmental responsibilityin all our activities.
Key Goal 4
Obtain funding which is adequate to ensure an affordable,integrated, safe, responsive and sustainable statehighway system.
Key Goal 5
Lead the transport industry in terms of roading solutionsand the skills of our people.
Key Goal 6
Interact and communicate effectively with road users,communities and their representatives.
Key Goal 7
Maintain good relationships and work effectively with stakeholders and related organizations.

Transportation Performance Measures 85
A P P E N D I X C
Performance Measures by Key Goals
Key: Environmental Social Economic
Measure Comment
Change (due to investment, revocation or depreciation) in the dollar value of the state highway asset
The value of the state highway network is approximately $12 billion.Key Goal 1,2
The percentage change in returns from state highway propertyrentals
The measure is intended to demonstrate the annual return on fundsinvested in property, monitor the trend over time, and comparereturns against property market indicators.Key Goal 1
The percentage of properties in the tenantable portfolio that havebeen vacant for 6 months or more
The target is a rate of vacancies of less than 10% for propertieswhich have been vacant for 6 months or more. This will enable measurement of vacancy rates over time.Key Goal 1
Rate of surplus property disposal from projects completed in the previous financial year
The target is 98% of projects completed in the previous year havebeen reviewed to assess surplus property. This measure will ensurethat residual properties post construction will be made available for disposal as quickly as possible.Key Goal 1
Percentage change in maintenance costs per 1,000vkt traveled This can be measured by the change in dollars spent on maintenance per 1,000 vehicle kilometres traveled.Key Goal 2
Forecast annual dollar benefits from annual construction project programme
This will be measured by total benefit dollars for total cost dollars.Key Goal 1
Actual project dollar benefits compared to the forecast benefits Report on the estimated dollar benefit to be gained from the amountspent on projects. Information will come from post-constructionaudits completed in the given year based on:• Traffic volumes x project savings• Actual accident history• Audits would normally be 3-5 years after completion.Key Goal 1

86
A P P E N D I X C
Performance Measures by Key Goals (continued)
Key: Environmental Social Economic
Measure Comment
Dollars spent on environmental measures This is an interim measure until Transit’s environmental strategy is further developed. Initially the measure will be of the dollars spent onlandscaping, noise control, run-off control, flora, fauna and culturalprotection measures, and monitoring.Key Goal 3
Transfund New Zealand’s satisfaction with Transit’s performance The Stakeholder Survey can provide a subset of results fromTransfund responses. Key results would cover:• Average score “best practice” items• Average score “values” items.Key Goal 7
Local and regional authority satisfaction rating for the quality ofthe relationship with Transit
The Stakeholder Survey can provide results for territorial authorityrespondents, both elected and staff. Results will come from valuesratings including those for:• Innovation• Timeliness• Helpfulness• Integrity• Customer-focusKey Goal 6,7
Local and regional authority satisfaction with the state highwaynetwork
A report can be gathered from the Stakeholder Survey which askedthe “satisfaction with state highways” question.Key Goal 1,2
lwi and recognized social and environmental interest groups satisfaction rating for the quality of the relationship with Transit
The Transit Stakeholder Survey records the satisfaction rating of Iwiand recognised social and environmental interest groups satisfactionrating for the quality of the relationship with Transit. Covers same values ratings as for local authorities plus responsiveness to Iwi andthe interest groups.Key Goal 6,7
lwi and recognized social and environmental interest group satisfaction with the state highway network
The Stakeholder Survey asks the “satisfaction with state highways”question of: • lwi• Community groups/usergroups.Key Goal 1,2

Transportation Performance Measures 87
A P P E N D I X C
Measure Comment
Proportion of non-motorised road users who feel safe using statehighways (other than motorways)
No relevant data source at this stage.Key Goal 1,6
Road user satisfaction rating for the quality of the relationshipwith Transit
No relevant data source at this stage.Key Goal 6,7
Road user satisfaction with the state highway network The Road User Surveys report on this. There are target levels set for anumber of criteria. The target for each of these is 90% as set out inthe National State Highway Strategy.Key Goal 1,2
The social costs of road accidents The assessed social costs of accidents is evaluated by the use ofValue of Statistic Life (VOSL).Key Goal 1,2
Congestion through travel time delays Transit has carried out travel time surveys in Auckland and Wellington.The surveys, based on Austroads methodology, measure congestionin the morning peak,the afternoon peak, and the inter-peak periods.Annual results will be compared to measure the trend in congestion.Key Goal 1,2
Percentage forecast and actual annual dollar variance againstState Highway Maintenance and Improvement programme
Currently reported under Output Class 1 and Output Class 2.Key Goal 1,2
The variance between the funding allocation for state highways inthe current year and the 10-year forecast for the asset management and capital forward works programmes
Work has to be done in the current year to refine this measure butessentially it will aim to show both if there is a gap between availablefunding and identified need, and the accuracy of forecasting.The initital report may cover a five-year forecast.Key Goal 4

88
A P P E N D I X C
Performance Measures by Key Goals (continued)
Key: Environmental Social Economic
Measure Comment
The number of projects where the benefits and/or costs havechanged sufficiently from those forecast at the conclusion of theInvestigation & Reporting Phase to result in them being halted orsignificantly delayed
Unanticipated costs, or an over-estimation of benefits may be identified at either the design or construction stages.Key Goal 1
The percentage of capital projects delivered on time,within budget
This applies to projects to be completed in the current year.Projects will be split by value for reporting purposes.A target of 95% has been set.Key Goal 1
Percentage of state highway network complying with agreed levelsof service and standards for road condition and geometry (i.e. up to design standards)
There are different targets set for the agreed level of service for therange of road conditions. These are:• Roughness
—by smoothness—by smooth travel exposure
• Rutting• Skid resistance
—good skid exposure• Texture Key Goal 1,2
The percentage of emergencies on highways having single-laneaccess restored within 12 hours after the substantial end of the event
Transit currently has a target for this of 95%. The goal is to movetowards showing the total lane kilometre closures for periods greaterthan 12 hours due to an event.Key Goal 2
The proportion of the assessed media coverage that is positive Transit currently measures media coverage and categorises articlesinto positive, balanced and negative.Key Goal 6
Description of significant social and environmental achievements They are likely to cover issues such as special protection of fauna,e.g., building fish passages, and significant social gains such ashanding back land to the community, the donation of trees fromacquired land and awards for Transit projects and programmes.Key Goal 3
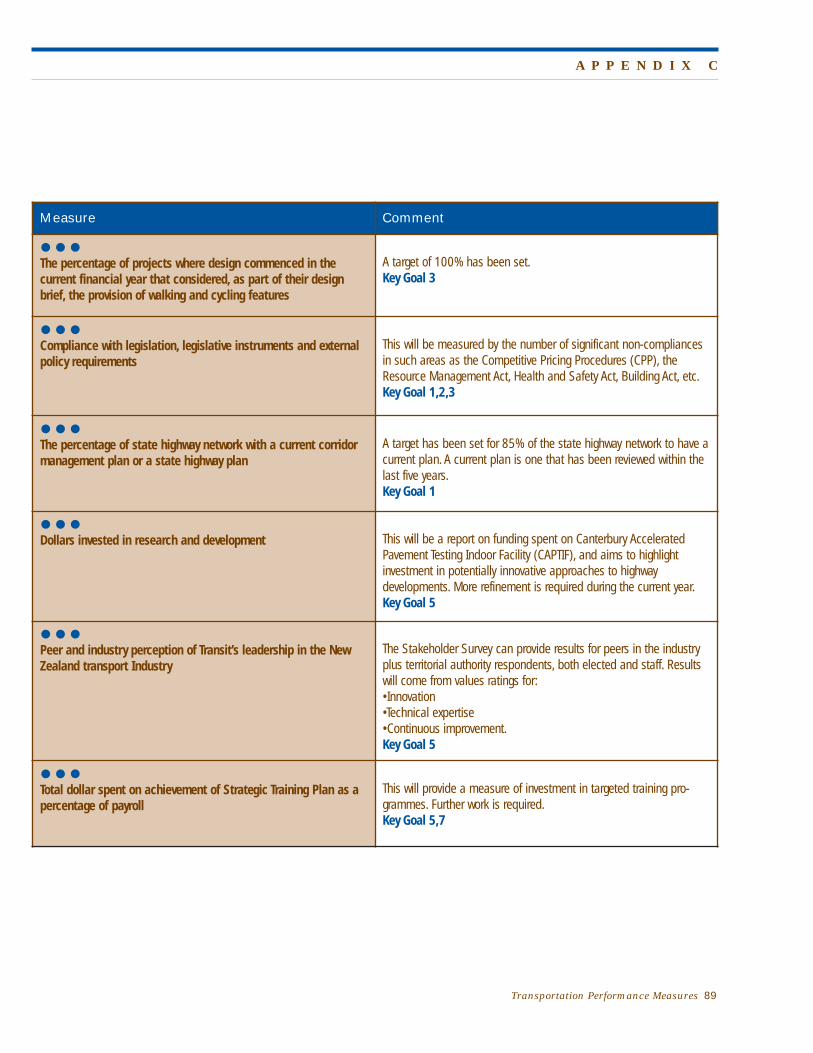
Transportation Performance Measures 89
A P P E N D I X C
Measure Comment
The percentage of projects where design commenced in the current financial year that considered, as part of their designbrief, the provision of walking and cycling features
A target of 100% has been set.Key Goal 3
Compliance with legislation, legislative instruments and externalpolicy requirements
This will be measured by the number of significant non-compliancesin such areas as the Competitive Pricing Procedures (CPP), theResource Management Act, Health and Safety Act, Building Act, etc.Key Goal 1,2,3
The percentage of state highway network with a current corridormanagement plan or a state highway plan
A target has been set for 85% of the state highway network to have acurrent plan. A current plan is one that has been reviewed within thelast five years.Key Goal 1
Dollars invested in research and development This will be a report on funding spent on Canterbury AcceleratedPavement Testing Indoor Facility (CAPTIF), and aims to highlightinvestment in potentially innovative approaches to highway developments. More refinement is required during the current year.Key Goal 5
Peer and industry perception of Transit’s leadership in the NewZealand transport Industry
The Stakeholder Survey can provide results for peers in the industryplus territorial authority respondents, both elected and staff. Resultswill come from values ratings for:• Innovation• Technical expertise• Continuous improvement.Key Goal 5
Total dollar spent on achievement of Strategic Training Plan as apercentage of payroll
This will provide a measure of investment in targeted training pro-grammes. Further work is required.Key Goal 5,7

90
A P P E N D I X C
Performance Measures by Key Goals (continued)
Key: Environmental Social Economic
Measure Comment
Achievement of the Strategic Training Plan measured through theimplementation of individual employee-agreed training plans
This will enable the success of individual training programs to bemeasured against the Strategic Training Programme.Further work is required.Key Goal 5,7
Staff satisfaction rating with Transit as an innovator and goodemployer
Staff satisfaction survey include some performance items and ratingsscales from the Stakeholder Survey, for comparability. Areas coveredinclude:• Innovation, and• Business practices and ethics.Key Goal 5,7
Staff satisfaction with Transit as a fiscally, socially and environmentally responsible organization
Staff surveys are carried out annually. Surveys include some performance items and ratings from the Stakeholder Survey for com-parability.Key Goal 1,2,3

Office of International ProgramsFHWA/US DOT (HPIP)400 Seventh Street, SWWashington, DC 20590
Tel: (202) 366-9636Fax: (202) 366-9626
Publication No. FHWA-PL-05-001HPIP/11-04(3M)EW