november 1, 2017 2017 pers ual task force final … task...november 1, 2017 the honorable kate brown...
TRANSCRIPT
November 1, 2017
2017 PERS UAL TASk FoRcE FinAL REPoRT
State of oregon


november 1, 2017
The honorable Kate Brown Governor of Oregon 900 court Street Suite 254 Salem, OR 97301-4047
Dear Governor,
Enclosed is the final report of the PERS UAL Task Force. We appreciate the opportunity to be of service as you lead Oregon’s response to this challenge.
Like many public and private pension systems around the world, Oregon’s public-sector pension plan, PERS, faces an unfunded actuarial liability, or UAL. You charged our Task Force with identifying options to generate additional funding to reduce the PERS UAL by up to $5 billion over the next five years. In the report and appendices that follow, we have identified a number of options for your consideration. For some options, we were able to obtain rough estimates of the funding that might be available to reduce the PERS UAL over the next five years; these estimates totaled $4.2 - $6.4 billion. Implementing the unquantified options could provide additional funds. We also believe even greater PERS UAL reductions could be achieved by applying some of these resources to an Employer Incentive Fund, offering a partial match for incremental funding by PERS employers. If we assume the State established a $500 million - $1 billion incentive fund, offering a 25% match, and other PERS employers identified qualifying side account funding to fully utilize the program, an additional $2 - $4 billion of PERS reductions are possible.
It’s important to note that these estimates are intended simply to provide an order of magnitude for the PERS funding opportunities that might be available from various policy options. In most cases, these estimates were prepared by the affected agencies using readily available information. We have not attempted to independently confirm these estimates, and in most case, have not included costs of implementation or collateral financial impacts on public or private entities. Some options may overlap or be mutually exclusive to implement.
We did not endeavor to reach a consensus recommendation, but have included in our report those options we judged were not unreasonable public policy, likely could be implemented and might deliver a material reduction in the PERS UAL over the next five years. In our detailed description of each option, presented in the appendices, we also outlined key considerations.
GOVERNOR KATE BROWNPERS UAL TASK FORCE

PERS UAL Task Force Letter Page 2 description of each option, presented in the appendices, we also outlined key considerations. These were not intended to be exhaustive, but only to highlight some of the more significant non-financial implications of implementing the option. Generating additional funds to reduce the PERS UAL would benefit many Oregonians, by reducing ongoing PERS costs and protecting critical public services. However, we recognize that implementing these options might also have negative implications for some in the State. Significant additional analysis will be required to fully assess the potential financial and non-financial impacts of each option, and translate these high-level concepts into specific policy proposals and implementation plans.
The pros and cons of each option may be difficult to quantify, and the current political climate often does not facilitate a dispassionate assessment of policies that provide general benefits to many constituencies, but specific discomfort to a few. To achieve the best outcome for the citizens of Oregon, we must challenge ourselves to objectively assess the facts, and then weigh the benefits and costs of acting on these options against the expected downsides of inaction.
In closing, we wish to thank the many people across Oregon who assisted us in this work. Although some of the options we discussed were uncomfortable for them to contemplate, they gave generously of their time, addressing our questions with patience and candor. We were once again reminded how fortunate we are to live in this State.
Very truly yours,
Donald Blair Monica Enand Lawrence Furnstahl
Bob Livingston Rick Miller Cory Streisinger
Charles Wilhoite
These were not intended to be exhaustive, but only to highlight some of the more significant non-financial implications of implementing the option. Generating additional funds to reduce the PERS UAL would benefit many Oregonians, by reducing ongoing PERS costs and protecting critical public services. However, we recognize that implementing these options might also have negative implications for some in the State. Significant additional analysis will be required to fully assess the potential financial and non-financial impacts of each option, and translate these high-level concepts into specific policy proposals and implementation plans.
The pros and cons of each option may be difficult to quantify, and the current political climate often does not facilitate a dispassionate assessment of policies that provide general benefits to many constituencies, but specific discomfort to a few. To achieve the best outcome for the citizens of Oregon, we must challenge ourselves to objectively assess the facts, and then weigh the benefits and costs of acting on these options against the expected downsides of inaction.
In closing, we wish to thank the many people across Oregon who assisted us in this work. Although some of the options we discussed were uncomfortable for them to contemplate, they gave generously of their time, addressing our questions with patience and candor. We were once again reminded how fortunate we are to live in this State.
Very truly yours,
Donald Blair Monica Enand Lawrence Furnstahl
Bob Livingston Rick Miller Cory Streisinger
Charles Wilhoite

Introduction ......................................................................................................................................1Charge ..............................................................................................................................................1What is the PerS UaL? .....................................................................................................................1the Work of the task force .............................................................................................................6options for action ............................................................................................................................7reach and Scope of State action ................................................................................................7State funding options .....................................................................................................................7
reduce excess risk Capital across State-Controlled entities ...............................................7
Create a new PerS Investment fund for non-State employers ...........................................7
SaIf Corporation ........................................................................................................................8
Harvest one-time “Windfall” Income .....................................................................................8
Unclaimed Property ..................................................................................................................9
reduce agency reserve funds ..............................................................................................10
Increase State alcohol revenues ............................................................................................10
Privatize Public Universities ........................................................................................................11
Maximize financial Value of real Property assets .................................................................12
natural resources......................................................................................................................12
Increased Lottery revenue ......................................................................................................13
rainy Day fund ..........................................................................................................................13
PerS resolution Program .................................................................................................................14other Concepts ...............................................................................................................................15Summary ...........................................................................................................................................17appendices ......................................................................................................................................18appendix 1 .......................................................................................................................................19Menu of Potential Sources of Capital for UaL reductionappendix 2 ......................................................................................................................................21Policy option: reduce excess risk Capital across State-Controlled entitiesappendix 3 .......................................................................................................................................23Policy option: SaIfappendix 4 .......................................................................................................................................27Policy option: Capital gains taxesappendix 5 ......................................................................................................................................28Policy option: estate taxesappendix 6 ......................................................................................................................................29Policy option: Lawsuit Settlements/Windfall Incomeappendix 7a .....................................................................................................................................30Policy option: May rebalanceappendix 7b .....................................................................................................................................31Policy option: re-allocation of K-12 Unexpended Budget to PerS UaL
TAbLE oF conTEnTS
appendix 8a ....................................................................................................................................32Policy option: Increased Collection of State Debtappendix 8b ....................................................................................................................................33Policy option: enhanced Debt Collection for Citiesappendix 9 ......................................................................................................................................34Policy option: repossessed or foreclosed Propertiesappendix 10 .....................................................................................................................................35Policy option: Common School fund - Unclaimed Propertyappendix 11 ....................................................................................................................................36Policy option: agency reserve fundsappendix 12a ...................................................................................................................................37Policy option: State alcohol revenuesappendix 12b ..................................................................................................................................40Policy option: Liquor Surchargeappendix 13 ....................................................................................................................................41Policy option: University Privatizationappendix 14 .....................................................................................................................................44Policy Option: Portland State Office Building appendix 15a ...................................................................................................................................45Policy option: Vacant Land/facilitiesappendix 15b ..................................................................................................................................47Policy option: transfer K-12 Surplus/non-operating assetsappendix 16 ....................................................................................................................................48Policy option: Monetize Port of Portland Surplus assetsappendix 17a ..................................................................................................................................49Policy option: Common School fund - State Landsappendix 17b ..................................................................................................................................50Policy option: timber revenue under good neighbor Programappendix 18 ....................................................................................................................................51Policy option: fire Suppression Costsappendix 19 ....................................................................................................................................52Policy option: Water rightsappendix 20 ....................................................................................................................................53Policy option: Increased Lottery revenueappendix 21 ....................................................................................................................................54Policy option: rainy Day fundsappendix 22 ....................................................................................................................................55Policy option: Surcharge on Licenses, Permits and other fees appendix 23 ....................................................................................................................................56Policy option: enterprise Zonesappendix 24 ....................................................................................................................................57Policy option: tech transfer Participation

PERS UAL TASk FoRcE FinAL REPoRT 1
inTRodUcTion
ChargeThe PERS UAL Task Force was convened by Governor Kate Brown to identify opportunities to pay up to an additional $5 billion of the Public Employee Retirement System’s Unfunded Actuarial Liability over the next five years. Specifically, the Governor asked the Task Force to consider (1) assets that could be monetized, (2) one-time funding streams that could be redirected, (3) capital from other accounts that could be invested or loaned, and (4) ways to leverage similar funds from other PERS employers. Our direction was to be comprehensive and creative, leaving “no idea unexamined and no rock unturned. Include ideas that are controversial, difficult, or will ultimately be rejected, rather than risk overlooking an opportunity.” The Governor also directed us not to consider changes to benefit levels, rates of return, or specific investments.
What is the PERS UAL?The Oregon Public Employee Retirement System (PERS) is the primary retirement system for public sector workers in Oregon. Public sector entities participating in PERS include state agencies, public corporations, school districts, community colleges, public universities, cities, counties, and a variety of fire and utility districts. The report refers to this group as “PERS employers.” PERS affects millions of Oregonians, including current and former public employees and their families, as well as constituents of PERS employers.
Every pay period, PERS employers and employees make contributions to PERS. PERS invests these funds and holds them in trust until employees begin receiving benefit payments. Employer contributions are often referred to both in terms of dollars and as a percentage of salary. Employee contributions are generally referred to as a percentage of salary.
The value of liabilities for future benefits to be paid and the assets held by PERS fluctuate over time. A PERS retiree’s monthly pension benefit is set upon retirement, but the total value of their retirement benefits depends on factors such as inflation and corresponding cost of living adjustments, how long they live, and whether they have a beneficiary. Assets held by PERS are invested in stocks, bonds and other assets; their value is expected to grow over time, but the rate of growth is dependent on the broader investment market. Therefore, the liability for amounts to be paid to retirees and the assets that will be available to meet those future liabilities are uncertain, and must be estimated by actuaries.
Currently, there is a shortfall between the funds actuaries expect PERS will pay to retirees and the assets that they project to be available to pay these obligations. This shortfall is called the Unfunded Actuarial Liability (UAL).
The actuaries determine the UAL at the end of each calendar year. As of December 31, 2016, that shortfall

2 PERS UAL TASk FoRcE FinAL REPoRT
was $19.9 billion, almost the size of the biennial state General Fund budget or about $5,000 per Oregonian. The shortfall is calculated after deducting advance deposits, called side accounts, which some employers have made to offset future contributions. At the end of last year, side accounts totaled $5.4 billion.
At the end of 2016, the PERS liability was estimated to be 75% funded (including side accounts). Put differently, actuaries currently estimate that PERS lacks about 25% of the funds needed to pay the projected benefits employees have already earned.
The total PERS liability represents the present value of the benefits owed by over 900 PERS employers, including the state of Oregon, both to employees who have already retired and the benefits accumulated by those who are still working. Although PERS is administered by a state agency, each PERS employer has incurred their own liabilities and nearly all PERS employers currently have a UAL. The breakdown of the UAL by employer type is as follows:
• State Agencies and Universities: 28%1
• Community Colleges: 3%
• Cities: 13%
• Counties: 13%
• Special Districts: 9%2
• School Districts: 34%
Financial markets can be volatile and investment returns rise and fall. Over the last 40 years, the S&P 500 index has been up as much as 20%, and down as much as -39% in any one year, with annual gains averaging about 10%. This financial market volatility changes the funded status of PERS from year to year. Over the fifteen year period from 2000 to 2014, the system ranged from 82% funded to over 111% funded.
1 State Agencies and Universities have a single PERS account, however we know that Universities made up 25.15% of the PERS-subject state payroll in 2015, and can therefore extrapolate that the 28% of the UAL held by state Agencies and Universities can roughly be attributed at a rate of 21% to the state and 7% to Universities.
2 The Oregon Health and Sciences University (OHSU) is listed with Special Districts on PERS payroll calculations, not with state Agencies and Universities.
As a retirement system matures it has more liabilities and assets, so losses can be larger. In recent years, the UAL has grown consistently, both in absolute dollars and as a percentage of the total liability.
Unfunded Actuarial Liability status, 2000-2015
Valuation2
DateWith Side Accounts(starting in 2002)UAL ($M) Funded Ratio (%)
2000 1,545 96.42001 -2,031 105.42002 3,204 92.02003 1,751 96.12004 2,122 95.62005 -1,751 104.02006 -5,019 109.72007 -6,120 111.52008 10,998 80.02009 8,108 86.02010 7,700 87.02011 11,030 82.02012 5,600 91.0 2013 2,600 96.02014 12,100 84.02015 16,200 79.0
Source: PERS
During the late 1980s and 1990s, investment markets boomed, delivering returns well above expectations and dramatically increasing PERS assets. Normally, this would increase the system’s funded status. however, a portion of these excess earnings were credited to employee retirement accounts, significantly increasing liabilities. This dynamic was recognized in the late 1990s, and the method of calculating benefits changed. But the combination of the increased “legacy” liabilities, and financial market downturns (such as the “dot-com Crash” of 2000, and the “Great Recession” of 2008 – 10) created a large funding shortfall or UAL. Employer rates have increased to make up that difference.
The largest component of the system’s total liability is for benefits owed to employees who were hired before 1996. In 1995 and again in 2003, the Oregon Legisla-ture changed the PERS benefit structure significantly, creating different “tiers” of retirement benefits. Pub-

PERS UAL TASk FoRcE FinAL REPoRT 3
lic employees hired before January 1, 1996, receive Tier One benefits when they retire. Those hired be-tween January 1, 1996, and August 28, 2003, receive Tier Two benefits, and those hired after August 28, 2003, receive Oregon Public Service Retirement Plan (OPSRP) benefits when they retire. It is largely those Tier One employees who retired in the 1990s and early 2000s whose benefits are driving the UAL.
UAL by Tier level and Retirees
TIER ONE 16 %
RETIREES64%
TIER TWO 9%
OPSRP 5%
INACTIVES 6%
UAL by Tier level and Retirees
Source: PERS
The PERS Board’s policy is to eliminate the UAL and fully fund PERS by increasing employer contributions to the PERS fund over the next 20 years to close the gap. This is referred to as 20 year UAL amortization. Conversely, when PERS is fully funded, the policy is to hold or lower employer rates, thus maintaining a system that is as close as possible to 100% funded at any given time and with a plan to reach full funding within 20 years when funding is less than 100%.
Because the UAL is not a fixed number, the employer contribution rate needed to fund it over time fluctuates. Three key factors affect the PERS contribution rates paid by employers: (1) differences between the actual and assumed investment rates of return today, (2) changes in assumed investment rates of return for the future, and (3) policy decisions made by the PERS Board, like the rate collar.
When the actual investment rate of return for the current year is above the assumed rate, assets grow faster than projected and the UAL shrinks. When the
actual investment rate of return is below the assumed rate, the UAL grows.
Similarly, raising the assumed future investment rate of return increases the assets that are expected to be available to pay benefits, reducing the calculation of the UAL. Lowering the assumed future investment rate of return decreases projected assets, increasing the calculation of the UAL. The PERS Board sets the assumed future rate of return every two years and recently lowered the assumption from 7.5% to 7.2%. This change increased the calculation of the UAL by $2.3 billion in the 2016 valuation.
PERS Board Rates of Return, 2007-2018
Year Actual Earnings (%) Assumed Rate (%)
2007 10.22 8.02008 -27.18 8.02009 19.12 8.02010 12.44 8.02011 2.21 8.02012 14.29 8.02013 15.76 7.752014 7.29 7.752015 2.21 7.52016 6.9 7.52017 7.22018 7.2
Source: PERS
The rate collar, set by PERS Board policy, significantly impacts employer rates and the UAL. The rate collar dampens the impact of investment market volatility on employer rates by limiting, or collaring, increases and decreases in PERS contribution rates from biennium to biennium. The collar defers, but does not eliminate, the need for higher or lower employer contributions.
in recent biennia, PERS contributions have increased but the UAL has continued to grow, driven by several factors. On a number of occasions, investment returns have fallen short of the assumed rate. A recent court decision reversed much of the benefit liability reductions passed by the 2013 Oregon legislature. The rate collar has deferred some

4 PERS UAL TASk FoRcE FinAL REPoRT
increases in employer contributions. Because employer rates have been collared, most employers have paid less up front with the expectation that they will pay higher PERS rates later in the 20 year amortization period. We are beginning to reach those “later years.”
The UAL is expected to peak in 2021-23, and employer rates are expected to peak in 2029-31 when most side accounts are depleted.
If rate collars had not constrained prior year increases, average PERS employer contributions for the 2019-21 biennium (the “uncollared rate”) would have increased by 2.4 percentage points, from 29.1% to 31.5%, largely reflecting the impact of the lower assumed future investment rate of return. The (currently lower) collared rate must increase faster, by 5.3 percentage points (from 20.9% to 26.2%), because it both reflects the lowered future investment rate of return and the need for the rate to converge toward the uncollared rate.
These rate increases will undoubtedly put pressure on PERS employer budgets as well as the services public employees provide to Oregonians. PERS projects that the total payroll for PERS-covered employees in 2019-21 will be $21.9 billion, so a 5.3 percentage point increase in the PERS contribution rate is equivalent to $1.16 billion. $1.16 billion would provide about three years of state funding for the Salem-Keizer school district, or about the total 2017-19 Lottery Fund distributions.
Paying down a portion of the UAL ahead of schedule will lower the uncollared contribution rate. While collared rates will not fall until they catch up to the uncollared rate, the convergence will happen sooner, rate increases will stop more quickly, and peak contribution rates will be lower.
Although some of the options the Task Force identified may have undesirable consequences, these must be weighed against the undesirable impact on Oregonians of employer contributions continuing to increase well into the future. It is within the context
Rates by Biennia, 2003-2019
• Excludes 6% member contributions and pension obligation bond debt service payments
• Includes Tier One, Tier Two, and OPSRP
• Rates for 2005-07 and before are as of valuation date
• 2017-19Ratesreflectinvestment returns for 2014 and 2015, the Moro decision, assumed rate decrease from 7.75% to 7.5%, updated mortality assumptions, expected increase in UAL in 2014 and 2015, and all other assumption changes and actuarial experience
• Does not include RHIA/RHIPA
10.6
14.5 14.9
12.4
16.316.5
17.5
20.85
10.69.9
8.2
5.2
10.8 10.8 10.6
14.23
0
2
4
6
8
10
12
14
16
18
20
22
2003-05 2005-07 2007-09 2009-11 2011-13 2013-15 2015-17 2017-19
BASE RATES
NET RATES (INCLUDESIDE ACCOUNT OFFSETS)
PER
CEN
TAG
EO
F PA
YRO
LL
BIENNIA
• EXCLUDES 6% MEMBER CONTRIBUTIONS AND PENSION OBLIGATION BOND DEBT SERVICE PAYMENTS
• INCLUDES TIER ONE, TIER TWO, AND OPSRP • RATES FOR 2005-07 AND BEFORE ARE AS OF VALUATION DATE • 2017-19 RATES REFLECT INVESTMENT RETURNS FOR 2014 AND 2015, THE MORO
DECISION, ASSUMED RATE DECREASE FROM 7.75% TO 7.5%, UPDATED MORTALITY ASSUMPTIONS, EXPECTED INCREASE IN UAL IN 2014 AND 2015, AND ALL OTHER ASSUMPTION CHANGES AND ACTUARIAL EXPERIENCE
• DOES NOT INCLUDE RHIA/RHIPA
Source: PERS

PERS UAL TASk FoRcE FinAL REPoRT 5
Projected System-Wide Employer Payroll and Collared Net Contributions
Projected Net Contribution
2015‐17 2017‐19 2019‐21 2021‐23 2023‐25 2025‐27 2027‐29 2029‐31 2031‐33 2033‐35 2035‐37
State Agencies $575 $835 $1,219 $1,741 $1,946 $2,124 $2,259 $2,938 $3,089 $3,226 $2,762School Districts $575 $910 $1,328 $1,897 $2,121 $2,315 $2,461 $3,202 $3,366 $3,515 $3,010All Others $875 $1,165 $1,595 $2,279 $2,548 $2,781 $2,957 $3,846 $4,043 $4,222 $3,615
Total $2,025 $2,910 $4,142 $5,917 $6,615 $7,220 $7,677 $9,986 $10,498 $10,963 $9,387
Difference from previous biennium $885 $1,232 $1,775 $698 $605 $457 $2,309 $512 $465 ‐$1,576
$19,090$20,460
$21,917
$23,478
$25,151
$26,942
$28,861
$30,916
$33,118
$35,477
$38,004
$2,025$2,910
$4,142
$5,917$6,615
$7,220 $7,677
$9,986 $10,498 $10,963
$9,387
$0
$5,000
$10,000
$15,000
$20,000
$25,000
$30,000
$35,000
$40,000
2015‐17 2017‐19 2019‐21 2021‐23 2023‐25 2025‐27 2027‐29 2029‐31 2031‐33 2033‐35 2035‐37
$ in Billions
Biennia
Projected System Wide Employer Payroll and Collared Net Contributions
Projected Payroll
Projected Collared NetContributions
Projected Payroll is based on2015‐17 experience increased 3.5% per year (current actuarial assumption).
Collared net contributions are from the 50th percentile of Milliman's November 2016 PERS Board financial modeling presentation. Amounts shown exclude contributions to the IAP, RHIA and RHIPA programs, and debt service payments on pension obligation bonds.
Contributions increase so much in the 2029‐31 biennium because employer side account offsets cease as the scheduled amortization period expires.
• Projected Payroll is based on 2015-17 experience increased 3.5% per year (current actuarial assumption).
• Collared net contributions are from the 50th percentile ofMilliman’sNovember2016PERSBoardfinancialmodeling presentation. Amounts shown exclude contributions to the IAP, RHIA and RHIPA programs, and debt service payments on pension obligation bonds.
• Contributions increase so much in the 2029-31 biennium because employer side account offsets cease as the scheduled amortization period expires.
Projected Net Contribution
2015-2017
2017-2019
2019-2021
2021-2023
2023-2025
2025-2027
2027-2029
2029-2031
2031-2033
2033-2035
2035-2037
State Agencies $575 $835 $1,219 $1,741 $1,946 $2,124 $2,259 $2,938 $3,089 $3,226 $2,762
School Districts $575 $910 $1,328 $1,897 $2,121 $2,315 $2,461 $3,202 $3,366 $3,515 $3,010
All Others $875 $1,165 $1,595 $2,279 $2,548 $2,781 $2,957 $3,846 $4,043 $4,222 $3,615
Total $2,025 $2,910 $4,142 $5,917 $6,615 $7,220 $7,677 $9,986 $10,498 $10,963 $9,387
Difference from previous biennium
$885 $1,232 $1,775 $698 $605 $457 $2,309 $512 $465 -$1,576
Source: PERS
6 PERS UAL TASk FoRcE FinAL REPoRT
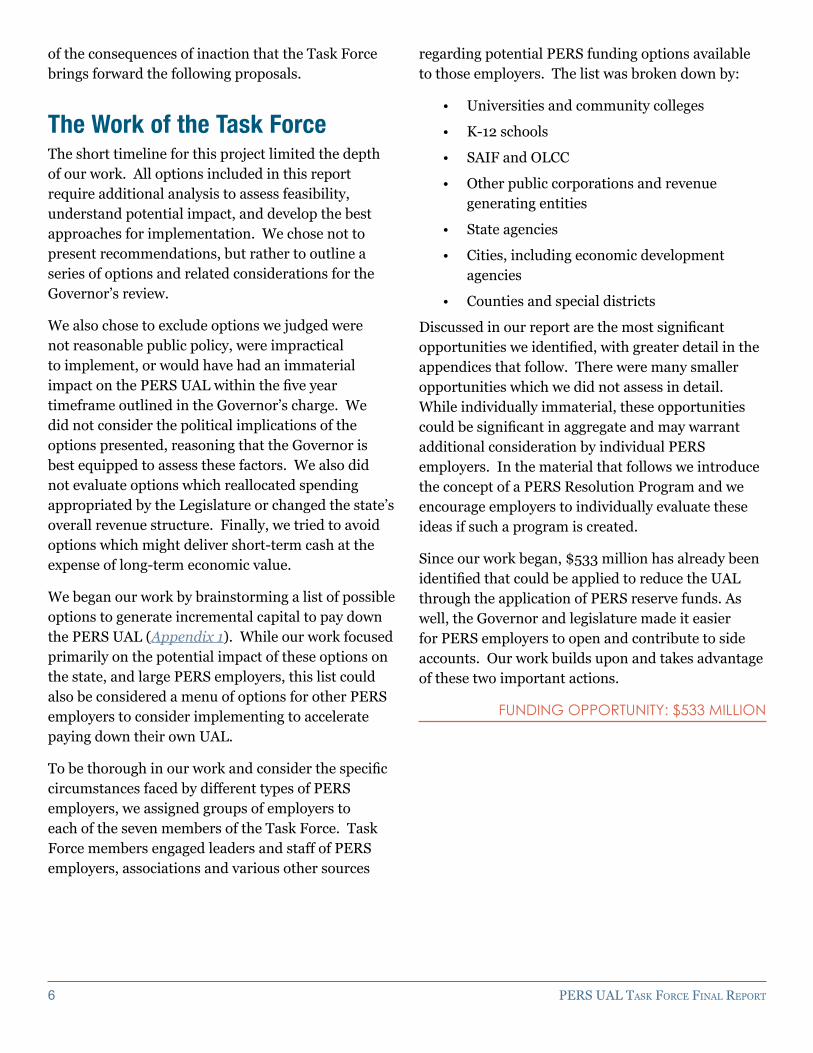
of the consequences of inaction that the Task Force brings forward the following proposals.
The Work of the Task ForceThe short timeline for this project limited the depth of our work. All options included in this report require additional analysis to assess feasibility, understand potential impact, and develop the best approaches for implementation. We chose not to present recommendations, but rather to outline a series of options and related considerations for the Governor’s review.
We also chose to exclude options we judged were not reasonable public policy, were impractical to implement, or would have had an immaterial impact on the PERS UAL within the five year timeframe outlined in the Governor’s charge. We did not consider the political implications of the options presented, reasoning that the Governor is best equipped to assess these factors. We also did not evaluate options which reallocated spending appropriated by the Legislature or changed the state’s overall revenue structure. Finally, we tried to avoid options which might deliver short-term cash at the expense of long-term economic value.
We began our work by brainstorming a list of possible options to generate incremental capital to pay down the PERS UAL (Appendix 1). While our work focused primarily on the potential impact of these options on the state, and large PERS employers, this list could also be considered a menu of options for other PERS employers to consider implementing to accelerate paying down their own UAL.
To be thorough in our work and consider the specific circumstances faced by different types of PERS employers, we assigned groups of employers to each of the seven members of the Task Force. Task Force members engaged leaders and staff of PERS employers, associations and various other sources
regarding potential PERS funding options available to those employers. The list was broken down by:
• Universities and community colleges
• K-12 schools
• SAiF and OLcc
• Other public corporations and revenue generating entities
• State agencies
• cities, including economic development agencies
• counties and special districts
Discussed in our report are the most significant opportunities we identified, with greater detail in the appendices that follow. There were many smaller opportunities which we did not assess in detail. While individually immaterial, these opportunities could be significant in aggregate and may warrant additional consideration by individual PERS employers. In the material that follows we introduce the concept of a PERS Resolution Program and we encourage employers to individually evaluate these ideas if such a program is created.
Since our work began, $533 million has already been identified that could be applied to reduce the UAL through the application of PERS reserve funds. As well, the Governor and legislature made it easier for PERS employers to open and contribute to side accounts. Our work builds upon and takes advantage of these two important actions.
fUnDIng oPPortUnIty: $533 MILLIon

PERS UAL TASk FoRcE FinAL REPoRT 7
oPTionS FoR AcTion
Reach and Scope of State ActionThe Governor directed us to thoroughly consider options available to the state to pay down the UAL ahead of schedule, and also to look at similar methods of repayment available to other PERS employers. It became clear to the Task Force early on in our work that the methods of repayment available to non-state PERS employers vary widely based on the employer type, size, location, and individual liability. Instead of laying out authoritative state actions which could be taken to ensure all PERS employers address their UALs, we will detail the options we believe are available to the state and other entities. We will also detail a PERS Resolution Program which could be used to leverage the participation of all PERS employers in this collective work.
State Funding Optionsreduce excess risk Capital across State-Controlled entities (Appendix 2)
Several state-controlled entities maintain substantial amounts of cash and short-term investments on their balance sheets to cushion against financial downsides and to maintain their credit ratings. This “risk capital” is rarely needed and may, in fact, never be drawn down. If this risk capital was pooled at the state level, less would be required since the possibility that all entities would need risk capital at the same time is remote. The released funds could be transferred to PERS to reduce the UAL.
To provide a pool of collective risk capital, the state could issue very long term or perpetual3, interest-bearing notes to state-controlled entities like SAiF, OHSU, and public universities, among others. These notes would be callable by the holding entities only
3 Perpetual bonds have long been issued by sovereign nations such as the United Kingdom. Oregon has not issued such notes to date, and additional research would be needed to determine whether and how this could be done.
if they experienced a level of financial distress that affected their ability to pay debt service or other legally committed obligations. All or a portion of the proceeds from these notes would be used to reduce the PERS UAL.
The notes would permit the state to use excess risk capital currently held by state-controlled entities, while the call provision would provide those entities a fully committed vehicle for regaining those resources in the event of financial distress. The call provision also transfers some risk from these state-controlled entities to the state. Interest would have to be paid on the notes, and Oregon’s credit rating and debt capacity could be affected, though the state would essentially be exchanging the liability of unfunded PERS benefits for a liability for principal on the notes that would be paid much later (if ever). While the probability of a call on these notes is low, there is a possibility of calls by multiple institutions in a broad-scale financial crisis, potentially at a time when the state would be least able to raise the capital needed to redeem the notes. The program would have to be designed carefully to ensure that the amount and structure of notes issued would not affect the regulatory compliance of state-controlled entities, deteriorate the credit worthiness or debt capacity of the state, or deteriorate the credit-worthiness of state-controlled entities.
fUnDIng oPPortUnIty: $750 MILLIon – 1.5 BILLIon
Create a new PerS Investment fund for non-State employers
PERS employers not controlled by the state, such as cities, counties and school districts, also maintain excess cash on their balance sheets. The state Treasurer could create a pooled investment fund separate from current investment funds that would have a longer maturity, but higher return, than the short-term investments these employers often use for investing excess cash. Investment returns on the

8 PERS UAL TASk FoRcE FinAL REPoRT
funds invested by these employers would be credited against their own PERS liability.
This limited but more independent approach, as opposed to the joint strategy proposed (above) for state-controlled entities, is more appropriate for these more independent and smaller entities.
Some entities may not have sufficient liquid assets to commit cash to a longer-maturity instrument. Additionally, these smaller-value investments would have an administrative cost. If too few employers participated, the funds raised might not be material and too small to justify the administrative burden.
fUnDIng oPPortUnIty: UnKnoWn
SaIf Corporation (Appendix 3)
Oregon has a hybrid workers’ compensation system, with coverage provided by: SAIF Corporation (formerly the State Accident Insurance Fund, also referred to simply as SAIF), a tax exempt, state controlled insurance company; for-profit (taxable) insurers; and various employer self-insurance arrangements. All these coverage models are regulated by the state. SAIF’s market share has consistently grown over the past two decades. Employers have clearly benefited from this model. SAIF has pioneered many progressive policies in the workers’ compensation market. Oregon workers’ compensation premiums have fallen twice as fast as the national average and are now 25% lower than a decade ago and among the lowest in the U.S.
nevertheless, SAiF holds a large capital surplus in excess of amounts needed to pay estimated claims to workers. Over the last seven years, SAIF’s surplus has been sufficiently significant to pay back over 30% of premiums in the form of dividends to policyholders. In 2015 and 2016, SAIF declared dividends to policyholders of $140 million and $160 million, respectively.
instead, SAiF surplus capital could be used to address the PERS UAL in several ways, which may not be mutually exclusive:
1. The state could transfer some of SAIF’s surplus capital directly to PERS, or require SAiF to invest some of its surplus capital in state notes for PERS (discussed above).
2. The state could require ongoing payments from SAiF to PERS in lieu of corporate excise taxes or allocate some or all future dividends to PERS.
3. The state could sell SAiF, either to its policyholders (“mutualization”) or to another insurer or investors and dedicate the proceeds to PERS.
No level of surplus can protect against every conceivable adverse circumstance. Nevertheless, transferring surplus from SAiF to PERS would result in an increase in risk for SAIF. Also, following a transfer of surplus from SAiF to PERS, SAiF management might elect to take certain actions to rebuild surplus to current levels. While benefits to workers are specified by state law, management actions could affect services and workers’ compensation costs to existing and prospective policyholders, including state and local government entities. A sale or mutualization of SAIF would be a complex and lengthy transaction, potentially falling outside of the five-year window set by the Governor for the Task Force’s work.
fUnDIng oPPortUnIty: $500 MILLIon PLUS
Harvest one-time “Windfall” Income
Due to their inherent uncertainty, some public sector revenues may significantly exceed anticipated or historic levels. These one-time or unanticipated amounts could be dedicated to PERS without significantly affecting ongoing public services in the near term. These revenues are by their nature difficult to calculate, however, a range of predicted impact based on past experience is included for each option.
PERS UAL TASk FoRcE FinAL REPoRT 9
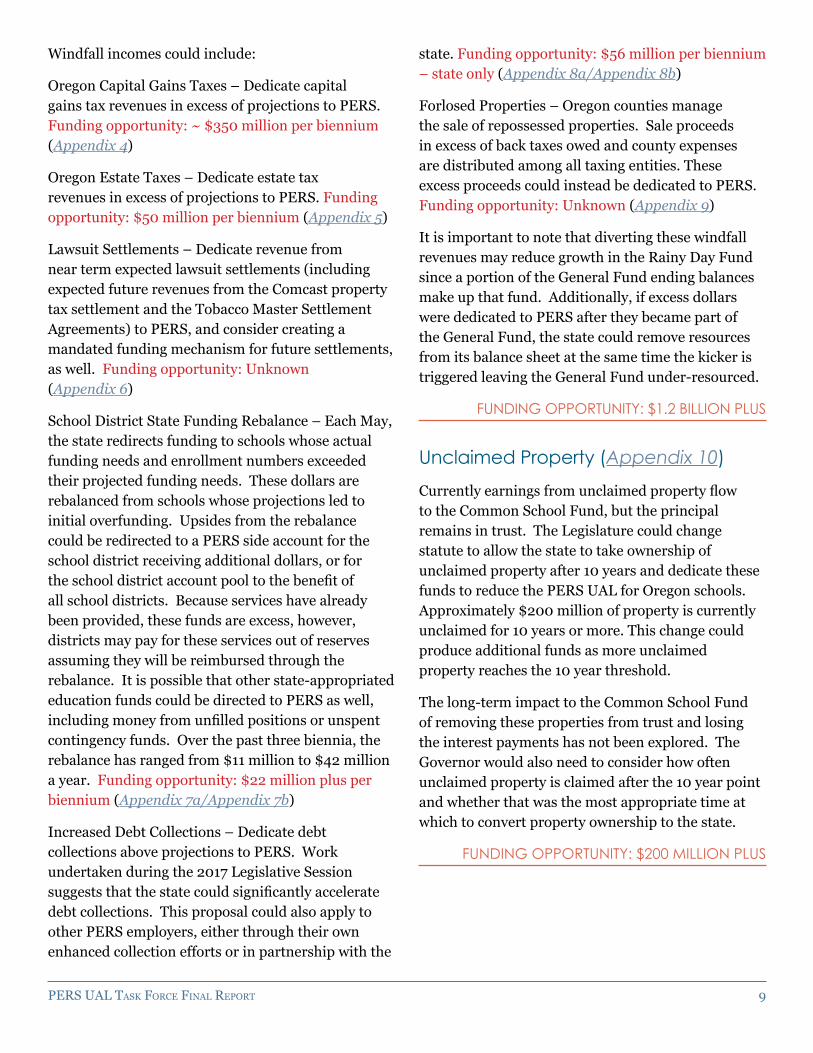
Windfall incomes could include:
Oregon Capital Gains Taxes – Dedicate capital gains tax revenues in excess of projections to PERS. Funding opportunity: ~ $350 million per biennium (Appendix 4)
Oregon Estate Taxes – Dedicate estate tax revenues in excess of projections to PERS. Funding opportunity: $50 million per biennium (Appendix 5)
Lawsuit Settlements – Dedicate revenue from near term expected lawsuit settlements (including expected future revenues from the Comcast property tax settlement and the Tobacco Master Settlement Agreements) to PERS, and consider creating a mandated funding mechanism for future settlements, as well. Funding opportunity: Unknown (Appendix 6)
School District State Funding Rebalance – Each May, the state redirects funding to schools whose actual funding needs and enrollment numbers exceeded their projected funding needs. These dollars are rebalanced from schools whose projections led to initial overfunding. Upsides from the rebalance could be redirected to a PERS side account for the school district receiving additional dollars, or for the school district account pool to the benefit of all school districts. Because services have already been provided, these funds are excess, however, districts may pay for these services out of reserves assuming they will be reimbursed through the rebalance. It is possible that other state-appropriated education funds could be directed to PERS as well, including money from unfilled positions or unspent contingency funds. Over the past three biennia, the rebalance has ranged from $11 million to $42 million a year. Funding opportunity: $22 million plus per biennium (Appendix 7a/Appendix 7b)
Increased Debt Collections – Dedicate debt collections above projections to PERS. Work undertaken during the 2017 Legislative Session suggests that the state could significantly accelerate debt collections. This proposal could also apply to other PERS employers, either through their own enhanced collection efforts or in partnership with the
state. Funding opportunity: $56 million per biennium – state only (Appendix 8a/Appendix 8b)
Forlosed Properties – Oregon counties manage the sale of repossessed properties. Sale proceeds in excess of back taxes owed and county expenses are distributed among all taxing entities. These excess proceeds could instead be dedicated to PERS. Funding opportunity: Unknown (Appendix 9)
it is important to note that diverting these windfall revenues may reduce growth in the Rainy Day Fund since a portion of the General Fund ending balances make up that fund. Additionally, if excess dollars were dedicated to PERS after they became part of the General Fund, the state could remove resources from its balance sheet at the same time the kicker is triggered leaving the General Fund under-resourced.
fUnDIng oPPortUnIty: $1.2 BILLIon PLUS
Unclaimed Property (Appendix 10)
Currently earnings from unclaimed property flow to the common School Fund, but the principal remains in trust. The Legislature could change statute to allow the state to take ownership of unclaimed property after 10 years and dedicate these funds to reduce the PERS UAL for Oregon schools. Approximately $200 million of property is currently unclaimed for 10 years or more. This change could produce additional funds as more unclaimed property reaches the 10 year threshold.
The long-term impact to the common School Fund of removing these properties from trust and losing the interest payments has not been explored. The Governor would also need to consider how often unclaimed property is claimed after the 10 year point and whether that was the most appropriate time at which to convert property ownership to the state.
fUnDIng oPPortUnIty: $200 MILLIon PLUS

10 PERS UAL TASk FoRcE FinAL REPoRT
reduce agency reserve funds (Appendix 11)
While some level of year-end agency fund balances is often required to smooth inconsistencies in the timing of revenues or cushion against shortfall, agencies may maintain fund balances above necessary levels. The Governor or the Legislature could establish fund balance targets for individual state agencies based on their specific needs and transfer excess reserves to PERS.
Over the past several biennia, the Legislature has swept funds from select agency reserves in order to support the General Fund. $111 million in sweeps were included in the 2017-19 biennial budget. Establishing a practice of sweeping ending fund balances for PERS could reduce the funds available for other purposes. Statutory or constitutional provisions may restrict some of these funds. Reserves may also include federal funds with restrictions.
fUnDIng oPPortUnIty: UnKnoWn
Increase State alcohol revenues (Appendix 12a/Appendix 12b)
In 1933, Oregon established the Oregon Liquor control commission (OLcc) to regulate alcohol industries in Oregon and directly operate wholesale and retail distribution of spirits in the state. While the OLCC manages spirit distributions at a profit and works with private retail agents to ensure they maintain profitability, profit is only one of a number of priorities that drive OLCC policy.
By implementing commercial best practices, OLCC could increase the state’s spirits revenues and dedicate the incremental funds to PERS. These practices include:
• Using OLCC’s bulk-purchasing power to drive better prices from manufacturers and distributors
• Breaking the rigid mark-up structure and establishing a demand-based retail pricing structure
• While developing a demand-driven pricing strategy, considering increasing the mark-up on spirits to generate additional revenue
• Expanding retail points of sale more rapidly
• Centralizing inventory management
• increasing marketing and promotion
The state could also consider increasing the excise beer and wine taxes and dedicating the incremental revenue to PERS. Oregon excise taxes on beer and wine are $0.08 and $0.67 per gallon, respectively. These have not changed since 1977 and are among the lowest in the nation. Presented for illustrative purposes and assuming no change in demand, increasing the current taxes to the national average rates of $0.35 and $1.03 respectively would raise $61 million per biennium.
changes in alcohol pricing and distribution could affect the amount and mix of consumption. Expanding retail outlets could increase demand and might lower profit margins for neighboring retail outlets. Additionally, Oregon has a growing alcoholic beverage industry and some changes in pricing and distribution could affect local producers and impose broader economic implications. In the context of developing evolved business approaches for OLcc, these potential implications should be analyzed and quantified to ensure that the resulting strategies strike the balance that best serves Oregonians.
fUnDIng oPPortUnIty: $453 MILLIon PLUS

PERS UAL TASk FoRcE FinAL REPoRT 11
Privatize Public Universities (Appendix 13)
Oregon has eight public universities including regional universities, research universities, and a health sciences university. Any of the research universities or the health science university could seek private backing to buy the university out of the public sphere.
The state currently provides approximately 12% of revenues, on average, for Oregon’s three research universities, but has made significant additional investments over time. These universities currently follow state policies around procurement, financial management and various operating processes, and the state oversees setting of tuition rates. Converting one or more of these universities to a private, not-for-profit entity could lead to greater operating flexibility and philanthropy over time.
A private, not-for-profit university could access the bond market to purchase assets currently owned by
the state. In addition, major philanthropy would be needed in order to create an endowment to replace state support. The state could choose to continue to fund preferential tuition rates for Oregon students, either through an endowment created with a portion of the privatization proceeds or through the continuation of existing general fund appropriations.
No philanthropic donor has been identified with the available assets and interest to undertake privatization at this time. By removing one or more institutions from shared services, costs for the remaining public universities and other state agencies might increase. The effect on tuition rates and educational access for Oregon students is also unknown.
fUnDIng oPPortUnIty: $250 MILLIon – $1.5 BILLIon
State University Assets by institution

12 PERS UAL TASk FoRcE FinAL REPoRT
Maximize financial Value of real Property assets
There are a number of real property assets held by the state which are no longer in use, or for which there may be a higher value use. The properties could be sold and net proceeds directed to paying down the PERS UAL. The Task Force did not consider ideas which do not create significant economic value, such as selling and leasing back office space at a higher cost than current operating costs.
Real property opportunities include:
The Portland State Office Building in Northeast Portland: The state could sell this 300,000 square foot building in the quickly-developing Lloyd District for an estimated value of $120 million. Leasing space in a less central but suitable location would likely increase costs, but replacing that building with two new buildings outside of the Portland core would likely yield lower operating expenses. New buildings could be constructed using the proceeds of the sale or debt financing to be repaid using the operating cost savings. Funding Opportunity: $120 million (Appendix 14)
Other State-Owned Property: The state could maximize the value of state-owned lands and property in a variety of ways. There is no single, easily-accessible database of all state-owned property. However, there are a number of properties the Task Force identified which could be sold and which have a high likelihood of realizing profits. These could be used to pay down the UAL and include (1) the recently-vacated Hillcrest Youth Correctional Facility, (2) buffer zones around the MacLaren Youth Correctional Facility, and (3) the Oregon State Hospital North Campus. The total value of sale for all three facilities, less remediation costs, would be about $8.4 million, although some of this land is leased or used by state agencies. That amount would be offset by increased annual agency costs and decreased lease revenues. This maximizing of properties could be applied to other PERS employers as well, with opportunity particularly among school districts. Funding Opportunity: $8 million plus (Appendix 15a/Appendix 15b)
Port of Portland: The Port of Portland operates three airports and numerous other transportation facilities. Some of these operations are underutilized and unprofitable. Excluding Portland International Airport, the real property held by the port has an estimated appraised value of approximately $400 million. The state could conduct a strategic evaluation of Oregon’s port and airport infrastructure requirements, identify and sell surplus property (if any), and dedicate the proceeds to PERS. Funding Opportunity: Unknown (Appendix 16)
fUnDIng oPPortUnIty: $128 MILLIon PLUS
natural resources
timber (Appendix 17a/Appendix 17b):The state owns a significant amount of timber land. However, the Governor’s charge specified that the Task Force should not consider the privatization of state forests and past proposals for increased logging of state forests have been controversial. Potential legal challenges could delay and significantly diminish any funding available for PERS, likely beyond the five year timeframe of the Task Force’s work.
Along with managing state forests, the Oregon Department of Forestry can undertake approved harvests on federal land under the 2016 Good neighbor Agreement between the state and the Federal Government. The state can use the revenues from the harvest to cover their costs and a percentage of the revenues are dedicated to counties. Approved harvests have not yet begun because the state has little incentive to do so, and the Federal Government is not staffed to undertake the work. The state could negotiate with the Federal Government to create a trust (similar to the common School Fund) that would be dedicated to offsetting PERS costs and funded by a portion of revenues from harvests carried out under the Good Neighbor Agreement. Funding Opportunity: At the current market rate, harvests would generate up to $15 million.

PERS UAL TASk FoRcE FinAL REPoRT 13
fire Suppression Costs:Fire suppression costs are split through a complicated formula between the state and private and other public landowners, and are offset by a varying level of federal reimbursement. Currently, private landowners’ share of costs is capped and the state General Fund picks up any additional costs. That cap could be increased and the additional General Fund dollars dedicated to PERS. This could generate between $10-50 million a year (Appendix 18)
Water: All water in the state belongs to the public. With a few exceptions, those seeking water rights must obtain those rights from the state. Once a water right is obtained, it is generally held in perpetuity (though it is subject to earlier-granted rights and can be forfeited if not used). When the state issues a water right, it charges a one-time transaction fee for the issuance of the right, which generally covers 50% of administrative costs. When issuing future water rights, the state could levy a one-time fee based on the market value of the water right granted. in an average year, this could raise approximately $53 million. (Appendix 19)
fUnDIng oPPortUnIty: $330-$530 MILLIon PLUS
Increased Lottery revenue (Appendix 20)
The Oregon Lottery is currently considering options to expand the types of games offered. The expansion could include different game platforms, or new types of games or retailers. Assuming the Lottery commission continues to support this direction, the Lottery expects to begin offering new options as soon as fall 2018.
A Lottery expansion will likely lead to increased revenue. A portion of revenues above a baseline could be dedicated to the PERS UAL.
There are constitutional restrictions on the uses of Lottery revenue, and dedicating revenues to PERS
would have to be weighed against the other uses to which Lottery funds are currently designated. At a minimum, it would likely be constitutional to use these funds for school districts’ UALs. As much as $35 million could be available in the first year, with increases expected each subsequent year.
fUnDIng oPPortUnIty: $175 MILLIon PLUS
rainy Day fund (Appendix 21)
The state has two budget stabilization funds: The Education Stability Fund and the Rainy Day Fund. The Rainy Day Fund receives all revenue collected from corporate and excise taxes above 7.2%, as well as a 1% distribution from the General Fund, if the General Fund is sufficient. These funds are then available to supplement the General Fund during an economic downturn.
At the end of the 2015-17 biennium, the projected balance of the Rainy Day Fund was $389 million. if the state makes all the projected deposits for the 2017-19 biennium, this fund could grow to $635 million by the end of the current biennium. Combined with the Education Stability Fund, the state is projected to have $1.2 billion in stabilization funds at the end of this biennium.
If the state were to divert $200 million of this biennium’s projected contributions to PERS instead, there would still be over $1 billion in stabilization funds available.
During the 2001 recession, General Fund revenues dropped by $1.5 billion and they dropped by $3.6 billion in the 2009-11 biennium. Ninety-six percent of the state’s General Fund goes to education, human services, and public safety programs.
fUnDIng oPPortUnIty: $200 MILLIon
SUB-ToTAL FUNdiNg oPPoRTUNiTy: $4.2 – $6.4 BiLLioN

14 PERS UAL TASk FoRcE FinAL REPoRT
PERS Resolution ProgramPERS is a single pension system, but it represents over 900 PERS employers. While the state has a great deal of influence on public entities in Oregon, and provides significant amounts of funding to many PERS employers, it does not control local budgets. Resolving the PERS UAL issue will require a dedicated effort by the state and all PERS employers. Because every PERS employer is unique, representing different constituencies and facing different conditions, uniform solutions are impractical. Engaging each employer in a collaborative approach and providing incentives allows them to develop and implement plans that reflect local priorities and are responsive to their constituents.
Under a PERS Resolution Program, PERS employers would work cooperatively with the state to develop a tailored “PERS Reduction Plan” to reach fully funded status for their PERS liability over the normal amortization period while maintaining critical services. If an employer does not take near-term actions to reduce their UAL, the PERS Reduction Plan would simply reflect the PERS’s Board strategy of amortizing the UAL over 20 years. Current projections show that this would result in sharply increased PERS expenses in each of the upcoming biennia. If employers take near-term actions to reduce their UAL, their future PERS expenses would be lower.
As an incentive to encourage PERS employers to act to reduce their UAL, the state could establish an Employer Incentive Fund, which would provide a partial match (for example, 25%) of qualifying side account contributions made or committed by PERS employers as of a certain date. The Employer Incentive Fund could be funded by one or more of the Funding Options described earlier in this report and in the following appendices. For example, if the state identified $500 million to be used for this purpose, and these funds were fully matched by PERS employers on a 4:1 basis (a 25% match), this initiative could reduce the PERS UAL by an additional $2 billion.
The state might also consider further incentives for PERS employers who make additional contributions to reduce their PERS UAL. One possibility proposed to the Task Force was that local governments might have more options for paying off the UAL if the state did not preempt certain types of local taxes. While the Task Force did not explore this issue in depth and does not advocate simply raising taxes to pay down the UAL, this could be a means to encourage cities and counties to participate in the work. Additionally, it has been recommended that the state increase the limit on funds local governments can invest through Treasury’s short-term investment accounts, or an intermediate-term pooled fund, if they agree to make additional near-term contributions to reduce their UAL.
Task Force members also considered whether the state should take action if PERS employers elect not to participate in a PERS Reduction Plan process. While the projected PERS cost increases would be the responsibility of these employers, there are reasons why the state might want every employer to participate. PERS is healthier, and services across the state are more stable, if we can avoid the projected peak employer contribution rates. Although the rate collar can temporarily prevent disruptions to government services or extraordinary fee escalations while actions are taken to adjust to changed circumstances, eventually the full cost of benefits must be paid. In some cases, the collar may create a disincentive to act, as it obscures the true impact of the UAL and defers difficult decisions. The Governor and the PERS Board could consider temporarily making collared rates available only to employers who develop a PERS Reduction Plan or whose Plan includes meeting specific targets for UAL reduction.
For the PERS Resolution Program to work, the state and PERS staff would need to provide information and technical support to assist PERS employers in developing their own PERS Reduction Plans. PERS employers would need to commit to sharing information and formally evaluating a menu of options to determine what opportunities may
PERS UAL TASk FoRcE FinAL REPoRT 15
exist for the employer to make incremental capital contributions to the PERS UAL.
To achieve leverage from the contributions of many PERS employers, the Employer Incentive Fund model assumes that the state is willing to apply funds provided by state entities toward the reduction of other PERS employers’ UALs. Alternatively, the state could apply funds solely to benefit state budgets by further reducing the state’s UAL, or simply by depositing the state funds into PERS, lowering all employers’ PERS contribution rates on a pro-rata basis.
The Task Force believes that all PERS employers (including those such as state agencies, SAiF and public universities considered by PERS to be part of a single state employer) should be eligible to open side accounts and participate in this program. The Task Force members discussed whether the Employer Incentive Program should prioritize funding or enhance the match for certain PERS employers based upon factors such as an explicit judgment of vulnerability or the relative importance of the services they provide, the relative size of their UAL, or their size and ability to raise additional funds. While there was agreement that the benefit to Oregonians of a given dollar amount of PERS UAL reduction might vary, there was also agreement on the value of designing a simple and equitable incentive program. Ultimately, this discussion did not result in consensus.
The Task Force acknowledges that the development of PERS Reduction Plans and the corresponding public discussions may raise the level of concern among PERS employers’ constituents surrounding the future impact of increasing PERS rates. PERS is generally a strong, stable system, but the events outlined previously in this report have led to a funding gap that is driving costs well above historic levels. By ensuring Oregonians understand the current UAL, the future implications for government services and the options for slowing the growth in employer contributions, our hope is that PERS employers will be able to gain support for making the difficult decisions needed to reduce the UAL.
Developing and monitoring PERS Repayment Plans for hundreds of small PERS employers, many with limited capabilities and resources, will require significant assistance from the state. Leveraging employer associations and sharing best practices from larger employers could help reduce this burden. While the ultimate value of this program will be dependent on the level of employer match and the total dollars deposited into the Employee Incentive Fund, the Task Force members believe this program could yield benefits that outweigh the administrative requirements of this program.
fUnDIng oPPortUnIty: $2 BILLIon PLUS
Other ConceptsThe Task Force considered other concepts that might generate additional funding for PERS, but were expected to yield relatively small amounts of revenue, deliver funds well beyond the five-year timeframe and/or face significant implementation challenges. While we did not spend significant time pursuing these concepts, they are presented here for PERS employers to consider.
University Non-Academic Operations: Universities operate facilities for both academic and non-academic purposes. Arenas, event conference centers, museums, parking and some food service could be considered non-academic operations. Ownership of some of these facilities was maintained by the state when the Universities became more independent in 2015. There may be opportunities to generate additional revenue for PERS by selling or leasing publicly-owned facilities to private operators.
Licensing Surcharges: The state and other PERS employers charge licensing fees for a variety of services. These fees could have a surcharge added to them, the proceeds of which would be directed to PERS. Many of these fees are constitutionally or legislatively restricted for specific uses (such as ODOT fees), but others may be more flexible. (Appendix 22)

16 PERS UAL TASk FoRcE FinAL REPoRT
Enterprise Zones and Urban Renewal Districts: These entities exempt businesses from some taxes in order to bring businesses to an area in need of development. But they are blunt instruments that may warrant readjustment. A number of options might be available for parsing these tax breaks out in creative ways that support the same policy goals but relieve pressure on schools, specifically. These options would have to be weighed against their policy intents and the ability to recruit businesses to these areas if the incentives were not as robust. Options include:
• Early sunsetting of enterprise zones and urban renewal districts. The additional revenue could be directed to PERS.
• Reform urban renewal districts to include tax rate reductions from other entities but not from schools (entities would pay the full tax load attributable to school districts). Schools do not receive the direct benefit from urban renewal districts’ increased commercial activity that other taxing entities do.
• have state-mandated access to data storage solutions at a discounted rate in exchange for enterprise zone benefits. (A number of large users of Enterprise Zones are data centers.) (Appendix 23)
Tech Transfer: Technologies developed by research universities may be licensed or otherwise monetized. The financial benefits of these arrangements are often split among parties including the responsible individuals, university departments, and broader institutions. The state could negotiate a partial share of the profits which would be dedicated as windfall revenue to PERS. (Appendix 24)

PERS UAL TASk FoRcE FinAL REPoRT 17
SUmmARyWhile the PERS Board is executing a plan to pay down the UAL and reach full PERS funding within 20 years, PERS contributions will continue to grow and could have a growing negative impact on program and service delivery across Oregon. Hence, we are convinced that the Governor should consider taking additional steps to reduce the UAL. Further analysis is required to determine whether these options would yield significant additional funding for PERS and represent acceptable public policies. Implementation would not be easy and there may be undesirable consequences. The pros and cons of these options must be weighed against the implications of potentially significant increases in future PERS contribution rates.
Because of limited time and information, the Task Force could not quantify the potential funding opportunity of every option presented. For the proposals where a dollar amount has been identified, the Task Force identified Funding Opportunities of $4.2 - $6.4 billion that could be available to reduce the PERS UAL within the next five years. If $500 million - $1 billion of matching funds were dedicated to the Employer Incentive Fund, and PERS employers were able to identify enough qualifying side account funding to fully utilize a 25% match, an additional $2 - $4 billion of PERS reductions are possible, though this would represent a heroic effort. Still, these efforts, along with the $533 million previously identified, would bring the total opportunity to $6.7 - 10.9 billion.
totaL fUnDIng oPPortUnIty: $4.7 - $6.9 BILLIon PLUS LoCaL
goVernMent MatCHIng fUnDS
This report concludes the work of the PERS UAL Task Force, as established by Governor Brown.
Task Force members appreciate the opportunity to weigh in on this important issue.

18 PERS UAL TASk FoRcE FinAL REPoRT
APPEndicES
appendix 1 ......................................................................19Menu of Potential Sources of Capital for UaL reduction
appendix 2 .....................................................................21Policy option: reduce excess risk Capital across State-Controlled entities
appendix 3 ......................................................................23Policy option: SaIf
appendix 4 ......................................................................27Policy option: Capital gains taxes
appendix 5 .....................................................................28Policy option: estate taxes
appendix 6 .....................................................................29Policy option: Lawsuit Settlements/Windfall Income
appendix 7a ....................................................................30Policy option: May rebalance
appendix 7b ....................................................................31Policy option: re-allocation of K-12 Unexpended Budget to PerS UaL
appendix 8a ...................................................................32Policy option: Increased Collection of State Debt
appendix 8b ...................................................................33Policy option: enhanced Debt Collection for Cities
appendix 9 .....................................................................34Policy option: repossessed or foreclosed Properties
appendix 10 ....................................................................35Policy option: Common School fund - Unclaimed Property
appendix 11 ...................................................................36Policy option: agency reserve funds
appendix 12a ..................................................................37Policy option: State alcohol revenues
appendix 12b .................................................................40Policy option: Liquor Surcharge
appendix 13 ...................................................................41Policy option: University Privatization
appendix 14 ....................................................................44Policy Option: Portland State Office Building
appendix 15a ..................................................................45Policy option: Vacant Land/facilities
appendix 15b .................................................................47Policy option: transfer K-12 Surplus/non-operating assets
appendix 16 ...................................................................48Policy option: Monetize Port of Portland Surplus assets
appendix 17a .................................................................49Policy option: Common School fund - State Lands
appendix 17b .................................................................50Policy option: timber revenue under good neighbor Program
appendix 18 ...................................................................51Policy option: fire Suppression Costs
appendix 19 ...................................................................52Policy option: Water rights
appendix 20 ...................................................................53Policy option: Increased Lottery revenue
appendix 21 ...................................................................54Policy option: rainy Day funds
appendix 22 ...................................................................55Policy option: Surcharge on Licenses, Permits and other fees
appendix 23 ...................................................................56Policy option: enterprise Zones
appendix 24 ...................................................................57Policy option: tech transfer Participation

PERS UAL TASk FoRcE FinAL REPoRT 19
APPEndix 1Menu of Potential Sources of Capital for UAL ReductionA. Real Assets (e.g., real estate, equipment)
1. Sale of unneeded assets (“redundant assets”)
2. Sale of assets used for activities that could be ended or handled differently (e.g., contracted to another entity, such as IT)
3. Sale or lease of high value assets used, but opportunities exist to substitute lower cost assets (e.g., relocation of state offices in prime commercial locations)
4. Lease of assets not currently used, but which may be needed in the future (e.g., unused land for planned school expansions)
5. Increase pricing of currently leased assets to market level pricing
B. Natural Resources (e.g., water rights, right of way) Sell, lease or grant easements(permanent or time-bound):
1. Unneeded assets
2. Assets used for activities that could be ended or handled differently (e.g., contracted to another entity)
3. High value assets used, but opportunities exist to substitute lower cost assets
4. Assets not currently used, but may be needed in the future
5. Increase pricing of currently leased assets to market level pricing
C. Enhanced Profitability/Value Capture for Revenue-Generating Activities/operations (e.g., utilities, parking)
1. Increase pricing for surcharges to market level pricing (e.g., for licenses, fees or other revenue streams)
2. Make structural changes (e.g., public private partnerships, mutualization, sale)
D. Sweep Budget Upsides
1. Revenues above budget (e.g., Kicker revenues, Capital Gains tax receipts, fees)
2. One-time revenues or cost savings (e.g., legal settlements, dividends)
3. Excess contingency funds (e.g., fund balances, insurance reserves in excess of actuarially estimated losses)
4. Cost savings versus budget from unfilled positions (net of above budget costs for temporary employees filling these roles)
20 PERS UAL TASk FoRcE FinAL REPoRT
5. Cost savings versus budget from cancelled or deferred projects
6. End of year unbudgeted upsides from allocations (e.g., May rebalance of state funding for schools)
E. New or increased taxes or fees
1. Increase rates, surcharges
2. Relax state tax pre-emptions
F. Debt Collections
1. Accelerate existing level of collections
2. Dedicate budget upsides to PERS
G. Balance Sheet Optimization
1. Sale and leaseback of assets
2. Finding balance sheet efficiency
3. Better using insurance
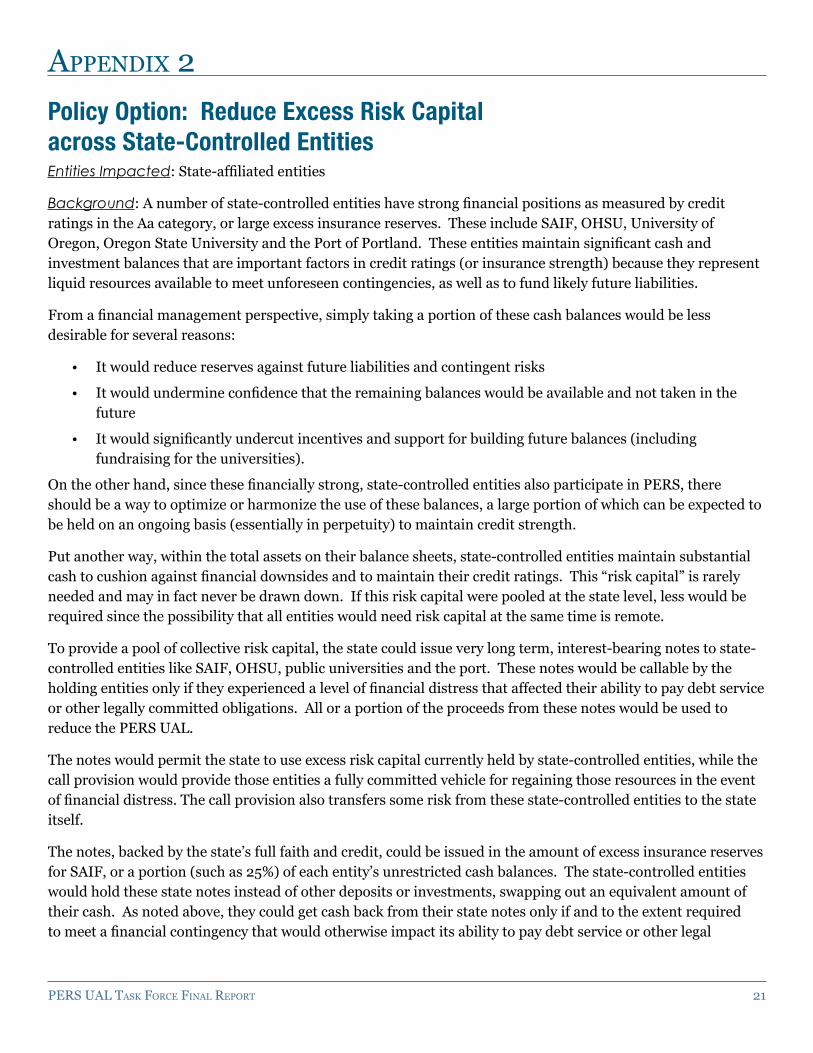
PERS UAL TASk FoRcE FinAL REPoRT 21
APPEndix 2 Policy Option: Reduce Excess Risk Capital across State-Controlled EntitiesEntities Impacted: State-affiliated entities
Background: A number of state-controlled entities have strong financial positions as measured by credit ratings in the Aa category, or large excess insurance reserves. These include SAIF, OHSU, University of Oregon, Oregon State University and the Port of Portland. These entities maintain significant cash and investment balances that are important factors in credit ratings (or insurance strength) because they represent liquid resources available to meet unforeseen contingencies, as well as to fund likely future liabilities.
From a financial management perspective, simply taking a portion of these cash balances would be less desirable for several reasons:
• it would reduce reserves against future liabilities and contingent risks
• It would undermine confidence that the remaining balances would be available and not taken in the future
• It would significantly undercut incentives and support for building future balances (including fundraising for the universities).
On the other hand, since these financially strong, state-controlled entities also participate in PERS, there should be a way to optimize or harmonize the use of these balances, a large portion of which can be expected to be held on an ongoing basis (essentially in perpetuity) to maintain credit strength.
Put another way, within the total assets on their balance sheets, state-controlled entities maintain substantial cash to cushion against financial downsides and to maintain their credit ratings. This “risk capital” is rarely needed and may in fact never be drawn down. If this risk capital were pooled at the state level, less would be required since the possibility that all entities would need risk capital at the same time is remote.
To provide a pool of collective risk capital, the state could issue very long term, interest-bearing notes to state-controlled entities like SAIF, OHSU, public universities and the port. These notes would be callable by the holding entities only if they experienced a level of financial distress that affected their ability to pay debt service or other legally committed obligations. All or a portion of the proceeds from these notes would be used to reduce the PERS UAL.
The notes would permit the state to use excess risk capital currently held by state-controlled entities, while the call provision would provide those entities a fully committed vehicle for regaining those resources in the event of financial distress. The call provision also transfers some risk from these state-controlled entities to the state itself.
The notes, backed by the state’s full faith and credit, could be issued in the amount of excess insurance reserves for SAIF, or a portion (such as 25%) of each entity’s unrestricted cash balances. The state-controlled entities would hold these state notes instead of other deposits or investments, swapping out an equivalent amount of their cash. As noted above, they could get cash back from their state notes only if and to the extent required to meet a financial contingency that would otherwise impact its ability to pay debt service or other legal

22 PERS UAL TASk FoRcE FinAL REPoRT
obligation—that is, the same event that would cause it to draw down on its cash reserves. This is somewhat analogous to a draw on a bond insurance or excess reinsurance policy.
Financial Opportunity: Using this method, the state notes could create an ongoing financing pool of approximately $750 million to $1.5 billion. This, in turn, could be used to fund a portion of the Employer Incentive Fund, multiplying the impact.
Key Considerations: Interest would have to be paid on the notes, and Oregon’s credit rating and debt capacity could be affected, though Oregon would essentially be exchanging the liability of unfunded PERS benefits for a liability for principal on the notes that would be paid much later, if ever. Sovereign credits like the United Kingdom have issued perpetual bonds, although additional study is needed to determine if the state could.
While the probability of a call on these notes is low, there is a possibility of calls by multiple institutions in a broad-scale financial crisis, potentially at a time the state would be least able to raise the capital needed to redeem the notes. The program would have to be designed carefully to ensure that the amount and structure of notes issued did not affect the regulatory compliance of state-controlled entities, deteriorate the credit worthiness or debt capacity of the state, or deteriorate the credit-worthiness of state-controlled entities to an unacceptable degree.
While the state notes are a form of borrowing, and would seem to require a constitutional amendment to authorize, they could be superior to a general pension bond issue since they would be internal to the publicly-held, state-related balance sheets of Oregon that also hold part of the PERS liability.

PERS UAL TASk FoRcE FinAL REPoRT 23
APPEndix 3Policy Option: SAIFEntities Impacted: SAIF and potentially Oregon employers who purchase workers’ compensation insurance.
Background: In some states, workers’ compensation coverage is provided exclusively by the state, while in others coverage is provided only by for-profit insurers. Oregon currently has a hybrid workers’ compensation market, where workers’ compensation insurance is provided by SAIF, by for-profit companies, and through self-insurance. While there are many workers’ compensation insurers in Oregon, SAIF has consistently gained market share. In 1997, SAIF controlled about 31% of the Oregon workers’ compensation market. Today, SAIF holds over 50% of the market. Excluding self-insured employers and the assigned risk pool (high risk employers that are “assigned” to insurers to ensure workers are covered), SAIF has roughly 70% of the “competitive” market. As the market leader, with a low cost-structure and the state tax exemption, SAIF sets the benchmark for services and pricing in the market. Workers and employers have clearly benefited from this model. SAIF has pioneered many progressive policies in the workers’ compensation market and Oregon workers’ compensation costs are among the lowest in the U.S.
Over the last 10 years, pure premiums (the cost of insurance, excluding insurance company expenses and profits) for Oregon workers’ compensation insurance have fallen twice as fast as the U.S. average (a 25% drop versus a 12% drop), and are currently seventh lowest in the U.S. Including insurance company expenses and profits, workers’ compensation premiums for Oregon employers average about 1.6% of payroll, though premium rates are significantly higher for some types of businesses (up to 30% for some high-risk employers) and lower for others. After dividends, workers’ compensation costs for SAIF policyholders are still lower. Over the last seven years, SAIF has paid out approximately $1.1 billion in dividends to insured employers, representing over 30% of the premiums collected over the same period.
Insurance companies are required to maintain capital reserves (called “surplus”) over and above the amounts projected to be needed for claims payments. Minimum surplus levels are determined by a complex formula based on the nature of the insurer’s business and investments. For each insurer, this formula calculates the Authorized Control Level - Risk Based Capital or “ACL-RBC”, the basic building block in assessing surplus levels. Under Oregon law, an insurer is required to maintain surplus of at least three times ACL-RBC. Below this level of surplus, the insurer will be closely monitored and may be placed into receivership by Oregon’s insurance regulator, the Department of Consumer and Business Services (“DCBS”).1 insurance companies must hold surplus above this level to create a cushion, guard against catastrophic events (such as financial market downturns or significant changes in claim costs), and ensure fiscal soundness. However, the determination of how much surplus is required for this purpose is highly judgmental, reflecting management’s tolerance for risk and the insurer’s business characteristics. Relative to other types of insurance, workers’ compensation claims develop over long periods. As a mono-line insurer, operating in a single state, SAIF is less diversified than many other insurers.
SAIF’s regulatory surplus requirement (three times ACL-RBC) is approximately $420 million. SAIF’s policy, based upon actuarial analysis and modeling, is to maintain a surplus of at least eight times the ACL-RBC, or
1 Two times the ACL-RBC is the “Company Action Level – Risk Based Capital” or “CAL-RBC.” OAR 836-011-0320(1)(a)(C) indicates that three times the ACL-RBC is the minimum surplus level at which the company is required to create an RBC Plan to increase surplus.

24 PERS UAL TASk FoRcE FinAL REPoRT
approximately $1.1 billion. As of June 30, 2017, SAIF held approximately $1.8 billion in surplus ($5.2 billion in investments less $3.4 billion in liabilities, including amounts actuaries estimate will be required to satisfy worker claims), or 11.7 times the ACL-RBC, roughly at the median level held by a sample of other workers’ compensation insurers. In 20 of the last 28 years, SAIF has distributed a portion of the surplus to policyholders in the form of dividends. SAIF declared dividends to policyholders of $140 million and $160 million for 2016 and 2017, respectively.
Policy options relating to SAIF include the following:
• Option 1 – Transfer to PERS the portion of SAIF surplus not required to cover claims and assure fiscal soundness.
Rationale: Under Oregon law (ORS 656.634), the state has the ability to legislatively direct the disposition of any SAIF surplus above the amount necessary to cover claims and assure the fiscal soundness of SAIF.2
Mechanism: Surplus not required within SAIF could be redeployed to PERS in two ways:
• Transfer funds directly to PERS.
• Allocate some of SAIF’s investment portfolio to Oregon state notes for PERS (see Appendix 2). This approach would provide funds to reduce the PERS UAL, but allow SAiF to maintain access to this risk capital, if needed, to address low probability, high severity events that might cause financial distress.
Financial Opportunity: Up to $670 million (DCBS estimates a range of $260 - $670 million) for direct transfer of surplus; all else being equal, a relatively larger amount could potentially be accessed using Oregon state notes for PERS.
Key Considerations
• Transferring surplus from SAIF to PERS would result in some increase in risk for SAIF.
• Following a transfer of surplus from SAiF to PERS, SAiF management could elect to take certain actions to rebuild surplus and reduce risk to current levels. While benefits to workers are specified by state law, management actions could affect services and underwriting standards, as well as premiums, discounts and/or future dividend payments to existing and prospective policyholders, including state and local government entities. It’s unclear how SAIF management might apply such actions to different groups of employers, or whether those actions would constitute a significant hardship for those employers.
• Option 2 – Change SAIF’s financial relationship with the state to produce additional revenue that could be dedicated to PERS.
Rationale: SAIF’s current non-profit business model provides quality workers’ compensation coverage for Oregon workers and minimizes workers’ compensation costs for Oregon employers. Insurance coverage is priced below cost (e.g., claims and expenses exceed premiums), and is subsidized by
2 The state has attempted to exercise this right only once, in 1982 when this statute was enacted. The Oregon Supreme Court invalidated the transfer on the ground that the statute was unconstitutional with respect to funds from insurance contracts entered into before the statute was enacted. The Court stated, however, that the transfer statute was valid as to “subsequent contracts, including renewals.” Eckles v. State of Oregon, 306 Or. 380 (1988).

PERS UAL TASk FoRcE FinAL REPoRT 25
investment returns on capital. The relatively large amount of surplus held by SAIF increases investment returns, one factor driving premium reductions and increasing dividends paid to Oregon employers.
Like other state-created entities, SAIF does not pay federal income taxes or state corporate excise taxes. This business model delivers direct financial benefits to SAIF’s policyholders. The state benefits directly as a SAIF policyholder, and indirectly from SAIF’s economic impact on other employers. SAIF’s financial relationship with the state could be modified to also include direct payments to the state, with the proceeds dedicated to PERS.
Mechanisms: There are two potential approaches to implementing this policy option:
• Require SAIF to make a payment to the state (in lieu of corporate excise taxes), and dedicate the proceeds to PERS.
• Dedicate a share of future dividends to PERS.
Financial Opportunity: ~ $0 - $150 million (~ 0 - 100% of recent dividends) per year
Key Considerations:
• A transfer of surplus as described in Option 1 above would most likely reduce the availability of funds for dividends to the state or policyholders, at least in the short-term.
• Providing a flow of funds to the state might result in an increase in workers’ compensation costs for existing SAIF policyholders and companies considering starting in or relocating to Oregon. However, as noted above, Oregon workers’ compensation costs are currently among the lowest in the U.S. and workers’ compensation coverage is a relatively small portion of overall costs for most employers.
• Option 3 – Convert SAIF to a mutual (policyholder-owned) company and dedicate proceeds to PERS.
Rationale: As noted above, the direct financial benefit of SAIF’s business model flows to the Oregon employers who obtain their workers’ compensation insurance from SAIF. This business model could be formalized by restructuring SAIF as a mutual insurance company, e.g., an insurance company owned by its policyholders.
Mechanism: SAIF’s assets are currently held in a trust fund, the Industrial Accident Fund (the “IAF”). A mutualization might be structured to transfer a portion of the IAF to the newly mutualized company in exchange for its assumption of SAIF’s liabilities, while retaining the remainder (the surplus determined not to be necessary for the ongoing fiscal soundness of SAIF, as discussed above) for PERS. Alternatively, a state entity could retain the “run-off” liability for claims already accrued, with surplus portions of the IAF transferred to PERS over time as claims are paid. The conversion would include some current and/or future payments from the new company to the state that could also be dedicated to PERS.
Financial Opportunity: Unknown

26 PERS UAL TASk FoRcE FinAL REPoRT
Key Considerations:
• Policyholders would obtain legal ownership of the newly mutualized company, with increased flexibility and independence in structuring future operations.
• Mutualization would be a complex transaction, with significant legal and financial analysis needed to negotiate the appropriate structure and address responsibility for existing liabilities.
• The Governor could retain the right to appoint a specified number of board members to ensure continuation of SAIF’s public purpose. Option 4 – Sell SAIF to another insurer or directly to investors and dedicate the proceeds to PERS.
Rationale: Although mutualization may represent a better balance of the state’s interests with respect to SAIF, another option would be to explore sale to another insurer or directly to investors. As with the mutualization option, the state might transfer a portion of the IAF to the buyer in exchange for its assumption of SAIF’s liabilities while retaining the remainder for PERS.
Mechanisms: Sale or Initial Public Offering
Financial Opportunity: Unknown
Key Considerations:
• A sale or Initial Public Offering would also be a complex transaction with significant legal and financial analysis needed to negotiate the appropriate structure and address responsibility for existing liabilities.
• If SAIF were sold to a taxable entity, the state could receive ongoing tax revenues in addition to the net sale proceeds.
• The motive for a buyer would likely be to maximize financial returns, which would likely lead to increases in workers’ compensation costs for employers, and could result in different approaches to services, claims handling and underwriting.

PERS UAL TASk FoRcE FinAL REPoRT 27
APPEndix 4Policy Option: Capital Gains TaxesEntities Impacted: Other programs receiving General Fund revenue
Description of Policy Option: The state’s receipt of tax revenue from capital gains taxes is highly variable because it is largely dependent on the decisions of high-net-worth individuals regarding when to sell capital assets. These decisions may be based on individual circumstances and may be driven by changes (or the anticipation of changes) in the federal tax code – circumstances outside the state’s control which cannot be predicted. The result can be large spikes in the state’s receipt of capital gains taxes, particularly in times of economic growth. Biennial capital gains revenue has exceeded estimates by an average of about $350 million for the last three biennia. The previous two biennia (post-recession), capital gains revenue fell significantly short of estimates.
Due to its uncertain nature, spikes in capital gains tax revenues (e.g., revenues exceeding projections, or revenues exceeding a rolling multi-year average) could be treated as windfall income and used to reduce the UAL.
Financial Opportunity: $175 million per year during times of economic growth; zero during economic downturns
Key Considerations: Capital gains taxes currently flow to the General Fund. Although they are projected separately, currently these revenues are not treated differently from other tax revenues. A mechanism for segregating excess capital gains revenues might be the sale of tax credits late in the biennium, if revenues are anticipated to exceed projections, with the sales proceeds flowing directly to the UAL. It is undetermined whether or how this would affect kicker calculations.
Status of Concept: To be evaluated

28 PERS UAL TASk FoRcE FinAL REPoRT
APPEndix 5 Policy Option: Estate TaxesEntities Impacted: Other programs receiving General Fund revenue
Description of Policy Option: The state’s receipt of estate tax revenue is highly variable. The state imposes taxes on only a small percentage of descendants’ estates – those valued at over $1 million – and the timing is, of course, inherently unpredictable. Due to its uncertain nature, spikes in estate tax revenue (e.g., amounts over a multi-year median) could be treated as windfall income and used to reduce the UAL.
Financial Opportunity: Difficult to predict; would have generated $50 million in 2015-17 based on a two-year over two-year analysis.
Key Considerations: Estate tax revenues currently flow to the General Fund. It is undetermined whether or how this proposal would affect kicker calculations.
Status of Concept: To be evaluated

PERS UAL TASk FoRcE FinAL REPoRT 29
APPEndix 6 Policy Option: Lawsuit Settlements/Windfall IncomeEntities Impacted: Agencies and programs that would otherwise receive revenue from settlements and other windfalls
Description of Policy Option: One-time or windfall revenues can come into the state budget from a variety of sources, but the largest source is generally the settlement of lawsuits filed by the state, such as the Tobacco Master Settlement Agreement, the Oracle litigation and the VW settlement. By their very nature, one-time funds are difficult to project. Over the past five biennia, the General Fund’s receipts from lawsuit settlements have varied widely: $2 million in in 2009-11, nothing in 2011-13, $5 million in 2013-15, nothing in 2015-17, and $110 million in 2017-19.
Financial Opportunity: Impossible to predict
Key Considerations:
• Legal settlements are structured through negotiation directed by the Attorney General, sometimes with court involvement. Often the terms of the settlement agreement will direct how the funds may be used. To maximize the use of settlement funds for reduction of the PERS UAL, the Attorney General would need to attempt to structure settlement agreements in a way that permits such use.
Status of Concept: Analyzed

30 PERS UAL TASk FoRcE FinAL REPoRT
APPEndix 7A
Policy Option: May RebalanceEntities Impacted: School Districts
Description of Policy Option: School funding levels from the state are set using estimates on enrollment, local funding and other factors before the school year begins. Each spring, the Oregon Department of Education (ODE) “rebalances” the distribution of state funds based on the actual numbers for the school year. Schools who were underfunded pay for additional staff needs or cover local funding shortages over the course of the year and are “reimbursed” in the spring.
These “rebalanced” funds could be dedicated to PERS.
Financial Opportunity: In recent years the rebalance has ranged from $11 million to $42 million a year.
Key Considerations: Each school budgets differently. Some draw into reserves expecting to be made whole in May. Others budget on a multi-year cycle and depend on any rebalance funds to support the additional costs in the next year. Schools could attempt to overestimate needs every year to ensure they were not on the losing end of rebalance funds.
Status of Concept: To be evaluated

PERS UAL TASk FoRcE FinAL REPoRT 31
APPEndix 7b
Policy Option: Re-allocation of K-12 Unexpended Budget to PERS UALEntities Impacted: K-12 System Members
Background: Budgeted K-12 funding that is unexpended in a biennium (e.g., unfilled positions, contingency funds, discretionary funds) potentially can be re-directed, at some level, to reduce PERS UAL. Redirecting unexpended funding to PERS UAL seemingly represents a commitment of budgeted funding to permissible purposes (e.g., historical compensation and benefits incurred by K-12 system members to meet educational objectives). Such an approach can be implemented for fixed periods and would enable K-12 system members to maintain budgets, with redirected funding discontinued, after a fixed period of time or after a certain amount of funding has been redirected to reduce PERS UAL.
Financial Opportunity: Unknown
Key Considerations:
• K-12 system members reportedly continue to be budget-constrained. (e.g., though the 2017-2019 biennium budget was increased 11% relative to the prior biennium, both PPS and Salem-Kaiser budgeted for reduced teaching positions — 55 and 67, respectively.)
• Any material level of redirected funds potentially implies inefficiencies in the K-12 budgeting/operating processes.
• Any material level of redirected funds potentially implies willingness to address historical cost/operating inefficiencies with current/prospective funding, thereby failing to address the root issue.
Next Steps:
• Analysis of historical K-12 system member budgets (for larger systems) to identify levels of potential PERS UAL funding potential relating to unexpended K-12 budget
• Development of reasonable allocation percentages for unexpended funds (e.g., not less than 10%, not more than 50%)
• Development of reasonable benefit sharing among K-12 system members based on reduction in PERS UAL attributable to unexpended funds (e.g., reduction allocated based on relative enrollment)

32 PERS UAL TASk FoRcE FinAL REPoRT
APPEndix 8A Policy Option: Increased Collection of State DebtEntities Impacted: Debts are owed to the majority of state agencies. The largest amounts of collectible debt are owed to three agencies: the Department of Revenue (primarily unpaid taxes); the Employment Department (primarily unpaid unemployment insurance and overpaid benefits); and the Judicial Department (primarily fines, fees and restitution).
Description of Policy Option: Over the last several years, the state has increased its efforts to collect liquidated and delinquent debt owed to the state. At the end of state fiscal year 2016, about $3.3 billion was owed to the state from a variety of debtors. Based on recent agency reporting, about $1.1 billion is potentially collectible.
During state fiscal year 2016, the state collected a total of $562 million of liquidated and delinquent debt owed to the state from all debtors. Of this amount, about $247 million was owed to the state General Fund. If the state were able to increase those collections by five percent in state fiscal year 2017, the increase would be $28 million in total collections and about $12 million to the General Fund. If the state were able to maintain this increased collection over 10 years, it would be an increase of $280 million total funds and $120 million to the state General Fund. Increasing collections to 10%in state fiscal year 2017 and holding the increase for a decade would increase the 10-year total to $560 million total funds and $240 million to the state General Fund. However, sustaining this level of increase in debt collections may be difficult as the easiest-to-collect debts are likely to be collected first.
Financial Opportunity: Assuming a five percent increase in collections, this option would generate $28 million in the first year. If twenty percent of the total collectible debt is collected over a ten-year period, this would result in $220 million.
Key Considerations:
• Efforts to increase collections are already under way, with an Executive Order issued by the Governor and various bills passed by the Legislature during the last session. In addition, both the Department of Administrative Services and the Department of Revenue have added staff to increase collection efforts.
• Three of the top ten agencies to which funds are owing have legal restrictions on the use of funds collected on their behalf: collections of highway funds for ODOT, inmate restitution for the Judicial Branch, and employment benefits for the Employment Department. None of these are included in the General Fund collection numbers mentioned above. Excluding them from the total funds collections drops the state fiscal year 2016 collection numbers mentioned above by about $95 million. See separate analysis regarding whether these restricted funds could be reached through setting up side accounts dedicated to the UAL associated with these agencies.
Status of Concept: Analyzed
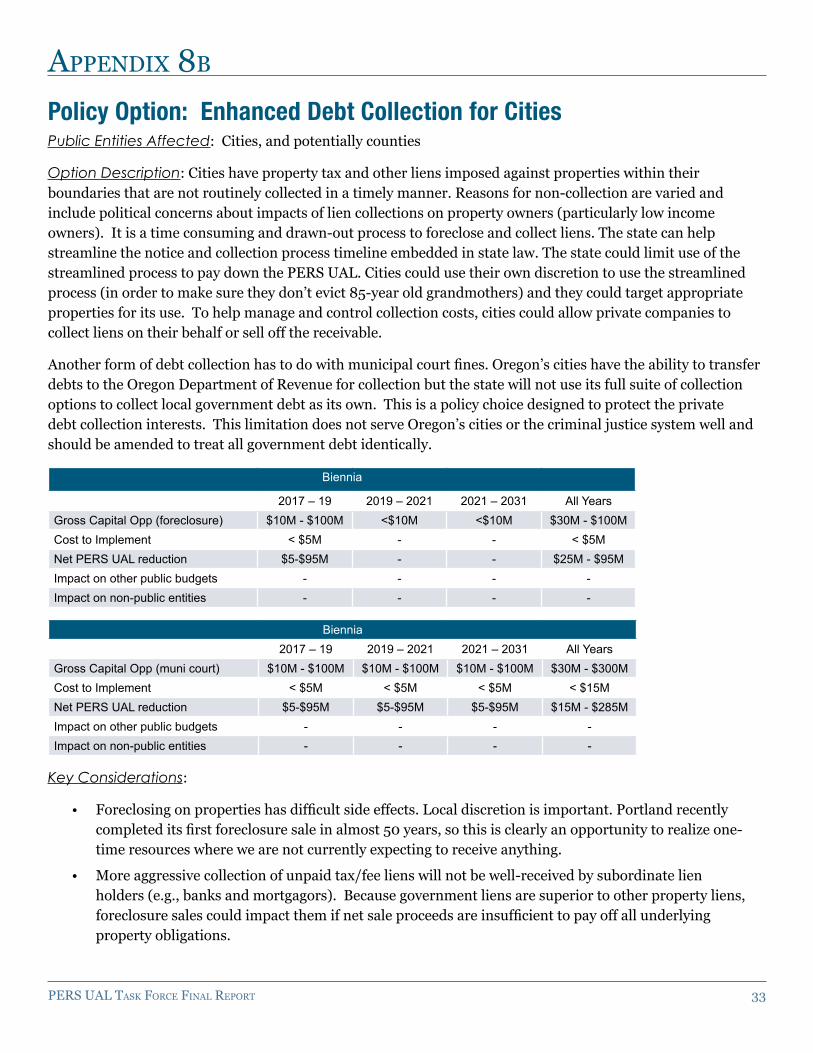
PERS UAL TASk FoRcE FinAL REPoRT 33
APPEndix 8b Policy Option: Enhanced Debt Collection for CitiesPublic Entities Affected: Cities, and potentially counties
Option Description: Cities have property tax and other liens imposed against properties within their boundaries that are not routinely collected in a timely manner. Reasons for non-collection are varied and include political concerns about impacts of lien collections on property owners (particularly low income owners). It is a time consuming and drawn-out process to foreclose and collect liens. The state can help streamline the notice and collection process timeline embedded in state law. The state could limit use of the streamlined process to pay down the PERS UAL. Cities could use their own discretion to use the streamlined process (in order to make sure they don’t evict 85-year old grandmothers) and they could target appropriate properties for its use. To help manage and control collection costs, cities could allow private companies to collect liens on their behalf or sell off the receivable.
Another form of debt collection has to do with municipal court fines. Oregon’s cities have the ability to transfer debts to the Oregon Department of Revenue for collection but the state will not use its full suite of collection options to collect local government debt as its own. This is a policy choice designed to protect the private debt collection interests. This limitation does not serve Oregon’s cities or the criminal justice system well and should be amended to treat all government debt identically.
Biennia
2017 – 19 2019 – 2021 2021 – 2031 All YearsGross Capital Opp (foreclosure) $10M - $100M <$10M <$10M $30M - $100MCost to Implement < $5M - - < $5MNet PERS UAL reduction $5-$95M - - $25M - $95MImpact on other public budgets - - - -Impact on non-public entities - - - -
Biennia 2017 – 19 2019 – 2021 2021 – 2031 All Years
Gross Capital Opp (muni court) $10M - $100M $10M - $100M $10M - $100M $30M - $300MCost to Implement < $5M < $5M < $5M < $15MNet PERS UAL reduction $5-$95M $5-$95M $5-$95M $15M - $285MImpact on other public budgets - - - -Impact on non-public entities - - - -
Key Considerations:
• Foreclosing on properties has difficult side effects. Local discretion is important. Portland recently completed its first foreclosure sale in almost 50 years, so this is clearly an opportunity to realize one-time resources where we are not currently expecting to receive anything.
• More aggressive collection of unpaid tax/fee liens will not be well-received by subordinate lien holders (e.g., banks and mortgagors). Because government liens are superior to other property liens, foreclosure sales could impact them if net sale proceeds are insufficient to pay off all underlying property obligations.
34 PERS UAL TASk FoRcE FinAL REPoRT
APPEndix 9 Policy Option: Repossessed or Foreclosed PropertiesEntities Impacted: Counties and other entities who receive property taxes
Description of Policy Option: When a property owner does not pay property taxes for a period of time, the property can be foreclosed on. Counties manage this process. When a property is repossessed and sold, counties recover the cost of administering the process and the rest of the proceeds are split among taxing entities. Rather than splitting proceeds among the taxing entities, the proceeds could be designated to PERS.
Financial Opportunity: Variable
Key Considerations: Anything which increases the incentive to foreclose on a property must be weighed against the policy value of helping an individual or businesses keep their asset. Taxing entities have lost revenue over the period of time in which the former property owner was not paying taxes and may want to realize those dollars before excess proceeds are designated to PERS, decreasing the dollars available.
Status of Concept: To be evaluated

PERS UAL TASk FoRcE FinAL REPoRT 35
APPEndix 10Policy Option: Common School Fund - Unclaimed PropertyEntities Impacted: School districts receiving funding from the Common School Fund; owners of unclaimed property
Description of Policy Option: The assets of persons who die intestate (without a will) “escheat” to the state and become part of the Common School Fund if no heirs are found after 10 years. In addition, unclaimed funds such as bank accounts and insurance proceeds are held in trust by the state and the earnings on these unclaimed funds become part of the Common School Fund. However, ownership of the unclaimed funds never transfers to the state – the funds can be claimed by their owners even many years later. These unclaimed funds currently total around $600 million, approximately $200 million of which has been unclaimed for more than 10 years. Change statute to provide that unclaimed property becomes property of the state and transfers to the UAL if not claimed after 10 years.
The Oregon constitution provides that income from the common School Fund must be “applied to the support of primary and secondary education as prescribed by law.” The Common School Fund expects annual distributions to schools equal to 4% of assets. Since 2000, distributions have ranged from a low of $13 million in 2004 to a high of $70 million in 2017. Consistent with constitutional restraints, funds transferred to the UAL would need to be applied to the support of schools, which could be accomplished through the use of side accounts for the benefit of school districts.
Financial Opportunity: $200 million, if property not claimed after 10 years is transferred to PERS.
Key Considerations: A key question would be whether transfer of funds from the Common School Fund to PERS would financially benefit schools. An analysis of this question would need to include a comparison of the earnings potential of the funds and implications for the short and long term.
Status of Concept: To be evaluated

36 PERS UAL TASk FoRcE FinAL REPoRT
APPEndix 11 Policy Option: Agency Reserve FundsEntities Impacted: Agencies that have built up ending balances or reserves, fee payers whose fees have gone into those reserves, and programs supported by the fees
Description of Policy Option: Many state agencies, particularly those dependent on revenue from sources other than the state’s General Fund, maintain reserves from the funds they collect. These funds are often statutorily dedicated for specific purposes. The size of reserves needed will vary depending on circumstances. If fees collected by regulatory agencies to support their operations come in unevenly throughout the year (due to annual license renewals, for example), reserves will vary throughout the year based on the cash flow cycle. If fee revenue is highly variable or unpredictable, reserves may be needed to smooth out inconsistencies and cushion against shortfalls. In some cases, revenue may be hard to predict and a reserve fund may build up to a higher level than anticipated or needed. Some agencies maintain formal policies governing the levels of reserves needed; others do not.
Over the past several biennia, the Legislature has “swept” funds from selected agency reserves to support the biennial budget. This practice has increased significantly over the past two biennia. Fund sweeps budgeted for the 2017-19 biennium (scheduled to occur in May 2019) total just over $111 million, as follows:
• Alternative Fuel Vehicle Revolving Fund $3.0 million
• Insurance Fund $33.3 million
• Department of Administrative Services Operating Fund $18.5 million
• State Information Technology Operating Fund $10.5 million
• Department of Justice Protection and Education Revolving Account $46.0 million
Rather than using fund sweeps sporadically to balance the biennial budget, the state could develop consistent policies for determining the appropriate size of agency reserves, based on the nature of the program, the revenue associated with the reserve and other relevant factors. Reserve funds in excess of the amounts needed could be transferred to reduce the UAL on an annual or biennial basis.
Financial Opportunity: Estimated $100 million based on 2017-19 fund sweeps; longer term impossible to predict
Key Considerations:
• Legal analysis would be needed to determine whether there are constraints on redirecting amounts from these reserve funds. If so, see separate analysis regarding whether these restrictions could be addressed by setting up a side account dedicating these funds to the UAL associated with the restricted use.
• If federal funds have been paid into an account that is swept, there may be consequences if it is determined by the federal government that the sweeps were an unallowable use of federal funds.
Status of concept: To be evaluated

PERS UAL TASk FoRcE FinAL REPoRT 37
APPEndix 12A
Policy Option: State Alcohol RevenuesEntities Impacted: OLCC; wine, beer and spirits manufacturers, distributors and retailers
Description of Policy Options:
A. Manage the distilled spirits operations of the Oregon Liquor Control Commission (“OLCC”) to maxi-mize profitability within the regulatory framework established by the state; dedicate incremental profits to PERS.Rationale:
Following the repeal of Prohibition in 1933, the state established OLcc to regulate the alcohol industries in Oregon and directly operate wholesale and retail distribution of distilled spirits. Profits generated by the distribution of distilled spirits, as well as licensing fees and excise taxes on beer and wine, cover the cost of regulation and generate funds for state and local governments. For the 2017 – 19 biennium, OLCC estimates it will distribute $574 million to the state General Fund, cities and counties (the third largest funding source for the state, and the second largest for cities and counties).
While OLCC manages the spirits distribution business to generate profits, this objective coexists with other explicit and implicit public policy goals. In addition, OLCC operates as a state agency. Political institutions and government administrative processes are designed to achieve public policy objectives, but may not be the best model for managing a commercial enterprise. The state has legal authority to regulate the spirits industry. Increasing OLCC’s flexibility to operate the spirits business to maximize profits, while using the state’s regulatory authority to drive the public policy agenda, could increase the value of this asset for the citizens of Oregon.
Mechanisms:
1. Develop strategic and operating plans for spirits distribution based on commercial best practices within the state regulatory framework, but unconstrained by the state management structure and political considerations. While potentially beneficial, individual business model changes will not maximize the profitability of this business. Review the entire business model and develop an integrated strategy to maximize profitability as well as deliver the desired public policy goals for the people of Oregon. This plan should include the following:
(a) Purchasing and Pricing – OLCC purchases distilled spirits products from manufacturers and dis-tributors. The cost paid by OLCC is set by the manufacturers and distributors. Retail prices are established by applying a fixed mark-up percentage to product cost. OLCC publishes the mark-up schedule which is consistent across Oregon. Consider breaking the fixed mark-up schedule, leveraging scale to negotiate reduced product costs and setting retail prices based on demand in different locations and situations.
(b) Distribution – In Oregon, bottled spirits are sold through about 263 retail agents of OLCC who receive a commission of about nine percent of sales. In Oregon, there is one retail outlet selling distilled spirits for every 15,000 people. In 2012, the U.S. national average was one store for ev-ery 4,500 people (more recent data is not currently available). Over the last several years, OLCC has been working to expand the number of retail outlets. However, the planned expansion will

38 PERS UAL TASk FoRcE FinAL REPoRT
still leave Oregon well short of the 2012 national average. Consider more extensive and rapid expansion of retail outlets.
(c) Inventory Management – OLCC allows its retail agents significant latitude in choosing products to offer in their stores and also prioritizes products from small Oregon producers. As a result, OLCC carries roughly 4,000 SKUs, far more than would generally be available in states such as California or Washington. While a product line that is too narrow limits sales, a product line that is too broad can reduce sales and margins by clogging store shelves with excess inventory, and by restricting OLCC’s ability to negotiate lower costs. Consider centralizing purchasing and inventory management.
(d) Marketing and Promotion – OLCC is not currently permitted to market or promote distilled products and price promotions are very limited. This could result in lost sales and profits. Con-sider permitting marketing and product promotions to maximize revenue, margins and inventory turnover.
(e) Governance – In addition to the operating model, an integrated strategy should consider the appropriate governance and ownership model. To unlock its full value, the business should have a more autonomous governance structure, answerable to a Board of Directors and responsible for delivering specific financial outcomes to its stakeholders (the people of Oregon). This could be achieved by (1) spinning off the spirits distribution operation to a public corporation that would continue to deliver revenues to the state General Fund, cities and counties, or by (2) selling the spirits distribution business, investing the proceeds and taxing the new business, all for the bene-fit of these government entities.
Funding Opportunity: Unknown
Key Considerations:
• The potential benefits of maximizing profitability must be considered in concert with other non-financial implications. The best decision for the citizens of Oregon can only be made if both the benefits and costs of potential actions are explicitly identified and quantified.
• Managing OLCC differently may increase consumption of alcohol, as well as associated health and social issues. However, constraining the OLCC operating model is likely not the most efficient or effective way to address these potential issues. The state may consider using some additional profit created to increase investment in health and human services to prevent and address alcohol abuse, as well as step up enforcement of laws prohibiting underage drinking and DUII.
• Some current OLcc practices are intended to support the development of the Oregon distilled spirits industry. The costs and benefits of these practices should be specifically identified and explicit decisions made whether to make these investments.
• Changes in distribution of distilled spirits may have implications for existing retail businesses. These implications should be analyzed, quantified and considered in any plans to implement such changes.
B. Increase alcohol licensing fees and excise taxes on beer and wine; dedicate incremental revenue to PERS.Rationale: Current fees and tax rates reflect historical and political considerations and may not reflect present conditions. For example, Oregon’s excise tax on beer is 8¢ per gallon, the lowest in the U.S., while the tax on wine is 67¢ per gallon, slightly below the national average. Neither rate has changed since 1977.

PERS UAL TASk FoRcE FinAL REPoRT 39
Financial Impact (illustrative only):
• Excise tax on beer raised to the U.S. average of 35¢ per gallon: about $49 million per biennium (based on 2017-19 projections)
• Excise tax on wine raised to the U.S. average of $1.03 per gallon: about $12 million per biennium (based on 2017-19 projections)
• Double alcohol license fees: about $10 million per biennium (based on 2017-19 projections)
ToTAL FUNdiNg oPPoRTUNiTy: $71 miLLioN PER BiENNiUm
Key Considerations:
• Changes in license fees and excise taxes may have implications for existing businesses. These implications should be analyzed, quantified and considered in plans to implement such changes.
• Higher beer and wine excise taxes may increase prices for Oregon consumers, which may reduce consumption.

40 PERS UAL TASk FoRcE FinAL REPoRT
APPEndix 12b Policy Option: Liquor SurchargeEntities Impacted: Liquor purchasers, including individual consumers and bars/restaurants selling liquor, would pay higher prices. Liquor agents’ commissions would increase slightly due to the surcharge. Total sales might fall (reducing revenue to the state and counties, as well as agents) if consumers reduce consumption or shift purchases to Washington.
Description of Policy Option: A surcharge could be imposed on all distilled spirit (liquor) sales in Oregon, calculated as a percentage of the retail sales price (e.g., 1%, 5%, or 10%).
For the 2017-19 biennium, the gross sales revenue for distilled spirits sales is projected at roughly $1.35 billion. However, as net sales increase, OLCC will incur larger bank card fees as well as increased agent’s compensation expense (paid to retail liquor agents). Surcharge calculations would be net of these additional expenses.
Financial Opportunity: A 10% surcharge on distilled spirits sales would be projected to net approximately $60 million per year or $600 million over 10 years.
Key Considerations:
• OLCC is currently collecting a $0.50 per bottle surcharge on distilled liquor which is directed to the General Fund. Any new surcharge would be accounted for in a similar manner.
• When the State of Washington privatized its liquor operations, retail prices increased and resulted in increased cross-border sales along Oregon’s northern border. As the price of distilled spirits in Oregon rises, the incentive to cross the border and purchase distilled spirits in Oregon as opposed to Washington may decline resulting in fewer sales.
• As prices of distilled spirits increase, consumers of alcohol may shift their consumption to beer/wine.
Status of Concept: Analyzed

PERS UAL TASk FoRcE FinAL REPoRT 41
APPEndix 13 Policy Option: University PrivatizationEntities Impacted: Oregon public universities including Oregon Health & Science University
State University Assets by institution
Policy Options:
A. Privatize one or more state research university (e.g., University of Oregon, Oregon State University, Portland State University – recently reorganized from state agency to public university status with distinct public boards) and/or OHSU (currently an Oregon public corporation). Dedicate a portion of privatization proceeds or future General Fund appropriations for those institutions to maintain preferential access at reduced cost for Oregon students, to “follow the student and pay for results.” Allocate remaining proceeds and remaining General Fund appropriations to PERS UAL. Rationale: While the state provides approximately 12% of operating revenues for the three state research universities, these institutions are generally required to follow state financial and operating processes, with major decisions like tuition setting requiring state approval. Political institutions and government administrative processes are designed to achieve public policy objectives, but may not be the best model for managing a complex research and educational institution. Converting one or more of these institutions into a private, not-for-profit research university could increase operating flexibility, generate more philanthropy, and over time provide a path toward even higher academic quality (benefiting Oregon students) as well as accelerated knowledge creation and innovation (benefiting Oregon’s economy), through a higher education “eco-system” in Oregon that

42 PERS UAL TASk FoRcE FinAL REPoRT
includes both major public and major private research universities — for example, southern california benefits from having both UCLA and USC. The rise of OHSU to national ranks among health science universities following its restructuring from state agency to public corporation status in 1995 provides a partial example. The level of philanthropy required to be self-sustaining limits this concept to UO, OSU, PSU or OHSU, where the level of fundraising capacity is evidenced by endowments and other net assets held in their respective foundations.
Mechanism:
Convert institution to a not-for-profit legal structure with a self-perpetuating board of trustees.
Borrow $250 million to $800 million to purchase capital and unrestricted net assets from the state, with $1.5 billion for full privatization of OHSU (half for research and education component).
Recapitalize with $1.5 billion to $3 billion for three research universities (with $4 billion for full OHSU) in major philanthropy to create endowment sufficient to replace state appropriation (assuming a 4.5% to 5% endowment payout ratio) and restore credit capacity (for example, a minimum cash to debt ratio of 2x).
Financial Impact: $250 - $800 million for three research universities, not including any General Fund appropriations. $750 million - $1.5 billion for OHSU, depending on whether just research and education component or hospital also is included.
Key Considerations:
• Conversion would be complex.
• A significant level of philanthropy would be required – in the billions of dollars.
• Most private research universities have a large biomedical component, which fuels reputation and research funding. In Oregon, only OHSU currently has significant biomedical capabilities.
• For privatizing OHSU, a key challenge is to maintain federal Medicaid funding through the intergovernmental transfer mechanism that requires a large public hospital and that brings approximately $200 million annually to Oregon. An option could be to privatize the research and education component of OHSU (perhaps in connection with another public research university) while maintaining the hospital as an Oregon public corporation. This would approximately cut in half the net financial impact (from $1.5 billion to $750 million) and philanthropy required.
• Opportunity to create a more diverse higher education environment in Oregon with both a major public and a major private research university.
• Loss of leverage from privatized universities may increase overhead for remaining public universities or state agencies.
• Loss of public control.
B. Increase value of university Auxiliary Enterprises and monetize; dedicate incremental proceeds to PERS.Rationale: Oregon public universities operate auxiliary enterprises (e.g., parking, housing, food service, conference centers, hotels, retail) with annual revenues of $460 million (almost all of OHSU’s auxiliary revenue is directly related to patient care). These operations often provide services that are the same, or similar to, commercially available services, may not be central to the core mission of the institution and could potentially be operated more profitably.

PERS UAL TASk FoRcE FinAL REPoRT 43
Mechanism: Maximize value for auxiliary enterprises by adopting commercial best practices (e.g., pricing, operating models, cost management); consider sub-contracting or selling operations to commercial operators.
Financial Impact: Assuming profits from 10% of auxiliary enterprises increased by 10% of revenues, the capitalized value would be $55 million to $60 million.
Key Considerations:
• Potential loss of control.
• Higher costs for students and other customers.
• Potential reduced flexibility to use auxiliary facilities for academic purposes later.

44 PERS UAL TASk FoRcE FinAL REPoRT
APPEndix 14Policy Option: Portland State Office Building Entities Impacted: Agencies which currently have offices in the Portland State Office Building (PSOB), located on Portland’s east side in the Lloyd District
Description of Policy Option: The PSOB contains 290,000 square feet of office space and 28,000 square feet of basement space. Agencies occupying space in the PSOB currently pay a “full service” rate of $17.40 per square foot per year, which includes insurance, maintenance, utilities, custodial services, etc. Since this is a state-owned property, it is exempt from property taxes.
The state could sell the PSOB and lease back the space, relocate to another leased facility, or construct one or more new facilities in a less expensive area. Sale proceeds are estimated at about $120 million.
Office rents on Portland’s close-in east side for comparable Class B office space average about $26.33/SF (triple net or modified gross rates), with total tenant costs averaging $30-$32/SF. Very little Class B office space larger than 5,000 square feet is currently available outside the Portland core. A total of five such properties were located in Beaverton and Tigard, averaging $22.74/SF triple net, or about $27/SF total cost. Three were found in Gresham and East Portland, averaging $19.83/SF triple net or modified gross, or about $24/SF total cost.
For leased space, tenant improvement costs are estimated at $80/SF, or $23 million. Moving costs (either to leased space or new construction) are estimated at $100/SF, or $29 million. With a sale/leaseback, moving and tenant improvement costs are avoided but costs to tenant agencies could be expected to increase $6-7 million/year due to property taxes and market-based lease rates.
Constructing two new 2-story facilities (east side and west side) would be estimated to cost $87 million and should result in lower operating costs. If construction and moving costs were paid out of sale proceeds, net gain would be small. Alternatively, construction could be debt financed with financing costs met through operating cost savings and adjustment of agency rates closer to market, allowing transfer of some or all of the sale proceeds to the UAL.
Financial Opportunity: $120 million in three to five years, if two new facilities are constructed and debt financed with costs met through operating cost savings and adjustment of lease rates
Key Considerations: Relocating to private leased space would likely be to high-cost locations, as existing rental space of the size needed is not available in lower-cost metro locations. New construction could be in transit-friendly lower-cost location with surface parking and would allow more efficient space utilization.
Status of Concept: To be evaluated

PERS UAL TASk FoRcE FinAL REPoRT 45
APPEndix 15A
Policy Option: Vacant Land/FacilitiesEntities Impacted: State agencies currently holding vacant property
Description of Policy Option: Sell excess vacant or under-utilized state land and facilities and dedicate the sale proceeds to the PERS UAL.
The state does not have a single, easily-accessible database of all state-owned land that is vacant or under-utilized and potentially available for sale. In addition, parcels occupied by older facilities may have significant remediation or demolition costs associated with them that diminish the potential for substantial gains. Further work would be needed to develop a comprehensive list, but major examples identified thus far include the following:
Hillcrest youth Correctional facility
The Hillcrest facility is closing in September 2017. In 2015, a broker opinion of value estimated the property at $4.5 million as bare land, or $2.7 million with the buildings intact. However, this was not a full appraisal and does not take into account the site’s antiquated infrastructure or the need for substantial building renovation for most potential uses. The state recently estimated that the cost to clear and market the property would exceed $5 million, in which case a sale would be unlikely to generate any net proceeds.
MacLaren youth Correctional facility Buffers
MacLaren Youth Correctional Facility is located in Woodburn. The entire property is 273 acres, with over 80 acres held as a buffer zone. Five parcels of the buffer land were appraised in 2017. Parcels 1 and 2 total 24 acres and have frontage on North Pacific Highway. The appraiser found these two parcels to be the highest value and appropriate for commercial or industrial development. Their value is appraised at $1,290,000 and $1,540,000, respectively. However, their value is diminished by the current orientation of the entry drive to the MacLaren Facility, which creates areas that cannot be developed. It may be possible to adjust this alignment, if necessary. Parcels 3, 4, and 5 lack frontage but have water rights attached. The appraiser determined their highest and best use to be agricultural land and estimated the value of these 54 acres to be $845,000. The bulk of this land (42.87 acres) is in Parcel 5, and is currently leased to the City of Woodburn as part of its wastewater treatment operation.
Oregon Youth Authority is considering construction of two additional facilities on the MacLaren property in the future: a young men’s transitional facility and a central office. These could be accommodated on Parcels 3 and 4, respectively.

46 PERS UAL TASk FoRcE FinAL REPoRT
oregon State Hospital north Campus
The property has been subdivided into five lots.
Lot Description Acres Status
1 Dome Building and Grounds 6.93 Appraised at $4.5M. Occupied by the Department of Corrections. Not currently for sale.
2 Yaquina Hall 1.78 Selling to Salem Housing Authority; $522,280.
3 Parking Lot 2.54 Retained for the Department of Corrections parking. Not currently for sale.
4 NW Corner 5.87 Selling to City of Salem; $1,355,970 plus sewer main.
5 East of 25th 25.18 Appraised at approx. $6 million. Cleared and shovel-ready; currently for sale.
The three lots being sold (2, 3, and 5) are anticipated to bring revenue roughly equal to the $8 million demolition and abatement costs that has been incurred by DAS. Additional revenue of about $5 million could be raised by selling the Dome Building and Lot 3. This would require relocating approximately 150 DOC employees. Currently, DOC does not pay rent, and spends about $200,000 per year to maintain and operate the Dome Building.
Financial Opportunity: Unknown; largely depends on results of inventory
Key Considerations:
• Not all vacant and unused land is available for sale; some parcels are held by state agencies for future anticipated needs (for example, a facility planned for several years in the future). If these parcels were sold, the state would have to acquire substitute land.
• Parcels held by ODOT, such as unused right-of-way, were mostly acquired with highway funds and thus any sale proceeds would have constitutional restrictions on their use. See separate analysis regarding whether these restrictions could be addressed by setting up a side account, dedicating these funds to the UAL associated with ODOT.
• Land held by the Common School Fund is addressed in a separate concept paper.
Status of Concept: To be evaluated

PERS UAL TASk FoRcE FinAL REPoRT 47
APPEndix 15b Policy Option: Transfer K-12 Surplus/Non-operating AssetsPublic Entities Affected: K-12 System Members
Option Description: As suggested by the sale, renovation and repurposing (e.g., school facility converted to commercial office space and music venue) of Washington High School by PPS in 2015, members of the K-12 system likely maintain varying levels of surplus/non-operating assets that are not mission critical. A detailed identification and listing of such assets, with estimated/appraised values and a conversion schedule regarding such assets, would provide a defined cash flow stream over a defined period of time that reasonably could be committed to reduction of the PERS UAL.
Biennia2017 – 19 2019 – 2021 2021 – 2031 All Years
Gross Capital Opportunity $TBD - - $TBDCost to Implement < 10% - - < 10%Net PERS UAL reduction $TBD - - $TBDImpact on other public budgets - - - -Impact on non-public entities ? ? ? ?
Key Considerations:
• K-12 system members reportedly continue to be budget-constrained. (For example, though the 2017-2019 biennium budget was increased 11% relative to the prior biennium, both PPS and Salem-Kaiser budgeted for reduced teaching positions — 55 and 67, respectively.)
• Conversion of surplus/non-operating assets, particularly facilities and land, limits opportunities for K-12 system to address future growth as the Oregon population grows.
• Conversion of surplus/non-operating assets potentially requires focused staff and/or external expertise. (e.g., Multnomah County recently hired a property management/brokerage firm to facilitate sale of Wapato and other surplus buildings.)
Next Steps:
1. Development of detailed listing of surplus/non-operating assets currently controlled by key K-12 system members
2. Development of appraisal/value estimates for surplus/non-operating assets
3. Development of conversion schedule regarding surplus/non-operating assets
4. Development of conversion cost estimates
5. Identification of key barriers to conversion
6. Development of potential benefit sharing among K-12 system members based on reduction in PERS UAL attributable to surplus assets (e.g., reduction allocated based on relative enrollment)

48 PERS UAL TASk FoRcE FinAL REPoRT
APPEndix 16 Policy Option: Monetize Port of Portland Surplus AssetsEntities Impacted: Potentially, the Port of Portland and its users
Description of Policy Option: Evaluate real property and other assets held by the Port; monetize any surplus properties and dedicate proceeds to PERS.
Background / Rationale: The Port of Portland operates three airports (PDX, Hillsboro, and Troutdale) and numerous other transportation facilities. Not all of these operations are fully utilized or profitable. Excluding PDX, the real property held by the port has an estimated appraised value of approximately $400 million.
Mechanism: Conduct a strategic evaluation of Oregon’s port and airport infrastructure requirements for the 21st century and identify surplus property (if any). Monetize (sell or lease) surplus property and dedicate proceeds to PERS.
Financial Opportunity: Unknown
Key Considerations:
• Federal law places many restrictions on the ownership of airports and may restrict the use of proceeds (if any) from sale or conversion of airport assets.
• Some real property held by the port is within the Portland Superfund site, and the Federal government has not yet assigned responsibility for environmental remediation. This may impair the potential uses and value of these properties in the short- to medium-term.
Status of Concept: A strategic review of Oregon’s air and marine infrastructure would help ensure the state is positioned for future economic growth and may be warranted. However, given the challenges posed by Federal aviation law and environmental issues, it is unlikely this policy option would generate material short- to medium-term funding for PERS.

PERS UAL TASk FoRcE FinAL REPoRT 49
APPEndix 17A Policy Option: Common School Fund - State LandsEntities Impacted: School districts receiving funding from the Common School Fund; lessees and other users of state lands
Description of Policy Option: The state owns and manages about 2.8 million acres of land for the benefit of the Common School Fund established by the Oregon Constitution. This includes about 740,000 acres of uplands (primarily rangeland and forests); 770,000 acres of sub-surface resources (minerals and energy); and about 1.3 million acres of waterways (territorial sea, tidelands, and navigable rivers).
Timber revenues, traditionally the largest revenue source for the Common School Fund, have declined steadily in recent years primarily due to issues related to species protection, to the point where management costs exceeded revenue. After much discussion surrounding the largest timber asset (the Elliot State Forest), the 2017 legislature authorized $100 million in bond funding to enable the transfer of the Elliot State Forest out of the Common School Fund. This should enable the Common School Fund to obtain a higher return.
The Common School Fund currently earns less than $1 per acre, on average, for the rangelands it holds. Many of its land holdings are viewed by the Department of State Lands as having limited revenue potential and limited marketability. Total revenues from real estate management totaled $6.8 million in FY 2015. The Department has not updated its real estate asset management plan since 2012, and it seems likely that a more aggressive management strategy, coupled with a plan to sell under-performing property, would result in increased earnings and investable assets.
The Oregon constitution provides that income from the common School Fund must be “applied to the support of primary and secondary education as prescribed by law.” The Common School Fund expects annual distributions to schools equal to 4% of assets. Since 2000, distributions have ranged from a low of $13 million in 2004 to a high of $70 million in 2017.
Options relating to the Common School Fund could include:
• increase revenues to the common School Fund through investment of proceeds from the Elliot State Forest and update of real estate management strategies; dedicate any increases in revenue to the UAL.
• Sell additional Common School Fund land assets and transfer proceeds to the UAL.
consistent with constitutional restraints, funds transferred to the UAL would need to be applied to the support of schools, which could be accomplished through the use of side accounts for the benefit of school districts.
Financial Opportunity: Unknown how much additional revenue could be obtained through updating real estate management practices and selling underutilized property.
Key Considerations: A key question would be whether transfer of funds from the Common School Fund to the UAL would financially benefit schools. An analysis of this question would need to include a comparison of the earnings potential of the funds and implications for the short and long term.
Status of Concept: To be evaluated
50 PERS UAL TASk FoRcE FinAL REPoRT
APPEndix 17b Policy Option: Timber Revenue under Good Neighbor ProgramEntities Impacted: Federal, State, Local Governments
Description of Policy Option: Study feasibility of utilizing “Good Neighbor Program,” whereby the state forest department could manage some timberlands eligible for timber sales. Revenues dedicated for county schools and roads realized by this could be allocated to school districts as is currently established in the Common School Fund, and used to help offset the UAL.
Federal forestland accounts for roughly 18.2 million acres statewide, by far the largest holder of timberlands in Oregon.* Other ownership of timberlands can be broken down into ownership comprised of: industrial private, small private, state, local, and Native American timberlands. Since 1988, there has been a significant decline in the harvest of timberlands managed the United States Forest Service (USFS) and Bureau of Land Management (BLM).
State property and severance tax laws do not apply to publicly owned forest lands or the timber harvested from these lands. Instead, local governments receive, under state and federal law, a share of the revenue earned from management of these lands. Most of this revenue is from timber sales. The state forester manages roughly 821,000 acres of forest lands. This includes roughly 119,000 acres that was deeded to Oregon by the federal government and is to be used to assist in the funding of education. This land is managed by the Oregon Department of Forestry on behalf of the State Land Board and the Department of State Lands as the Common School Fund Forest Lands. The Common School Fund operates similarly to an endowment fund where the revenue is invested and only the earnings of the fund are distributed. The market value of the Common School Fund was about $1.1 billion on December 31, 2010. Fund earnings are distributed first to the counties and is allocated according to the number of school-aged children, ages 4 to 20, and then to school districts according to the average daily membership. Annual distributions have fluctuated in recent fiscal years due to changes in financial markets, housing starts and timber prices.
Federal forest lands in Oregon include U.S. Forest Service, Oregon and California Railroad Lands (O&C), Coos Bay Wagon Road (CBWR), and Public Domain Land which was retained by the federal government when Oregon became a state in 1859 and today is largely managed by the Bureau of Land Management.
Oregon could work with the federal government under the “Good Neighbor Program” to manage some of the timber sales currently eligible to be sold for harvest. Currently, under this federally authorized program, the state forestry department could administer timber sales, and any revenues after administrative costs could be allocated to schools’ UAL payments.
Key Considerations: Significant complexities exist in the history of timber harvest in Oregon at federal, state, and local levels. These complexities include, but are not limited to, geopolitical differences, utilization of public lands, environmental factors, litigation, financial markets, housing starts and timber prices. However, this is an existing program and with current positive market conditions for timber products, significant revenues could be realized. Under this existing plan, no exchange of land from federal government to state or local entries would occur. Rather, we would increase the volume of contracts state forestry department and its employees administer on federal land.
*Much of the background information was gathered from a report on timber released by the Legislative Revenue Office in 2013 (Research Report #2-13).

PERS UAL TASk FoRcE FinAL REPoRT 51
APPEndix 18 Policy Option: Fire Suppression CostsEntities Impacted: Private forest land owners (both industrial and small woodland owners)
Description of Policy Option: The costs of fighting major forest fires in Oregon are shared by the state, private and public landowners, and some federal reimbursement. In high-expense years, a portion of the cost is met by commercial insurance. The formulas for cost-sharing are complex, and vary depending on whether the costs are for the pre-season deployment of resources, the initial attack, large fire costs, or insurance premiums. However, private landowners’ share of costs is capped and the state General Fund picks up the excess if the caps are exceeded. A larger share of fire suppression costs could be shifted from the state General Fund to private landowners based on acreage assessments.
Financial Opportunity: Could be $10-$50 million per year, depending on the cost-sharing formula adopted
Key Considerations: Fire suppression financing is a complex structure involving many parties. More than half of the revenue in the Oregon Forest Land Protection Fund (which provides the private landowner share) is received from small woodland owners.
Status of Concept: Requires further study.

52 PERS UAL TASk FoRcE FinAL REPoRT
APPEndix 19 Policy Option: Water RightsEntities Impacted: Applicants for new water rights.
Description of Policy Option: All water in the state – groundwater as well as water in lakes and streams – belongs to the public. With a few exceptions, those wishing to use water must obtain a water right from the state. Generally, once granted, the water right is permanent although it is subject to earlier-granted water rights and can be cancelled if the water is not used for a five-year period. Water rights are generally specific to a piece of property and a particular use (such as irrigation) and usually stay with the land when the property is transferred. In addition, the state holds in-stream water rights that can protect water in streams and rivers for fish and wildlife, recreation, and water quality.
The state has been granting water rights under this system since 1909 and some water rights pre-date that time. In most areas of the state, surface water is no longer available for new uses in summer months. Groundwater supplies are also limited in some areas. In recent years, the state has granted approximately 200-300 new water rights each year, varying in size.
Typically, water rights can authorize use of a volume of water, often measured in acre-feet (AF), or authorize use of certain rate of water use, measured in cubic feet per second (CFS). Often, there is both a rate and volume associated with a water right, meaning a certain rate can be used, but not to exceed a specified volume. One acre-foot is the volume of water that will cover one acre to a depth of one foot annually and is equal to 43,560 cubic feet or 325,851 gallons. One cubic foot per second is a rate of water flow that will supply one cubic foot of water in one second and is equivalent to flow rates of 646,272 gallons per day or 1.98 acre-feet per day. In recent years, the volume of water rights issued by the state has ranged from about 36,000 to about 490,000. The high end number, 490,000, is skewed by the issuance of one permit for 432,000 acre-feet. Omitting this permit yields an average of about 70,000 acre-feet issued per year. This does not take into account water rights that generally do not have an associated volume, such as power, commercial, municipal and domestic rights that are typically authorized based on rates.
The state charges a one-time transaction fee for the issuance of new water rights, which is set in statute. This and similar fees (for transfers, etc.) are intended to cover 50% of the costs of the state’s water rights processing staff. The other 50% is born by the General Fund. The state does not charge for the water itself.
The state could impose a charge for new water rights based on market prices. Market prices for water rights vary widely and comprehensive data is scarce, but according to one source prices averaged about $750/AF in Oregon in 2013. (This is for the permanent right to draw 1 AF per year; annual lease rates would be about 10% of this amount.)
Financial Opportunity: If the volume of primary water rights issued is on average 70,000 AF per year, a charge of $750/AF would raise an estimated $52.5 million per year. Comparable figures for water rights based on CFS have not been located.
Status of Concept: Requires further study.

PERS UAL TASk FoRcE FinAL REPoRT 53
APPEndix 20 Policy Option: Increased Lottery RevenueEntities Impacted: Other programs receiving non-dedicated lottery funds
Description of Policy Option: The Oregon Lottery is considering several options to expand the types of gaming it offers. Some options may offer existing games on new platforms (e.g., mobile devices) while others would offer new games that could be expected to appeal to different audiences and potentially different retailers. The Lottery Commission is expected to vote on a strategic direction in October of this year and new options would be offered as soon as fall of 2018.
Revenue from these new options could be directed toward the UAL in any of several ways:
• Reallocate revenue from specific new lottery games
• Reallocate all lottery revenue increases above a baseline (for example, all amounts over current revenue trend line, or above current revenue plus inflation, or above forecast)
• Reallocate a specific percentage of total lottery revenue
Financial Opportunity: Revenue from new games up to approximately $35 million in first year, increasing over time; rough estimate is potentially $500 million over 10 years.
Key Considerations: Under the Oregon Constitution, lottery proceeds must be used for the purposes of “creating jobs, furthering economic development, financing public education in Oregon or restoring and protecting Oregon’s parks, beaches, watersheds and native fish and wildlife.” Specific percentage allocations must be made to the Educational Stability Fund; to parks and fish and wildlife; and to veterans’ programs. The remainder (65.5% of net lottery proceeds) may be allocated by the legislature consistent with the general constitutional categories specified above. Any transfers to the UAL would likely have to come from this remainder and would have to be consistent with the constitutional purposes – for example, reducing the UAL for schools would likely be permissible as “financing public education.”
Status of Concept: Analyzed

54 PERS UAL TASk FoRcE FinAL REPoRT
APPEndix 21 Policy Option: Rainy Day FundsEntities Impacted: Reducing the state Rainy Day Fund, or diverting future deposits to this Fund, would reduce the state’s ability to weather significant downturns in the economy and corresponding reductions in state revenues. The primary programs affected would be those funded with the state General Fund, 96% of which goes to education, human services and public safety.
Description of Policy Option: The state maintains two budget stabilization funds: The Rainy Day Fund and the Education Stability Fund. The Rainy Day Fund receives all revenue collected from corporate income and excise taxes above the tax rate of 7.2 percent and, in addition, if the prior biennium ending balance is sufficient, up to one percent of the prior biennium’s General Fund appropriations. The Education Stability Fund receives 18% of state lottery funds collected each biennium.
The Education Stability Fund is constitutionally restricted; it can be spent only by a three-fifths vote of the legislature, only for public education, and only if specific economic triggers occur or a state of emergency is declared. The Rainy Day Fund is statutory. It has the same economic trigger and three-fifths vote requirements as the Education Stability Fund, however, these can be changed by the legislature since the fund and its revenue sources are not constitutional. No more than two-thirds of the Rainy Day Fund can be appropriated in a single biennium.
At the end of the 2015-17 biennium, the state had a projected balance of $388.8 million in the Rainy Day Fund and $383.8 million in the Education Stability Fund, for a combined total of $772.6 million. This combined total equates to about 4.2% of the projected biennial General Fund revenues for 2015-17. If the state can avoid a recession during 2017-19 and make all of the scheduled deposits anticipated for that biennium, the projected balance in the Rainy Day Fund will increase to $634.7 million and the projected balance in the Education Stability Fund will increase to $585.6 million, for a combined total of $1.2 billion. This would be equal to about 6.3 percent of projected General Fund revenues in 2017-19.
Under the current constitutional and statutory structure, the Rainy Day Fund is capped once it reaches 7.5% of the prior biennium’s General Fund revenue total and the Education Stability Fund is capped once it reaches 5%. In effect, once capped, the funds would combine to total about 12.5 percent of the prior biennium’s General Fund revenue total.
Financial Opportunity: The Rainy Day Fund is projected to grow by approximately $246 million during the 2017-19 biennium. If $200 million were diverted to the UAL, the Rainy Day Fund would still contain $434.7 million (higher than its 2015-17 level) at the end of the biennium and the combined total of the Rainy Day Fund and Educational Stability Fund would still be over $1 billion.
Key Considerations: • For context, during the 2001 recession, General Fund revenues dropped by $1.5 billion (or 14%) over
the course of the biennium. During the post-2008 recession, projected revenues for the 2009-11 biennium dropped by $3.6 billion (or 21%).
• Maintenance of reserves also supports the state’s strong bond rating, which in turn reduces state borrowing costs. On the other hand, the size of the UAL also raises concerns in the bond market.
• The Legislature has drawn repeatedly from both the Rainy Day Fund and the Educational Stability Fund to balance budgets during economic downturns, but has not done so since the 2011-13 biennium.
Status of Concept: Analyzed

PERS UAL TASk FoRcE FinAL REPoRT 55
APPEndix 22 Policy Option: Surcharge on Licenses, Permits and Other Fees Entities Impacted: Individuals and businesses who obtain licenses or permits or pay other fees for driving, recreation, obtaining services, maintaining their profession, etc., would have a cost increase. There would be some administrative impact on agencies – e.g., rulemaking to increase fee levels, accounting for surcharge revenue, and sending funds to the appropriate account. There is a potential for decreases in fee revenue if the surcharge results in decreased numbers of fee-payers.
Description of Policy Option: Surcharges could be imposed as a percentage of existing fees, e.g., 1%, 5%, or 10%.
For the 2017-19 biennium, total state license and fee revenue is estimated at roughly $1.9 billion. This may be low as it does not include items accounted for in the state budget system as “Charges for Services.” Major contributors by program area:
• Education $11.4 million (Primarily teachers’ licenses)
• Human Services $32.2 million (Primarily public health)
• Public Safety $13.3 million (Primarily DOJ)
• Economic Development $66.3 million (Housing loan fees, e.g., single and multi-family loan programs)
• Natural Resources $360.3 million (DEQ $100 million, Ag. $30 million, Parks $52 million, Fish & Wildlife $130 million, etc.)
• Transportation $824.0 million (Primarily ODOT vehicle registration & title fees)
• Consumer & Business $317.8 million (Primarily business fees and licenses)
• Administration $128.2 million (Secretary of State $85 million, OLCC $31 million, Revenue $10 million, etc.)
• Judicial Department $148.9 million
Financial Opportunity: A 5% surcharge would generate approximately $47.5 million per year, or $475 million over 10 years.
Key Considerations:
• “Charges for Services” are not included in these estimates. Examples include state agency payments to the Department of Administrative Services for rent and administrative services; health insurance premiums paid by retirees and by state agencies and school districts for their employees; and Department of Veterans’ Affairs charges for services at veteran homes. A charge-by-charge analysis would be needed to see whether any provide opportunities.
• By far the largest source of fee revenue is ODOT. Much of ODOT’s fee revenue may have constitutional restrictions on its use. See separate analysis regarding whether these restrictions could be addressed by setting up a side account dedicating these funds to the UAL associated with ODOT.
Status of Concept: To be evaluated.

56 PERS UAL TASk FoRcE FinAL REPoRT
APPEndix 23 Policy Option: Enterprise ZonesEntities Impacted: Certain applicants for Enterprise Zones
Description of Policy Option: Enterprise zones exempt businesses from local property taxes on new investments for a specified amount of time, which varies among the different zone programs. These zones are typically sponsored by city, port, county or tribal governments. Local governments are responsible for creating, amending, managing and renewing most of these zones.
Financial Opportunity: Property tax exemptions associated with enterprise zones will reduce property tax revenue by an estimated $129 million in the 2017-19 biennium on a statewide basis. Oregon appears to be a popular site for establishing large data centers by some of the largest users and storers of data to include companies like Google, Amazon, Apple and Facebook.
At the same time, all levels of government within Oregon have a need for the storage of data and the cost associated with operating and managing this data is significant. A February 2017 presentation entitled, “JLCIMT. Statewide IT Overview”, identified that in 2013-14 non-personnel statewide IT spending exceeded $604.5 million and projections for 2015-17 were anticipated to exceed $763 million. Some of these expenditures can be attributed to the cost and administration of storing this data. Requiring data centers that receive enterprise zone extensions to provide data storage services to state and local governments is a way of reducing public sector costs, thereby indirectly helping to address the UAL.
Status of Concept: Requires further study to include conversations with current and potential future companies who operate or seek to operate data centers within enterprise zones.

PERS UAL TASk FoRcE FinAL REPoRT 57
APPEndix 24 Policy Option: Tech Transfer ParticipationEntities Impacted: Public Universities (including OHSU)
Description of Policy Option: Public universities are partially funded by the state and use state-owned assets. Technologies developed by these institutions may be licensed or otherwise monetized through arrangements with other public or private entities. The financial benefits of these arrangements are unpredictable, normally not budgeted (e.g., windfalls), and usually split among the responsible individuals, the supporting departments and the overall institution. Consider allocating a percentage of the financial benefit of technology transfers to the state, and dedicating these funds to PERS.
Financial Opportunity: Unknown; depends on value of future innovations and tech transfers.
Key Considerations:
• These financial “windfalls” have historically been small. However, the nature of innovation suggests that the impact of one breakthrough innovation could dwarf the aggregate value of the many smaller innovations that came before. To ensure the state (and PERS) receives the benefit of potential breakthrough innovations that could occur at any time, provisions for state participation should be established now.
• Over the last 20 years, the portion of the total operating budgets of public universities provided by the state has fallen dramatically. An even smaller percentage of the resources that support research at the large public universities comes from the state. Since the state has made a relatively small part of the investments that resulted in the technology transfer benefits, some might view the state’s participation as inequitable.
Status of Concept: To be evaluated

State of oregonPERS UAL Task Force Final Report
OFFicE OF ThE GOvERnOR 900 court Street, Suite 254
Salem, OR 97301
email: [email protected]
oregon.gov/gov/policy/pages/pers-ual-task-force