november 8, 2010. global economic powerhouse poverty outsourcing bollywood corruption nuclear...
TRANSCRIPT
November 8, 2010
Global economic powerhouse Poverty Outsourcing Bollywood Corruption Nuclear power
2
I. What was the nature of India’s ‘elephant’ phase?
II. What is the nature of India’s ‘tiger’ phase?
III. How did this transformation come about?
IV. What kind of ‘development’ would we call this?
3
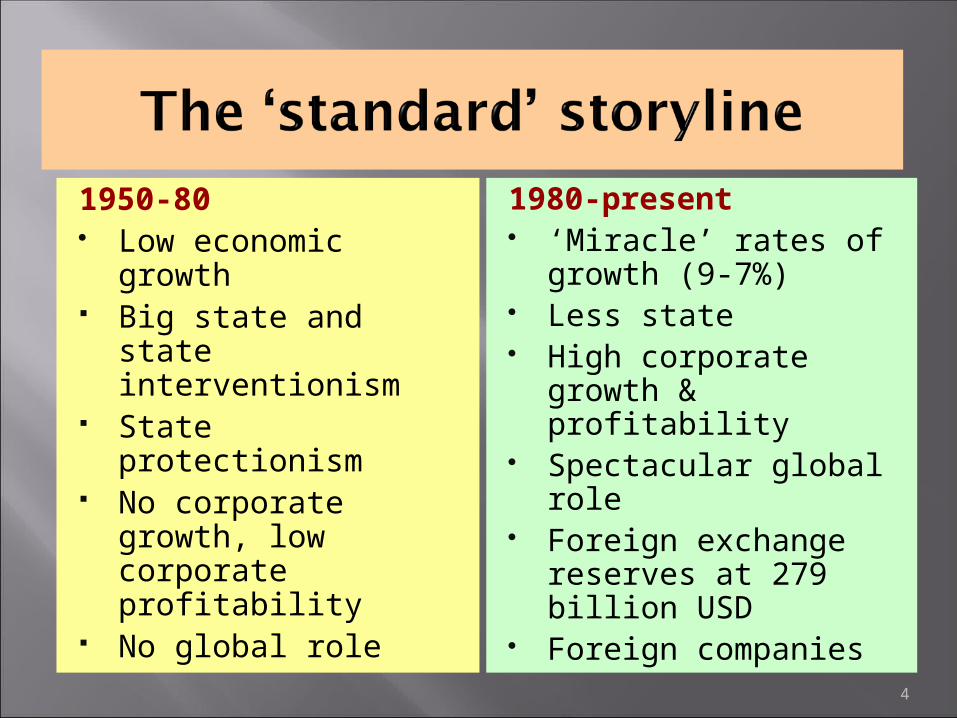
1950-80 Low economic
growth Big state and state
interventionism State protectionism No corporate
growth, low corporate profitability
No global role
1980-present ‘Miracle’ rates of
growth (9-7%) Less state High corporate
growth & profitability Spectacular global
role Foreign exchange
reserves at 279 billion USD
Foreign companies4
The top 40’s worth is 243 billion, up from 229 billion a year ago, but still shy of the 351 billion record in 2007.
4 richest Indians are worth a combined $86 billion, (down from 180 billion 3 years ago).
(forbes)
5
47 Indian companies are on Forbes Global 2000.
Of the top 50 economic entities in the country, 30 are companies (by sales)
The sales of Tata Steels is about the size of Kerala, and Reliance sales is about $2 billion larger than Kerala
WIPRO is about 5 times the SDP of Manipur, and INFOSYS about 4 times
Sales of Reliance and Tata Steel are each equal to the GDPs of the poorest 12 states
The aggregate sales of the top 50 corporations amount to $8 trillion - double the GDP of China and 8 times the GDP of India.
Wal-Mart’s revenues were about 5 times the GDP of Bangladesh; Vodafone is bigger than Ecuador; Exxon was almost 14 times Kenya etc.
The aggregate sales of the top 3 companies, Royal Dutch Shell, Exxon Mobil and Wal-Mart exceed the GDP of the entire African continent ($1.289 trillion and $1.281 trillion for 2008 respectively)
The combined sales of the Forbes Global 2000 of $29.78 trillion equal the GDP of the 5 richest countries: US, Japan, China, Germany, and France. It equals the GDP of all 179 countries taken together minus the richest 5.
Under $1 a day: 34.3% Under $2 a day: 80.4% Under national poverty line:
37.2% (debated figure) Ranks 67 out of 88 on the Hunger
Index; worse than Nepal, Pakistan, China, Sudan
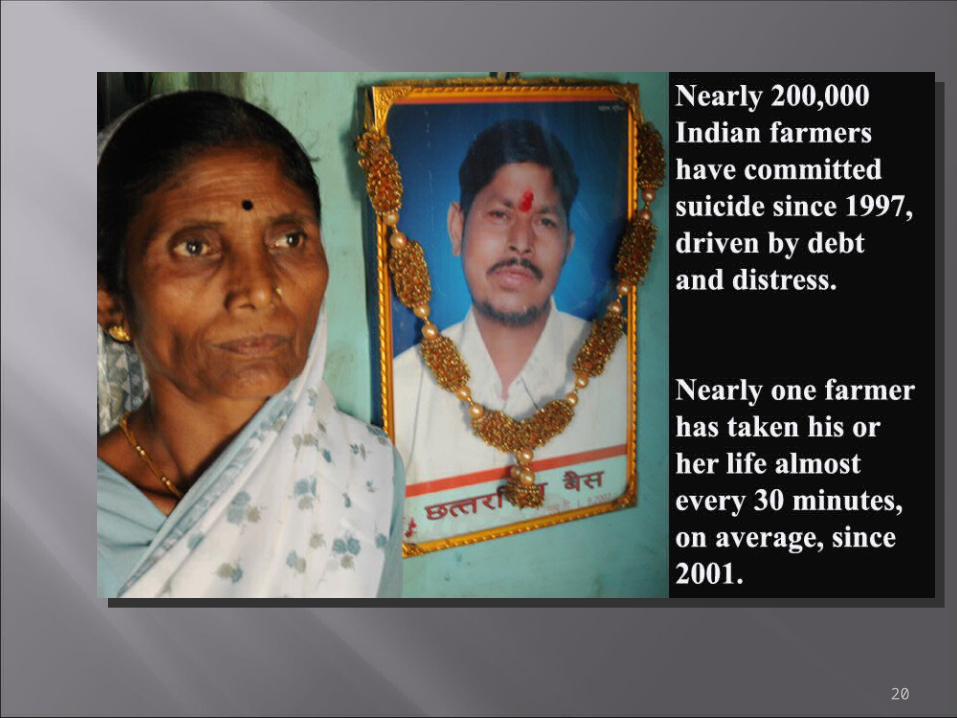
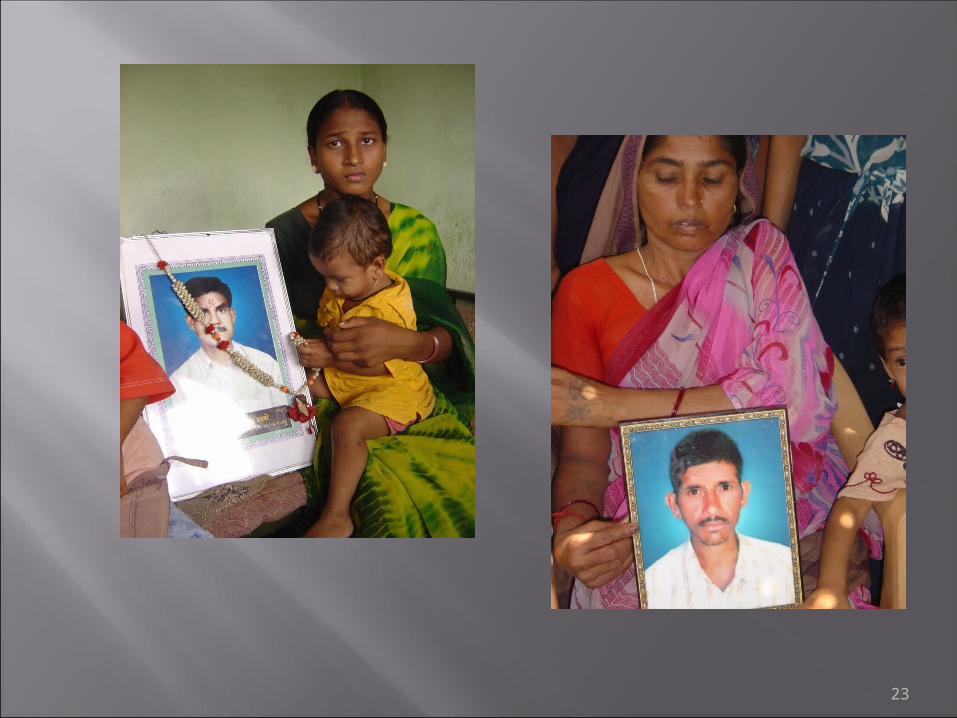
Farmer suicides – close to 200,000 suicides between 1997-2005 (one suicide every 30 minutes)
8
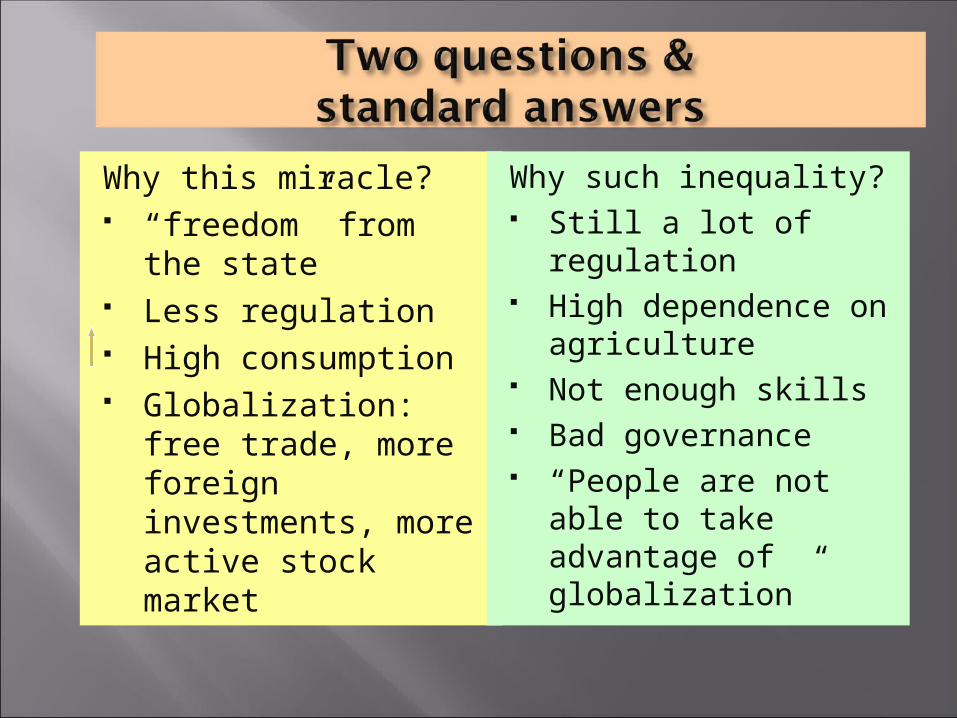
Why this miracle? “freedom” from the
state Less regulation High consumption Globalization: free
trade, more foreign investments, more active stock market
Why such inequality? Still a lot of
regulation High dependence on
agriculture Not enough skills Bad governance “People are not able
to take advantage of globalization”

Alternative explanations
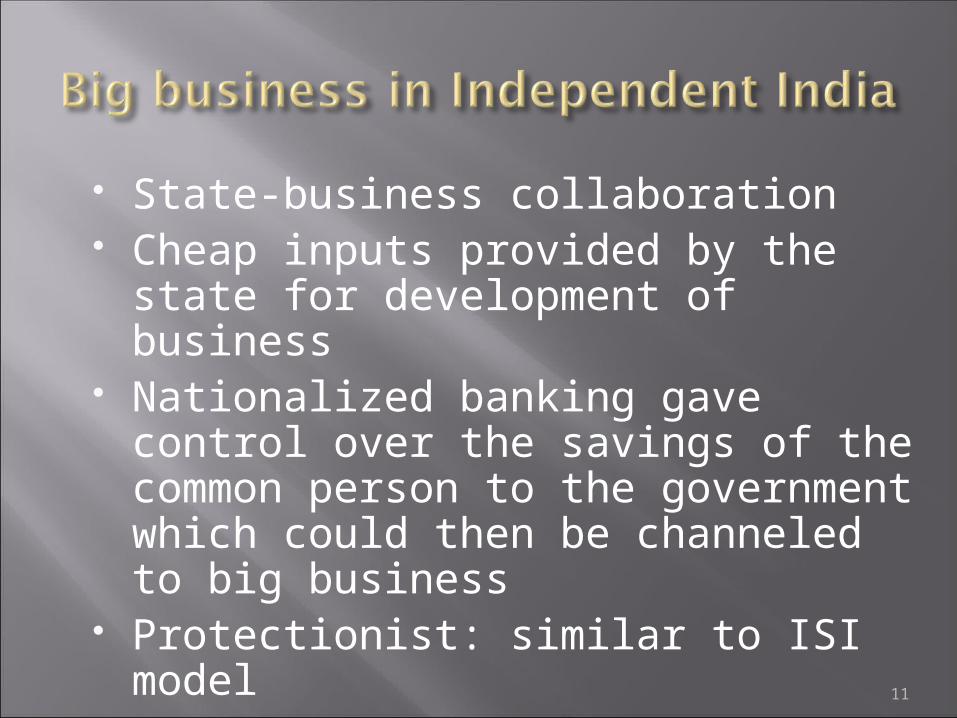
State-business collaboration Cheap inputs provided by the
state for development of business Nationalized banking gave control
over the savings of the common person to the government which could then be channeled to big business
Protectionist: similar to ISI model11
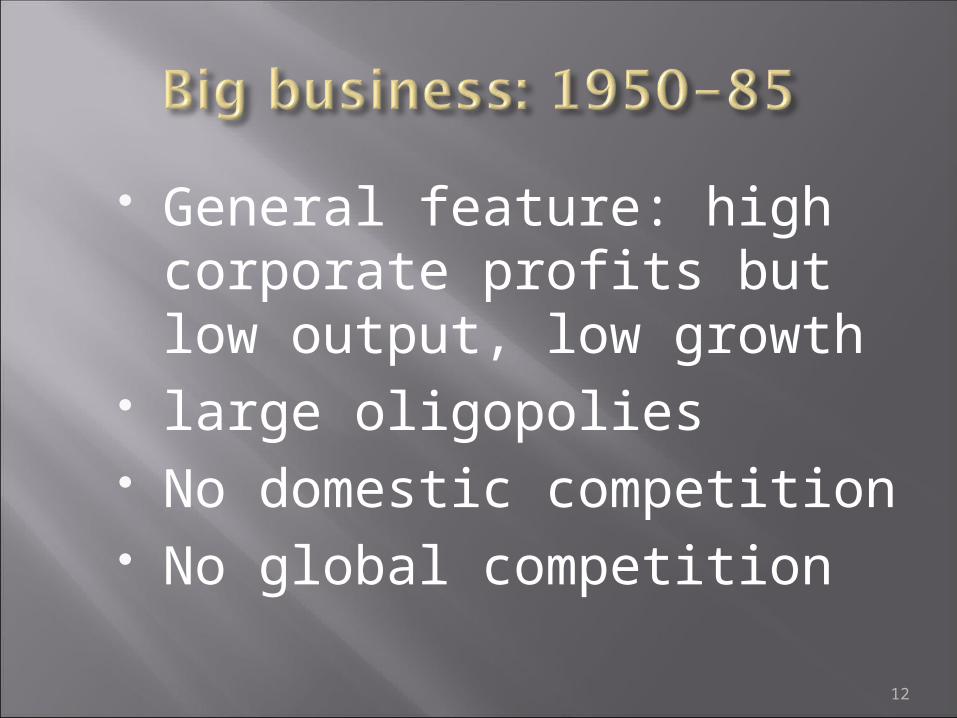
General feature: high corporate profits but low output, low growth
large oligopolies No domestic competition No global competition
12
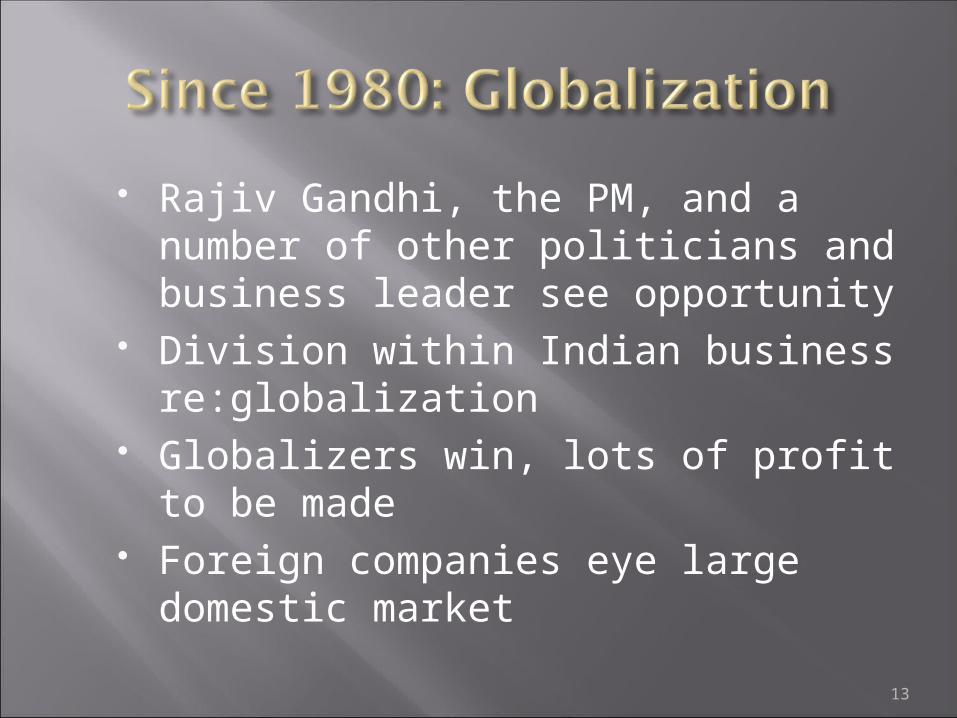
Rajiv Gandhi, the PM, and a number of other politicians and business leader see opportunity
Division within Indian business re:globalization
Globalizers win, lots of profit to be made
Foreign companies eye large domestic market
13
Deepening fiscal crisis Acute foreign exchange crisis In 1991 in takes a loan from
the IMF Beginning of the process of
structural adjustment and neoliberal reforms
14
Easing entry of foreign corporations Easing labour and environmental
regulations (especially in export processing zones)
Less state regulation More competition Privatization of public sector companies
15
Drivers of the ‘miracle’: Outsourcing and growth of service
sector Sell-offs of Indian companies Low cost production Lay offs and restructuring Growth of the middle class with
phenomenal growth in salaries
16
Spectacular growth of the ‘informal sector’
Inequality across caste, gender and religion
Issues such as female infanticide
17
18
Agrarian Crisis(photos by P.Sainath, the foremost journalist in
India who reports on these suicides)

http://www.mapsofindia.com/maps/maharashtra/maharashtra.htm
19
20
21
22
23
One author has called them neoliberal deaths
Neoliberalization of agriculture to increase productivity and growth
Withdrawal of state support and public investment
Private debt High-yielding seeds, chemical inputs,
pesticides Input cost rose 500-1000% Cycle of debt and distress
Modernization: growth, efficiency, productivity
Capability: education, health, income
Social power: justice, difference, agency
26
70% survive on agrarian incomes
93% work in the informal sector 80% live in under $2 a day 42 million live in slums 2 million are homeless 90 million are marginal workers
The state? Educational institutions?
Political sphere?
28
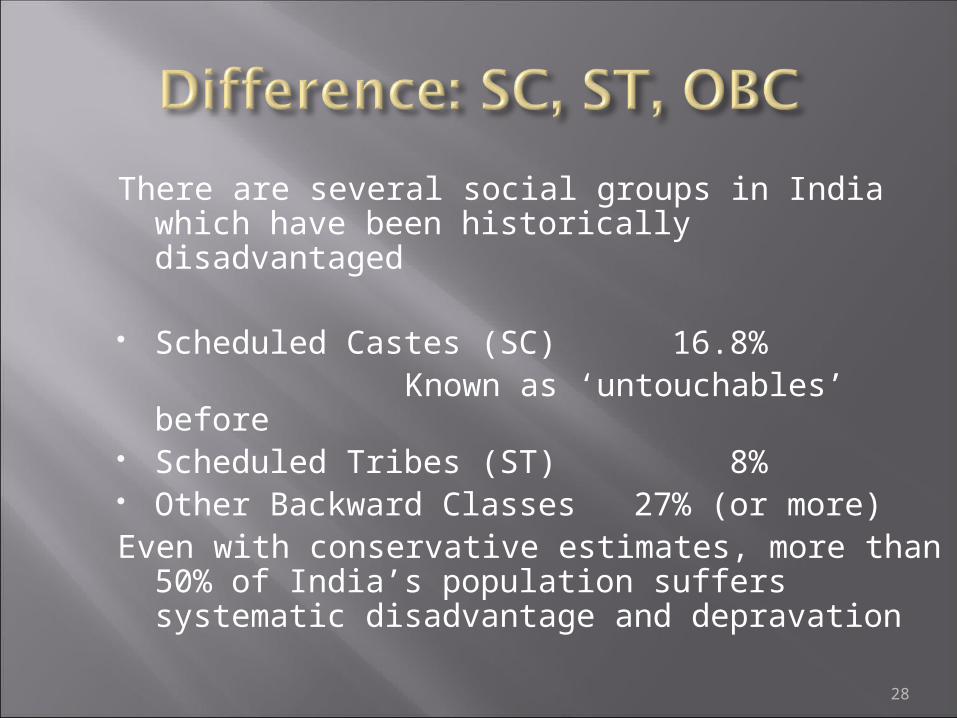
There are several social groups in India which have been historically disadvantaged
Scheduled Castes (SC) 16.8% Known as ‘untouchables’ before Scheduled Tribes (ST) 8% Other Backward Classes 27% (or more) Even with conservative estimates, more than
50% of India’s population suffers systematic disadvantage and depravation
29
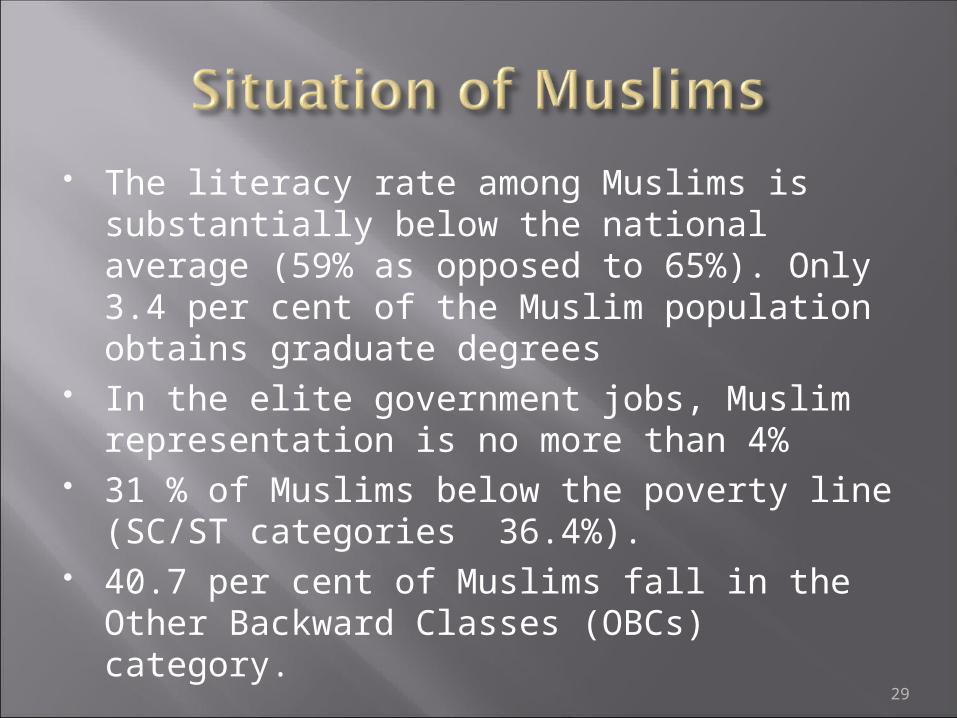
The literacy rate among Muslims is substantially below the national average (59% as opposed to 65%). Only 3.4 per cent of the Muslim population obtains graduate degrees
In the elite government jobs, Muslim representation is no more than 4%
31 % of Muslims below the poverty line (SC/ST categories 36.4%).
40.7 per cent of Muslims fall in the Other Backward Classes (OBCs) category.
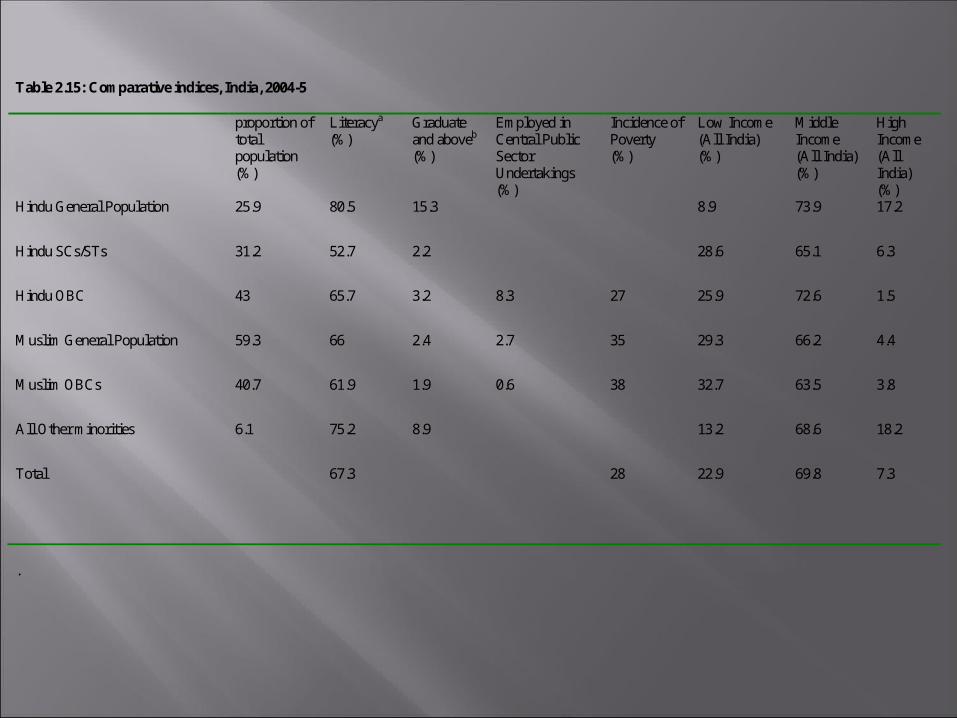
Table 2.15: Comparative indices, India, 2004-5 proportion of
total population (%)
Literacya
(%) Graduate and aboveb
(%)
Employed in Central Public Sector Undertakings (%)
Incidence of Poverty (%)
Low Income (All India) (%)
Middle Income (All India) (%)
High Income (All India) (%)
Hindu General Population 25.9 80.5 15.3 8.9 73.9 17.2
Hindu SCs/STs 31.2 52.7 2.2 28.6 65.1 6.3
Hindu OBC 43 65.7 3.2 8.3 27 25.9 72.6 1.5
Muslim General Population 59.3 66 2.4 2.7 35 29.3 66.2 4.4
Muslim OBCs 40.7 61.9 1.9 0.6 38 32.7 63.5 3.8
All Other minorities 6.1 75.2 8.9 13.2 68.6 18.2
Total 67.3 28 22.9 69.8 7.3
.
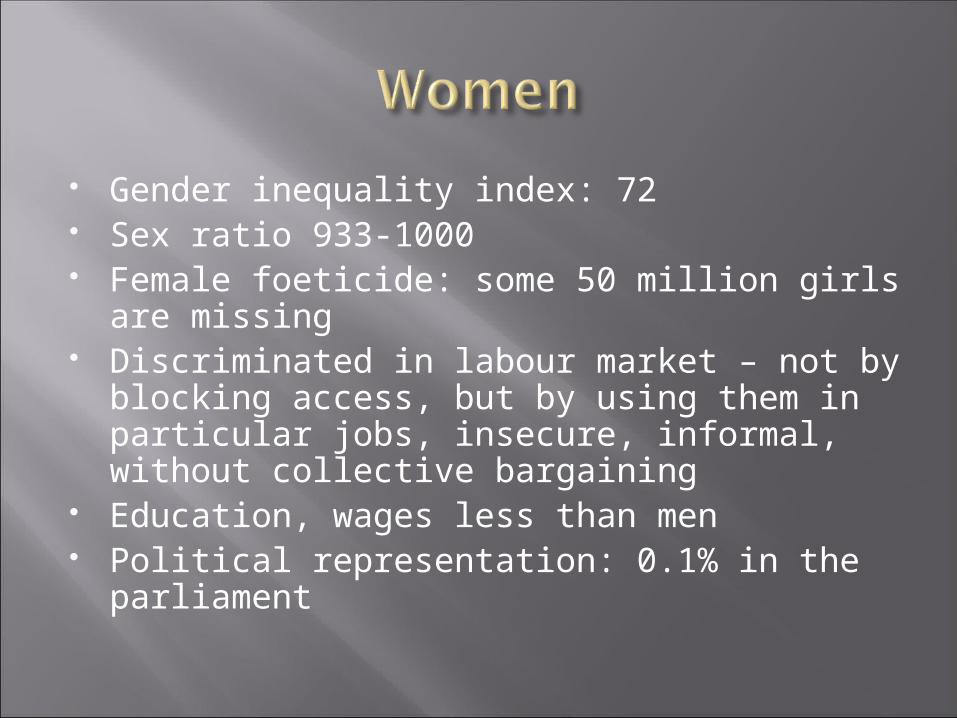
Gender inequality index: 72 Sex ratio 933-1000 Female foeticide: some 50 million girls
are missing Discriminated in labour market – not by
blocking access, but by using them in particular jobs, insecure, informal, without collective bargaining
Education, wages less than men Political representation: 0.1% in the
parliament

Who is the agent of this change?
Who designed it and implemented it?
What would it have looked like if others designed it?