november 9, 2021 consolidated and nonconsolidated
TRANSCRIPT

Company name : Kajima Corporation Stock exchange listings : Tokyo 1st section, Nagoya 1st section
Securities code : 1812 URL : https://www.kajima.co.jp/
Representative : Hiromasa Amano, President and Representative Director
Inquiries : Sachihiko Mikami, General Manager of Accounting Department, Treasury Division Tel. +81-(0)3-5544-1111
Dividend payable date (as planned) : December 2, 2021
Supplemental material on financial results : Available
*Amounts less than one million yen have been rounded down.
1. Consolidated Financial Highlights
(1) Financial Results % : Representing year-on-year change
Q2/FY2021
Q2/FY2020
(Note) Comprehensive income (loss) Q2/FY2021 19.8% Q2/FY2020
Q2/FY2021
Q2/FY2020
(2) Financial Positions
As of September 30, 2021
As of March 31, 2021
(Reference) Owners' equity (Total equity less noncontrolling interests)
As of September 30, 2021 As of March 31, 2021
2. Dividends
FY2020
FY2021
FY2021
(Forecast)
(Note) Revisions to the dividend forecast most recently announced : None
3. Forecast of Consolidated Financial Results for the fiscal year ending March 31, 2022
% : Representing year-on-year change
Full-year
(Note) Revisions to the financial forecast most recently announced : Applicable
-
2,050,000 7.5 ( 12.7) 120,000
JPY JPY
25.00 -
% JPY mil% JPY mil
Total
927,827 42.1
109,500
Basic net income
per share
172.02
JPYJPY mil JPY mil
Revenues Operating income Ordinary income
( 14.0) ( 14.1)
27.00
%%
Net income attributable
to owners of the parent
86,000
27.00
Dividends per share
101.19
-
912,604 ( 3.7)
56,444 ( 21.6) 65,458
884,806 40.4
99.55
956,119
54.00
JPY
29.00
JPY
-
-
54,842JPY mil
-
JPY
54.00
End of Q2
Total equity
2,178,054
2,164,806
%
Owners' equity ratio
JPY mil
65,696JPY mil
874,839 JPY mil916,639 JPY mil
33.4%
Total assets
Year-end
JPY mil
Revenues Operating income Ordinary income
( 17.5) 49,875 ( 3.8)
72,014 20.5 79,356 22.0
% JPY mil %
4.8
JPY mil JPY mil %
End of Q1 End of Q3
% JPY mil
Disclaimer: All financial information has been prepared in accordance with generally accepted accounting principles in Japan. This document is a partial
English translation of the Japanese Financial Statements which are filed with Stock Exchanges in Japan on November 9, 2021. The Company provides
this translation for your reference and convenience only without any warranty as to its accuracy. In case of any discrepancy between the translation and
the Japanese original, the latter shall prevail.
November 9, 2021
Consolidated and Nonconsolidated Financial Statements<under Japanese GAAP>
(For the period from April 1, 2021 to September 30, 2021)
51,872 4.1
JPY JPY
Net income attributable to
owners of the parent
Basic net income
per share
Diluted net income
per share
For the second quarter of the fiscal year ending March 31, 2022 ("Q2/FY2021")

* Notes
(1) Significant changes in the scope of consolidated subsidiaries : None
(2) Specific accounting treatments as to the quarterly financial statements : None
(3) Changes in accounting policies and accounting estimates, retrospective restatements
a. Changes in accounting policies based on revisions of accounting standards : Applicable
b. Changes in accounting policies other than "a" above : None
c. Changes in accounting estimates : None
d. Retrospective restatements : None
(Note) For details, please refer to Changes in accounting policies on page 6.
(4) Number of issued and outstanding shares (common stock)
a. Number of issued and outstanding shares (including treasury stock)
As of September 30, 2021
b. Number of treasury stock
As of September 30, 2021
c. Average number of shares
Q2/FY2021
(5) Forecast of nonconsolidated financial results for the fiscal year ending March 31, 2022
% : Representing year-on-year change
Full-year
(Note) Revisions to the financial forecast most recently announced : Applicable
* These financial statements are outside the scope of quarterly review procedures by certified public accountant or audit corporation.
* Explanation regarding appropriate use of forecasts, and other notes
from forecasts due to various factors.
The forecasts contained herein are based on information available as of the date of this announcement, and the actual results may differ materially
Ordinary income Net income
% JPY mil % JPY mil %
Q2/FY2020
Basic net income
per share
JPY mil % JPY mil
Revenues Operating income
1,230,000 3.4 79,000 ( 24.9) 87,000 ( 23.9) 63,000 ( 23.9)
512,638,367
125.78
528,656,011 528,656,011
As of March 31, 2021
As of March 31, 2021
JPY
29,750,988 23,308,096
500,982,913

Consolidated Financial Statements
(1) Consolidated Balance Sheet
(JPY mil)
As of March 31, 2021 As of September 30, 2021
Assets
Current assets
Cash and deposits 307,633 265,984
Notes and accounts receivable - trade 602,162 638,158
Inventories - real estate for sale 78,214 67,198
Inventories - construction projects in progress 54,938 13,613
Inventories - development projects in progress 103,505 127,662
Inventories - other 17,094 4,172
Other 100,374 120,609
Allowance for doubtful accounts (980) (1,009)
Total current assets 1,262,942 1,236,390
Noncurrent assets
Property and equipment
Land 232,311 245,487
Other - net 185,643 198,199
Total property and equipment 417,955 443,686
Intangible assets 11,330 11,706
Investments and other assets
Investments in securities 350,351 355,421
Other 125,430 133,988
Allowance for doubtful accounts (3,203) (3,138)
Total investments and other assets 472,578 486,271
Total noncurrent assets 901,863 941,663
Total assets 2,164,806 2,178,054
-1-

(JPY mil)
As of March 31, 2021 As of September 30, 2021
Liabilities
Current liabilities
Notes and accounts payable - trade 445,589 448,319
Short-term loans payable 143,416 139,037
Current portion of bonds payable 10,000 -
Advances received on construction projects in progress 146,103 144,549
Provision 27,727 25,924
Other 217,242 205,090
Total current liabilities 990,080 962,921
Long-term liabilities
Bonds payable 40,000 40,000
Long-term loans payable 123,616 118,689
Liability for retirement benefits 62,575 63,063
Other 63,728 65,552
Total long-term liabilities 289,919 287,305
Total liabilities 1,280,000 1,250,226
Equity
Shareholders' equity
Common stock 81,447 81,447
Capital surplus 43,271 43,316
Retained earnings 654,128 690,753
Treasury stock (26,172) (35,917)
Total shareholders' equity 752,675 779,600
Accumulated other comprehensive income (loss)
Unrealized gain (loss) on available-for-sale securities 112,242 112,514
Deferred gain (loss) on derivatives under hedge accounting (659) (323)
Revaluation surplus of land 21,498 21,498
Foreign currency translation adjustments (10,352) 3,771
Defined retirement benefit plans (565) (422)
Total accumulated other comprehensive income (loss) 122,163 137,039
Noncontrolling interests 9,967 11,188
Total equity 884,806 927,827
Total liabilities and equity 2,164,806 2,178,054
-2-
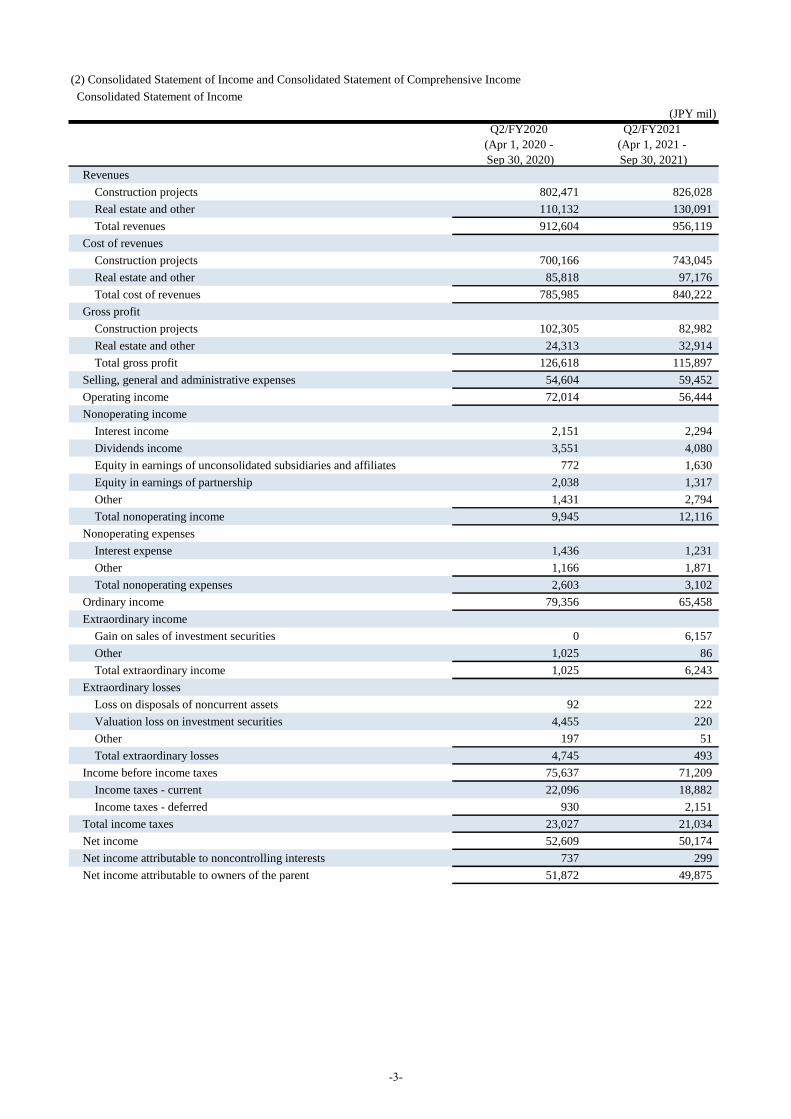
(2) Consolidated Statement of Income and Consolidated Statement of Comprehensive Income
Consolidated Statement of Income
(JPY mil)
Q2/FY2020
(Apr 1, 2020 -
Sep 30, 2020)
Q2/FY2021
(Apr 1, 2021 -
Sep 30, 2021)
Revenues
Construction projects 802,471 826,028
Real estate and other 110,132 130,091
Total revenues 912,604 956,119
Cost of revenues
Construction projects 700,166 743,045
Real estate and other 85,818 97,176
Total cost of revenues 785,985 840,222
Gross profit
Construction projects 102,305 82,982
Real estate and other 24,313 32,914
Total gross profit 126,618 115,897
Selling, general and administrative expenses 54,604 59,452
Operating income 72,014 56,444
Nonoperating income
Interest income 2,151 2,294
Dividends income 3,551 4,080
Equity in earnings of unconsolidated subsidiaries and affiliates 772 1,630
Equity in earnings of partnership 2,038 1,317
Other 1,431 2,794
Total nonoperating income 9,945 12,116
Nonoperating expenses
Interest expense 1,436 1,231
Other 1,166 1,871
Total nonoperating expenses 2,603 3,102
Ordinary income 79,356 65,458
Extraordinary income
Gain on sales of investment securities 0 6,157
Other 1,025 86
Total extraordinary income 1,025 6,243
Extraordinary losses
Loss on disposals of noncurrent assets 92 222
Valuation loss on investment securities 4,455 220
Other 197 51
Total extraordinary losses 4,745 493
Income before income taxes 75,637 71,209
Income taxes - current 22,096 18,882
Income taxes - deferred 930 2,151
Total income taxes 23,027 21,034
Net income 52,609 50,174
Net income attributable to noncontrolling interests 737 299
Net income attributable to owners of the parent 51,872 49,875
-3-

Consolidated Statement of Comprehensive Income
(JPY mil)
Q2/FY2020
(Apr 1, 2020 -
Sep 30, 2020)
Q2/FY2021
(Apr 1, 2021 -
Sep 30, 2021)
Net income 52,609 50,174
Other comprehensive income (loss)
Unrealized gain (loss) on available-for-sale securities 8,094 272
Deferred gain (loss) on derivatives under hedge accounting (141) 205
Foreign currency translation adjustments (6,978) 14,917
Defined retirement benefit plans 163 128
Share of other comprehensive income (loss) in unconsolidated
subsidiaries and affiliates1,095 (3)
Total other comprehensive income (loss) 2,232 15,521
Comprehensive income (loss) 54,842 65,696
Total comprehensive income (loss) attributable to:
Owners of the parent 54,209 64,750
Noncontrolling interests 632 945
-4-

(3) Consolidated Statement of Cash Flows
(JPY mil)
Q2/FY2020
(Apr 1, 2020 -
Sep 30, 2020)
Q2/FY2021
(Apr 1, 2021 -
Sep 30, 2021)
Operating activities
Income before income taxes 75,637 71,209
Depreciation and amortization 9,197 10,512
Increase (decrease) in allowance for doubtful accounts 72 38
Increase (decrease) in other provision (924) (3,801)
Increase (decrease) in liability for retirement benefits 944 584
Interest and dividends income (5,703) (6,374)
Interest expense 1,436 1,231
Equity in earnings of unconsolidated subsidiaries and affiliates (772) (1,630)
Loss (gain) on sales or disposals of noncurrent assets - net (927) 143
Loss (gain) on sales of investment securities - net 180 (6,153)
Valuation loss (gain) on investment securities 4,452 213
Decrease (increase) in receivables 225,000 9,037
Decrease (increase) in inventories - real estate for sale 8,530 29,714
Decrease (increase) in inventories - construction projects in progress (6,932) (6,167)
Decrease (increase) in inventories - development projects in progress (29,674) (38,452)
Decrease (increase) in inventories - other (4,673) 19
Increase (decrease) in payables (93,347) 12,206
Increase (decrease) in advances received 17,147 14,039
Other - net 20,318 (24,602)
Sub-total 219,962 61,768
Interest and dividends income - received 5,671 6,823
Interest expense - paid (1,490) (1,158)
Income taxes - paid (28,715) (32,297)
Net cash provided by (used in) operating activities 195,427 35,135
Investing activities
Decrease (increase) in time deposits excluding cash equivalents - net 2,851 (3,455)
Payment for purchases of property and equipment (15,007) (31,470)
Proceeds from sales of property and equipment 1,732 2,262
Payment for purchases of intangible assets (1,280) (1,941)
Payment for purchases of investment securities (2,416) (2,987)
Proceeds from sales and redemption of investment securities 156 8,879
Disbursements for loans (15,895) (8,590)
Proceeds from collection of loans 1,543 6,619
Other - net (2,924) (3,444)
Net cash provided by (used in) investing activities (31,241) (34,129)
Financing activities
Increase (decrease) in short-term loans - net 21,759 (11,146)
Issuance (repayment) of commercial paper - net (45,000) -
Proceeds from long-term loans 17,617 21,572
Repayment of long-term loans (11,642) (27,454)
Redemption of bonds - (10,000)
Repayment of lease obligations (986) (1,104)
Payment for purchases of treasury stock (2) (10,003)
Cash dividends paid (12,814) (14,655)
Capital infusion from noncontrolling shareholders 4,969 536
Dividends paid to noncontrolling shareholders (1,265) (323)
(230) -
Net cash provided by (used in) financing activities (27,596) (52,579)
Foreign currency translation adjustments on cash and cash equivalents (2,639) 5,997
Net increase (decrease) in cash and cash equivalents 133,950 (45,576)
Cash and cash equivalents, beginning of period 255,646 300,991
Cash and cash equivalents, end of period 389,596 255,414
Payment for purchases of shares of subsidiaries not resulting in change in
scope of consolidation
-5-

Changes in accounting policies
Application of “Accounting Standard for Revenue Recognition”
Application of “Accounting Standard for Fair Value Measurement”
* ASBJ: The Accounting Standards Board of Japan
Segment Information
Information about Revenues, Profit (Loss) and Other Items
Q2/FY2021 (April 1, 2021 - September 30, 2021) (JPY mil)
Civil
Engineering
Building
Construction
Real Estate
Development
and Other
Domestic
Subsidiaries
and Affiliates
Overseas
Subsidiaries
and Affiliates
Total Reconciliations Consolidated
Revenues:
Sales to external
customers130,949 408,809 17,065 101,988 297,306 956,119 - 956,119
Intersegment sales or
transfers- 848 2,122 43,556 528 47,055 (47,055) -
Total 130,949 409,657 19,187 145,544 297,834 1,003,174 (47,055) 956,119
Segment profit 8,939 21,848 3,592 6,832 14,943 56,156 288 56,444
The Company and its domestic subsidiaries (the “Companies”) have applied “Accounting Standard for Revenue Recognition”
(ASBJ Statement No. 29 revised on March 31, 2020; hereinafter the “Revenue Recognition Standard”) and relevant implementation
guidance from the beginning of the Q1/FY2021. Accordingly, the Companies recognize revenue as the amount expected to be
entitled in exchange for the promised goods or services when the control of those goods or services is transferred to the customer.
In accordance with the transitional treatment stipulated in the proviso of paragraph 84 of the Revenue Recognition Standard, the
cumulative effects of retrospective application of the new accounting policy, assuming it has been applied to periods prior to the
beginning of the Q1/FY2021, has been added to or subtracted from retained earnings at the beginning of the Q1/FY2021, and the
new accounting policy is applied from the said balance.
As a result, “Retained earnings” increased by JPY 1,404 million on the consolidated balance sheet at the beginning of the
Q1/FY2021. In addition, the other major impacts to the consolidated balance sheet at the beginning of the Q1/FY2021 include
decreases in “Inventories – construction projects in progress” by JPY 47,621 million, “Advances received on construction projects in
progress” by JPY 16,503 million, “Notes and accounts payable – trade” by JPY 15,554 million, and “Inventories – other” by JPY
12,909 million as well as an increase in “Notes and accounts receivable – trade” by JPY 27,219 million.
The Companies have applied “Accounting Standard for Fair Value Measurement” (ASBJ Statement No. 30 issued on July 4,
2019) and relevant accounting standards and implementation guidance from the beginning of the Q1/FY2021. In accordance with
the transitional treatment stipulated in paragraph 19 of the “Accounting Standard for Fair Value Measurement” and paragraph 44-2
of the “Accounting Standard for Financial Instruments” (ASBJ Statement No. 10 revised on July 4, 2019), the new accounting policy
set forth by the “Accounting Standard for Fair Value Measurement”, etc. is applied into the future.
The application of the new accounting policy had an immaterial impact on the consolidated financial statements for Q2/FY2021.
-6-

Nonconsolidated Financial Statements
(1) Nonconsolidated Balance Sheet
(JPY mil)
As of March 31, 2021 As of September 30, 2021
Assets
Current assets
Cash and deposits 170,329 132,397
Notes and accounts receivable - trade 449,270 467,866
Inventories - real estate for sale 24,522 23,739
Inventories - construction projects in progress 30,848 8,820
Inventories - development projects in progress 70,996 62,653
Other 64,658 78,709
Allowance for doubtful accounts (88) (85)
Total current assets 810,537 774,102
Noncurrent assets
Property and equipment
Land 186,306 186,167
Other - net 96,012 103,893
Total property and equipment 282,319 290,061
Intangible assets 6,837 6,576
Investments and other assets
Investments in securities 430,611 438,091
Other 34,600 41,417
Allowance for doubtful accounts (5,996) (5,996)
Total investments and other assets 459,214 473,511
Total noncurrent assets 748,371 770,149
Total assets 1,558,909 1,544,251
-7-

(JPY mil)
As of March 31, 2021 As of September 30, 2021
Liabilities
Current liabilities
Notes and accounts payable - trade 295,583 303,315
Short-term loans payable 59,875 60,375
Current portion of bonds payable 10,000 -
Advances received on construction projects in progress 110,381 101,684
Provision for warranties for completed construction projects 11,733 10,913
Provision for loss on construction projects in progress 14,070 13,680
Other 205,508 190,415
Total current liabilities 707,151 680,384
Long-term liabilities
Bonds payable 40,000 40,000
Long-term loans payable 67,654 66,954
Liability for retirement benefits 54,162 54,681
Allowance for loss on investments in subsidiaries and affiliates 213 213
Other 51,292 54,550
Total long-term liabilities 213,321 216,399
Total liabilities 920,473 896,783
Equity
Shareholders' equity
Common stock 81,447 81,447
Capital surplus 45,530 45,575
Retained earnings 410,103 428,769
Treasury stock (25,597) (35,342)
Total shareholders' equity 511,483 520,449
Valuation and translation adjustments
Unrealized gain (loss) on available-for-sale securities 106,869 106,935
Revaluation surplus of land 20,082 20,082
Total valuation and translation adjustments 126,951 127,018
Total equity 638,435 647,467
Total liabilities and equity 1,558,909 1,544,251
-8-

(2) Nonconsolidated Statement of Income
(JPY mil)
Q2/FY2020
(Apr 1, 2020 -
Sep 30, 2020)
Q2/FY2021
(Apr 1, 2021 -
Sep 30, 2021)
Revenues
Construction projects 544,898 540,607
Real estate and other 32,571 19,187
Total revenues 577,469 559,795
Cost of revenues
Construction projects 462,971 478,916
Real estate and other 23,193 14,342
Total cost of revenues 486,165 493,258
Gross profit
Construction projects 81,927 61,691
Real estate and other 9,377 4,845
Total gross profit 91,304 66,536
Selling, general and administrative expenses 30,105 32,156
Operating income 61,198 34,379
Nonoperating income 8,497 9,016
Nonoperating expenses 1,829 1,926
Ordinary income 67,867 41,470
Extraordinary income 990 4,167
Extraordinary losses 3,432 435
Income before income taxes 65,425 45,202
Income taxes 18,537 12,793
Net income 46,887 32,409
(Note) The Company has applied “Accounting Standard for Revenue Recognition” (ASBJ Statement No. 29 revised on March 31,
2020) and relevant implementation guidance from the beginning of the Q1/FY2021. As a result, “Retained earnings” increased
by JPY 939 million on the nonconsolidated balance sheet at the beginning of the Q1/FY2021.
-9-

Financial Highlights
Operating Results
Consolidated
JPY bil Ratio JPY bil Ratio JPY bil %
Revenues 912.6 956.1 43.5 4.8
Construction 802.4 826.0 23.5 2.9
Real estate and other 110.1 130.0 19.9 18.1
Gross profit 126.6 13.9% 115.8 12.1% (10.7) (8.5)
Construction 102.3 12.7% 82.9 10.0% (19.3) (18.9)
Real estate and other 24.3 22.1% 32.9 25.3% 8.6 35.4
54.6 59.4 4.8 8.9
Operating income 72.0 7.9% 56.4 5.9% (15.5) (21.6)
Nonoperating income - net 7.3 9.0 1.6
Financing 4.2 5.1 0.8
Ordinary income 79.3 8.7% 65.4 6.8% (13.8) (17.5)
Extraordinary income - net (3.7) 5.7 9.4
51.8 5.7% 49.8 5.2% (1.9) (3.8)
Construction contract awards 703.4 807.1 103.7 14.7
Domestic 472.9 549.4 76.4 16.2
Overseas 230.4 257.7 27.2 11.8
JPY bil %
Interest-bearing debt (19.3) (6.1)
Nonconsolidated
JPY bil Ratio JPY bil Ratio JPY bil %
Revenues 577.4 559.7 (17.6) (3.1)
Construction 544.8 540.6 (4.2) (0.8)
Civil engineering 160.6 130.9 (29.6) (18.5)
Building construction 384.2 409.6 25.3 6.6
Real estate and other 32.5 19.1 (13.3) (41.1)
Gross profit 91.3 15.8% 66.5 11.9% (24.7) (27.1)
Construction 81.9 15.0% 61.6 11.4% (20.2) (24.7)
Civil engineering 28.3 17.6% 19.3 14.7% (9.0) (31.9)
Building construction 53.6 13.9% 42.3 10.3% (11.2) (20.9)
Real estate and other 9.3 28.8% 4.8 25.3% (4.5) (48.3)
30.1 32.1 2.0 6.8
Operating income 61.1 10.6% 34.3 6.1% (26.8) (43.8)
Nonoperating income - net 6.6 7.0 0.4
Financing 6.4 6.2 (0.2)
Ordinary income 67.8 11.8% 41.4 7.4% (26.3) (38.9)
Extraordinary income - net (2.4) 3.7 6.1
Net income 46.8 8.1% 32.4 5.8% (14.4) (30.9)
Contract awards 434.7 515.1 80.3 18.5
Construction 405.1 488.5 83.3 20.6
Civil engineering 117.5 121.6 4.1 3.5
Building construction 287.6 366.8 79.2 27.5
Real estate and other 29.5 26.6 (2.9) (10.1)
JPY bil %
Interest-bearing debt (10.2) (5.7)
Selling, general and
administrative expenses
Selling, general and
administrative expenses
Net income attributable to
owners of the parent
Q2 / FY2020 Q2 / FY2021Change
(Apr 1, 2020 - Sep 30, 2020) (Apr 1, 2021 - Sep 30, 2021)
As of March 31, 2021 As of September 30, 2021
Q2 / FY2020 Q2 / FY2021Change
(Apr 1, 2020 - Sep 30, 2020) (Apr 1, 2021 - Sep 30, 2021)
177.5 167.3
As of March 31, 2021 As of September 30, 2021 Change
JPY bil JPY bil
Change
JPY bil JPY bil
317.0 297.7
-10-

Financial Highlights - continued
Forecast of Operating Results
Consolidated
JPY bil Ratio JPY bil Ratio JPY bil % JPY bil Ratio
Revenues 1,907.1 2,050.0 142.8 7.5 2,010.0
Construction 1,673.5 1,806.0 132.4 7.9 1,799.0
Real estate and other 233.5 244.0 10.4 4.5 211.0
Gross profit 241.4 12.7% 235.0 11.5% (6.4) (2.7) 224.0 11.1%
Construction 196.0 11.7% 179.0 9.9% (17.0) (8.7) 182.0 10.1%
Real estate and other 45.4 19.4% 56.0 23.0% 10.5 23.3 42.0 19.9%
114.1 125.5 11.3 10.0 120.0
Operating income 127.2 6.7% 109.5 5.3% (17.7) (14.0) 104.0 5.2%
Nonoperating income - net 12.4 10.5 (1.9) 10.0
Financing 8.0 5.6 (2.4) 5.9
Ordinary income 139.7 7.3% 120.0 5.9% (19.7) (14.1) 114.0 5.7%
Extraordinary income - net 5.5 8.0 2.4 1.5
98.5 5.2% 86.0 4.2% (12.5) (12.7) 80.0 4.0%
Construction contract awards 1,720.1 1,900.0 179.8 10.5 1,780.0
Domestic 1,329.8 1,335.0 5.1 0.4 1,340.0
Overseas 390.2 565.0 174.7 44.8 440.0
JPY bil %
Interest-bearing debt 112.9 35.6
Nonconsolidated
JPY bil Ratio JPY bil Ratio JPY bil % JPY bil Ratio
Revenues 1,189.5 1,230.0 40.4 3.4 1,250.0
Construction 1,117.0 1,185.0 67.9 6.1 1,205.0
Civil engineering 334.7 275.0 (59.7) (17.9) 285.0
Building construction 782.2 910.0 127.7 16.3 920.0
Real estate and other 72.5 45.0 (27.5) (37.9) 45.0
Gross profit 171.1 14.4% 149.0 12.1% (22.1) (13.0) 152.0 12.2%
Construction 151.5 13.6% 137.0 11.6% (14.5) (9.6) 140.0 11.6%
Civil engineering 51.9 15.5% 41.5 15.1% (10.4) (20.1) 43.0 15.1%
Building construction 99.5 12.7% 95.5 10.5% (4.0) (4.1) 97.0 10.5%
Real estate and other 19.6 27.1% 12.0 26.7% (7.6) (39.0) 12.0 26.7%
66.0 70.0 3.9 6.0 67.5
Operating income 105.1 8.8% 79.0 6.4% (26.1) (24.9) 84.5 6.8%
Nonoperating income - net 9.1 8.0 (1.1) 8.0
Financing 9.5 9.0 (0.5) 9.0
Ordinary income 114.2 9.6% 87.0 7.1% (27.2) (23.9) 92.5 7.4%
Extraordinary income - net 4.4 4.0 (0.4) 0.0
Net income 82.8 7.0% 63.0 5.1% (19.8) (23.9) 66.0 5.3%
Contract awards 1,265.2 1,280.0 14.7 1.2 1,280.0
Construction 1,205.3 1,230.0 24.6 2.0 1,230.0
Civil engineering 338.0 310.0 (28.0) (8.3) 310.0
Building construction 867.2 920.0 52.7 6.1 920.0
Real estate and other 59.8 50.0 (9.8) (16.4) 50.0
JPY bil %
Interest-bearing debt 22.4 12.7
ChangeResult Forecast
JPY bil JPY bil
Selling, general and
administrative expenses
Selling, general and
administrative expenses
Net income attributable to
owners of the parent
FY2020 Result FY2021 Forecast
As of March 31, 2021 As of March 31, 2022
FY2020 Result FY2021 ForecastChange
(Apr 1, 2020 - Mar 31, 2021) (Apr 1, 2021 - Mar 31, 2022)
Change(Apr 1, 2020 - Mar 31, 2021) (Apr 1, 2021 - Mar 31, 2022)
FY2021
Previous Forecast(announced on May 14, 2021)
FY2021
Previous Forecast(announced on May 14, 2021)
FY2021
Previous Forecast(announced on May 14, 2021)
JPY bil
430.0
ChangeResult Forecast
317.0 430.0
177.5 200.0
FY2021
Previous Forecast(announced on May 14, 2021)
JPY bil
200.0
JPY bil JPY bil
As of March 31, 2021 As of March 31, 2022
-11-

Financial Highlights - continued
Forecast of Contract Awards
Nonconsolidated
JPY bil Proportion JPY bil Proportion JPY bil % JPY bil Proportion
Civil engineering
Domestic 337.7 26.7% 300.0 23.4% (37.7) (11.2) 300.0 23.4%
Overseas 0.3 0.0% 10.0 0.8% 9.6 - 10.0 0.8%
Sub-total 338.0 26.7% 310.0 24.2% (28.0) (8.3) 310.0 24.2%
Building construction
Domestic 867.2 68.6% 920.0 71.9% 52.7 6.1 920.0 71.9%
Overseas - - - - - - - -
Sub-total 867.2 68.6% 920.0 71.9% 52.7 6.1 920.0 71.9%
Construction total
Domestic 1,205.0 95.3% 1,220.0 95.3% 14.9 1.2 1,220.0 95.3%
Overseas 0.3 0.0% 10.0 0.8% 9.6 - 10.0 0.8%
Sub-total 1,205.3 95.3% 1,230.0 96.1% 24.6 2.0 1,230.0 96.1%
Real estate and other 59.8 4.7% 50.0 3.9% (9.8) (16.4) 50.0 3.9%
Grand total 1,265.2 100% 1,280.0 100% 14.7 1.2 1,280.0 100%
FY2021 ForecastChange
FY2021
Previous Forecast(announced on May 14, 2021)
(Apr 1, 2021 - Mar 31, 2022)
FY2020 Result
(Apr 1, 2020 - Mar 31, 2021)
-12-

Supplementary Information:
Contract Awards, Revenues and Contract Backlogs (Nonconsolidated)
(1) Breakdown of Contract Awards (Nonconsolidated)
JPY mil Proportion JPY mil Proportion JPY mil % JPY mil Proportion
Civil engineering
Domestic - Public 51,398 11.8% 72,978 14.1% 21,579 42.0 159,892 12.6%
Domestic - Private 65,988 15.2% 48,687 9.5% (17,300) (26.2) 177,868 14.1%
Overseas 162 0.0% 21 0.0% (141) (86.9) 327 0.0%
Sub-total 117,549 27.0% 121,687 23.6% 4,138 3.5 338,088 26.7%
Building construction
Domestic - Public 24,479 5.7% 24,093 4.7% (385) (1.6) 37,986 3.1%
Domestic - Private 263,129 60.5% 342,722 66.5% 79,593 30.2 829,305 65.5%
Overseas - - - - - - - -
Sub-total 287,608 66.2% 366,816 71.2% 79,208 27.5 867,291 68.6%
Construction total
Domestic - Public 75,877 17.5% 97,072 18.8% 21,194 27.9 197,878 15.7%
Domestic - Private 329,118 75.7% 391,410 76.0% 62,292 18.9 1,007,173 79.6%
Overseas 162 0.0% 21 0.0% (141) (86.9) 327 0.0%
Sub-total 405,158 93.2% 488,504 94.8% 83,346 20.6 1,205,379 95.3%
Real estate and other 29,592 6.8% 26,613 5.2% (2,978) (10.1) 59,820 4.7%
Grand total 434,750 100% 515,118 100% 80,367 18.5 1,265,200 100%
(2) Breakdown of Revenues (Nonconsolidated)
JPY mil Proportion JPY mil Proportion JPY mil % JPY mil Proportion
Civil engineering
Domestic - Public 79,325 13.7% 67,054 12.0% (12,271) (15.5) 162,763 13.6%
Domestic - Private 80,919 14.0% 63,940 11.4% (16,978) (21.0) 171,254 14.4%
Overseas 377 0.1% (45) (0.0%) (422) - 773 0.1%
Sub-total 160,622 27.8% 130,949 23.4% (29,672) (18.5) 334,791 28.1%
Building construction
Domestic - Public 31,858 5.6% 17,495 3.1% (14,362) (45.1) 62,459 5.3%
Domestic - Private 352,417 61.0% 392,162 70.1% 39,744 11.3 719,793 60.5%
Overseas - - - - - - - -
Sub-total 384,275 66.6% 409,657 73.2% 25,382 6.6 782,253 65.8%
Construction total
Domestic - Public 111,183 19.3% 84,550 15.1% (26,633) (24.0) 225,222 18.9%
Domestic - Private 433,336 75.0% 456,102 81.5% 22,765 5.3 891,048 74.9%
Overseas 377 0.1% (45) (0.0%) (422) - 773 0.1%
Sub-total 544,898 94.4% 540,607 96.6% (4,290) (0.8) 1,117,045 93.9%
Real estate and other 32,571 5.6% 19,187 3.4% (13,383) (41.1) 72,516 6.1%
Grand total 577,469 100% 559,795 100% (17,674) (3.1) 1,189,562 100%
FY2020
(Apr 1, 2020 - Mar 31, 2021)
Q2 / FY2020 Q2 / FY2021Change
FY2020
(Apr 1, 2020 - Sep 30, 2020) (Apr 1, 2021 - Sep 30, 2021) (Apr 1, 2020 - Mar 31, 2021)
Q2 / FY2020 Q2 / FY2021Change
(Apr 1, 2020 - Sep 30, 2020) (Apr 1, 2021 - Sep 30, 2021)
-13-

(3) Breakdown of Contract Backlogs (Nonconsolidated)
Changes due to
application of
“Accounting
Standard for Revenue
Recognition”
JPY mil Proportion JPY mil Proportion JPY mil % JPY mil Proportion JPY mil
Civil engineering
Domestic - Public 307,017 18.6% 331,511 18.7% 24,494 8.0 332,074 17.8% (6,485)
Domestic - Private 214,367 12.9% 220,331 12.4% 5,963 2.8 235,911 12.6% (327)
Overseas 2,657 0.2% 1,162 0.1% (1,494) (56.2) 2,427 0.1% (1,330)
Sub-total 524,042 31.7% 553,005 31.2% 28,963 5.5 570,412 30.5% (8,144)
Building construction
Domestic - Public 81,466 4.9% 69,431 3.9% (12,035) (14.8) 64,372 3.4% (1,538)
Domestic - Private 994,079 60.3% 1,124,272 63.4% 130,193 13.1 1,192,878 63.9% (19,166)
Overseas - - - - - - - - -
Sub-total 1,075,546 65.2% 1,193,704 67.3% 118,158 11.0 1,257,250 67.3% (20,705)
Construction total
Domestic - Public 388,484 23.5% 400,943 22.6% 12,459 3.2 396,446 21.2% (8,024)
Domestic - Private 1,208,446 73.2% 1,344,603 75.8% 136,157 11.3 1,428,790 76.5% (19,494)
Overseas 2,657 0.2% 1,162 0.1% (1,494) (56.2) 2,427 0.1% (1,330)
Sub-total 1,599,588 96.9% 1,746,710 98.5% 147,121 9.2 1,827,663 97.8% (28,849)
Real estate and other 51,168 3.1% 25,850 1.5% (25,318) (49.5) 41,451 2.2% (23,026)
Grand total 1,650,756 100% 1,772,560 100% 121,803 7.4 1,869,114 100% (51,876)
ChangeAs of September 30, 2020 As of September 30, 2021 As of March 31, 2021
-14-