results of 1h fy2015 - shizuoka bankresults of 1h fy2015 -nonconsolidated nonconsolidated 1h fy2015...
TRANSCRIPT

Results of 1H FY2015
Nov. 16, 2015
Katsunori Nakanishi
President
Shizuoka Bank, Ltd.

Contents Results of 1H FY2015
●Results of 1H FY2015 -Nonconsolidated ・・・・・・ 1
●Results of 1H FY2015 -Consolidated ・・・・・・ 2
●Net interest income and loan rate ・・・・・・ 3
●Loan rates for Retail Banking ・・・・・・ 4
●Loans (average balance) ・・・・・・ 5
●Loans excluding government-related loans (average balance)
・・・・・・ 6
●Initiatives for Corporate Banking ・・・・・・ 7
●Initiatives for Retail Banking ・・・・・・ 8
●Deposits ・・・・・・ 9
●Customer assets and fee incomes ・・・・・・ 10
●Shizugin TM Securities Co., Ltd. ・・・・・・ 11
●Securities ・・・・・・ 12
●Credit-related costs ・・・・・・ 13
●Risk-management loans ・・・・・・ 14
●Expenses and Strategic investments ・・・・・・ 15
●Capital adequacy ratio ・・・・・・ 16
●Shareholder return ・・・・・・ 17
●Shareholder return - Share buybacks, Trends in EPS/BPS ・・・・・・ 18
Progress in the 12th Medium-term Business Plan
●Progress in the 12th Medium-term Business Plan ・・・・・・ 19
●New business development
with different types of business companies ・・・・・・ 20
●Direction of the new business development ・・・・・・ 21
Projected performance in FY2015
●Projected performance in FY2015 ・・・・・・ 22
Reference
●Overview of the 12th Medium-term Business Plan ・・・・・・ 23
●Net operating profit ・・・・・・ 24
●Loans (term-end balance) ・・・・・・ 25
●Loans - Loans by industries ・・・・・・ 26
●Global network ・・・・・・ 27
●Improvement of productivity - BPR ・・・・・・ 28
●Allocation of risk capital ・・・・・・ 29
●Group companies ・・・・・・ 30
●Loans ・・・・・・ 31
●Deposits ・・・・・・ 32
●Profit levels and improvement of productivity ・・・・・・ 33
●Region-based Relationship Banking ・・・・・・ 34
●Initiatives for Regional revitalization ・・・・・・ 35
●Corporate Governance Structure ・・・・・・ 36
●Strategic shareholdings ・・・・・・ 37
●Economic scale of Shizuoka Prefecture ・・・・・・ 38
●Economy in Shizuoka Prefecture and current state ・・・・・・ 39
Results of 1H FY2015

Results of 1H FY2015 -Nonconsolidated Nonconsolidated
1H FY2015
YoY Change
(JPY bn,%) Increase/ Decrease
Rate of change
Ordinary revenue 103.5 +8.1 +8.5
Gross operating profit 79.0 -0.2 -0.2
Net interest income
Fees and commissions Trading income Other operating profit [Gains and losses on bonds such as JGBs]
63.5
7.8
0.4
7.2
6.5
+5.3
+0.2
+0.2
-5.8
-5.8
+9.1
+2.1
+85.7
-44.6
-47.3
Expenses (-) 39.9 -1.1 -2.8
Actual net operating profit* 39.0 +1.0 +2.5
Provision for general allowance for loan losses (-) -0.2 -0.2 -
Net operating profit 39.3 +1.2 +3.1
Special profit and loss -1.0 -5.2 -125.4
Bad debt written-off (-)
Gain on reversals from loan loss reserves
Gain (loss) on stocks
2.6
-
1.9
+2.3
-1.4
-0.8
+818.3
-100.0
-30.0
Ordinary profit 38.2 -4.0 -9.4
Extraordinary profit and loss -8.4 +0.4 +5.0
Net income before taxes 29.9 -3.5 -10.6
Corporate taxes (-) 11.8 -1.8 -13.1
Net income 18.1 -1.8 -8.8
1
Net income decreased JPY 1.8bn to JPY 18.1bn due to a decrease
in corporate taxes (-JPY 1.8bn) reflecting a decline in corporate tax
rate, despite the decrease in ordinary profit (-JPY 4.0bn).
As in 1H FY2014, loss on valuation of stocks of subsidiaries and
affiliates (-JPY 8.3bn) was recorded in the section of extraordinary
profit and loss.
Net operating profit +JPY 1.2bn YoY (First increase in 2 periods)
Ordinary profit -JPY 4.0bn YoY (First decrease in 3 periods)
Net income -JPY 1.8bn YoY (Continued decrease in 2 periods)
Ordinary revenue +JPY 8.1bn YoY (First increase in 2 periods)
Ordinary revenue rose JPY 8.1bn year on year to JPY 103.5bn,
mainly due to an increase in interest income (+JPY 5.8bn).
Gross operating profit
-JPY 0.2bn YoY (Continued decrease in 2 periods)
Gross operating profit declined JPY 0.2bn year on year to JPY
79.0bn reflecting a decrease in other operating profit (-JPY 5.8bn)
mainly due to an increase in loss on sell of bonds such as JGBs,
despite an increase in net interest income (+JPY 5.3bn) mainly due
to an increase in gain on cancellation of investment trusts.
Net operating profit increased JPY 1.2bn year on year to JPY 39.3bn,
mainly due to a decrease in expenses (-JPY 1.1bn)
Ordinary profit decreased JPY 4.0bn to JPY 38.2bn because NPL
disposal increased (+JPY 2.3bn) due to having no gain on reversals
from loan loss reserves (1H FY2014: JPY 1.4bn) recorded.
*Actual net operating profit = Net operating profit + Provision for general allowance for loan losses

Results of 1H FY2015 -Consolidated
1H
FY2015
YoY change
Contents Consolidated (JPY bn, %)
Increase/ Decrease
Rate of change
Ordinary revenue 120.7 +8.1 +7.2 First increase in 2 periods Mainly due to increase in interest income and gain on sale of bonds such as JGBs.
Ordinary profit 31.8 -5.1 -13.9 Continued decrease in 2 periods Due to increase in loss on sale of bonds such as JGBs.
Net income (Excluding gains on negative goodwill)
18.5 (18.5)
-5.8 (-3.5)
-23.8 (-16.0)
Continued decrease in 3 periods Because of not recording the contribution amount of increase in ownership ratio: JPY2.3bn
1H FY 2015
YOY change Increase/Decrease
Ordinary profit 0.83times -0.04times
Net income (Excluding gains on negative goodwill )
1.02times
(1.02times)
-0.20times
(-0.08times)
2 2
Ordinary revenue rose JPY +8.1bn YoY to JPY 120.7bn, ordinary profit declined JPY -5.1bn YoY to JPY 31.8bn
As Shizugin TM Securities Co., Ltd. (securities subsidiary) highly contributed to group business performance, total of all group companies’ ordinary profit increased by JPY +0.8bn YoY to 4.4bn (Shizugin TM Securities Co., Ltd.: Ordinary profit in 1H FY2015: JPY 2.1bn, +0.3bn YoY)
Group Companies
(JPY bn)
【Total ordinary profit of consolidated subsidiaries】 【Increase in ownership ratio】 Raised the ownership ratio of 6 consolidated subsidiaries, such as Shizugin Lease Co., Ltd., to 100%
in order to expand consolidated net income and closely tie up consolidated subsidiaries. We have full
controlled ownership in 11 subsidiaries excluding Shizuoka Capital Co., Ltd. Since FY2014.
5.1 5.1
6.67.6
7.9
0
1
2
3
4
5
6
7
8
9
10
FY2010 FY2011 FY2012 FY2013 FY2014 FY2015
Consolidated / Nonconsolidated ratio
(Figures in parentheses are results in the 1H of the fiscal year)
(3.6)
(4.4)
Consolidated Subsidiaries
Shizugin Management Consulting Co., Ltd. Shizugin TM Securities Co., Ltd.
Shizugin Lease Co., Ltd. Shizuoka Bank (Europe) S.A.
Shizuoka Computer Service Co., Ltd. Shizugin General Service Co., Ltd.
Shizugin Credit Guaranty Co., Ltd. Shizugin Mortgage Service Co., Ltd.
Shizugin DC Card Co., Ltd. Shizugin Business Create Co., Ltd.
Shizuoka Capital Co., Ltd. Shizuoka Liquidity Reserve Limited

Net interest income and loan rate
Spread between investments and procurements
0.79 0.75 -0.04
3
1H FY2014 1H FY2015 YoY change
Loan rate 1.30 1.27 -0.03 Deposit rate 0.04 0.05 +0.01
Yield on securities 1.28 2.63 +1.35
3
(%)
(%)
Daily interest on loans(Quarterly period)
〔Domestic
Operations〕
〔Oversea Operations〕
253252
250 250250 250
1Q 2014 2Q 2014 3Q 2014 4Q 2014 1Q 2015 2Q 2015
Interest on loans (in JPY and other currencies)
(JPY mil)
Average
balance
Average
interest rate Share
Loans 6,698.4 100.0 1.31
Of which floating rate 5,120.5 76.4 1.32
Of which fixed rate 1,577.8 23.6 1.27
Net interest income of 1H FY2015: JPY 63.5bn (+JPY 5.3bn YoY)
The interest on loans is almost the same as in 1H FY2014 and is about to stop declining
Break down of net interest income
Loan rates (monthly average)
1.271.23
1.18 1.171.12 1.12
1.301.301.311.35
1.31
1.47
1.32
1.441.36
1.321.33
1.41
1.50
1.131.13
1.291.32
1.15 1.151.15
1.76 1.73 1.69 1.66 1.641.56 1.56
1.79
1.581.61 1.59 1.57 1.57
Sep.2012
Dec. Mar2013
Jun. Sep. Dec. Mar2014
Jun. Sep. Dec. Mar.2015
Jun. Sep.
Corporate
Total
Retail
Loan and Deposit rate
Portfolio of JPY denominated loans as the end of Sep. 2015
A 1.0% increase in short-term interest rate will result in an increase of JPY20.0bn in net interest income
(JPY bn,%)
1H FY2014
1H FY2015 (JPY bn) YoY change
Total 58.2 63.5 +5.3
Domestic operations 52.1 56.2 +4.1
Interest on loans 43.4 42.3 -1.1
Interest and dividends on securities 10.5 15.1 +4.6
Interest on deposits (-) 2.0 2.0 +0.0
Overseas operations 6.1 7.3 +1.2
Interest on loans 2.4 3.4 +1.0
Interest and dividends on securities 4.6 5.6 +1.0
Gains and losses on bonds such as JGBs 12.3 6.5 -5.8
Gain on sell of bonds such as JGBs 12.8 16.2 +3.4
Loss on sell of bonds such as JGBs 0.5 9.7 +9.2
[Reference]
45.7 45.8

Loan rates for Retail Banking Total loan rates for customer loans have started to go up as rates for new loans have
been higher than current total rates since Oct. 2014
Loan rates for customer loans (monthly average of contract rates) (%)
1 . 948
2 . 001
1 . 858
1 . 918
1 . 973
2 . 166
1 . 490
1 . 8081 . 802
1 . 863
1 . 772
1 . 8041 . 820
1 . 547
1 . 595
1 . 4101 . 441
1 . 5501 . 547 1 . 549 1 . 5521 . 5481 . 5481 . 5481 . 5481 . 5491 . 551
1 . 562
1 . 565
1 . 5711 . 5771 . 5831 . 588
1 . 555 1 . 5521 . 557
Current total rates
Rates for new loans
Apr. May Jun. Jul. Aug. Sep. Oct. Nov. Dec. Jan. Feb. Mar. Apr. May. Jun. Jul. Aug. Sep.
2014 2015
4

Loans (average balance)
6,909.5 7,176.7 7,320.7
4,538.6 4,675.7 4,606.0
1H FY2013 1H FY2014 1H FY2015
Whole bank Portion in Shizuoka
-69.7
+144.0
Total loan balance (average balance)
2,702.6 2,707.7 2,733.7
1,980.92,012.72,038.6
1H FY2013 1H FY2014 1H FY2015
Whole bank Portion in Shizuoka
-31.8
+26.0
Total loan balance (average balance) of 1H FY2015 : JPY 7,320.7bn, up JPY 144.0bn (+2.0%) YoY
~ ~
~ ~
5 5
Average balance
YoY change Annual
growth rate
Total loan balance 7,320.7bn +144.0bn +2.0%
SMEs loan balance 2,733.7bn +26.0bn +1.0%
Retail loan balance 2,644.8bn +135.8bn +5.4%
Large and Medium size enterprises 1,523.7bn +25.3bn +1.7%
Breakdown of year-on-year change in total loan balance (average balance)
(JPY bn)
(JPY bn)
(JPY bn)
SMEs loan balance (average balance)
+144.0
Retail
+135.8
SMEs
+26.0 Large and Medium
size enterprises +25.3
Overseas
+16.2
Public
-59.3
2,644.82,509.0
2,367.3
2,071.92,008.8
1,915.5
1H FY2013 1H FY2014 1H FY2015
Wholebank Portion in Shizuoka
+63.1
※including apartment loans
~ ~
(JPY bn)
Retail loan balance (average balance)
+135.8

Loans excluding government-related loans (average balance)
5 6
2,666.52,602.02,613.7
1,913.71,906.91,949.6
1H FY2013 1H FY2014 1H FY2015
Whole bank
Portion in Shizuoka
SMEs loan balance excluding GRL (average balance)
+64.5
~ ~
Total loan balance (average balance)
~ ~
6,909.5 7,176.7 7,320.7
4,347.2 4,415.9 4,481.1
1H FY2013 1H FY2014 1H FY2015
Whole bank
Portion in Shizuoka excluding GRL
+65.2
+144.0 (JPY bn)
+6.8
Retail
+135.8
Breakdown of year-on-year change in loan balance excluding government-related loans
Government-related loans which are classified as loans for Large size
enterprises and SMEs are excluded in the figure below.
Total loan balance (average balance) of 1H FY2015: JPY 7,320.7bn, up JPY 144.0bn (+2.0%) YoY Loan balance in Shizuoka excluding government-related loans (GRL)*: JPY 4,481.1bn, up JPY 65.2bn *Loans guaranteed by the Government, etc.
Large and Medium size enterprises
+74.5
SMEs
+64.5
Overseas
+16.2
Public and GRL
-147.0
+144.0
(JPY bn)
(JPY bn)
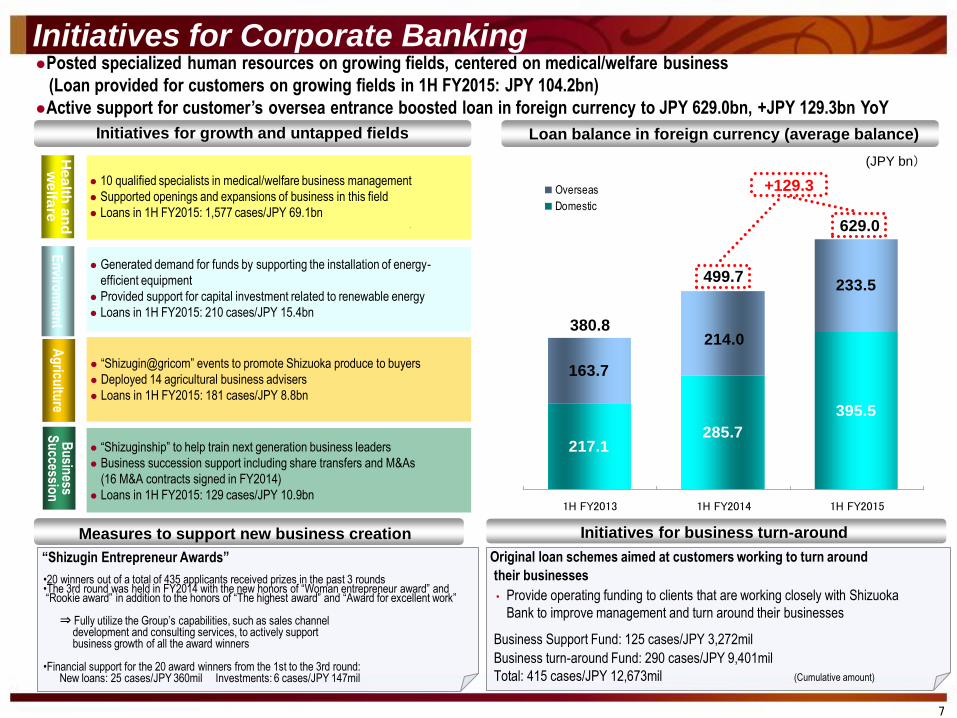
Initiatives for Corporate Banking Posted specialized human resources on growing fields, centered on medical/welfare business
(Loan provided for customers on growing fields in 1H FY2015: JPY 104.2bn)
Active support for customer’s oversea entrance boosted loan in foreign currency to JPY 629.0bn, +JPY 129.3bn YoY
Loan balance in foreign currency (average balance)
7
217.1285.7
395.5
233.5
214.0
163.7
1H FY2013 1H FY2014 1H FY2015
Overseas
Domestic
380.8
499.7
+129.3
Initiatives for growth and untapped fields
(JPY bn)
Original loan schemes aimed at customers working to turn around
their businesses
Business Support Fund: 125 cases/JPY 3,272mil
Business turn-around Fund: 290 cases/JPY 9,401mil
Total: 415 cases/JPY 12,673mil (Cumulative amount)
• Provide operating funding to clients that are working closely with Shizuoka
Bank to improve management and turn around their businesses
Initiatives for business turn-around Measures to support new business creation
•20 winners out of a total of 435 applicants received prizes in the past 3 rounds •The 3rd round was held in FY2014 with the new honors of “Woman entrepreneur award” and “Rookie award” in addition to the honors of “The highest award” and “Award for excellent work” ⇒ Fully utilize the Group’s capabilities, such as sales channel development and consulting services, to actively support business growth of all the award winners •Financial support for the 20 award winners from the 1st to the 3rd round: New loans: 25 cases/JPY 360mil Investments: 6 cases/JPY 147mil
“Shizugin Entrepreneur Awards”
629.0
10 qualified specialists in medical/welfare business management
Supported openings and expansions of business in this field
Loans in 1H FY2015: 1,577 cases/JPY 69.1bn
Generated demand for funds by supporting the installation of energy-
efficient equipment
Provided support for capital investment related to renewable energy
Loans in 1H FY2015: 210 cases/JPY 15.4bn
“Shizugin@gricom” events to promote Shizuoka produce to buyers
Deployed 14 agricultural business advisers
Loans in 1H FY2015: 181 cases/JPY 8.8bn
“Shizuginship” to help train next generation business leaders
Business succession support including share transfers and M&As
(16 M&A contracts signed in FY2014)
Loans in 1H FY2015: 129 cases/JPY 10.9bn
He
alth
an
d
we
lfare
E
nviro
nm
ent
Ag
ricultu
re B
usin
ess S
uccessio
n

Initiatives for Retail Banking 1H FY2015 term-end customer loan balance: JPY 2,689.1bn (+JPY 136.5bn from the end of 1H FY2014)
Maintained upward trend of loan balance by making reasonable amount of both housing loans and unsecured loans
113.3123.7
140.4123.8 123.5
1H FY2013 2H FY2013 1H FY2014 2H FY2014 1H FY2015
Loan Provided
9 8
930.4920.4935.8 925.7 917.9
1,442.2
1,700.41,650.8
1,588.31,523.8
51.346.440.6
33.8
58.3
1H FY2013 2H FY2013 1H FY2014 2H FY2014 1H FY2015
Unsecured loans
Housing loans
Other loans
2,411.8 2,490.1 2,552.6
2,622.5
Portion of high value added housing loan*:
JPY 63.8bn
*High value added housing loan:housing loan with insurance for 8 medical conditions and with insurance
“Shizugin 8 medical conditions plus”
Housing loan provided Customer loan balance (term-end balance)
(JPY bn)
(JPY bn)
2,689.1
+136.5
+112.1
264.1 247.3
14.722.8
34.731.1
23.620.2
17.8
16.6
FY2012 FY2013 FY2014 1H FY2015
Card loans
Loans for specific purposes
40.6
51.3
31.3
58.3
+7.0
+10.7
+9.3
Balance of unsecured loan A new card loan has been launched in Jul. 2015.
1. Credit examination done in 30 min at fastest
2. All transaction done through the Internet 3. Fund provided on the day of application (JPY bn)
*Excluding loans designed for face-to-face channel sales
Over 90% of customers apply* through non face-to-face channels

Deposits
8,709.98,301.49,102.4
7,013.7 7,214.1 7,415.0
1H FY2013 1H FY2014 1H FY2015
Whole bank Portion of Shizuoka
+392.5
Deposit balance (average balance)
+200.9
Deposit balance (average balance) of 1H FY2015: JPY 9,102.4bn, up JPY 392.5bn (+4.5%) YoY
Loan-Deposit ratio (excluding NCD): 84.5%, remained high
1,980.1 1,992.52,073.1
1,552.51,600.3 1,657.7
1H FY2013 1H FY2014 1H FY2015
Domestoic Portion in Shizuoka
+57.4
+80.6
5,642.65,822.4
5,992.4
5,212.55,395.5
5,563.3
1H FY2013 1H FY2014 1H FY2015
Domestic Portion in Shizuoka
+167.8
+170.0
9
Average balance YoY change Annual growth rate
Total deposit
balance 9,102.4bn +392.5bn +4.5%
Deposit balance
in Shizuoka 7,415.0bn +200.9bn +2.8%
Corporate deposit balance 2,073.1bn +80.6bn +4.0%
Retail deposit balance 5,992.4bn +170.0bn +2.9%
Portion in Internet branch 409.0bn +34.7bn +9.3%
Breakdown of year-on-year changes in deposits balance (average balance)
(JPY bn)
(JPY bn)
(JPY bn) (JPY bn)
Retail deposit balance (average balance) Corporate deposit balance (average balance)
+392.5
Retail
+170.0
Overseas
+146.8
Corporate +80.6
Excluding NCD +80.6
Offshore
+73.4
Public
-78.3

Customer assets and fee incomes
5,721.0 5,914.8 5,981.9
1,678.91,660.4 1,571.6
End of Mar. '14 End of Mar. '15 End of Sep. '15
Customer asset exclusding JPY deposits
JPY deposits
Customer assets (including the balance of Shizugin TM Securities) was JPY 7,553.5bn (-JPY 40.2bn from the end of March 2015), of which
balance of customer asset, excluding JPY deposits, was JPY 1,571.6bn (-JPY 107.3bn)
Have been increasing the percentage of recurring premium policies in the sales of insurance products to stabilize revenue from insurance sales
10
-40.2
-107.3
7,553.5 7,381.4 7,593.7
Customer assets (term-end balance) Sales and fee income from offering investment trust and insurance products
140.5190.8 96.8
196.5
43.4
119.9116.4141.3
9.010.2
12.5
FY2012 FY2013 FY2014 1H FY2015
Indivisual annuity insurance products, etc.
Investment trust
Fee incomes 307.2
281.8
316.4
140.2
5.6 7.8 8.94.7
8.2
16.315.3
16.0
15.516.415.214.2
FY 2012 FY 2013 FY2014 1H FY2015
Fees and commissions, trading incomeShizugin TM Securities
12.9
21.6
(15.6)
(14.9) (14.8)
25.2 23.1
(7.6)
Fee income ratio
(Including Shizugin TM Securities) (JPY bn,%)
(Figures in parentheses are fees and commissions)
(7.8)
Fee incomes (Shizuoka Bank / Shizugin TM Securities)
(JPY bn) (JPY bn)
(JPY bn) Balance of individual annuity insurance products, etc.
and investment trusts
Individual annuity insurance products, etc. FY2013 FY2014 1H
FY2015 Change from the end of FY2014
Balance (JPY bn) 949.3 951.8 899.6 -52.2
Percentage of
Level premium policies 10% 17% 36% -
Single premium policies 90% 83% 64% -
Investment trusts FY2013 FY2014 1H FY2015
Change from the end of FY2014
Balance (JPY bn) 350.2 434.6 416.8 -17.8
Portion in Shizuoka Bank 15.2 20.3 20.4 +0.1
Portion in Shizugin TM Securities 335.0 414.3 396.4 -17.9
6.3 ●
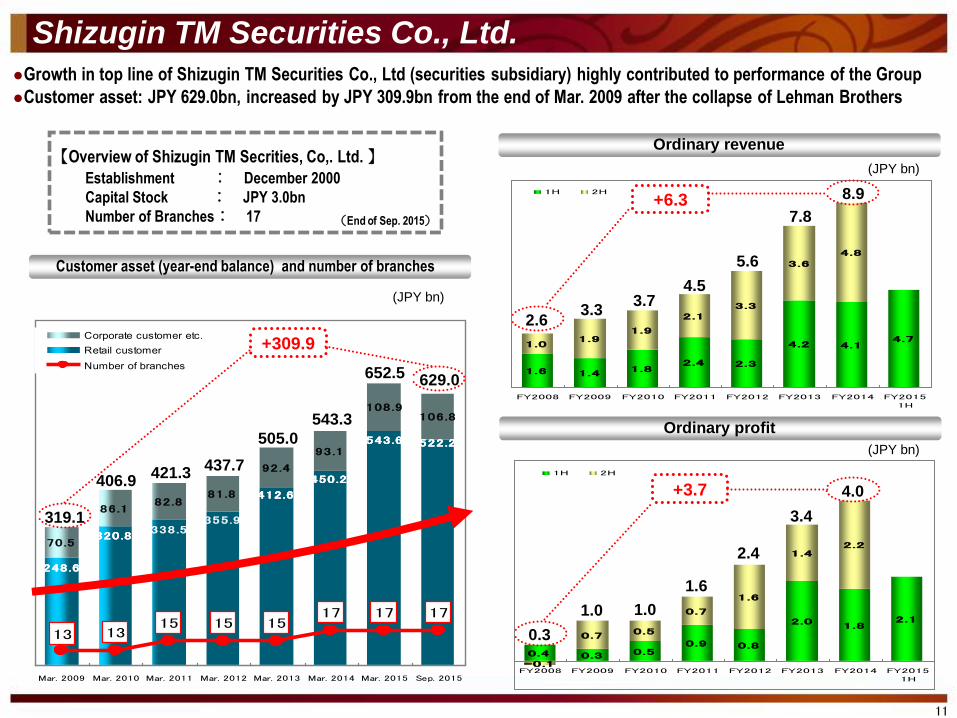
Growth in top line of Shizugin TM Securities Co., Ltd (securities subsidiary) highly contributed to performance of the Group
Customer asset: JPY 629.0bn, increased by JPY 309.9bn from the end of Mar. 2009 after the collapse of Lehman Brothers
Shizugin TM Securities Co., Ltd.
11
Customer asset (year-end balance) and number of branches
Establishment : December 2000
Capital Stock : JPY 3.0bn Number of Branches: 17
【Overview of Shizugin TM Secrities, Co,. Ltd. 】
(End of Sep. 2015)
0.4 0.3 0.50.9 0.8
2.01.8
2.1
-0.1
0.70.5
0.7
1.6
1.42.2
FY2008 FY2009 FY2010 FY2011 FY2012 FY2013 FY2014 FY20151H
1H 2H
1.6 1.41.8
2.4 2.3
4.2 4.14.7
1.01.9
1.9
2.1
3.3
3.6
4.8
FY2008 FY2009 FY2010 FY2011 FY2012 FY2013 FY2014 FY20151H
1H 2H
Ordinary profit
Ordinary revenue
+6.3
+3.7
7.8
5.6
4.5 3.7
3.3 2.6
3.4
0.3
1.0 1.0
1.6
2.4 70.5
86.182.8
81.8
92.4
93.1
108.9106.8
522.2522.2543.6543.6
450.2450.2
412.6412.6
248.6248.6
355.9338.5
320.8320.8
1517 17 17
13 1315 15
Mar. 2009 Mar. 2010 Mar. 2011 Mar. 2012 Mar. 2013 Mar. 2014 Mar. 2015 Sep. 2015
Corporate customer etc.
Retail customer
Number of branches
(JPY bn)
319.1
406.9 421.3
437.7
505.0
543.3
629.0
+309.9
(JPY bn)
(JPY bn)
652.5
8.9
4.0
Securities
245.6 288.7
383.0
355.0
193.9
162.6
48.0
18.6
934.9
518.5779.3
629.5
Mar. 2015 Sep. 2015
Governmentbonds
Municipalbonds
Corporatebonds
Stocks
Foreignbonds
Other
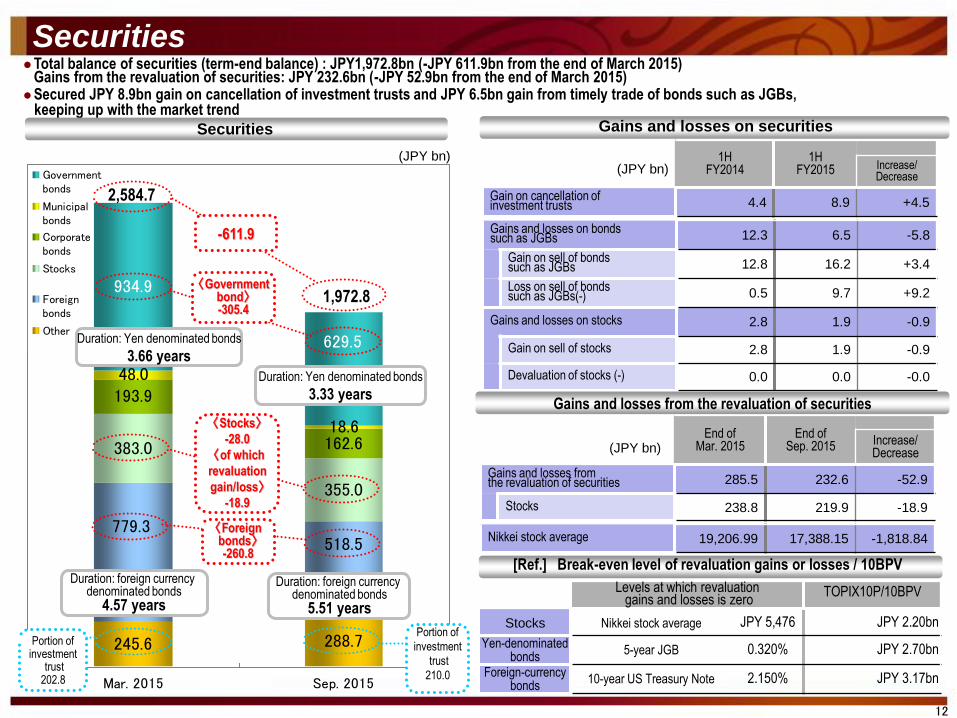
Levels at which revaluation gains and losses is zero
TOPIX10P/10BPV
Stocks Nikkei stock average JPY 5,476 JPY 2.20bn
Yen-denominated bonds
5-year JGB 0.320% JPY 2.70bn
Foreign-currency bonds
10-year US Treasury Note 2.150% JPY 3.17bn
Gains and losses on bonds such as JGBs 12.3 6.5 -5.8
Gain on sell of bonds such as JGBs 12.8 16.2 +3.4
Loss on sell of bonds such as JGBs(-) 0.5 9.7 +9.2
Gains and losses on stocks 2.8 1.9 -0.9
Gain on sell of stocks 2.8 1.9 -0.9
Devaluation of stocks (-) 0.0 0.0 -0.0
12
2,584.7
〈Foreign bonds〉 -260.8
〈Government bond〉 -305.4
1,972.8
Portion of
investment
trust
210.0
Portion of investment
trust 202.8
-611.9
End of Mar. 2015
End of Sep. 2015 Increase/
Decrease
Gains and losses from the revaluation of securities 285.5 232.6 -52.9
Stocks 238.8 219.9 -18.9
Duration: Yen denominated bonds
3.33 years
Duration: foreign currency denominated bonds
5.51 years
Duration: Yen denominated bonds
3.66 years
Duration: foreign currency denominated bonds
4.57 years
Total balance of securities (term-end balance) : JPY1,972.8bn (-JPY 611.9bn from the end of March 2015) Gains from the revaluation of securities: JPY 232.6bn (-JPY 52.9bn from the end of March 2015)
Secured JPY 8.9bn gain on cancellation of investment trusts and JPY 6.5bn gain from timely trade of bonds such as JGBs, keeping up with the market trend
Securities Gains and losses on securities
(JPY bn)
(JPY bn)
Gains and losses from the revaluation of securities
[Ref.] Break-even level of revaluation gains or losses / 10BPV
〈Stocks〉
-28.0
〈of which
revaluation
gain/loss〉
-18.9
1H FY2014
1H FY2015 Increase/
Decrease
Gain on cancellation of investment trusts 4.4 8.9 +4.5
(JPY bn)
Nikkei stock average 19,206.99 17,388.15 -1,818.84

Credit-related costs
Changes in credit rating, etc 4.5
Decrease in the value of collaterals 0.1
Upgrade of credit rating, decrease in loan and credit balances by foreclosure ,etc
-2.2
Total 2.4
1H FY2014
1H FY2015 YoY change
Provision for general allowance for loan losses (1) -3.5 -0.2 +3.3
Provision for specific allowance for loan losses (2) 2.2 2.4 +0.2
Other NPL disposal* (3) 0.3 0.2 -0.1
Credit-related Costs (1)+(2)+(3) -1.1 2.3 +3.4
13
1.5 2.2 2.40.5
0.3
△ 0.2
△ 3.5△ 4.1
0.2
1H FY2013 1H FY2014 1H FY2015
NPL disposal
Prov ision for specific allow ance for loan losses
Prov ision for general allow ance for loan losses
Credit-related costs
-2.1 -1.1
-0.03
0.06
-0.06
Credit-related cost rate
1H FY2013 1H FY2014 1H FY2015
Credit-related costs in 1H FY2015: JPY 2.3bn(+JPY 3.4bn YoY), Credit-related cost rate: 0.06% (+0.09%)
Breakdown of credit-related costs
(JPY bn)
(JPY bn)
*Including provision for the estimated future payments to credit guarantee corporations,
provision for allowance for accidental losses, and losses on sell of loans
Credit-related costs Credit-related cost rate
(JPY bn) (%)
* Credit-related cost rate =Credit-related costs / Average loan balance
2.3
Risk-management loans
Trends in Risk-management loans Net risk-management loans
NPL removal from the balance sheet
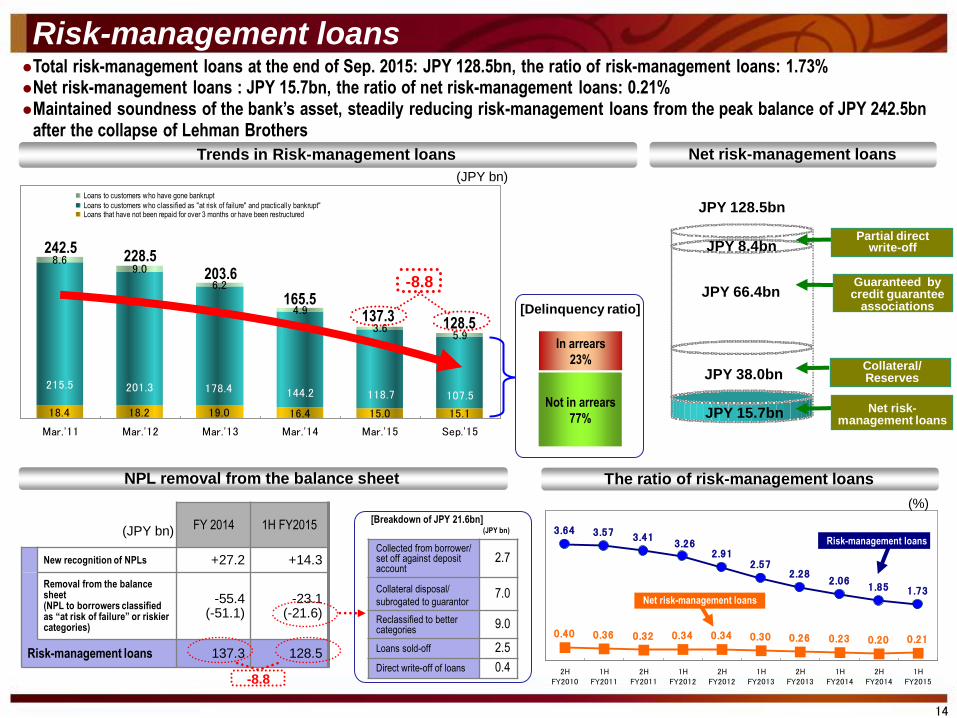
Total risk-management loans at the end of Sep. 2015: JPY 128.5bn, the ratio of risk-management loans: 1.73% Net risk-management loans : JPY 15.7bn, the ratio of net risk-management loans: 0.21% Maintained soundness of the bank’s asset, steadily reducing risk-management loans from the peak balance of JPY 242.5bn
after the collapse of Lehman Brothers
3.64 3.57 3.41
2.061.85 1.73
0.40 0.36 0.32 0.34 0.34 0.30 0.26 0.23 0.20 0.21
2.913.26
2.572.28
2HFY2010
1HFY2011
2HFY2011
1HFY2012
2HFY2012
1HFY2013
2HFY2013
1HFY2014
2HFY2014
1HFY2015
The ratio of risk-management loans
Collected from borrower/ set off against deposit account
2.7
Collateral disposal/
subrogated to guarantor 7.0
Reclassified to better categories
9.0
Loans sold-off 2.5
Direct write-off of loans 0.4
14
18.4 18.2 19.0 16.4 15.0 15.1
8.69.0
6.2
4.9
3.65.9
107.5118.7144.2178.4201.3215.5
Mar.'11 Mar.'12 Mar.'13 Mar.'14 Mar.'15 Sep.'15
Loans to customers who have gone bankrupt
Loans to customers who classified as "at risk of failure" and practically bankrupt"Loans that have not been repaid for over 3 months or have been restructured
242.5 228.5
203.6
165.5
Not in arrears
77%
In arrears
23%
(JPY bn)
[Delinquency ratio]
JPY 128.5bn
Partial direct write-off
Guaranteed by credit guarantee
associations
Collateral/ Reserves
Net risk-management loans
JPY 38.0bn
JPY 15.7bn
JPY 66.4bn
JPY 8.4bn
(JPY bn) [Breakdown of JPY 21.6bn]
(JPY bn) Risk-management loans
Net risk-management loans
(%)
128.5
FY 2014 1H FY2015
New recognition of NPLs +27.2 +14.3
Removal from the balance sheet (NPL to borrowers classified as “at risk of failure” or riskier categories)
-55.4 (-51.1)
-23.1 (-21.6)
Risk-management loans 137.3 128.5
-8.8
137.3
-8.8

Expenses and Strategic investments
15
32.6 34.1
42.3
34.1(17.2)
33.8(16.8)
41.3(20.2)
42.1(21.2)41.6
3.8 4.0 5.3(2.7) 5.8(2.9)
53.855.2
56.4(51.9)
55.1(50.6)
FY2012 FY2013 FY2014 FY2015 Plan
TaxNon-personnel expensesPersonnel expensesOHR
81.5
(41.1) 78.7 79.7
80.9
(39.9)
Expenses in 1H FY2015: JPY 39.9bn (-JPY 1.1bn YoY)
OHR (Non-consolidated): 50.6% (-1.3 points YoY)
(Figures in parentheses are results in the 1H of the fiscal year)
Expenses and OHR (annual basis) Strategic investments in the 12th Medium-term Business Plan
System-related Approx. JPY 30bn
Construction of branches and new HQ Approx. JPY 25bn
New businesses Approx. JPY 45bn
Total Approx. JPY 100bn
(JPY bn,%)
“SHIZUGIN Headquarters Tower” started operation (Jan. 2015)
【Teleconference system】 【Free-address office system】
【SHIZUGIN Headquarters Tower】
Capital adequacy ratio
BIS capital adequacy ratio ( consolidated basis) Changes in capital and risk-adjusted assets
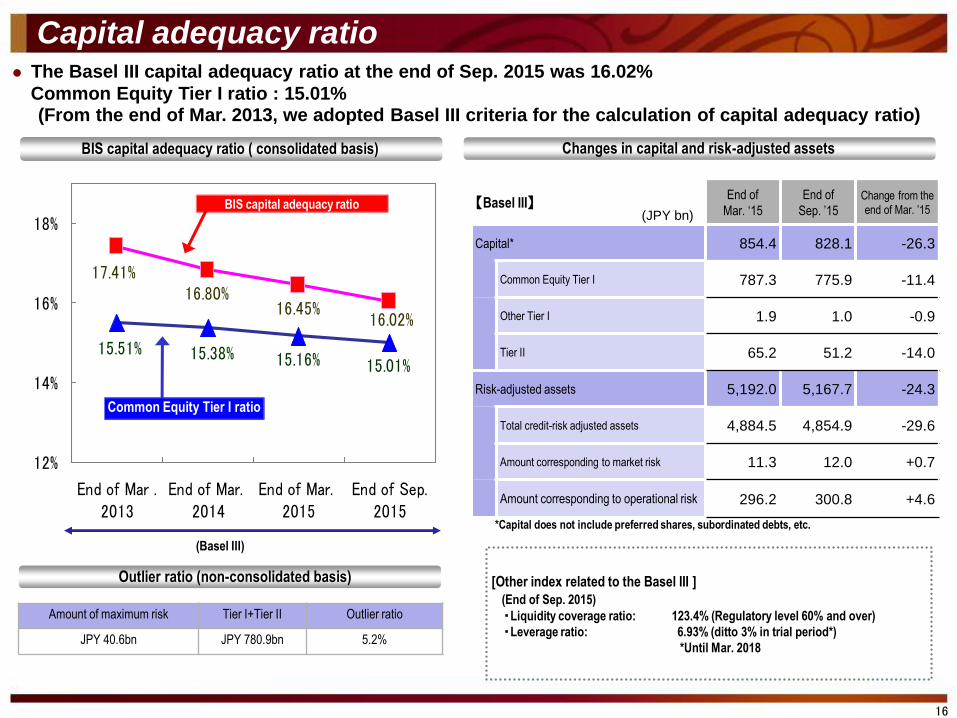
Amount of maximum risk Tier I+Tier II Outlier ratio
JPY 40.6bn JPY 780.9bn 5.2%
Outlier ratio (non-consolidated basis)
※ 自己資本には、優先株、劣後債務等を含まない
4
【Basel III】 End of
Mar. ‘15
End of
Sep. ’15 Change from the
end of Mar. ’15
Capital* 854.4 828.1 -26.3
Common Equity Tier I 787.3 775.9 -11.4
Other Tier I 1.9 1.0 -0.9
Tier II 65.2 51.2 -14.0
Risk-adjusted assets 5,192.0 5,167.7 -24.3
Total credit-risk adjusted assets 4,884.5 4,854.9 -29.6
Amount corresponding to market risk 11.3 12.0 +0.7
Amount corresponding to operational risk 296.2 300.8 +4.6
16
The Basel III capital adequacy ratio at the end of Sep. 2015 was 16.02%
Common Equity Tier I ratio : 15.01% (From the end of Mar. 2013, we adopted Basel III criteria for the calculation of capital adequacy ratio)
[Other index related to the Basel III ]
(End of Sep. 2015)
・Liquidity coverage ratio: 123.4% (Regulatory level 60% and over)
・Leverage ratio: 6.93% (ditto 3% in trial period*)
*Until Mar. 2018
*Capital does not include preferred shares, subordinated debts, etc.
(JPY bn)
15.01%15.16%15.38%15.51%
16.45%16.02%
17.41%16.80%
12%
14%
16%
18%
End of Mar .2013
End of Mar. 2014
End of Mar. 2015
End of Sep.2015
(Basel III)
Common Equity Tier I ratio
BIS capital adequacy ratio

Shareholder return
17
FY2012 FY2013 FY2014 FY2015E FY ’05 – ‘14 (10years)
Annual dividend (1) 9.7 9.7 9.9 12.3 Accumulated total 90.6
Repurchase of shares (2)
(Shares bought back: million shares)
8.2
(10)
22.7
(20)
11.3
(10)
*7.0
(5) Accumulated total 88.4
Shareholder returns (3)=(1)+(2) 18.0 32.4 21.2 19.3 Accumulated total 179.0
Net income (4) 40.9 42.8 42.6 44.0 Accumulated total 344.0
Dividend payout ratio (1)/(4)x100 23.78 22.78 23.24 27.90 Average 26.32
Shareholder return ratio (3)/(4)x100 43.93 75.73 49.82 43.80 Average 52.01
FY2011 FY2012 FY2013 FY2014 FY2015E
Annual dividend per share
(Interim dividend)
JPY 13.50
(6.5)
*JPY 15.00
(8.0)
JPY 15.50
(7.5)
JPY 16.00
(8.0)
JPY 20.00
(10.00)
Target of shareholder return ratio in 12th Medium-term Business Plan: 50% or more in medium term
For FY2015, annual dividend of JPY 20.00 per share is planned, and a buyback of shares has been
implemented (buyback period: Aug. 3rd – Aug. 25th, 2015, number of shares bought back: 4.767mil,
total amount of repurchase: JPY 6.999bn)
Dividend trends
Profit distribution to shareholders
*Including 70th anniversary dividend
(JPY bn,%)
ROE (Consolidated : Net income basis) 7.43 5.78 5.74 - Average in 5years
5.89
[Reference]
*Portion implemented in 1H of the fiscal year
(Figures in parentheses are semi-annual dividend per share)
Historical share buybacks
Shares bought back
(thousand shares)
Repurchase amount of shares
(JPY mil)
Number of shares
cancelled (thousand shares)
Cancellation amount (JPY mil)
Shareholder return ratio
(%)
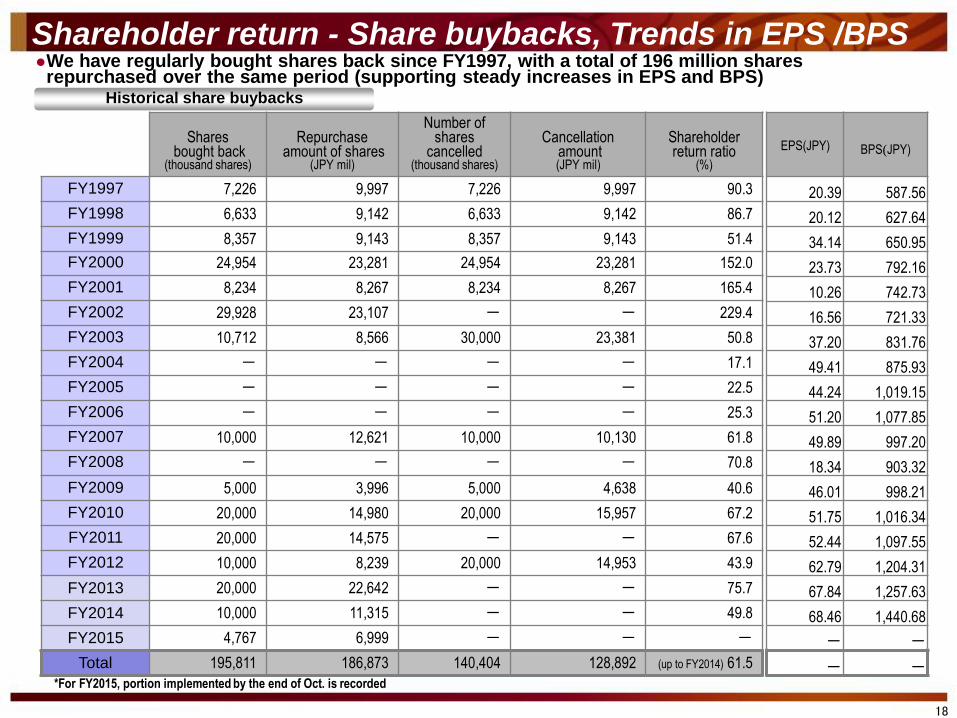
FY1997 7,226 9,997 7,226 9,997 90.3
FY1998 6,633 9,142 6,633 9,142 86.7
FY1999 8,357 9,143 8,357 9,143 51.4
FY2000 24,954 23,281 24,954 23,281 152.0
FY2001 8,234 8,267 8,234 8,267 165.4
FY2002 29,928 23,107 - - 229.4
FY2003 10,712 8,566 30,000 23,381 50.8
FY2004 - - - - 17.1
FY2005 - - - - 22.5
FY2006 - - - - 25.3
FY2007 10,000 12,621 10,000 10,130 61.8
FY2008 - - - - 70.8
FY2009 5,000 3,996 5,000 4,638 40.6
FY2010 20,000 14,980 20,000 15,957 67.2
FY2011 20,000 14,575 - - 67.6
FY2012 10,000 8,239 20,000 14,953 43.9
FY2013 20,000 22,642 - - 75.7
FY2014 10,000 11,315 - - 49.8
FY2015 4,767 6,999 - - -
Total 195,811 186,873 140,404 128,892 (up to FY2014) 61.5
EPS(JPY)
BPS(JPY)
20.39 587.56
20.12 627.64
34.14 650.95
23.73 792.16
10.26 742.73
16.56 721.33
37.20 831.76
49.41 875.93
44.24 1,019.15
51.20 1,077.85
49.89 997.20
18.34 903.32
46.01 998.21
51.75 1,016.34
52.44 1,097.55
62.79 1,204.31
67.84 1,257.63
68.46 1,440.68
- -
- -
We have regularly bought shares back since FY1997, with a total of 196 million shares repurchased over the same period (supporting steady increases in EPS and BPS)
Shareholder return - Share buybacks, Trends in EPS /BPS
18
*For FY2015, portion implemented by the end of Oct. is recorded

Progress
in the 12th Medium-term Business Plan

Progress in the 12th Medium-term Business Plan
19
・ストラクチャード ファナンス
・富裕層(資産形成層)取引
Challenge on the new business field
in 12th Medium-term business plan
〔Seg
men
t
〕
Exis
ting
N
ew
N
ew
Domain expansion
Domain expansion
Structured Finance
・Advance relationship
banking
・Increase in number of
loyal customers
・Expansion of
housing-related loans
・Solution-offering for
asset management
・Consultation for
descent-related issues
〔Corporate banking〕 〔Retail banking〕
Untapped Segment
Wealth management
business
Consumer finance
Cultivation
in core domains
Existing New
D
istin
ct w
ay w
ith th
inkin
g
ou
tsid
e th
e b
oxes
〔Process〕
Advance market-oriented indirect finance 【Interest & Fee income in 1H FY2015:
JPY 2.1bn】
Promote loans for asset building Loans provided: JPY 77.3bn
【Interest in 1H FY2015: JPY 1.0bn】
Expand sales of unsecured loans Increase in unsecured loan balance: JPY 7.0bn
New card loan (Jul. 2015) Balance: JPY 1.5bn
Tokyo Office Banking Division III
Improvement of non-face-to-face Channel
Provide funds for business turn-around 415 cases/JPY 12.7bn
Loan for individual business owners (Apr. 2015) Balance: JPY 0.7bn
New scheme & products
…New business Field
Tokyo Office Banking Division IV
Develo
p n
ew
bu
sin
ess w
ith M
on
ex G
rou
p a
nd
diffe
ren
t
typ
es o
f bu
sin
ess c
om
pan
ies
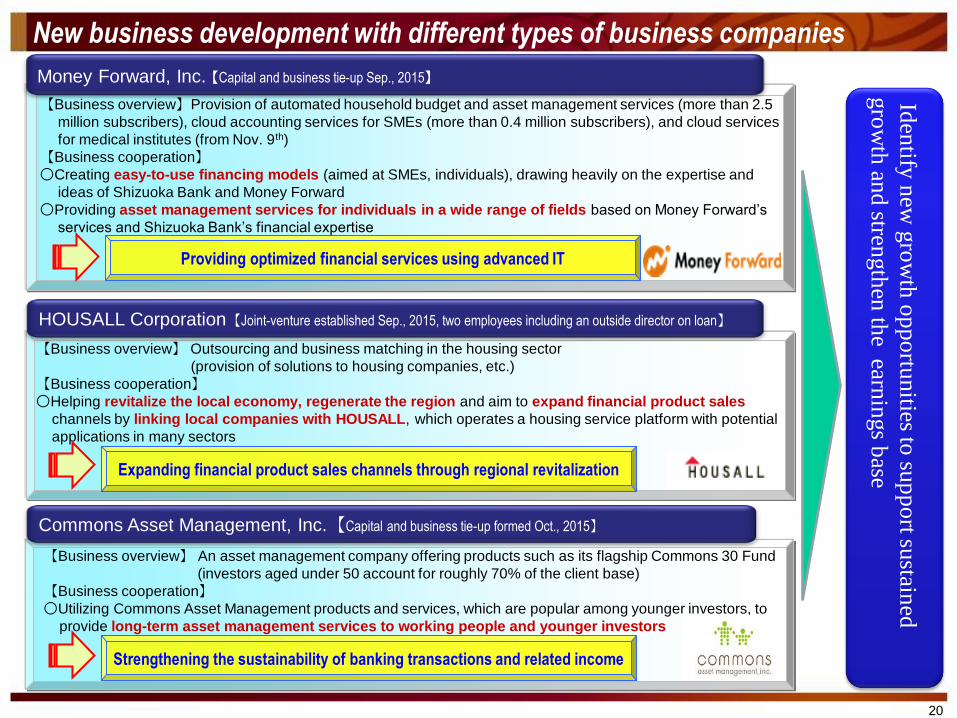
New business development with different types of business companies
20
Iden
tify n
ew g
row
th o
pp
ortu
nities to
sup
po
rt sustain
ed
gro
wth
and
strength
en th
e earnin
gs b
ase Money Forward, Inc. 【Capital and business tie-up Sep., 2015】
HOUSALL Corporation【Joint-venture established Sep., 2015, two employees including an outside director on loan】
Commons Asset Management, Inc.【Capital and business tie-up formed Oct., 2015】
【Business overview】 An asset management company offering products such as its flagship Commons 30 Fund
(investors aged under 50 account for roughly 70% of the client base)
【Business cooperation】
○Utilizing Commons Asset Management products and services, which are popular among younger investors, to
provide long-term asset management services to working people and younger investors
Strengthening the sustainability of banking transactions and related income
【Business overview】 Outsourcing and business matching in the housing sector
(provision of solutions to housing companies, etc.)
【Business cooperation】
○Helping revitalize the local economy, regenerate the region and aim to expand financial product sales
channels by linking local companies with HOUSALL, which operates a housing service platform with potential
applications in many sectors
Expanding financial product sales channels through regional revitalization
【Business overview】Provision of automated household budget and asset management services (more than 2.5
million subscribers), cloud accounting services for SMEs (more than 0.4 million subscribers), and cloud services
for medical institutes (from Nov. 9th)
【Business cooperation】
○Creating easy-to-use financing models (aimed at SMEs, individuals), drawing heavily on the expertise and
ideas of Shizuoka Bank and Money Forward
○Providing asset management services for individuals in a wide range of fields based on Money Forward’s
services and Shizuoka Bank’s financial expertise
Providing optimized financial services using advanced IT

Direction of the new business development
21
【The 11th Medium-term Business Plan】
Cultivation in core domains
【The 12th Medium-term Business Plan】 Challenge on the new business field
Promoting housing and reform loans
through non face-to-face
channels
Expanding sales channels of housing
and reform loans by increasing contact
points with customers
【Expanding the business of the Internet branch】
Started opening accounts of the new card loan in Jul. 2015
⇒Strengthening operation on investment side
Providing financial services on
the Fintech business field
Expanding sales of investment trust
to the asset-buidling (younger)
customer segment
Expanding security business
through non face-to-face channels
Existing
New
business field
【Schedule of the Next-Generation System Development】
From Jan. 2019
Improvement of the Front-hub The system for registration and settlement starts operation
From May 2017
The Front-hub starts operation The renewed core banking system starts operation
By May 2017
Development of the Front-hub Renewal of hardware
Internet: for customers who prefer non face-to-face channels Real branches: expanding and digging down customer segments

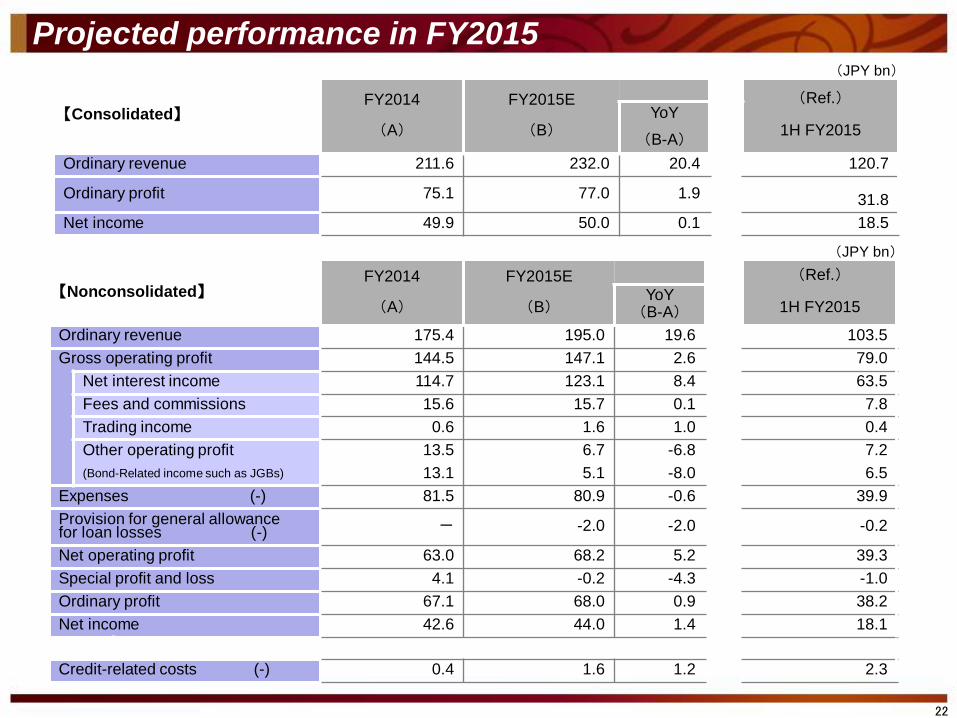
Projected performance in FY2015
22
(JPY bn)
【Consolidated】 FY2014
(A)
FY2015E
(B)
(Ref.)
1H FY2015 YoY
(B-A)
Ordinary revenue 211.6 232.0 20.4 120.7
Ordinary profit 75.1 77.0 1.9 31.8
Net income 49.9 50.0 0.1 18.5
(JPY bn)
【Nonconsolidated】 FY2014
(A)
FY2015E
(B)
(Ref.)
1H FY2015 YoY
(B-A)
Ordinary revenue 175.4 195.0 19.6 103.5
Gross operating profit 144.5 147.1 2.6 79.0
Net interest income 114.7 123.1 8.4 63.5
Fees and commissions 15.6 15.7 0.1 7.8
Trading income 0.6 1.6 1.0 0.4
Other operating profit 13.5 6.7 -6.8 7.2
(Bond-Related income such as JGBs) 13.1 5.1 -8.0 6.5
Expenses (-) 81.5 80.9 -0.6 39.9
Provision for general allowance for loan losses (-) - -2.0 -2.0 -0.2
Net operating profit 63.0 68.2 5.2 39.3
Special profit and loss 4.1 -0.2 -4.3 -1.0
Ordinary profit 67.1 68.0 0.9 38.2
Net income 42.6 44.0 1.4 18.1
Credit-related costs (-) 0.4 1.6 1.2 2.3
Projected performance in FY2015

Reference

Overview of the 12th Medium-term Business Plan
Target figures (consolidated)
12th Medium-term
Business Plan
FY2014 FY2016 plan
Ordinary profit 75.1 80.0 or more
Net income 49.9 50.0 or more
Common Equity
TierⅠROE 6.34% 6% level
Consolidated ROE 5.74% -
OHR 55.7% Around 55%
Common Equity
TierⅠratio 15.16% Around 14%
Shareholder
return 49.82%
50% or more in medium term
23
第12次中期経営計画 The 12th Medium-term Business Plan (12th MBP)
Name of the plan
「TOBIRA ~ Open a Gate for the Next 」
Group vision
『Shizugin』that ventures on the new possibilities
Guideline for action ~ We aim to be the best regional
bank in the world with taking
『Breakthrough』to heart
Basic strategies
Top line
Growth
・Refine region-based relationship banking
・Challenge on the new business fields and
profitable opportunities
Operational
system ・Build the flexible and robust operating structure
Branding ・Add more value to 「Shizugin」 brand

+4.6
(+4.5)
+0.6
+0.2
-1.1
+0.2
24
+0.2
-0.2
+1.0
① JPY Interest on loans of Domestic operations
② Foreign Interest on loans of Overseas operations
③ JPY interest and dividends on securities (Gains on cancellation of investment trusts etc.)
④ Other JPY net interest income : Deposits and asset liability management
⑤ Other foreign net interest income (Foreign bond balance)
⑥ Fees and commissions
⑦ Trading income
⑧ Other operating profit (Bond-related income such as JGBs)
⑨ Provision for general allowance for loan losses
⑩ Expenses
① ②
③ ④
⑤
⑥
⑦ ⑧ (JPY bn)
⑨
⑩
Net operating profit
-1.1
-5.8
(-5.8)
39.338.1
Net operating profit
1H 2014 1H2015

Loans (term-end balance)
25
Total loan balance (term-end balance) of 1H FY2015: JPY 7,424.8bn, +JPY 158.2bn (+2.2%) YoY
7,424.87,266.67,139.8
4,691.34,740.74,711.5
End of Sep. 2013 End of Sep. 2014 End of Sep. 2015
Whole bank Portion in Shizuoka
-49.4
+158.2
Term-end balance YoY change Annual growth
rate
Total loan
balance 7,424.8bn +158.2bn +2.2%
SMEs loan
balance 2,823.5bn +65.1bn +2.4%
Retail loan balance 2,696.0bn +139.7bn +5.5%
Large and Medium
sized enterprises 1,507.1bn -37.7bn -2.4%
Total loan balance (term-end balance)
(JPY bn)
Breakdown of year-on-year change in total loan balance (term-end balance)
Breakdown of year-on-year change in total loan balance (term-end balance)
SMEs loan balance (term-end balance)
(JPY bn) ※including apartment loans
Retail loan balance (term-end balance)
2,823.52,758.4
2,839.0
2,069.82,087.72,162.6
End of Sep. 2013 End of Sep. 2014 End of Sep. 2015
Whole bank Portion in Shizuoka
2,696.02,556.3
2,411.7
2,098.92,038.8
1,945.9
End of Sep. 2013 End of Sep. 2014 End of Sep. 2015
Whole bank Portion in Shizuoka+65.1
-17.9
(JPY bn) +139.7
+60.1
(JPY bn)
+158.2
Retails
+139.7
Large and Medium
sized enterprises
-37.7
Overseas
+7.0
Public
-15.9
SMEs
+65.1

Loans - Loans by industries
Accommodation
Leasing
Real estate
Money lending
and investment
Retailing
Construction
Transportation
machinery
Wholesaler
50
150
250
350
450
0.00 0.40 0.80 1.20
(%)
Balance Composition
ratio YoY
change
All industries 4,995.5 100.0 -0.2
Real estate 449.6 9.0 +16.5
Wholesaler * 410.1 8.2 -3.5
Money lending
and investment 300.4 6.0 -81.2
Transportation machinery
401.6 8.0 +14.3
Construction 244.7 4.9 -4.2
Retailer 263.3 5.3 -4.3
Leasing 283.0 5.7 +35.1
Accommodation 72.1 1.4 -0.2
26
(JPY bn, %)
* excluding a general trading companies
[ Credit balance (as of the end of Sep. 2015) ]
(JPY bn)
[ Credit balance vs. expected loss rate* ]
*Expected loss (EL) amount / Credit balance
Excluding borrowers classified as “practically bankrupt” and below
Contemporary status of business loans to particular industries
Business loans to each industry such as real estate, construction, leasing, money lending and investment account for less than 9% of loan balance, respectively. There is no concentrated exposure to any of these specific industries
Expected Loss (EL) for all industries : JPY 3.6bn (JPY 0.8bn for real estate and JPY 0.3bn for construction)
Unexpected Loss (UL) for all industries : JPY 43.9bn
Cre
dit b
ala
nce

27
Global network
●
●
●
●
●
●
Our network in Asia
●
International Department Manage and control for overseas strategy Support Customers for overseas expansion
36.1
42.1
55.5
65.9
0 .0
10.4
18.7
26.0
FY2012 FY2013 FY2014 1H FY2015
Total blance Portion of Asia
Loan balance for Non-Japanese company (term-end balance)
+29.8
+26.0
Shizuoka Bank
(Europe) S.A. Shizuoka
Los Angeles Branch New York Branch ・・・ Offices owned by
our affiliates
【China】
China Construction Bank
Bank of Shangahai
【Korea】
Shinhan Bank
Daegu Bank
Shanghai Rep. Office
Hong Kong Branch
Singapore Rep. Office
【India】
State Bank of India
【Vietnam*】
ANZ Bank(Vietnam)
【Taiwan】
Chinatrust Financial Holding
(Chinatrust Commercial Bank)
(1 dispatched employees)
【Philippine】
Bank of the Philippine Islands
(JPY bn)
Global network (3 branches/2 rep. offices/1 subsidiary) and 12 partner banks in 8 countries/regions in Asia
・・・ Our own offices
Global network
*Additionally, 2 employees dispatched to Vietnam Saison Consulting Co., Ltd.
【Thailand】 KASIKORN BANK
(3 dispatched employees) Bangkok Bank
【Indonesia】 CIMB Niaga
(2 dispatched employees)
Bank Resona Perdania
【Mexico】
BBVA Bancomer
End-Mar. 2008
End-Mar.
2013
End-Mar.
2014
End-Mar. 2015
Change
from end-
Mar.
2008
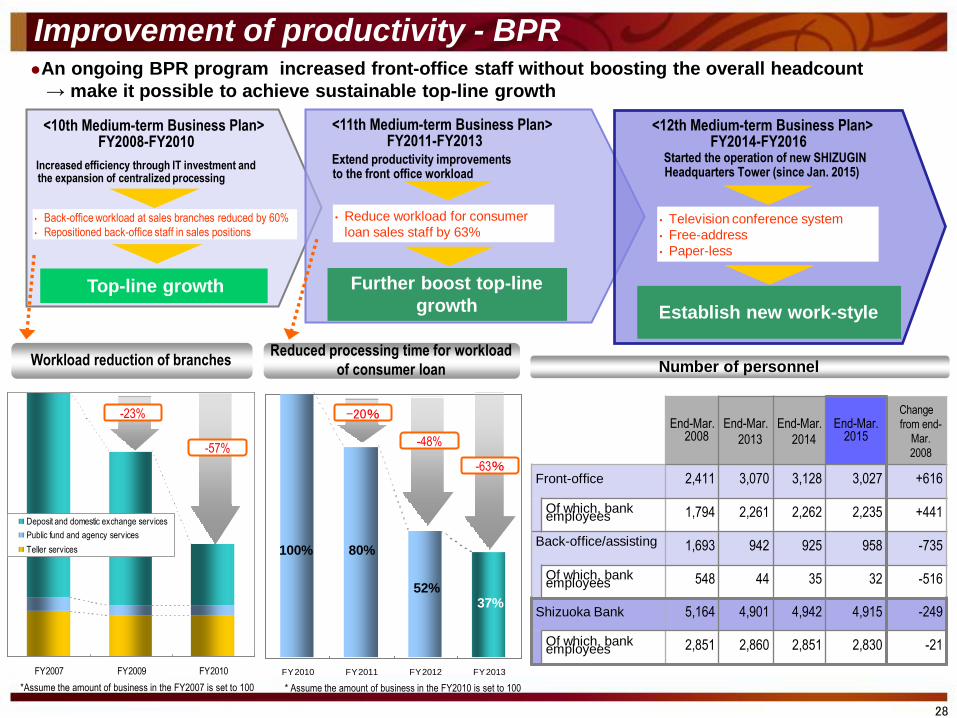
Front-office 2,411 3,070 3,128 3,027 +616
Of which, bank employees 1,794 2,261 2,262 2,235 +441
Back-office/assisting 1,693 942 925 958 -735
Of which, bank employees 548 44 35 32 -516
Shizuoka Bank 5,164 4,901 4,942 4,915 -249
Of which, bank employees 2,851 2,860 2,851 2,830 -21
FY2007 FY2009 FY2010
Deposit and domestic exchange services
Public fund and agency services
Teller services
FY2010 FY2011 FY2012 FY2013
100% 80%
52% 37%
-23%
-57%
-20%
-48%
-63%
28
<12th Medium-term Business Plan> FY2014-FY2016 Started the operation of new SHIZUGIN
Headquarters Tower (since Jan. 2015)
• Television conference system
• Free-address
• Paper-less
Establish new work-style
Workload reduction of branches Reduced processing time for workload
of consumer loan Number of personnel
* Assume the amount of business in the FY2010 is set to 100
*Assume the amount of business in the FY2007 is set to 100
An ongoing BPR program increased front-office staff without boosting the overall headcount
→ make it possible to achieve sustainable top-line growth
Improvement of productivity - BPR
Top-line growth
<10th Medium-term Business Plan> FY2008-FY2010
Increased efficiency through IT investment and the expansion of centralized processing
• Back-office workload at sales branches reduced by 60%
• Repositioned back-office staff in sales positions
<11th Medium-term Business Plan> FY2011-FY2013
Extend productivity improvements to the front office workload
• Reduce workload for consumer
loan sales staff by 63%
Further boost top-line
growth

Loan [Credit risk] 87.7 57.6 66%
Treasury division 442.8 193.3 44%
[Of which, policy investment] (109.0) (90.9) (83%)
Consolidated subsidiaries 8.0 4.2 52%
Strategic investments 24.8 0.0 0%
Operational risk 24.1 24.1 100%
Sub total 587.4 279.2 49%
Buffer capital, etc. 123.5 - -
Total 710.9 - -
Risk capital
allocated
Risk capital
used Allocation source
Credit risk
125.3
Market risk 413.2
Strategic investments 24.8
Operational risk 24.1
Buffer capital, etc. 123.5
Core capital
710.9
(End of
Sep. 2015 basis)
(JPY bn)
Ratio of risk
capital used
29
Allocation of risk capital Allocation of risk capital for the 1H FY2015 amounted to JPY 710.9bn, of which JPY 125.3bn was
allocated to credit risk, JPY 413.2bn to market risk, JPY 24.8bn to strategic investment, JPY 24.1bn to operational risk, and JPY 123.5bn to buffer capital, etc
JPY 57.6bn for loans [credit risk] and JPY 193.3bn for the Treasury division was used for the 1H FY2015
・Core capital = common equity Tire I (Basel III standard), excluding other marketable securities valuation difference
・Risk capital amount = <Market risk> │VaR│
<Credit risk> (1)│UL│ (loan balance includes bad debt written off, CVAs)
(2) Basel III capital requirement amount (designated loan claims, securitization transactions, investment funds, and private placement REIT)
<Operational risk> Amount equivalent to operational risk
・Buffer capital is kept aside for emergencies such as the anticipated Great Earthquake and other unquantifiable risks

Company name Business Ordinary revenue
Ordinary Profit YoY change YoY change
Shizugin Management Consulting Co., Ltd. Corporate and financial management advisory services 0.6 +0.1 0.1 +0.1
Shizugin Lease Co., Ltd. Leasing 12.3 +0.4 0.8 +0.1
Shizuoka Computer Service Co., Ltd. Computer system development and operation 2.3 -0.3 0.1 +0.0
Shizugin Credit Guaranty Co., Ltd. Guarantee of housing loans, etc. 1.3 +0.3 1.0 +0.2
Shizugin DC Card Co., Ltd Credit card and guarantee of consumer loans 1.0 +0.0 0.2 -0.0
Shizuoka Capital Co., Ltd. Public-offering assistance Support for corporate rehabilitation
0.2 +0.1 0.1 +0.1
Shizugin TM Securities Co., Ltd. Securities 4.7 +0.7 2.1 +0.3
Shizuoka Bank (Europe) S.A. Finance and securities-related services 0.2 -0.0 0.1 +0.0
Shizugin General Service Co., Ltd. Fee-based job placement service, general administration 0.5 -0.0 0.0 +0.0
Shizugin Mortgage Service Co., Ltd. Appraisal of real estate for loan collateral Operation center for loans
0.9 +0.0 0.0 +0.0
Shizugin Business Create Co., Ltd. Operation center for remittance and bill collection 1.9 -0.2 0.0 -0.0
Total(11 companies) 26.0 +1.1 4.4 +0.8
Shizugin Saison Card Co., Ltd.* Credit card and guarantee of consumer loans 1.0 +0.1 0.1 +0.1
(JPY bn)
Group companies
30
*A company to which the equity method of accounting is applied. Operations commenced in April 2007.
FY2015 1H the total ordinary revenue of 11 major consolidated subsidiaries was JPY 26.0bn
(+JPY 1.1bn YoY) and the ordinary profit was JPY 4.4bn (+JPY 0.8bn YoY)

Share of loans in Shizuoka Prefecture
26.5 27.3 28.029.1
30.2 30.2 30.229.3
24.4 23.9 24.2 24.0 23.6 23.2 23.0
9.8 9.4 9.2 9.08.0 7.2 6.7 6.8 6.9
7.9
28.930.3
24.2 23.9 23.9
FY2005 FY2006 FY2007 FY2008 FY2009 FY2010 FY2011 FY2012 FY2013 FY2014
Shinkin banks
Shizuoka Bank
Mega banks
Total loan balance (average balance)
(JPY bn)
3,685.3 3,858.5 4,066.0 4,241.1 4,276.64,411.9 4,445.8
4,576.64,665.0
3,510.9
FY2005 FY2006 FY2007 FY2008 FY2009 FY2010 FY2011 FY2012 FY2013 FY2014
Portion in Shizuoka+2,056.8
+1,154.1
5,495.5 5,791.3
6,143.2
5,186.2
6,275.2 6,325.6
1,874.41,949.9
2,005.9 1,994.2 2,027.4 2,050.1 2,047.3
1,801.9
2,008.8
1,730.5
FY2005 FY2006 FY2007 FY2008 FY2009 FY2010 FY2011 FY2012 FY2013 FY2014
Portion in Shizuoka
(JPY bn)
SME loan balance (average balance)
2,183.5 2,315.7
2,437.5 2,540.3 2,556.1
+535.4
+278.3
2,579.8
Consumer loan balance (average balance)
(JPY bn)
Total loan balance (average) increased by JPY 2,056.8bn in 10 years since FY2005, of which JPY 1,154.1bn in Shizuoka Pref.
SME loan balance: +JPY 535.4bn, consumer loan balance: +JPY 1,012.1bn
6,517.7
(%)
2,636.2 6,669.4 2,678.0
1,511.9 1,610.7 1,696.5 1,766.6 1,825.7 1,868.8
1,404.3
1,931.1 2,018.6
1,291.4
FY2005 FY2006 FY2007 FY2008 FY2009 FY2010 FY2011 FY2012 FY2013 FY2014
Portion in Shizuoka
1,528.1 1,672.7
1,819.2
1,955.3 2,074.0
+1,012.1
+727.2
2,166.8 2,243.9
2,304.5
Loans
1
7,243.0 2,718.9
2,401.2
9th Medium-term
Business Plan
10th Medium-term
Business Plan 11th Medium-term
Business Plan
31
7,011.5 2,726.2
2,540.2

Loan-Deposit ratio / Security-Deposit ratio (excluding NCD)
Deposit balance (average balance)
7,152.66,913.86,653.96,408.76,197.76,129.0
5,953.65,834.35,727.35,622.2
FY2005 FY2006 FY2007 FY2008 FY2009 FY2010 FY2011 FY2012 FY2013 FY2014
Portion in shizuoka +1,697.3
+1,530.4
6,668.2 6,759.2 6,835.1 6,650.9 7,042.2 7,118.9
9.9 21.2 34.1189.4 260.1
347.3 396.4
4,608.94,490.74,382.44,309.54,706.4 4,757.2
4,903.65,103.8
5,259.8 5,439.7
FY2005 FY2006 FY2007 FY2008 FY2009 FY2010 FY2011 FY2012 FY2013 FY2014
Portion in Shizuoka
Retail deposit balance in domestic branches (average balance)
4,768.6 4,827.4 4,925.0 5,043.4 5,140.0
+1,099.5
+1,130.2
5,184.1
External ratings
7,342.9
5,337.1
Deposits
7,585.6
5,537.6 8,348.2 5,868.1
Has received higher credit ratings from two overseas and
one Japanese agencies
86.888.087.988.888.989.189.982.4 85.7
78.0
32.1 30.8 31.2 29.6 27.1 24.6 26.3 26.6 26.4 25.0
110.1 113.2 116.8 119.4116.3 113.5 115.1 114.5 114.4 111.8
FY2005 FY2006 FY2007 FY2008 FY2009 FY2010 FY2011 FY2012 FY2013 FY2014
(%)
Loan-Deposit ratio + Security-Deposit ratio
Loan-Deposit ratio
Security-Deposit ratio
Total deposit balance (average) increased by JPY 1,697.3bn in 10 years since FY2005, of which JPY 1,530.4bn in Shizuoka Pref.
Has received higher credit ratings from two overseas and one Japanese agencies
(JPY bn) (JPY bn)
Deposit balance of Internet branch
(Term-end balance)
9th Medium-term
Business Plan
10th Medium-term
Business Plan 11th Medium-term
Business Plan
32
7,967.9 5,689.1
A+
A
A-
<Standard & Poor’s>
Regional banks
Except for regional banks (Mega banks, Trust banks etc.)
Shizuoka Bank
<Other external ratings>
Moody’s A1 R&I AA
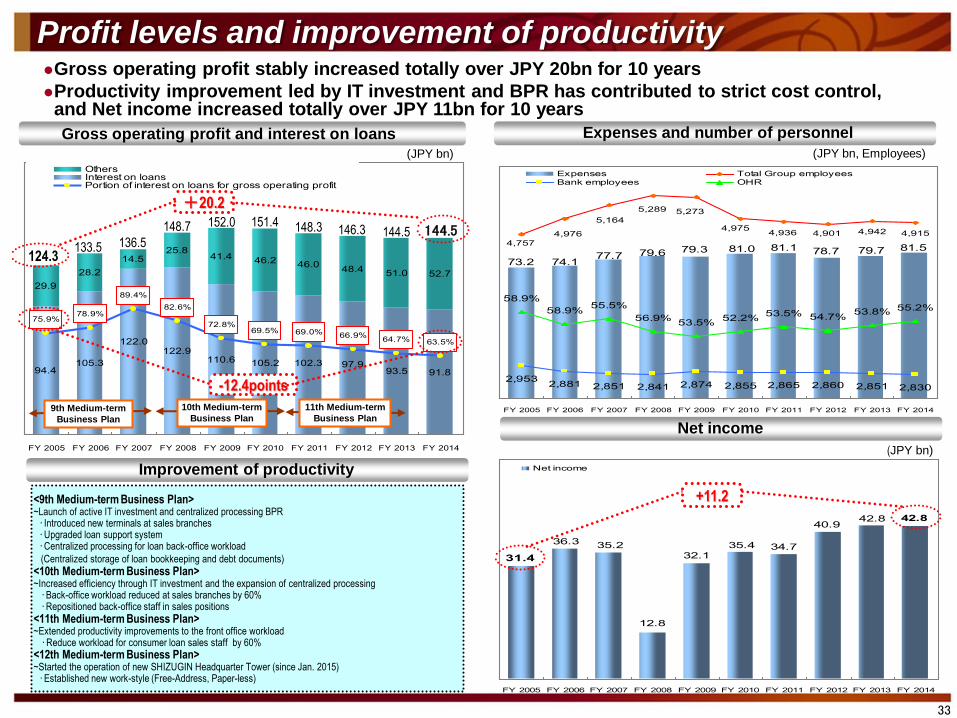
Gross operating profit stably increased totally over JPY 20bn for 10 years
Productivity improvement led by IT investment and BPR has contributed to strict cost control, and Net income increased totally over JPY 11bn for 10 years
Gross operating profit and interest on loans Expenses and number of personnel
Profit levels and improvement of productivity
<9th Medium-term Business Plan> ~Launch of active IT investment and centralized processing BPR ・Introduced new terminals at sales branches ・Upgraded loan support system ・Centralized processing for loan back-office workload
(Centralized storage of loan bookkeeping and debt documents) <10th Medium-term Business Plan> ~Increased efficiency through IT investment and the expansion of centralized processing ・Back-office workload reduced at sales branches by 60% ・Repositioned back-office staff in sales positions
<11th Medium-term Business Plan> ~Extended productivity improvements to the front office workload ・Reduce workload for consumer loan sales staff by 60%
<12th Medium-term Business Plan> ~Started the operation of new SHIZUGIN Headquarter Tower (since Jan. 2015) ・Established new work-style (Free-Address, Paper-less)
42.842.840.9
34.7
31.4
35.4
32.1
12.8
35.236.3
FY 2005 FY 2006 FY 2007 FY 2008 FY 2009 FY 2010 FY 2011 FY 2012 FY 2013 FY 2014
Net income
+11.2
93.5 91.8
29.9
28.2
14.525.8
41.4 46.2
51.0 52.7
102.3 97.9105.3
122.0122.9
110.6 105.294.4
46.048.4
75.9%78.9%
89.4%
82.6%
72.8%69.5% 69.0% 66.9%
64.7% 63.5%
FY 2005 FY 2006 FY 2007 FY 2008 FY 2009 FY 2010 FY 2011 FY 2012 FY 2013 FY 2014
OthersInterest on loansPortion of interest on loans for gross operating profit
124.3
148.3 151.4 146.3
152.0
133.5 136.5
148.7 144.5
Improvement of productivity
Net income
81.579.778.781.1
73.2
81.079.379.677.774.1
4,942 4,915
2,9532,881 2,851 2,841 2,874 2,855 2,865 2,860 2,851 2,830
4,901
5,273
4,757
4,936
5,289
4,9755,164
4,976
55.2%53.8%54.7%53.5%
52.2%53.5%
56.9%
55.5%58.9%
58.9%
FY 2005 FY 2006 FY 2007 FY 2008 FY 2009 FY 2010 FY 2011 FY 2012 FY 2013 FY 2014
Expenses Total Group employeesBank employees OHR
+20.2
-12.4points
(JPY bn) (JPY bn, Employees)
(JPY bn)
9th Medium-term
Business Plan
10th Medium-term
Business Plan
33
11th Medium-term
Business Plan
144.5

“Shizuginship” – training club for the next generation managers Business matching services
Support for business restructuring and turn-around
Region-based Relationship Banking Have further developed the relationship with customers by providing three pillars of solutions , that are, business
matching services , support for business restructuring and turn-around, and “Shizuginship”
Supporting our customers to expand their business by creating new sales opportunities
(Case, JPY bn) Have regularly held Shizugin
@gricom (agricom), a business networking event to link companies in the agricultural, forestry and fisheries sector and the food processing sector with buyers since February 2006.
Have held 12th Shizugin @gricom
(agricom) in August 2015
⇒Closed 6 deals on the day
【No. of member: (As of the end of September 2015) 】 ・826 companies, 1,241members (Case)
Reviewing of terms of repayment and utilizing external agencies and business regeneration fund to support business restructuring and turn-around
From 2005, completed
roughly 170 case of business
restructuring
【Activity achievement in FY2015 】
Content Activity achievement
Divisional forum 1 Forums
Lectures by top executive and specialists 7 Lectures
Seminar
・Executive program
・Middle management program
・Basic program
Total 18 Courses
6 Courses 3 Courses 9 Courses
Inspection tour 1 tours
Support Companies, consisting of leading companies in Shizuoka provide
opportunities of site visits and dispatch lecturers to support
Shizuginship has been managed in harmony with regional society
・No. of participant for seminars and visits of FY2015 : 768
【Trend in case】
Maintained local economy by
upholding about 14,000
employments
4,3603,953
3,5893,149
4,932
66.559.741.931.248.7
FY2010 FY2011 FY2012 FY2013 FY2014
Actual cases
Amount of new loans
1717
15 1714
FY2010 FY2011 FY2012 FY2013 FY2014
Number of business regeneration activities completedNumber of companies under the regeneration activities
65 62 55
60
34
Launched in April 2007, Shizuginship provides learning and networking opportunities to members
A membership-based service aimed at developing local businesses and the Shizuoka Prefecture economy by improving the management skills of young managers earmarked as future business leaders
69
6 35
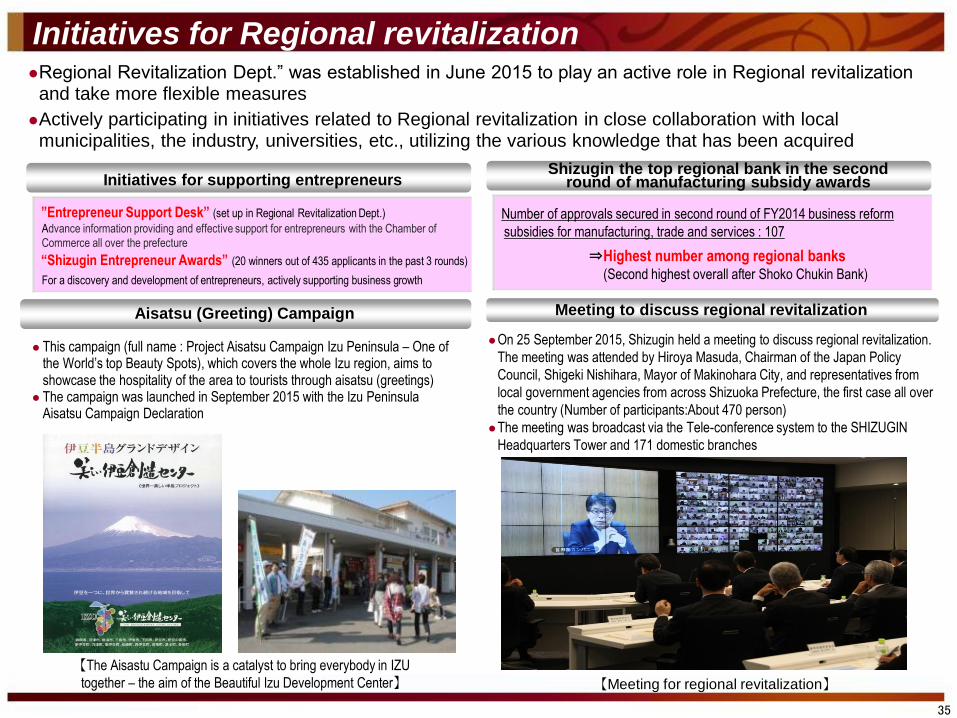
Initiatives for Regional revitalization Regional Revitalization Dept.” was established in June 2015 to play an active role in Regional revitalization
and take more flexible measures
Actively participating in initiatives related to Regional revitalization in close collaboration with local municipalities, the industry, universities, etc., utilizing the various knowledge that has been acquired
Aisatsu (Greeting) Campaign
This campaign (full name : Project Aisatsu Campaign Izu Peninsula – One of the World’s top Beauty Spots), which covers the whole Izu region, aims to showcase the hospitality of the area to tourists through aisatsu (greetings)
The campaign was launched in September 2015 with the Izu Peninsula Aisatsu Campaign Declaration
Meeting to discuss regional revitalization
On 25 September 2015, Shizugin held a meeting to discuss regional revitalization.
The meeting was attended by Hiroya Masuda, Chairman of the Japan Policy
Council, Shigeki Nishihara, Mayor of Makinohara City, and representatives from
local government agencies from across Shizuoka Prefecture, the first case all over
the country (Number of participants:About 470 person)
The meeting was broadcast via the Tele-conference system to the SHIZUGIN
Headquarters Tower and 171 domestic branches
Number of approvals secured in second round of FY2014 business reform
subsidies for manufacturing, trade and services : 107
⇒Highest number among regional banks (Second highest overall after Shoko Chukin Bank)
Shizugin the top regional bank in the second round of manufacturing subsidy awards
【The Aisastu Campaign is a catalyst to bring everybody in IZU
together – the aim of the Beautiful Izu Development Center】 【Meeting for regional revitalization】
”Entrepreneur Support Desk” (set up in Regional Revitalization Dept.)
Advance information providing and effective support for entrepreneurs with the Chamber of
Commerce all over the prefecture
“Shizugin Entrepreneur Awards” (20 winners out of 435 applicants in the past 3 rounds)
For a discovery and development of entrepreneurs, actively supporting business growth
Initiatives for supporting entrepreneurs

Corporate Governance Structure
36
As the foundation for fulfilling corporate social responsibility, The Shizuoka Bank Group is
strengthening its management systems to enhance corporate value
Outside Directors・Outside Audit & Supervisory Board Members
2 Outside Directors / 10 All Members
Kumi Fujisawa President, SophiaBank Limited
Kazuyasu Kato Former President and Chief Executive Officer, Kirin Holdings Co., Ltd.
3 Outside Audit & Supervisory Board Members / 5 All Menmbers
Mitsuhiro Ishibashi Former Director and Executive Vice President, Nippon Life Insurance Company
Kazuo Kouzuki President and Chief Executive Officer, Tokio Marine & Nichido Career Service Co., Ltd.
Yoshihiro Yamashita President, Yamashita Yoshihiro Law Office
・One third of bank’s directors and audit
& supervisory members are outside
appointments ・Shizugin is using the independent
opinions of these individuals indecision
making, oversight and auditing of the
Shizuoka Bank Group
⇒ Increase corporate value
Shizuoka Bank Group’s Corporate Governance System
*All have submitted notification to the Tokyo Stock Exchange of their independent director status
Executive Committee andother major committees*
President & CEO
Banking Div.(Operation Staff)
General Meeting of Shareholders
Remuneration Comittee
Advisory Board
Board of Directors
Internal Audit Div.(Complementing supervisory function of the Board of Directors)
Committee of Administrative Supervision
Corporate Center(Management Staff)
*Other major committees
Compliance Committee
Committee for Integrated Risk and Budget Management
Credit Committee
Audit & Supervisory Board Members(5 board members including 3 outside members)
Audit & Supervisory Board ・ Office of Audit & Supervisory Board Members
In August 2015, Shizugin established a
remuneration committee to improve the
transparency of executive pay. The committee is
made up of all the bank’s outside directors, outside
audit & supervisory board members and
representative directors.

Strategic shareholdings
37
Only holding strategic shareholdings when justified from the standpoint of business investment, strengthening business relationships, or contributing to the regional economy
Reviewing the reasons and assess the economic rationale for strategic shareholdings on a regular basis, reducing the holding value of the shares as required
Prime cost of strategic shareholdings* Policy on strategic shareholdings
(Corporate Governance Code : general principles 1-4)
101.1101.8104.3
107.6110.2111.3112.7
144.1
Mar. 2000 Mar. 2010 Mar. 2011 Mar. 2012 Mar. 2013 Mar. 2014 Mar. 2015 Sep. 2015
Prime cost
*Except for equity method affiliate
The bank only holds strategic shareholdings when
justified from the standpoint of business investment,
strengthening business relationships, or
contributing to the regional economy
The bank also regularly reviews the rationale for
holding the shares based on profitability, share
prices and other criteria
Shares deemed to be no longer important for the
bank are sold on the market after taking into
consideration the impact on market conditions and
other factors
The bank also works to ensure appropriate and
efficient management, taking into account the level
of equity capital and the use of other assets in
operations such as lending
(JPY bn)
227.2 201.5 198.2 258.0 230.5 359.1 321.1 387.1
Book value

Share of all-Japan National ranking
Population 3.71 m 2.9% 10th of 47 (2014)
No. of households 1.53 m 2.7% 10th of 47 (2015)
Nominal prefectural GDP JPY 15.5 tn 3.1% 10th of 47 (FY2012)
Per-capita income JPY 3.195 m - 3rd of 47 (FY2012)
No. of business
establishments* 180 K 3.1% 10th of 47 (2014)
Amount of shipments of
manufactured goods, etc.* JPY 15.8 tn 5.3% 3rd of 47 (2014)
Agricultural output JPY 213.8 bn 2.5% 16th of 47 (2013)
Fishery production volume 200 k tons 5.3% 4th of 47 (2014)
No. of industrial locations 117 4.7% 4th of 47 (2014)
No. of new housing starts 26 k 2.8% 11th of 47 (2014)
Prefectural GDP (2012, Nominal)
Rank Prefecture/Region (US$ billions)
9 Fukuoka Prefecture 215.6
10 Shizuoka Prefecture 186.4
11 Ibaraki Prefecture 140.1
- 4 prefectures of Shikoku 162.2
- 3 prefectures of Hokuriku 143.3
GDP comparison with countries (2012)
Rank Country (Region) (US$ billions)
51 Kazakhstan 203.5
52 Peru 192.7
53 Qatar 190.2
- Shizuoka Prefecture 186.4
54 Ukraine 175.7
55 Kuwait 174.0
Shizuoka Prefecture indices Shizuoka Prefecture economic scale
38
* Based on flash reports *Sources: Economic and Social Research Institute (ESRI)
Cabinet Office , Government of Japan
Accounts for 3% share of all-Japan. Ranks 10th in the scale of economy among prefectures
Has greater GDP than total GDP of 4 prefectures in Shikoku or 3 prefectures in Hokuriku
Compared to countries, its GDP is ranked next to the Kazakhstan, Peru, and Qatar
Economic scale of Shizuoka Prefecture

Positioned as distribution hub between Tokyo and Osaka/Kyoto
Represents leading manufacturing prefecture in Japan
Owns a lot of export-driven companies related to handling
machinery of transportation and music instrument and so forth
Has many of representative tourist locations coming from its
rich natural environments
No. of listed companies with HQs
in Shizuoka Prefecture
Percentage distribution of Shizuoka Prefecture GDP by industry
20.637.8
22.2
17.915.3
9.115.8
13.25.8
5.2
20.3 16.8
All-Japan Shizuoka Pref.
Manufacturing Service Wholesale/Retail Real estate Construction Other
(%)
Economy in Shizuoka Prefecture and current state
Shin-Tomei Expressway
(between Mikkabi and Gotemba)
Apr.2012 Opened to traffic
Tomei
Expressway ● HAMAMATSU PHOTONICS
● YAMAHA
● SUZUKI ● YAMAHA MOTOR
The Port of
Omaezaki
Mt. Fuji Shizuoka Airport
Source: Cabinet Office , Government of Japan, FY2012
*As of the end of Nov. 2014, companies listed on more
than one exchange were counted as TSE-listed
Hot-spring area
●TOSHIBA MACHINE
The Port of
Tagonoura
● STAR MICRONICS
● SHIZUOKA BANK
The Port of Shimizu
Mt. Fuji
Inscribed on the World
Heritage List as
“Fujisan, sacred place
and source of artistic
inspiration”
Source :Shizuoka Prefecture Tourism Association
Listing No. of companies
TSE 1st section 22
TSE 2nd section 12
Mothers 1
Jasdaq 18
Total 53
39

This document includes statements concerning future business results.
These statements do not guarantee future business results, but contain risks and uncertainties.
Please note that future business results may differ from targets for reasons such as changes
in the business environment.