november boungou-visit final-low
TRANSCRIPT

UNEARTHINGTHE FUTURE
BOUNGOU VISITBurkina Faso | 13-14 November 2017
This presentation contains forward-looking statements. Forward-looking statements involve known and unknown risks, uncertainties and assumptions and accordingly, actual results and
future events could differ materially from those expressed or implied in such statements. You are hence cautioned not to place undue reliance on forward-looking statements. Forward-
looking statements include words or expressions such as “development”, “payback period”, “during the first three years", “projected", “LOM plan", “life of mine”, “schedule”, “estimate”,
“initial”, “next step”, “growth story”, “objectives”, “continues”, "on time and on budget“, “upside" and other similar words or expressions. Factors that could cause future results or events
to differ materially from current expectations expressed or implied by the forward-looking statements include the ability to begin production at Boungou in Q3 2018, the ability to meet the
various highlights of the feasibility study of Boungou, including with respect to the (i) project economics at $1,100/oz, (ii) anticipated average annual production, total cash cost, AISC
and head grade during the first three years, (iii) ability to produce some 1.2 million ounces over a projected LOM in excess of 7 years, and (iv) projected LOM total cash cost and AISC,
the ability to meet Boungou’s projected LOM Plan, cash flow, mine and processing schedule over eight years, the ability to complete the construction of Boungou on time and on budget,
the ability to convert inferred resources in the West and East Boungou flanks to indicated resources and to complete a PFS in Q1 2018, the ability to improve Boungou’s production and
economics as of year 4, the ability to meet all of the operating, mining, process plant and consumables costs as well as the other mining parameters set forth in the Boungou NI-43 101
Technical Report dated March 23, 2016, the accuracy of our assumptions, fluctuation in the price of currencies, gold prices and operating costs, mining industry risks, uncertainty as to
calculation of mineral reserves and resources, delays, political and social stability in Africa (including our ability to maintain or renew licenses and permits) and other risks described in
SEMAFO’s documents filed with Canadian securities regulatory authorities. You can find further information with respect to these and other risks in SEMAFO’s 2016 Annual MD&A, as
updated in SEMAFO’s 2017 First Quarter MD&A, 2017 Second Quarter MD&A, 2017 Third Quarter MD&A and other filings made with Canadian securities regulatory authorities and
available at www.sedar.com. These documents are also available on our website at www.semafo.com. SEMAFO disclaims any obligation to update or revise these forward- looking
statements, except as required by applicable law.
We also advise you that the terms “Inferred Resources” and “Indicated Resources”, although recognized and required by the Canadian Securities Administrators, are not recognized by
the US Securities and Exchange Commission. There is no certainty that Inferred Resources or Indicated Resources will be economically mineable.
All mineral resources are exclusive of mineral reserves.
All amounts are in US dollars unless otherwise indicated.2
FORWARD-LOOKING STATEMENTS
Unearthing the future

3
SUMMARY
1. HIGHLIGHTS
2. GEOLOGY – RESERVES & RESOURCES
3. CONSTRUCTION
─ PROCESSING
─ TIMETABLE
4. MINING
─ MINING PARAMETERS
─ HUMAN RESOURCES
5. EXPLORATION UPSIDE
6. CSR

4
Christian Cloutier, Engineering Manager & Natougou Project Manager
Michel Crevier, VP Exploration & Mine Geology
Benoit Desormeaux, President and Chief Executive Officer
Sylvain Duchesne, VP Engineering & Construction
Ruth Hanna, Analyst, Investor Relations
Robert Lavallière, VP Corporate Affairs & Investor Relations
Patrick Moryoussef, VP Mining Operations
Sébastien Perreault, Mine Superintendant
Philippe Sénéchal, Chief of Health & Security Services
SEMAFO PARTICIPANTS
5
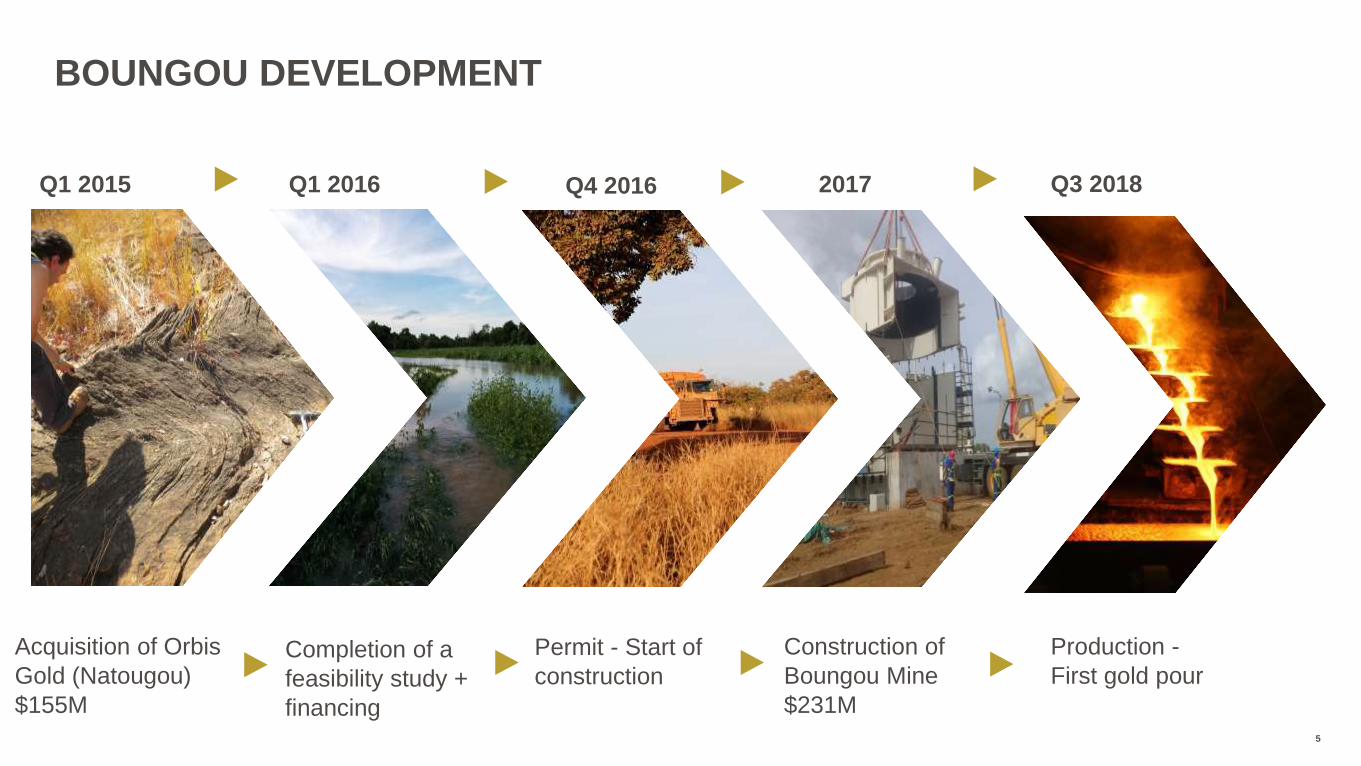
BOUNGOU DEVELOPMENT
Q1 2015 Q1 2016 2017 Q3 2018
Acquisition of Orbis
Gold (Natougou)
$155M
Completion of a
feasibility study +
financing
Construction of
Boungou Mine
$231M
Production -
First gold pour
Q4 2016
Permit - Start of
construction

6
BOUNGOU: A HIGH QUALITY PROJECT
A $155M ACQUISITION IN 2015
FROM SCOPING STUDY TO PRODUCTION IN THREE YEARS
During the first three years
• Average annual production of more than 226,000 ounces
• Average total cash cost of $283/oz and AISC of $374/oz
• Average head grade 5.72 g/t at a gold recovery rate of 93.8%
Projected LOM total cash cost of $408/oz and AISC of $518/oz
Maiden open pit mineral reserves of 9.6 million tonnes at a grade of 4.15 g/t Au for 1,276,000 ounces of gold
Base case at $1,100/oz:
• CAPEX $231M
• After-tax NPV 5%: $262 million
• After-tax IRR: 48%
• Payback period: 1.5 years
Production of some 1.2 million ounces over a projected LOM in excess of 7 years
Unearthing the future

7
ROBUST PROJECT ECONOMICS
GOLD PRICE SENSITIVITY ANALYSIS
Base Case
Gold Price ($/oz) $1,100 $1,200 $1,300
After-tax NPV5% ($M) $262 $334 $400
After-tax IRR (%) 48 58 68
Payback period (years) 1.5 1.3 1.2
Feasibility Study Assumptions
• Gold price of $1,100 per ounce
• Heavy fuel oil (HFO): $0.69 per liter
• Light fuel oil (LFO): $1.08 per liter
• Exchange rate: $0.72 US to the Canadian dollar
• Exchange rate: $1.09 US to the EURO
• NPV calculated using a 5% discount rate
• Based on the 2015 Burkina Faso mining code
As at September 30, 2017
• $1,279 per ounce
• $0.61 per liter
• $1.06 per liter
• $0.80 US to the Canadian dollar
• $1.18 US to the EURO

8Unearthing the future
Total or
Average Construction Year Year Year Year Year Year Year Year
LOM Period 1 2 3 4 5 6 7 8
MINE SCHEDULE
Waste Mined (t) 67,840,054 17,020,156 12,508,621 8,614,138 4,665,928 11,570,114 11,507,941 1,953,156
Pre-stripping Activity (t) 18,109,796 18,109,796
Capitalized Stripping Activity (t) 43,835,775 3,087,493 7,262,607 10,134,443 14,789,050 4,608,056 3,954,126 -
Ore Mined (t) 9,567,241 72,610 1,714,444 1,712,439 2,120,648 1,053,503 1,262,403 1,178,712 452,482
Ore Grade (g/t) 4.15 2.48 5.01 4.55 4.68 3.11 3.93 2.90 3.46
Total Mined (t) 139,352,866 18,182,406 21,822,093 21,483,667 20,869,229 20,508,481 17,440,573 16,640,778 2,405,638
Operational Stripping Ratio 7.1 9.9 7.3 4.1 4.4 9.2 9.8 4.3
Total Stripping Ratio 13.6 11.7 11.5 8.8 18.5 12.8 13.1 4.3
PROCESSING SCHEDULE
Ore Processed 9,567,241 1,256,010 1,343,200 1,343,200 1,343,200 1,346,880 1,343,200 1,343,200 248,351
Head Grade (g/t) 4.15 5.93 5.59 5.65 3.63 3.92 2.74 2.18 1.53
Recovery (%) 92.9% 93.9% 93.7% 93.7% 92.4% 92.7% 91.2% 90.0% 87.4%
Gold - Recovered (oz) 1,184,955 224,918 226,100 228,502 144,617 157,305 108,030 84,807 10,676
REVENUES (in $000s) 1,305,389 247,664 248,982 251,624 159,351 173,309 119,105 93,560 11,794
COST OF PRODUCTION (427,912) (61,768) (58,181) (40,992) (52,783) (67,179) (68,846) (64,883) (13,280)
OTHER OPERATING COSTS
Royalties (52,215) (9,907) (9,959) (10,065) (6,374) (6,932) (4,764) (3,742) (472)
Selling Costs (3,155) (585) (589) (597) (390) (422) (299) (242) (31)
Other (19,406) (3,393) (3,214) (3,042) (1,918) (2,625) (2,180) (1,925) (1,109)
Taxes (97,411) - - (36,788) (36,027) (8,048) (12,875) (3,673) -
Working Capital - (6,729) (7,708) (16,721) 5,979 1,362 3, 398 17,301 3,118
Initial Capex (212,173) (212,173)
Initial Supplies Inventory - (7,218) 3,609 3,609
Sustaining Capex (25,043) (6,690) (5,919) (1,500) (5,121) (1,500) (2,813) (1,500) -
Capitalized Stripping Activity (105,099) (7,028) (17,112) (23,660) (35,807) (11,332) (10,160) - -
Deferred Capex (15,249) (3,539) (5,257) (5,455) (998) - - - -
Rehabilitation & Closure Costs (17,249) (257) (257) (257) (257) (257) (257) (257) (15,450)
CASH FLOW 330,477 (219,391) 147,768 140,786 112,547 25,655 76,376 20,309 38,248 (11,821)
Total Cash Cost /oz 408 319 304 227 412 474 684 812 1,284
All-in Sustaining Cost /oz 518 380 406 337 695 555 804 830 1,284
BOUNGOU
LOM PLAN
AND CASH FLOW
* Reference NI 43-101 Technical Report
March 23, 2016

Year 1 Year 2 Year 3 Year 4 to 8 TOTAL LOM
MINE SCHEDULE
Ore mined (t) 1,714,444 1,712,439 2,120,648 4,019,710 9,567,241
Head grade (g/t) 5.01 4.55 4.68 3.33 4.15
Waste mined (t) 17,020,156 12,508,621 8,614,138 29,697,139 67,840,054
Capitalized stipping activity (t) 3,087,493 7,262,607 10,134,443 23,351,232 43,835,775
Operational stripping ratio 9.9 7.3 4.1 7.4 7.1
Total stripping ratio 11.7 11.5 8.8 13.2 11.7
PROCESSING SCHEDULE
Ore processed (t) 1,256,010 1,343,200 1,343,200 5,624,831 9,567,241
Head grade (g/t) 5.93 5.59 5.65 3.05 4.15
Recovery (%) 93.9% 93.7% 93.7% 91.7% 92.9%
Gold - Recovered (oz) 224,918 226,100 228,502 505,435 1,184,955
Total cash cost/oz 319 304 227 575 408
All-in sustaining cost/oz 380 406 337 710 518
* Reference NI 43-101 Technical Report March 23, 2016
LIFE OF MINE
9

CAPITAL ESTIMATE SUMMARY BY AREA
Initial Capital Expenditures $M
Indirect construction 13.6
Processing plant 42.3
Reagents and plant services 13.7
Infrastructure 53.8
Owner costs 15.8
EPCM costs 15.9
Resettlement action plan 8.0
Initial supplies inventory 7.2
Plant & infrastructures subtotal 170.3
Pre-stripping 42.4
Contingency 18.7
Grand Total 231
2016 - $17M
2017(E) - $160M
2018 (E) - $54M10
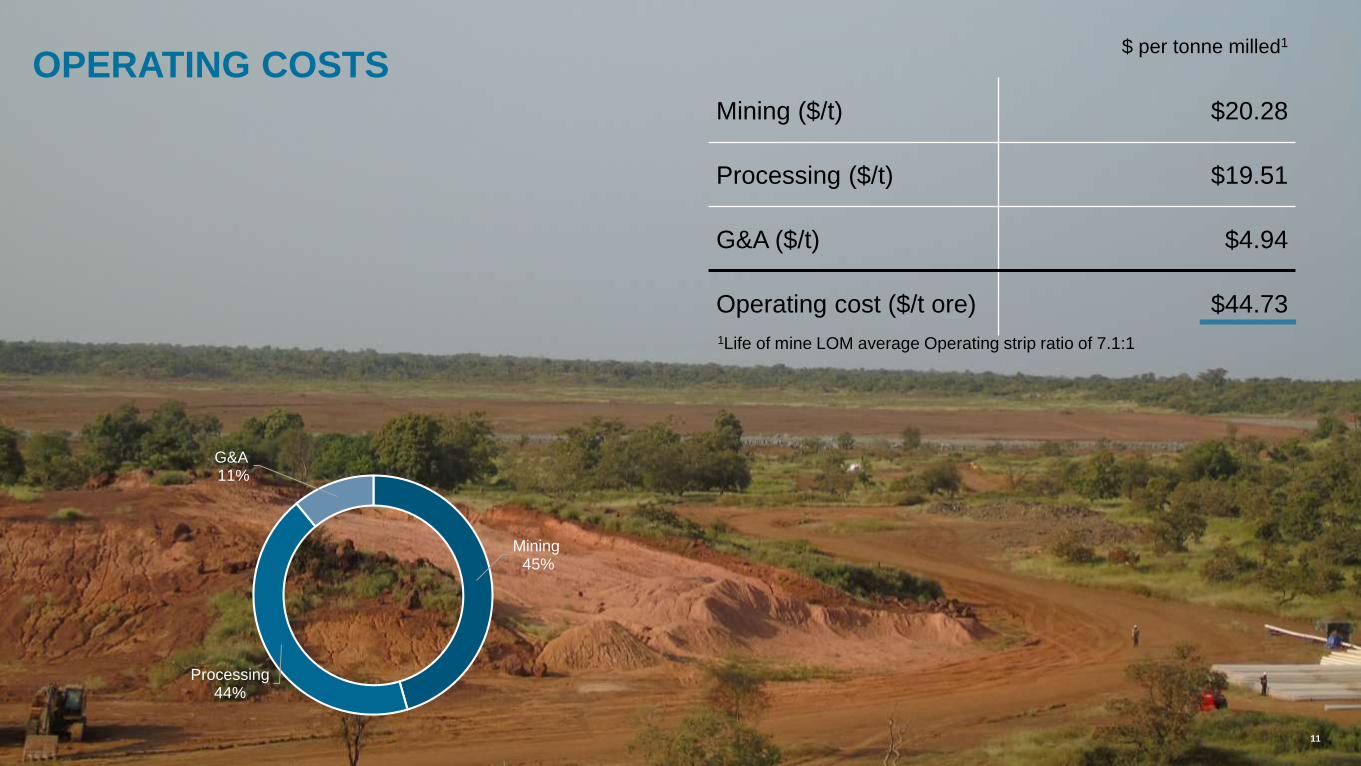
OPERATING COSTS$ per tonne milled1
Mining ($/t) $20.28
Processing ($/t) $19.51
G&A ($/t) $4.94
Operating cost ($/t ore) $44.73
1Life of mine LOM average Operating strip ratio of 7.1:1
Mining45%
Processing44%
G&A11%
11

12
DETAILED COSTS
Cost Centre US$ /t Ore
Operating Consumables $4.99
Plant Maintenance $1.64
Laboratory (Plant) $0.08
Power (fuel only) $7.09
Power Plant Costs $1.57
TPA Exoneration ($0.10)
Labour (Plant Operations & Maintenance)$4.24
Subtotal – Process Plant $19.51
General & Administration $3.13
Labour (Administration) $1.81
Subtotal - General & Administration $4.94
Total $24.45
Mining Activity - US$/t mined Cost
Load $0.21
Haul $0.44
Drill & Blast $0.82
Pre-Split $0.08
Grade Control $0.07
Auxiliary Equipment $0.23
ROM Rehandle $0.07
Long term Stockpile Rehandle $0.05
Dewatering $0.02
Geology $0.07
Management, Supervisory and Fixed Roles $0.29
Miscellaneous Operational Overheads $0.03
Contracted Services $0.09
TOTAL $2.47
Mining Operating Cost Process Plant Consumables Cost
Plant Area US$ /t ore
Feed Preparation $0.13
Milling $1.18
Leaching & CIP $0.18
Elution / Goldroom $0.01
Reagents $2.39
Water Treatment & Cleaning $0.03
Fuel (plant and mobile equipment) $1.07
Total $4.99
Process Plant Operating Cost

13
GEOLOGY

14
PROPERTY Tapoa1,2,3,4,5 (Natougou Project)
MINERAL RESERVES
Proven
Tonnes 1,583,000
Grade (g/t Au) 6.46
Ounces 329,000
Probable
Tonnes 7,984,000
Grade (g/t Au) 3.69
Ounces 947,000
TOTAL MINERAL RESERVES
Tonnes 9,567, 000
Grade (g/t Au) 4.15
Ounces 1,276,000
MINERAL RESOURCES (exclusive of reserves)
Measured
Tonnes 70,000
Grade (g/t Au) 1.90
Ounces 4,000
Indicated
Tonnes 2,602,000
Grade (g/t Au) 2.48
Ounces 207,000
TOTAL M&I
Tonnes 2,672,000
Grade (g/t Au) 2.46
Ounces 211,000
Inferred
Tonnes 6,298,000
Grade (g/t Au) 3.72
Ounces 754,000
MINE RESERVES AND RESOURCES (DEC. 31, 2016)
1 The Corporation indirectly owns a 100% interest in all of its permits, except for the permits held
by SEMAFO Boungou S.A., in which the Government of Burkina Faso holds a 10% interest.2 Mineral reserves and resources at Mana and at Tapoa (Natougou Project) were estimated
using a gold price of $1,100 and $1,400 per ounce, respectively.3 Rounding of numbers of tonnes and ounces may present slight differences in the figures.4 All mineral resources reported are exclusive of mineral reserves.5 As of December 31, 2016.
Drill typeNumber of
holes
Pre-collartotal length
(m)
Diamond tails total length
(m)
Averagetotal depth
(m)
Total length(m)
Diamond 174 - 9,029 51.89 9,029
Multi-purpose 625 34,937 19,569 87.21 54,505
RC 550 51,712 - 94.02 51,712
Total 1,349 86,649 28,598 85.43 115,246
Category Grid
Inferred 80 x 80 meters
Indicated/Probable 40 x 40 meters
Measured/Proven 20 x 20 meters
Grade Control 10 x 10 meters

BOUNGOU PIT DESIGNS
15

CONSTRUCTION - BOUNGOU DEVELOPMENT
16

Tail thickener
Overflow ore
stockpile
Leach tanks
Surge bin
Pebble crusher
Milling
Primary crusher
Refining
Process and raw water tanks
Process water pond
ROM PAD
Plant workshop
Plant office
Desorption
CIP
Oxygen plant
Reagents
Warehouse
Plant mess
Gatehouse
Grinding media
storage
Event pond
17

18
PROCESS PLANT PROGRESSAS AT OCTOBER 31, 2017
Surge Bin VertimillCrusher
SAG MillROM Pad
Leach Tanks
Gatehouse
Raw Water Tank
Main Kitchen + Mess

PARAMETERS
Throughput 4,000 tpd
Elution AARL
Hardness WBI = 18-21 kWh/t
Grinding circuit SAG and Vertimill (VTM)
Grind fineness 63µm
Lixiviation CIP + carrousel
Gravity YES
Retention time 36 hours
O2 plant+ Lead Nitrate PbNO3 YES
Thickeners YES (2: Pre-lixiviation+ tailings)
Tailings storage facility With geomembrane (As) 62-65 % solids
Stockpile Reclaim Surge Bin
Water Water storage facility of 1.8 Mm3, High density tailings
Power plant – 0.18$/kWh Hybride DFO+HFO, capacity 15.4 MW, avg
consumption 6.4 MW
PROCESS PLANT
19

20
DESIGN CRITERIA
DESIGN BASIS UNIT NOMINAL
Metal Recovery @ 36 hrs and 63µm Gravity / ILR Recovery Au % 50.0
Leach-Carousel (36hrs) Au % 42.0
Overall Au % 92.0
Annual Ore Processing Feed Rate Mtpa 1.34
Nominal Plant Throughput dry tpd 4,000
Availability % 92.0
Feed Rate Operating dry t/h 167
Particle Size Information
Crusher C130 P80 mm 133
SAG Mill 20 ft 2400 kW T80 µm 1,000 - 3,000
Tower Mill VTM 4500 P80 µm 63
REAGENT UNIT NOMINAL
Consumption
Lime kg/t 0.44
Cyanide kg/t 0.50
SAG mill media kg/t 0.40
Tower mill media kg/t 0.70

OVERALL PROCESS FLOW DIAGRAM
21

22
LOCATION OF SURFACE WATER SOURCES AND STORAGE
B
D
A
CE
Nominal Capacity
A ► 75,000 m3
B ► 100,000 m3
C ► 100,000 m3
D ► 500,000 m3
E ► 1,100,000 m3

2016 2017 2018
Q1 Q2 Q3 Q4 Q1 Q2 Q3 Q4 Q1 Q2 Q3 Q4
Mining Permit Award
Detailed Engineering
Earthworks
Accommodation Construction
Water Storage Facility & Dams
Tailing Storage Facility
Milling
Feed Preparation
Leaching & CIP Circuit
Gold Room
Plant Services
Power Plant
Fuel Depot
Pre-Stripping
Mining Ore
1st Gold Pour
Process
Plant
The water storage facility is already functional
%
complete
100%
100%
42%
94%
75%
22%
33%
31%
77%
0%
36%
58%
35%
30%
0%
0%
23
CONSTRUCTION CONTINUES ON TIME AND ON BUDGET
63% complete
$113M out of $231M spent
All major long-lead items on site
On time for first gold pour in Q3 2018
1,695 workers on site
2.5 M man-hours without lost time injury
As at September 30, 2017
Unearthing the future

Pre-stripping Boungou Pit:
5.3 Mt Moved
Pebble and Reclaim Areas
Delivery of SAG Mill
24
First Lift - Construction of Tailings Storage Facility
23

OPÉRATIONS
MINING
25

SITE LAYOUT*
26
*Reference:
NI 43-101 Technical Report, March 23, 2016

SLOPE DESIGN GUIDELINES FOR THE AMC PROPOSED FINAL PIT
MaterialBatter
Height (m)
Batter
Angle (°)
Berm width
(m)
Inter-ramp
Angle (°)
Soil and extremely
weathered rock5 – 10 (1) 26.5 6 -
Highly weathered rock 12 45 6 33.7
Moderately weathered to
fresh rock18 70 - 80 4.5 58.5 – 66.9
OPEN PIT EQUIPMENT REQUIREMENTS
Equipment Main activity Number
Komatsu PC 1250 (Excavator)Ore mining (day shift), waste
mining (night shift)2
Komatsu PC 2000 (Face shovel) Waste mining 2
Komatsu HD 605 (63 t haul truck) Hauling of ore and waste 13
CAT D8 (dozer) Ancillary work 2
CAT 834 (wheel dozer) Ancillary work 1
CAT 16 (grader) Ancillary work 1
Water truck (45,000 L) Dust suppression 1
Atlas Copco DM25 (Production drill) Production drilling 6
Atlas Copco MD 5150C (pre-split drill)Pre-split drilling and ore
contact drilling1
WA 600 (Wheel loader) ROM loader 1
The deposit will be mined from three distinct pits,
approximately
580 to 1,800 meters long
300 to 500 meters wide
50 to 80 meters deep
50 to 100 meters apart
Haulage ramps will be 20-meter wide
at a 10% gradient
A regularized mining model suitable for mine planning
with block dimensions of
5 meters in X (East direction) * 5 meters
in Y (North direction) * 2 meters in
Z direction (will be adjusted to accommodate vein dip)
Mining will take place on 6-meter benches
Ore loss 5%; dilution 18%
Grade control - RC drilling 10 meters x 10 meters
Five-year mining contract signed with AMS
MINING PARAMETERS
27

CUTBACK RANKING
PTWA1 starter pit
PTWA1 starter pit
~ half of project value
PTEN2
PTEN1 / IP8
PTES2
PTES1 / IP9
PTWA4 / IP4
PTWA3
PTWA6 / IP3
PTWA2 / IP2
PTWA1 / IP1
PTWA5 / IP528

PIT CONTRIBUTION
Pre-stripping required (Period -1)
29

MILL FEED AND STOCKPILE BALANCE
30

• A total of 2,820 hours of training dispensed to employees year to date
• Unskilled positions will mainly be filled by candidates from the Partiaga
Commune. Skilled positions will be sourced from Burkina Faso at large,
but we expect many to come from the Eastern region.
• Three-year collective agreement with Boungou employees
31
FOCUS ON HIRING LOCAL EMPLOYEES - OPERATIONS
30
244
SEMAFO Boungou S.A.
Expatriates
Local employees
28
392
AMS Mining Contractor
Expatriates
Local employees
58
812
TOTAL EMPLOYEES
Expatriates
Local employees
Security – Catering – Others
176 local employees

| EXPLORATION UPSIDE |

33
NEAR-TERM UPSIDE AT BOUNGOUWEST AND EAST FLANKS
WEST FLANK
EAST FLANK
Unearthing the future
Discovery of West and East Flanks in 2016
Our objectives:
To convert inferred to indicated resources
• Infill drilling completed at the end of August 2017
To complete a PFS in Q1 2018
To improve production and economics
as of year 4
34
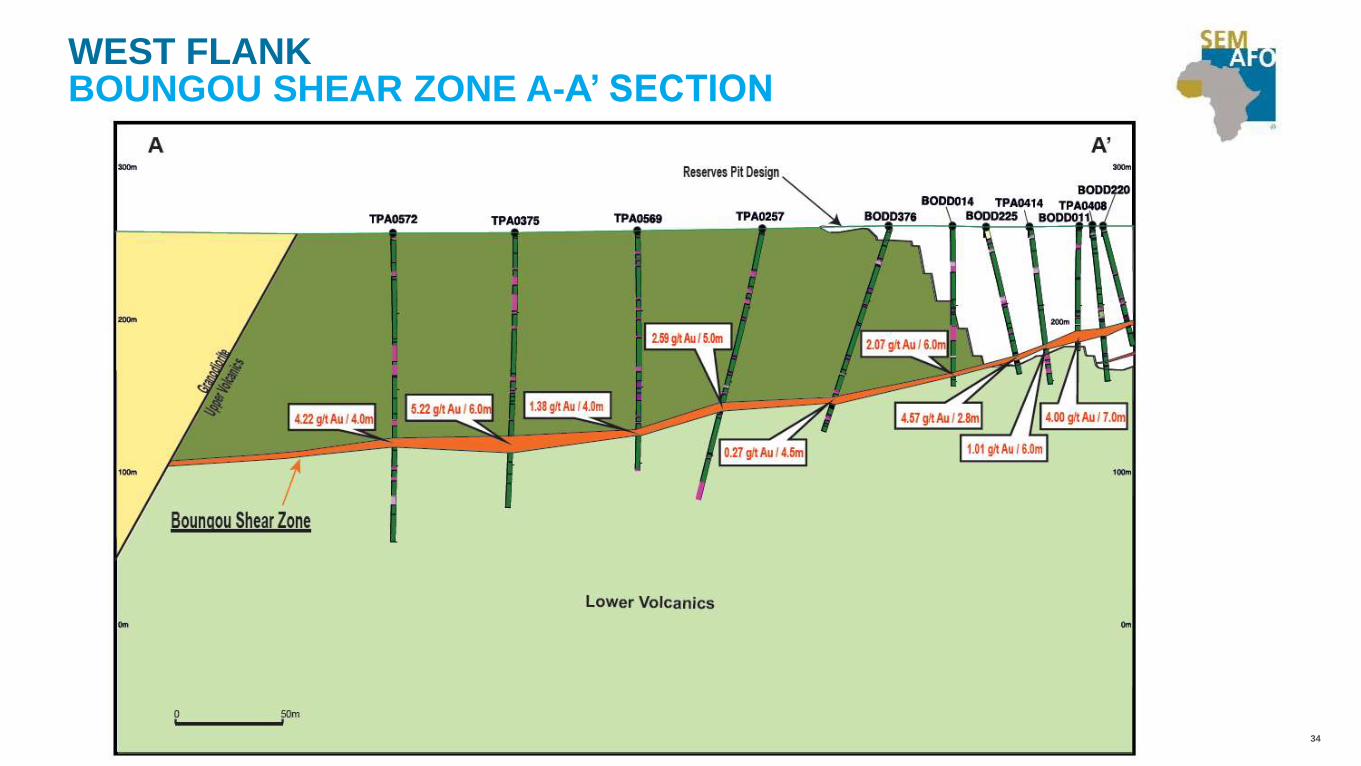
WEST FLANKBOUNGOU SHEAR ZONE A-A’ SECTION

3535
WEST FLANKBOUNGOU SHEAR ZONE B-B’ SECTION

NEXT STEP IN OUR GROWTH STORYREGIONAL EXPLORATION AT BOUNGOU
Boungou
4,000m
Pambourou
3,000m
Dangou Est
3,000m
Dangou Nord
2,000m
Bossoari
1,600m
Pambourou Nord
1,500m
Scheduled RC drilling
15,000m in H2 2017
36Unearthing the future
Boungou Mine

37
SOCIAL INVESTMENT AT THE HEARTOF OUR VALUE CREATION
Corporate Social Responsability
Resurfaced 115 kilometer of regional roads Constructed 2 schools, 3 grain banks, 3 freshwater wells, 3 sets of latrines and a
sewing center Developed and provided masonry, sewing, management and literacy courses Supported local entrepreneurs in sewing and organic sesame revenue-generating
projects
38
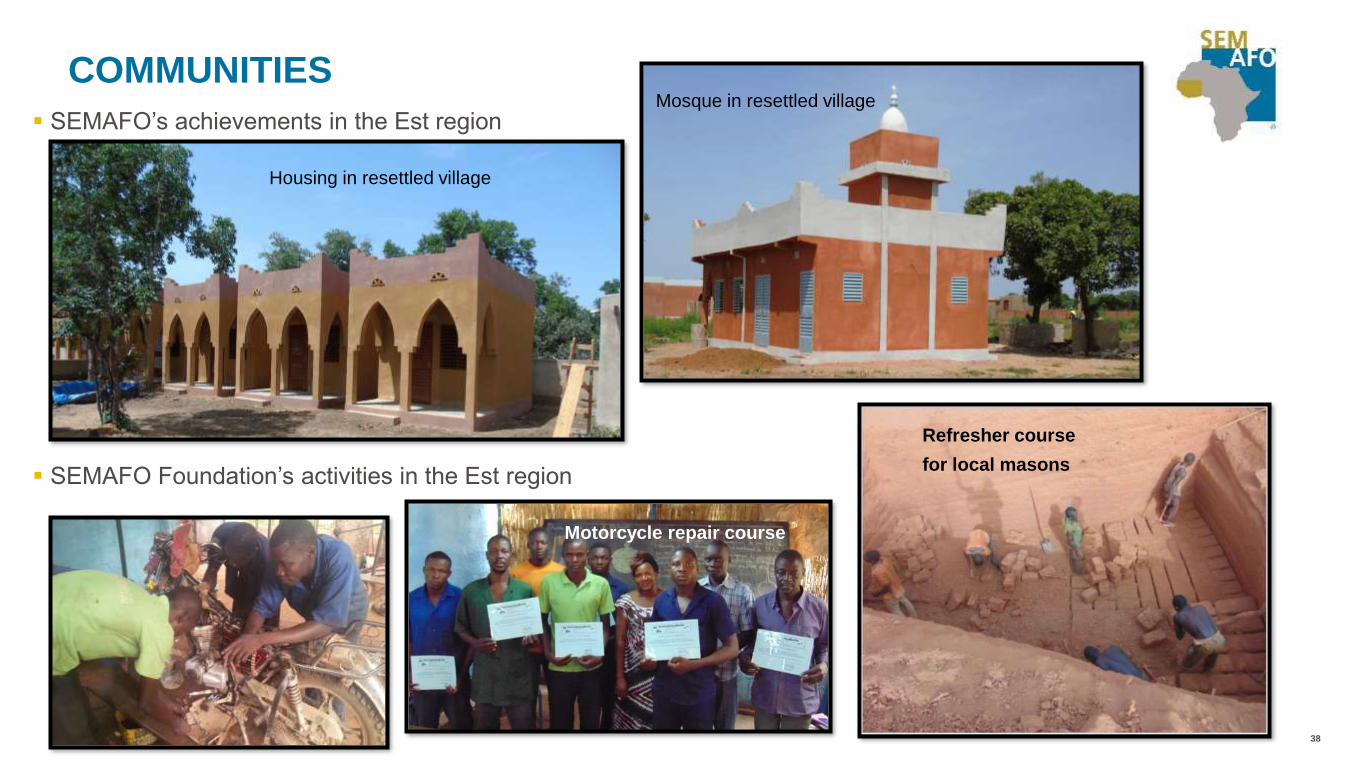
COMMUNITIES
SEMAFO’s achievements in the Est region
Housing in resettled village
Mosque in resettled village
SEMAFO Foundation’s activities in the Est region
Motorcycle repair course
Refresher course
for local masons

39
COMMUNITIES
SEWING CENTER
First order for Boungou mine work clothes
40
| APPENDICES|
41
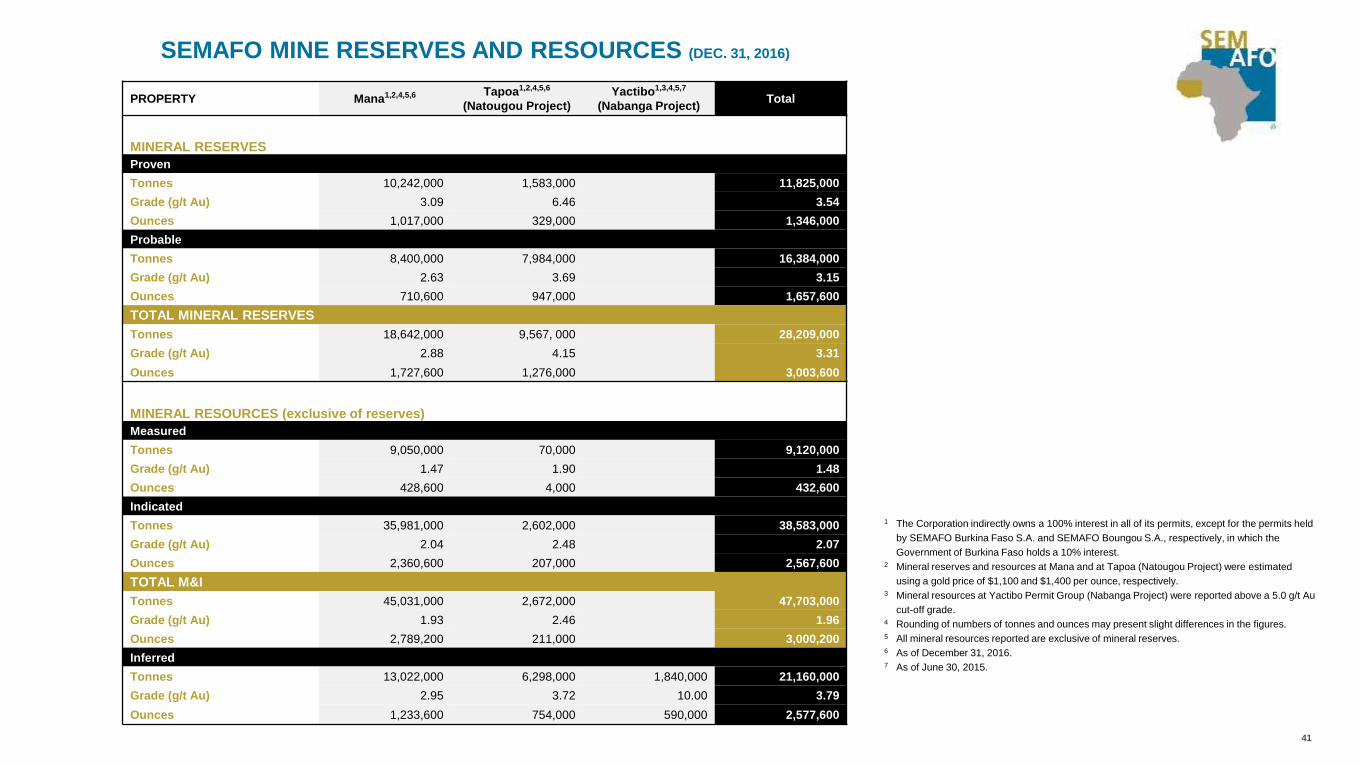
PROPERTY Mana1,2,4,5,6 Tapoa1,2,4,5,6
(Natougou Project)
Yactibo1,3,4,5,7
(Nabanga Project)Total
MINERAL RESERVES
Proven
Tonnes 10,242,000 1,583,000 11,825,000
Grade (g/t Au) 3.09 6.46 3.54
Ounces 1,017,000 329,000 1,346,000
Probable
Tonnes 8,400,000 7,984,000 16,384,000
Grade (g/t Au) 2.63 3.69 3.15
Ounces 710,600 947,000 1,657,600
TOTAL MINERAL RESERVES
Tonnes 18,642,000 9,567, 000 28,209,000
Grade (g/t Au) 2.88 4.15 3.31
Ounces 1,727,600 1,276,000 3,003,600
MINERAL RESOURCES (exclusive of reserves)
Measured
Tonnes 9,050,000 70,000 9,120,000
Grade (g/t Au) 1.47 1.90 1.48
Ounces 428,600 4,000 432,600
Indicated
Tonnes 35,981,000 2,602,000 38,583,000
Grade (g/t Au) 2.04 2.48 2.07
Ounces 2,360,600 207,000 2,567,600
TOTAL M&I
Tonnes 45,031,000 2,672,000 47,703,000
Grade (g/t Au) 1.93 2.46 1.96
Ounces 2,789,200 211,000 3,000,200
Inferred
Tonnes 13,022,000 6,298,000 1,840,000 21,160,000
Grade (g/t Au) 2.95 3.72 10.00 3.79
Ounces 1,233,600 754,000 590,000 2,577,600
SEMAFO MINE RESERVES AND RESOURCES (DEC. 31, 2016)
1 The Corporation indirectly owns a 100% interest in all of its permits, except for the permits held
by SEMAFO Burkina Faso S.A. and SEMAFO Boungou S.A., respectively, in which the
Government of Burkina Faso holds a 10% interest.2 Mineral reserves and resources at Mana and at Tapoa (Natougou Project) were estimated
using a gold price of $1,100 and $1,400 per ounce, respectively.3 Mineral resources at Yactibo Permit Group (Nabanga Project) were reported above a 5.0 g/t Au
cut-off grade.4 Rounding of numbers of tonnes and ounces may present slight differences in the figures.5 All mineral resources reported are exclusive of mineral reserves.6 As of December 31, 2016.7 As of June 30, 2015.
42
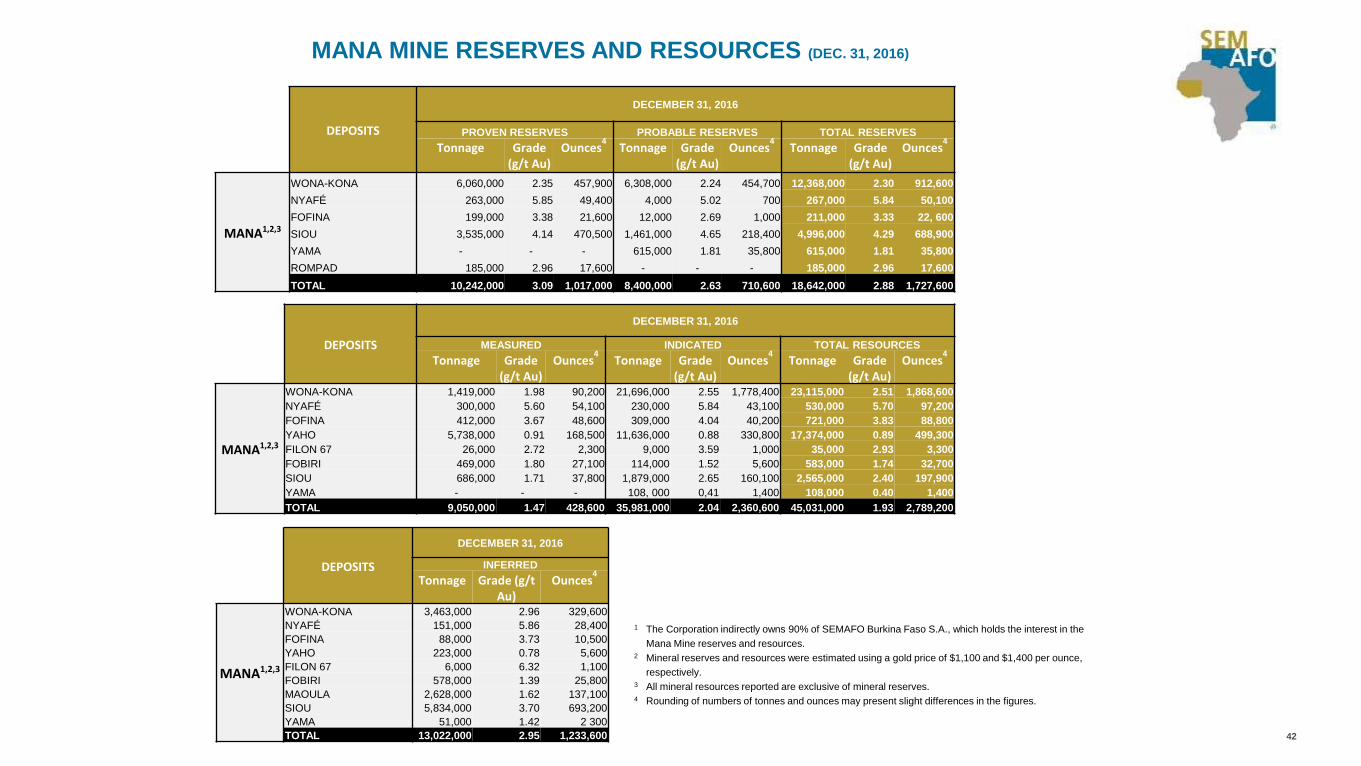
MANA MINE RESERVES AND RESOURCES (DEC. 31, 2016)
DEPOSITS
DECEMBER 31, 2016
PROVEN RESERVES PROBABLE RESERVES TOTAL RESERVES
Tonnage Grade (g/t Au)
Ounces4
Tonnage Grade (g/t Au)
Ounces4
Tonnage Grade (g/t Au)
Ounces4
MANA1,2,3
WONA-KONA 6,060,000 2.35 457,900 6,308,000 2.24 454,700 12,368,000 2.30 912,600
NYAFÉ 263,000 5.85 49,400 4,000 5.02 700 267,000 5.84 50,100
FOFINA 199,000 3.38 21,600 12,000 2.69 1,000 211,000 3.33 22, 600
SIOU 3,535,000 4.14 470,500 1,461,000 4.65 218,400 4,996,000 4.29 688,900
YAMA - - - 615,000 1.81 35,800 615,000 1.81 35,800
ROMPAD 185,000 2.96 17,600 - - - 185,000 2.96 17,600
TOTAL 10,242,000 3.09 1,017,000 8,400,000 2.63 710,600 18,642,000 2.88 1,727,600
DEPOSITS
DECEMBER 31, 2016
MEASURED INDICATED TOTAL RESOURCES
Tonnage Grade (g/t Au)
Ounces4
Tonnage Grade (g/t Au)
Ounces4
Tonnage Grade (g/t Au)
Ounces4
MANA1,2,3
WONA-KONA 1,419,000 1.98 90,200 21,696,000 2.55 1,778,400 23,115,000 2.51 1,868,600
NYAFÉ 300,000 5.60 54,100 230,000 5.84 43,100 530,000 5.70 97,200
FOFINA 412,000 3.67 48,600 309,000 4.04 40,200 721,000 3.83 88,800
YAHO 5,738,000 0.91 168,500 11,636,000 0.88 330,800 17,374,000 0.89 499,300
FILON 67 26,000 2.72 2,300 9,000 3.59 1,000 35,000 2.93 3,300
FOBIRI 469,000 1.80 27,100 114,000 1.52 5,600 583,000 1.74 32,700
SIOU 686,000 1.71 37,800 1,879,000 2.65 160,100 2,565,000 2.40 197,900
YAMA - - - 108, 000 0,41 1,400 108,000 0.40 1,400
TOTAL 9,050,000 1.47 428,600 35,981,000 2.04 2,360,600 45,031,000 1.93 2,789,200
DEPOSITS
DECEMBER 31, 2016
INFERRED
Tonnage Grade (g/t Au)
Ounces4
MANA1,2,3
WONA-KONA 3,463,000 2.96 329,600
NYAFÉ 151,000 5.86 28,400
FOFINA 88,000 3.73 10,500
YAHO 223,000 0.78 5,600
FILON 67 6,000 6.32 1,100
FOBIRI 578,000 1.39 25,800
MAOULA 2,628,000 1.62 137,100
SIOU 5,834,000 3.70 693,200
YAMA 51,000 1.42 2 300
TOTAL 13,022,000 2.95 1,233,600
1 The Corporation indirectly owns 90% of SEMAFO Burkina Faso S.A., which holds the interest in the
Mana Mine reserves and resources.2 Mineral reserves and resources were estimated using a gold price of $1,100 and $1,400 per ounce,
respectively.3 All mineral resources reported are exclusive of mineral reserves.4 Rounding of numbers of tonnes and ounces may present slight differences in the figures.

| NOTES|

SEMAFO Inc.
100 Alexis-Nihon blvd.
7thfloor, St-Laurent (Quebec)
Canada H4M 2P3
www.semafo.com