npp sensor data overview - star...npp sensor data overview dr. fuzhong weng jpss sensor science...
TRANSCRIPT

NPP Sensor Data Overview
Dr. Fuzhong Weng
JPSS Sensor Science Chair
Center for Satellite Applications and Research (STAR)
NOAA/NESDIS
IGARSS 2011, NPP User’s Workshop
July 24, 2011

PRESIDENTIAL DECISION
• VIIRS (MODIS heritage)
• CrIS (AIRS/IASI heritage)
• OMPS (OMI/TOMS heritage)
• ATMS (AMSU/MHS heritage)
NPOESS program was terminated on 30 September 2010.
• NOAA assigned 1330 orbit
– Joint Polar Satellite System (JPSS)
• DoD assigned 0530 orbit
– Defense Weather Satellite System (DWSS)
• EUMETSAT provides 0930 orbit
–Meteorological Operational Satellite System
• Common Ground System (CGS)
– Systems developed for JPSS/DWSS/GCOM etc
• Advanced Sensors on JPSS

NPP Spacecraft and Payloads
VIIRS
CrIS
OMPS
CERES
ATMS
JPSS Program Concept Review
41_11_Gleason_Environmental_Sensing.pptx
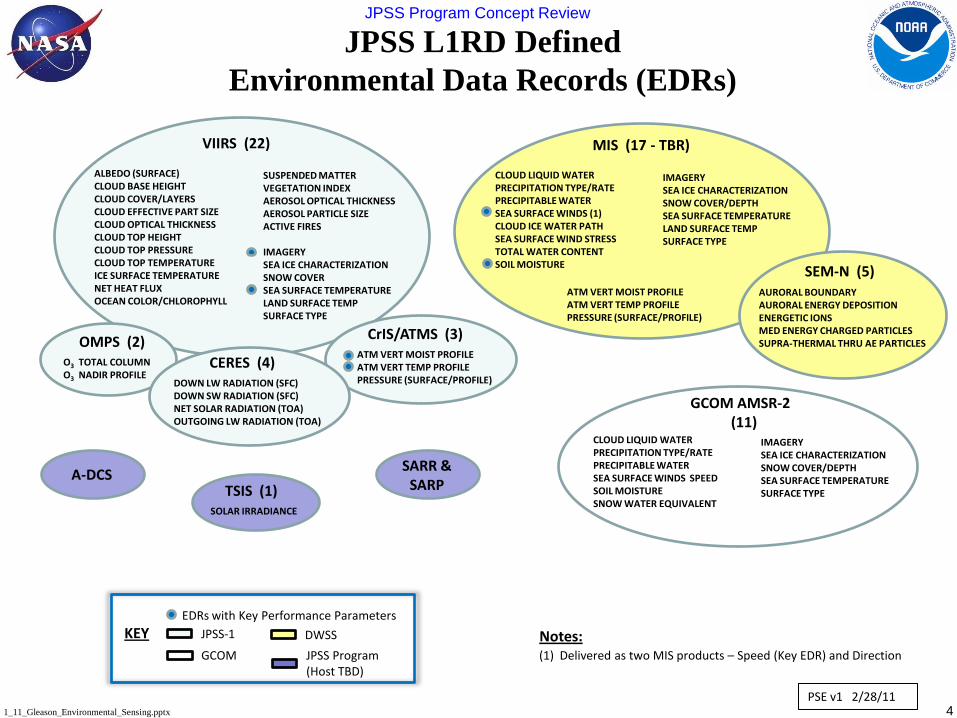
JPSS L1RD Defined
Environmental Data Records (EDRs)
CLOUD LIQUID WATERPRECIPITATION TYPE/RATEPRECIPITABLE WATERSEA SURFACE WINDS SPEEDSOIL MOISTURESNOW WATER EQUIVALENT
IMAGERYSEA ICE CHARACTERIZATIONSNOW COVER/DEPTHSEA SURFACE TEMPERATURESURFACE TYPE
GCOM AMSR-2(11)
VIIRS (22)
ALBEDO (SURFACE)CLOUD BASE HEIGHTCLOUD COVER/LAYERSCLOUD EFFECTIVE PART SIZECLOUD OPTICAL THICKNESSCLOUD TOP HEIGHTCLOUD TOP PRESSURECLOUD TOP TEMPERATUREICE SURFACE TEMPERATURENET HEAT FLUX OCEAN COLOR/CHLOROPHYLL
SUSPENDED MATTERVEGETATION INDEXAEROSOL OPTICAL THICKNESSAEROSOL PARTICLE SIZEACTIVE FIRES
IMAGERYSEA ICE CHARACTERIZATIONSNOW COVERSEA SURFACE TEMPERATURELAND SURFACE TEMPSURFACE TYPE
CrIS/ATMS (3)ATM VERT MOIST PROFILEATM VERT TEMP PROFILEPRESSURE (SURFACE/PROFILE)
OMPS (2)O3 TOTAL COLUMNO3 NADIR PROFILE
CERES (4)DOWN LW RADIATION (SFC)DOWN SW RADIATION (SFC)NET SOLAR RADIATION (TOA)OUTGOING LW RADIATION (TOA)
MIS (17 - TBR)
CLOUD LIQUID WATERPRECIPITATION TYPE/RATEPRECIPITABLE WATERSEA SURFACE WINDS (1)CLOUD ICE WATER PATHSEA SURFACE WIND STRESSTOTAL WATER CONTENTSOIL MOISTURE
IMAGERYSEA ICE CHARACTERIZATIONSNOW COVER/DEPTHSEA SURFACE TEMPERATURELAND SURFACE TEMPSURFACE TYPE
ATM VERT MOIST PROFILEATM VERT TEMP PROFILEPRESSURE (SURFACE/PROFILE)
SEM-N (5)AURORAL BOUNDARYAURORAL ENERGY DEPOSITIONENERGETIC IONSMED ENERGY CHARGED PARTICLESSUPRA-THERMAL THRU AE PARTICLES
TSIS (1)SOLAR IRRADIANCE
SARR &SARP
A-DCS
(1) Delivered as two MIS products – Speed (Key EDR) and Direction
Notes:
PSE v1 2/28/11
KEYEDRs with Key Performance Parameters
JPSS-1
GCOM
DWSS
JPSS Program(Host TBD)

Sensor Science Working Group
5
Management LeadsATMS – Tsan Mo, STAR
CrIS – Yong Han, STAR
OMPS – Fred Wu, STAR
VIIRS – Changyong Cao,STAR
CERES – Mark Liu, STAR (acting)
SEM-N – Changyong Cao, STAR (acting)
Technical LeadsATMS – Ed Kim, NASA/GSFC
CrIS – Yong Han, NESDIS/STAR
OMPS – Glen Jaross, NASA/SSAI
VIIRS – Frank DeLuccia, Aerospace
CERES – Kory Priestley, NASA/LaRC
SEM-N – Bill Denig, NESDIS/NGDC
SSWG Chair Fuzhong Weng, NESDIS/STAR
Advising/Coordination
Bruce Guenther
Neal Baker
Mike Denning

Recent JPSS SSWG Activities
• SDR teams were inaugurated in December, 2010 after the approval of
JPSS program and JPSS ground project senior management with
recommended team leads
• Conduct Weekly Telecons with JPSS program stakeholders (mainly
SDR):
NOAA
NASA
Raytheon
ITT
BALL
NGAS, NGES etc,
• Major Activities
Participate NPP launch readiness rehearsal
Review IDPS SDR code readiness for NPP launch
Provide independent assessments of NGAS deliverables (e.g. LUTs/coeff.)
Analyze NPP S/C TVAC data
Perform post-launch instrument cal/val
Established STAR ICVS for NPP LTM with initial trending of TVAC data

• SDRs
– VIIRS – Yes
– CrIS – Yes
– ATMS – Yes
– ATMS Remap - Yes
– OMPS TC – No (Mx6 – Science DRs opened by Cal/Val Team)
– OMPS NP – Yes
• KPPs
– Imagery - Yes
– SST – Yes
– CrIMSS – Yes
• Canary
– Cloud Mask - Yes
– Aerosols – Yes
– OCC – No (PCRs in work for Mx6)
– CTT IP – Yes
– Veg Index – Yes
NPP IDPS SDR Processing Readiness
(Mx5 Version)

Cross-track Infrared Sounder (CrIS)
Wavelength Range Sampling Band (cm-1) (mm) (cm-1)
No. Chan.
SWIR 2155-2550 4.64-3.92 2.5 159 MWIR 1210-1750 8.26-5.71 1.25 433 LWIR 650-1095 15.38-9.14 0.625 713
The Cross-track Infrared Sounder (CrIS) is a key sensor
Fourier Transform Spectrometer providing
high resolution IR spectra
Fields of Regard each 3x3 FOVs
Photovoltaic Detectors in all 3 bands
4-Stage Passive Detector Cooler
14 km nadir spatial resolution
2200 km swath width
On-board internal calibration targetSpec
Mass, kg 165
Average Power, W 135
Average Data Rate, Mbps 1.5

Infrared Earth Spectra

Advanced Technology Microwave Sounder (ATMS)
• Purpose:
Profiling atmosphere under All-weather
conditions. In conjunction with CrIS,
global observations of temperature and
moisture profiles at high temporal
resolution (~ daily)
• Predecessor Instruments:
AMSU A1/A2, MHS
• Approach:
Scanning passive microwave radiometer
22 channels (23GHz - 183GHz)
• Swath width: 2300 km • Co-registration: with CrIS

Spectral Differences: ATMS vs. AMSU/MHS
Ch GHz Pol Ch GHz Pol
1 23.8 QV 1 23.8 QV
2 31.399 QV 2 31.4 QV
3 50.299 QV 3 50.3 QH
4 51.76 QH
4 52.8 QV 5 52.8 QH
5 53.595 ± 0.115 QH 6 53.596 ± 0.115 QH
6 54.4 QH 7 54.4 QH
7 54.94 QV 8 54.94 QH
8 55.5 QH 9 55.5 QH
9 fo = 57.29 QH 10 fo = 57.29 QH
10 fo ± 0.217 QH 11 fo±0.3222±0.217 QH
11 fo±0.3222±0.048 QH 12 fo±0.3222±0.048
QH
12 fo
±0.3222±0.022
QH 13 fo±0.3222±0.022 QH
13 fo±0.3222±0.010
QH 14 fo±0.3222
±0.010
QH
14 fo±0.3222±0.004
5
QH 15 fo±0.3222±0.0045
QH
15 89.0 QV
16 89.0 QV 16 88.2 QV
17 157.0 QV 17 165.5 QH
18 183.31 ± 1 QH 18 183.31 ± 7 QH
19 183.31 ± 3 QH 19 183.31 ± 4.5 QH
20 191.31 QV 20 183.31 ± 3 QH
21 183.31 ± 1.8 QH
Only Polarization different
Unique Passband
Unique Passband, and Pol. different
from closest AMSU/MHS channels
MH
SA
MSU
-A
AMSU/MHS ATMS
Exact match to AMSU/MHS
AMSU/MHS have 20, with polarization differences between some channels
− Quasi-Vertical: polarization vector is parallel to the scan plane at nadir
− Quasi-Horizontal: polarization vector is perpendicular to the scan plane at nadir
ATMS has 22 channels.

Microwave Earth Spectra
100
102
103
Pre
ssu
re (
hP
a)
101
Temperature Weighting Function (km-1)
Atm
osp
her
ic O
pac
ity

ATMS Scanning Characteristics
Subsatellite track
(824 Km orbit, NPP)
105.45°
• Cross-track (for CrIS coincidence)
• Contiguous 1.1° cells
• Contiguous coverage at equator
Channel Dx(km) Beam Width
1-2 74.8 5.2o
3-16 31.6 2.2o
17-22 15.8 1.1o
FOV near Nadir
Channel Dx (km) Dy (km)
1-2 323.1 141.8
3-16 136.7 60.0
17-22 68.4 30.0
The outmost FOV

Spatial Differences: ATMS vs. AMSU/MHS
Beamwidth (degrees)
ATMS AMSU/MHS
23/31 GHz 5.2 3.3
50-60 GHz 2.2 3.3
89-GHz 2.2 1.1
160-183 GHz 1.1 1.1
Spatial sampling
ATMS AMSU/MHS
23/31 GHz 1.11 3.33
50-60 GHz 1.11 3.33
89-GHz 1.11 1.11
160-183 GHz 1.11 1.11
Swath (km) ~2600 ~2200
ATMS scan period: 8/3 sec; AMSU-A scan period: 8 sec

Co-Registration of ATMS/CrIS Sensors
±50° cross track scans
3x3 Array of CrIS FOVs
(Each at 14-km Diameter)
CrIS Swath 2200km
Central or regional
ground stations
ATMS swath 2500kmATMS FOV

Visible Infrared Imaging Radiometer Suite
Raytheon SAS El Segundo, California
• Purpose:
Global observations of land, ocean,
and atmosphere parameters at high
temporal resolution (~ daily)
• Predecessor Instruments:
AVHRR, OLS, MODIS, SeaWiFS
• Approach:
Multi-spectral scanning radiometer
(22 bands between 0.4µm and 12µm)
12-bit quantization
• Swath width:
3000 kmSpatial Resolution
• 16 bands at 750m
• 5 bands at 325m
• DNB

VIIRS Spectral, Spatial, & Radiometric Attributes
Nadir End of Scan Required Predicted Margin
M1 0.412 0.742 x 0.259 1.60 x 1.58 Ocean Color Low 44.9 352 441 25%
Aerosols High 155 316 807 155%
M2 0.445 0.742 x 0.259 1.60 x 1.58 Ocean Color Low 40 380 524 38%
Aerosols High 146 409 926 126%
M3 0.488 0.742 x 0.259 1.60 x 1.58 Ocean Color Low 32 416 542 30%
Aerosols High 123 414 730 76%
M4 0.555 0.742 x 0.259 1.60 x 1.58 Ocean Color Low 21 362 455 26%
Aerosols High 90 315 638 102%
I1 0.640 0.371 x 0.387 0.80 x 0.789 Imagery Single 22 119 146 23%
M5 0.672 0.742 x 0.259 1.60 x 1.58 Ocean Color Low 10 242 298 23%
Aerosols High 68 360 522 45%
M6 0.746 0.742 x 0.776 1.60 x 1.58 Atmospheric Corr'n Single 9.6 199 239 20%
I2 0.865 0.371 x 0.387 0.80 x 0.789 NDVI Single 25 150 225 50%
M7 0.865 0.742 x 0.259 1.60 x 1.58 Ocean Color Low 6.4 215 388 81%
Aerosols High 33.4 340 494 45%
DNB 0.7 0.742 x 0.742 0.742 x 0.742 Imagery Var. 6.70E-05 6 5.7 -5%
M8 1.24 0.742 x 0.776 1.60 x 1.58 Cloud Particle Size Single 5.4 74 98 32%
M9 1.378 0.742 x 0.776 1.60 x 1.58 Cirrus/Cloud Cover Single 6 83 155 88%
I3 1.61 0.371 x 0.387 0.80 x 0.789 Binary Snow Map Single 7.3 6.0 97 1523%
M10 1.61 0.742 x 0.776 1.60 x 1.58 Snow Fraction Single 7.3 342 439 28%
M11 2.25 0.742 x 0.776 1.60 x 1.58 Clouds Single 0.12 10 17 66%
I4 3.74 0.371 x 0.387 0.80 x 0.789 Imagery Clouds Single 270 K 2.500 0.486 415%
M12 3.70 0.742 x 0.776 1.60 x 1.58 SST Single 270 K 0.396 0.218 82%
M13 4.05 0.742 x 0.259 1.60 x 1.58 SST Low 300 K 0.107 0.063 69%
Fires High 380 K 0.423 0.334 27%
M14 8.55 0.742 x 0.776 1.60 x 1.58 Cloud Top Properties Single 270 K 0.091 0.075 22%
M15 10.763 0.742 x 0.776 1.60 x 1.58 SST Single 300 K 0.070 0.038 85%
I5 11.450 0.371 x 0.387 0.80 x 0.789 Cloud Imagery Single 210 K 1.500 0.789 90%
M16 12.013 0.742 x 0.776 1.60 x 1.58 SST Single 300 K 0.072 0.051 42%
Driving EDRs
Radi-
ance
Range
Ltyp or
Ttyp
Signal to Noise Ratio
(dimensionless)
or NET (Kelvins)
CCD
Horiz Sample Interval
(km Downtrack x Crosstrack)Band
No.
Wave-
length
(m)
VIS
/NIR
FP
A
Sili
co
n P
IN D
iod
es
S/M
WIR
PV
Hg
Cd
Te
(H
CT
)P
V H
CT
LW
IR

Ozone Mapping Profiler Suite
Ball Aerospace and Technologies Corp.
• Purpose:
Monitors the total column and
vertical profile of ozone
• Predecessor Instruments:
TOMS, SBUV, GOME, OSIRIS,
SCIAMACHY
• Approach:
Nadir and limb push broom CCD
spectrometers
• Swath width:
2600 km

Ultraviolet Solar and Earth Spectrum
OMPS Nadir MapperOMPS Nadir Profiler

Ozone Hole on September 24, 2006
Largest Ozone Hole
30 million km2
Area of North America
25 million km2

CERES Instrument Overview
CERES scanning radiometer
measuring three spectral bands
at TOA
– Total (0.3 to >50 micron)
– Shortwave (0.3 to 5.0 micron)
– Longwave (5 to 50 micron)
22 in.
21 in.
CERES Value Allocation Margin
Mass, kg 46.8 54 13.3%
Power: Operational, Watts 45.85 50 8.3%
Power: Peak, Watts 60 75 20.0%
Power: Survival, Watts 39.5 40 1.3%
Heat Transfer - Hot Case, Watts 4.1 ±5 W 18.0%
Heat Transfer - Cold Case, Watts -1.7 ±5 W 66.0%
Data Rate, Kb / sec 10 10 0
Pointing Control, arcsec < 114 194 41.2%
Pointing Knowledge, arcsec < 107 180 40.6%
Critical Resource Margins
– TRMM
– EOS Terra
– EOS Aqua
Operations, data processing, products,
and science are a continuation of
experience is developed on

Primary CERES Climate Data Records
Reflected
Solar
Energy
Emitted
Thermal
Energy

Pre-Launch RDR Development
and Verification
SDR Development
and Verification
EDR Development
and Verification
Early Orbit
Check-out
RDR On-Orbit
Verification
SDR Verification,
Tuning, and Initial
Validation
EDR Verification
and Initial
Validation
Intensive
CalVal
Establish Sensor
Stability
SDR Validation EDR Validation
Long-term
Monitoring
Sensor Long-Term
Monitoring
SDR Detailed
Validation and
Maintenance
EDR Detailed
Validation and
Correction &
Improvement
NPP Phases of Cal/Val:
Activities Through the Life of the Program
Time
Product Chain

29
Example: VIIRS Cal/Val Activities by Phase
L + 50 days
Early Orbit Checkout
(EOC) Phase
Intensive Calibration
& Validation (ICV) Phase
Pre-Launch
Phase
La
un
ch
Long Term Monitoring
(LTM) Phase
L + 180 days
Sensor
Characterization
Performance &
Telemetry Trending
Baseline
SDR Cal/Val
Plan Development
SDR Algorithm
Initialization &
Update Capability
Cal/Val Tool
Development
Functional
Checkout
Data
Inventory
RDR/SDR
Verification
Radiance
Match-Ups
Geolocation
Performance &
Telemetry
Trending
SDR Algorithm
Tuning
SDR
Parameter
& LUT Updates
Radiance
Match-Ups
Geolocation
Performance &
Telemetry
Trending
SDR
Parameter
& LUT Updates
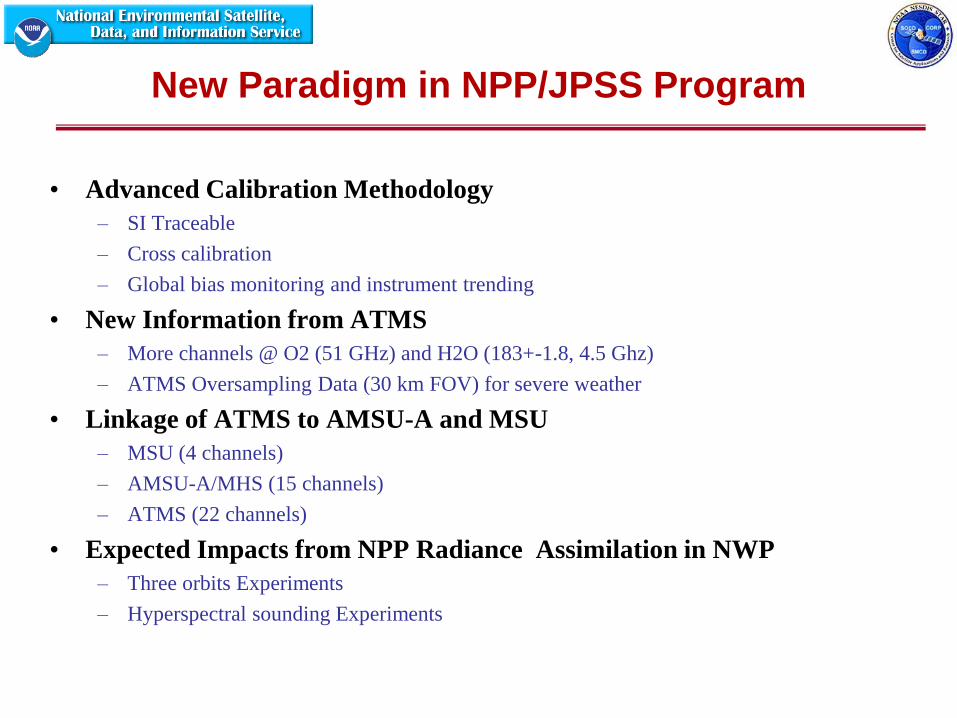
New Paradigm in NPP/JPSS Program
• Advanced Calibration Methodology
– SI Traceable
– Cross calibration
– Global bias monitoring and instrument trending
• New Information from ATMS
– More channels @ O2 (51 GHz) and H2O (183+-1.8, 4.5 Ghz)
– ATMS Oversampling Data (30 km FOV) for severe weather
• Linkage of ATMS to AMSU-A and MSU
– MSU (4 channels)
– AMSU-A/MHS (15 channels)
– ATMS (22 channels)
• Expected Impacts from NPP Radiance Assimilation in NWP
– Three orbits Experiments
– Hyperspectral sounding Experiments

Unique Characteristics GPS RO Data
(1)SI-traceable
(2)Data error not affected by cloud
and precipitation
(3)High vertical resolution
(4)High consistency, data quality
not affected by GPS receiver types
does not decay with time
no mission-dependent systematic bias
(Hajj et al., 2004; Ho et al., 2009)
(5) Accurate temperature and pressure profiling within upper
troposphere and stratosphere(Hajj et al. , 2004) - 0.1K

Global and Monthly Mean Biases &
Standard Deviations
Bia
s (K
)
Std
(K
)
Channel Number
Channel Number

Latitudinal-Dependence of Biases & Std.
Bias
Std.
Latitude
Latitude
(K)
(K)
Ch10
Ch9
Ch8
Ch7
Ch6
Ch5
Ch10
Ch9
Ch8
Ch7
Ch6
Ch5

42

ATMS NEDT Analysis

44
Microwave Temperature Sounding Vertical
Resolution
MSU+SSU (1978-2007)

45
AMSU Hurricane Intensity Estimation
NOAA-15 AMSU-A T(C) 2332 UTC 11 Sep 99
GOES-8 IR 2315 UTC 11 Sep 99
Hurricane Floyd
• AMSU (blue) / GOES (dashed red)
relative viewing geometry

46
MSU/AMSU Derived Level 2 Atmospheric
Temperature Trend in Past 30 years
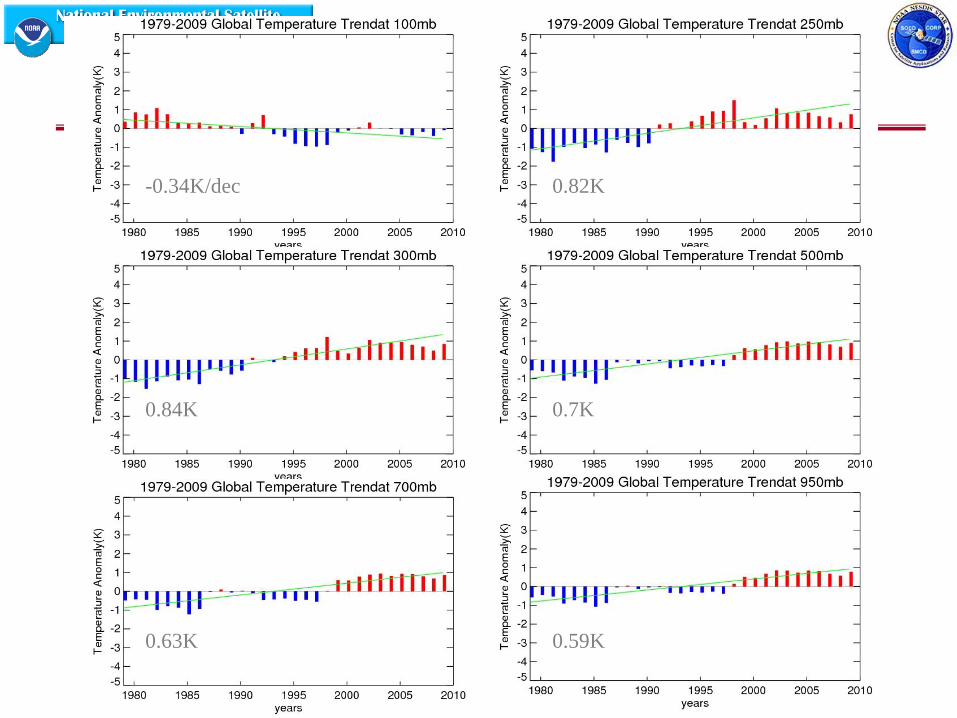
-0.34K/dec 0.82K
0.84K 0.7K
0.63K 0.59K


49
Consistent Mid-Tropospheric Trend by
Combining MSU and AMSU-A
MSU2/AMSU5—mid-tropospheric temperature
Multiple MSUs and AMSUs are cross-calibrated using Simultaneous Overpassing
From Cheng-Zhi Zou, 2010 NOAA CDR Workshop

• BUFR proxy data, from NESDIS,
archived at ECMWF since Feb 2011
• CRTM Fast RT model coefficients
available based on
rectangular band shapes
• Code to handle CrIS / ATMS lodged in
JCSDA vapor
• Preliminary results generated
from simulated data, as technical
check-out of code
• Aim to provide feedback on data quality within
days during :
• early orbit check-out
• subsequent commissioning phase
IF data is available in BUFR format &
data streams in place
Preparations for CrIS/ATMS

51

Three Orbital Planes are Needed to Cover the
Globe Within NWP Analysis Cycle

Impact of Satellite Data in Forecast Skill
• 2007 ECMWF forecasting
system,
• winter & summer seasons,
• Three experiments:
1) no satellite data (NoSAT),
2) NoSAT + 1 AMSU-A
3) Control using all data
500 hPa geopotential heightanomaly correlation
Slide courtesy of Erik Andersson, ECMWF

IASI Impacts on Global Medium-Range
ForecastsN. Hemisphere 1000 hPa AC Z
20N - 80N Waves 1-20
16 Dec 2007 - 15 Jan 2008
0.6
0.65
0.7
0.75
0.8
0.85
0.9
0.95
1
0 1 2 3 4 5 6 7
Forecast [day]
An
om
aly
Co
rre
lati
on
Control IASI
N. Hemisphere 500 hPa AC Z
20N - 80N Waves 1-20
16 Dec 2007 - 15 Jan 2008
0.6
0.65
0.7
0.75
0.8
0.85
0.9
0.95
1
0 1 2 3 4 5 6 7
Forecast [day]
An
om
aly
Co
rrela
tio
n
Control IASI
S. Hemisphere 1000 hPa AC Z
20S - 80S Waves 1-20
16 Dec 2007- 15 Jan 2008
0.6
0.65
0.7
0.75
0.8
0.85
0.9
0.95
1
0 1 2 3 4 5 6 7
Forecast [day]
An
om
aly
Co
rrela
tio
n
Control IASI
S. Hemisphere 500 hPa AC Z
20S - 80S Waves 1-20
16 Dec 2007 - 15 Jan 2008
0.6
0.65
0.7
0.75
0.8
0.85
0.9
0.95
1
0 1 2 3 4 5 6 7
Forecast [day]
An
om
aly
Co
rrela
tio
n
Control IASI

Conclusions
• NOAA is taking the lead for NPP/JPSS instrument CalVal
• JPSS program will provide well-calibrated radiances and well
validated products
1) Weather Forecast Models through
CrIS, ATMS, VIIRS, OMPS
2) Short term Environmental Observations (Events)
VIIRS, OMPS, CrIS
3) Long term Environmental Observations (Climate Change Detection)
CERES, TSIS, VIIRS, OMPS, CrIS, ATMS
• NPP sensor proxy data (e.g. golden days, NWP BUFR)
are made available for user preparation