npr, robert wood johnson foundation, harvard school of ... · pdf file2 what shapes health npr...
TRANSCRIPT
2
WHAT SHAPES HEALTH
NPR
Robert Wood Johnson Foundation
Harvard T.H. Chan School of Public Health
March 2015

2
What Shapes Health
I. How Concerned are Americans with Their Health?
As a nation, Americans are concerned about their health. About six in ten Americans (62%)
say they are very concerned (31%) or somewhat concerned (31%) about their health in the
future.1 About one-third (36%) are not too (24%) or not at all concerned (12%). Regardless of
their background, a majority of Americans are concerned about their health.
The groups most likely to say they
are very concerned about their
future health are those who
describe their own health as fair or
poor (52% very concerned),
African Americans (47%),
Hispanics (44%), people age 50-64
(40%), and those with household
incomes of less than $25,000 a
year (39%).
About four in ten Americans
(42%) believe that they are in
better health than their parents
were at their age. About an equal
proportion (45%) believes their
own health is about the same as
their parents’ health was. About one in ten (9%) think they are in worse health than their parents
were at the same age. Americans age 50 or older are the most likely to say they are in better
health than their parents were (50%).
Throughout the survey, respondents were requested to think about “health” in a broad sense,
meaning “both freedom from disease, mental illness, and disability, as well as having a sense of
physical and mental well-being.”
1 Half of the survey respondents were asked about their “health.” The other half were asked about their “health and
physical and mental well-being.” The results from the two versions were nearly identical and were combined for this
discussion of Americans’ concern about their future health.
NPR/Robert Wood Johnson Foundation/Harvard T.H. Chan School of Public Health, What Shapes Health, September 15 – October 15, 2014.
Americans’ Concern About Their Future Health
% saying very concerned
39%
40%
44%
47%
52%
31%Total
Groups most likely to say they are very concerned are…
Those describing
health as fair/poor
African Americans
Hispanics
People age 50-64
Those with income
< $25K a year

3
II. What Do Americans Believe Causes Health Problems?
Americans do not see a single most important cause of individuals’ health problems. When
given a list of 14 things that might cause ill health, the top five causes seen by the public as
extremely important are lack of access to high-quality medical care (42%), personal behavior
(40%), viruses or bacteria
(40%), high stress (37%), and
being exposed to air, water, or
chemical pollution (35%).
About six in ten (62%) believe
that the behavior of their family
and friends is extremely (29%)
or very important (33%) in
influencing their own long-term
health.
When asked specifically about
things that happen to a person
in childhood that can cause
health problems later in life
when they are adults, a majority
(54%) said they thought being abused or neglected in childhood was extremely important. In
addition, more than four in ten listed the following childhood experiences as extremely important
causes of a person’s health problems later in life: living in a polluted area (44%), eating a poor
diet (44%), and not getting vaccinations (43%).
NPR/Robert Wood Johnson Foundation/Harvard T.H. Chan School of Public Health, What Shapes Health, September 15 – October 15, 2014.
Americans’ Perceptions of the Top Causes of
Individuals’ Health Problems
% saying extremely important
35%
37%
40%
40%
42%
Viruses or bacteria
Personal behavior
High stress
Being exposed to air, water, or chemical pollution
Lack of access to high-quality medical care

4
III. Do Americans Differ in Their Views about the Causes of Ill Health by Race/Ethnicity
and Income?
When it comes to the causes of health problems, African Americans, Hispanics, and low-
income Americans have somewhat different perceptions than others. African Americans are
more likely than whites to perceive lack of access to high-quality medical care (56% to 41%),
God’s will (47% to 29%), having a low income (45% to 23%), and not having enough education
(41% to 26%) as extremely important causes of individuals’ health problems. Hispanics are more
likely than non-Hispanic whites (46% to 31%) to say that bad working conditions are extremely
important.
Low-income Americans (those with household incomes less than $25,000 a year) are more likely
than high-income Americans ($75,000 a year or more) to believe poor neighborhood and housing
conditions (40% to 27%) and bad working conditions (40% to 26%) are extremely important.
A similar pattern appears when considering childhood experiences that can cause future health
problems for individuals. African Americans are more likely than whites to believe eating a poor
diet in childhood (55% to 42%), not getting vaccinations as a child (54% to 43%), living in
poverty in childhood (47% to 31%), not graduating from high school (46% to 26%), and being
born premature or underweight (34% to 20%) are extremely important.
Low-income Americans are more likely than high-income Americans to believe that the
following childhood experiences are extremely important causes of future health problems: being
abused or neglected in childhood (61% to 51%), living in a polluted environment in childhood
(49% to 37%), eating a poor diet in childhood (50% to 36%), living in poverty in childhood
(39% to 30%), and being born premature or underweight (30% to 18%).
NPR/Robert Wood Johnson Foundation/Harvard T.H. Chan School of Public Health, What Shapes Health, September 15 – October 15, 2014.
Total <$25K/yr $75K+/yrLack of access to high-quality medical care 42 48 40
Personal behavior 40 41 43
Viruses or bacteria 40 42 38
High stress 37 43 37
Being exposed to air, water, or chemical pollution 35 35 32
Lack of friends and family members the person can
talk to and rely on34 39 33
Poor neighborhood and housing conditions 33 40* 27
Being abused as an adult 33 32 29
Bad working conditions 33 40* 26
Not having enough education 31 31 28
God’s will 29 37 25
Having a low income 27 32 22
Bad genes 19 22 18
Bad luck 9 11 5
*=significantly higher proportion than for $75K+/yr (p<.05)
Americans’ Perceptions of the Top Causes of
Individuals’ Health Problems by Household Income

5
IV. Do People Believe They Can Control Their Own Health?
Half of Americans believe they have a great deal of control over their health. Previous
studies have shown that individuals’ beliefs about the control they have over their health may be
related to their future health outcomes.2
Half of Americans (50%) believe
they have a great deal of control
over their own health. About
three in ten (28%) believe they
have quite a bit of control, while
about two in ten (22%) believe
they do not have much control
over their health (some, very
little, or none at all).
Those who do not feel a sense of
control differ significantly by
socioeconomic and other
measures. Americans who are
better off financially, more
highly educated, and in good
health are more likely to believe
that they have control over their health. Those with less advantaged backgrounds are less likely
to be optimistic. Those with household incomes of less than $50,000 a year are more than twice
as likely as those with incomes of $50,000 or more (28% to 13%) to believe they do not have
much control over their health. Similarly, those with a high school diploma or less are more
likely than college graduates (27% to 15%) to feel a lack of control. Hispanics (31%) are more
likely than non-Hispanic whites (19%) and African Americans (17%) to think they do not have
much control. In addition, half (50%) of Americans who describe their own health as fair or poor
believe they do not have much control over their own health.
Those who think they have control over their health are more likely than those who do not think
they do to report that they put a great deal or quite a bit of effort into improving their own health
(71% to 52%).
2 Henninger DE, Whitson HE, Chen HJ, Ariel D, “Higher Medical Morbidity Burden is Associated with External
Locus of Control,” Journal of the American Geriatrics Society 2012(4);60:751-755; Infurna FJ, Ram N, Gerstorf D,
“Level and Change in Perceived Control Predicts 19-Year Mortality: Findings from the Americans’ Changing Lives
Study,” Developmental Psychology 2013;49(10):1833-1847; Gale CR, Batty D, Deary IJ, “Locus of Control at Age
10 Years and Health Outcomes and Behaviors at Age 30 Years: The 1970 British Cohort Study,” Psychosomatic
Medicine 2008;70(4):397-403.
NPR/Robert Wood Johnson Foundation/Harvard T.H. Chan School of Public Health, What Shapes Health, September 15 – October 15, 2014.
Americans’ Sense of Control Over Their Own Health
% saying…
22%
28%
50%A Great Deal
Quite a Bit
Some/
Very Little/
None at All
6
V. Do Americans Perceive Childhood Experiences as Having a Harmful Effect on Their
Health as Adults?
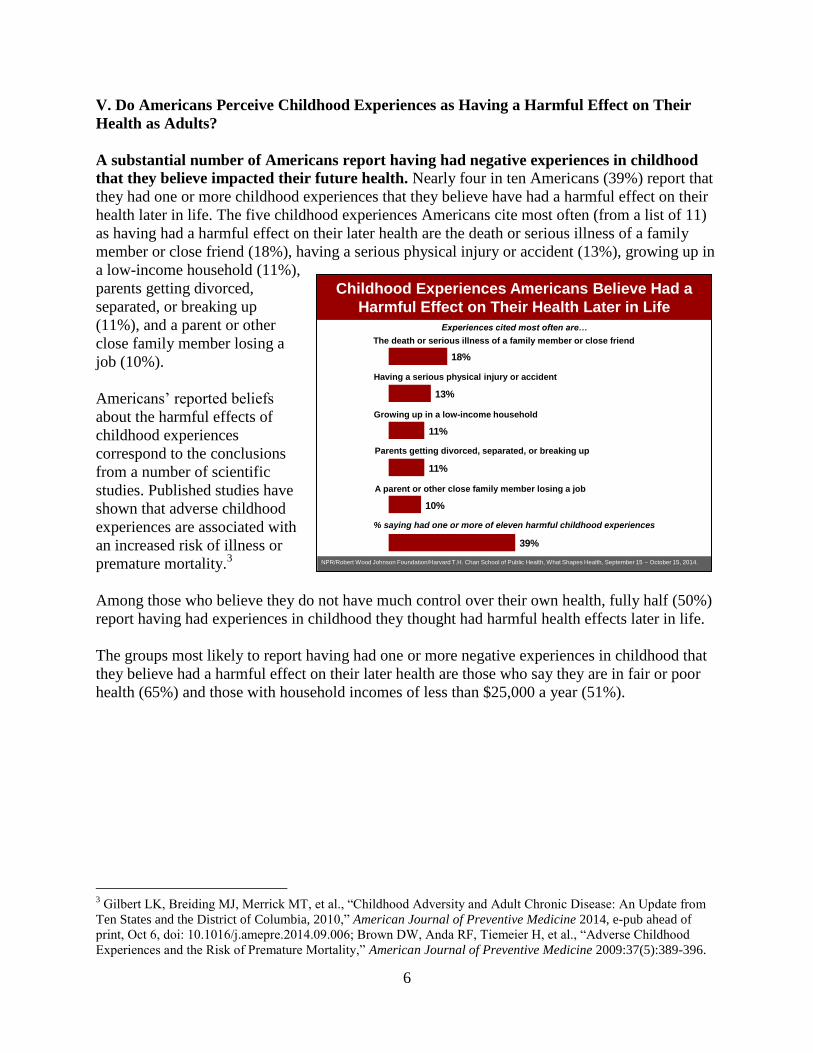
A substantial number of Americans report having had negative experiences in childhood
that they believe impacted their future health. Nearly four in ten Americans (39%) report that
they had one or more childhood experiences that they believe have had a harmful effect on their
health later in life. The five childhood experiences Americans cite most often (from a list of 11)
as having had a harmful effect on their later health are the death or serious illness of a family
member or close friend (18%), having a serious physical injury or accident (13%), growing up in
a low-income household (11%),
parents getting divorced,
separated, or breaking up
(11%), and a parent or other
close family member losing a
job (10%).
Americans’ reported beliefs
about the harmful effects of
childhood experiences
correspond to the conclusions
from a number of scientific
studies. Published studies have
shown that adverse childhood
experiences are associated with
an increased risk of illness or
premature mortality.3
Among those who believe they do not have much control over their own health, fully half (50%)
report having had experiences in childhood they thought had harmful health effects later in life.
The groups most likely to report having had one or more negative experiences in childhood that
they believe had a harmful effect on their later health are those who say they are in fair or poor
health (65%) and those with household incomes of less than $25,000 a year (51%).
3 Gilbert LK, Breiding MJ, Merrick MT, et al., “Childhood Adversity and Adult Chronic Disease: An Update from
Ten States and the District of Columbia, 2010,” American Journal of Preventive Medicine 2014, e-pub ahead of
print, Oct 6, doi: 10.1016/j.amepre.2014.09.006; Brown DW, Anda RF, Tiemeier H, et al., “Adverse Childhood
Experiences and the Risk of Premature Mortality,” American Journal of Preventive Medicine 2009:37(5):389-396.
NPR/Robert Wood Johnson Foundation/Harvard T.H. Chan School of Public Health, What Shapes Health, September 15 – October 15, 2014.
Childhood Experiences Americans Believe Had a
Harmful Effect on Their Health Later in Life
% saying had one or more of eleven harmful childhood experiences
10%
11%
11%
13%
18%
The death or serious illness of a family member or close friend
Growing up in a low-income household
Having a serious physical injury or accident
Parents getting divorced, separated, or breaking up
A parent or other close family member losing a job
39%
Experiences cited most often are…
7
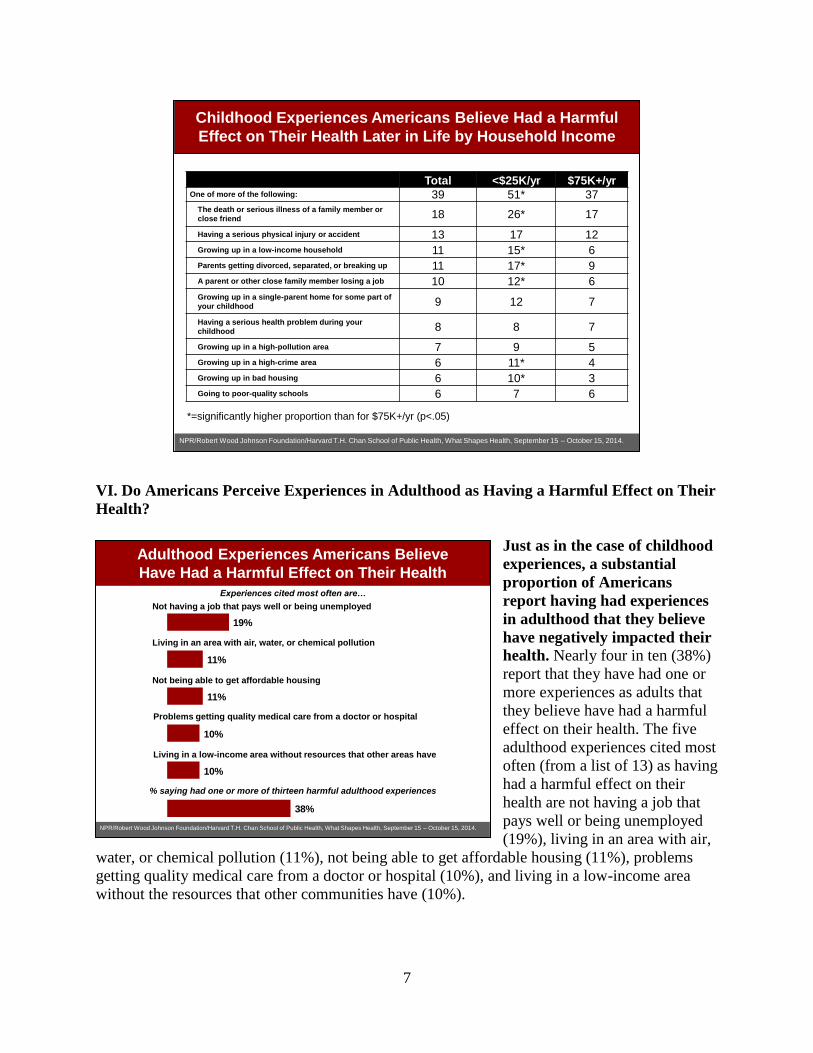
VI. Do Americans Perceive Experiences in Adulthood as Having a Harmful Effect on Their
Health?
Just as in the case of childhood
experiences, a substantial
proportion of Americans
report having had experiences
in adulthood that they believe
have negatively impacted their
health. Nearly four in ten (38%)
report that they have had one or
more experiences as adults that
they believe have had a harmful
effect on their health. The five
adulthood experiences cited most
often (from a list of 13) as having
had a harmful effect on their
health are not having a job that
pays well or being unemployed
(19%), living in an area with air,
water, or chemical pollution (11%), not being able to get affordable housing (11%), problems
getting quality medical care from a doctor or hospital (10%), and living in a low-income area
without the resources that other communities have (10%).
NPR/Robert Wood Johnson Foundation/Harvard T.H. Chan School of Public Health, What Shapes Health, September 15 – October 15, 2014.
Total <$25K/yr $75K+/yrOne of more of the following: 39 51* 37
The death or serious illness of a family member or
close friend 18 26* 17
Having a serious physical injury or accident 13 17 12
Growing up in a low-income household 11 15* 6
Parents getting divorced, separated, or breaking up 11 17* 9
A parent or other close family member losing a job 10 12* 6
Growing up in a single-parent home for some part of
your childhood 9 12 7
Having a serious health problem during your
childhood 8 8 7
Growing up in a high-pollution area 7 9 5
Growing up in a high-crime area 6 11* 4
Growing up in bad housing 6 10* 3
Going to poor-quality schools 6 7 6
Childhood Experiences Americans Believe Had a Harmful
Effect on Their Health Later in Life by Household Income
*=significantly higher proportion than for $75K+/yr (p<.05)
NPR/Robert Wood Johnson Foundation/Harvard T.H. Chan School of Public Health, What Shapes Health, September 15 – October 15, 2014.
Adulthood Experiences Americans Believe
Have Had a Harmful Effect on Their Health
Not having a job that pays well or being unemployed
Not being able to get affordable housing
Living in an area with air, water, or chemical pollution
Problems getting quality medical care from a doctor or hospital
Living in a low-income area without resources that other areas have
10%
10%
11%
11%
19%
Experiences cited most often are…
% saying had one or more of thirteen harmful adulthood experiences
38%

8
Of note, African Americans and Hispanics cite additional top-rated harmful adulthood
experiences. One in five African Americans (21%) report having experienced racial or ethnic
discrimination in adulthood that they believe has had a harmful effect on their health. One in six
Hispanics (17%) report that the adulthood experience of living in a low-income area without the
resources that other communities have has had a harmful effect on their health.
The groups most likely to report having had one or more negative experiences in adulthood that
they believe have had a harmful effect on their health are those who say they are in fair or poor
health (56%) and those with household incomes of less than $25,000 a year (53%).
VII. What Are People Doing to Stay Healthy?
Although many experts believe that Americans are not doing enough to maintain or
improve their health, the public reports doing a number of things experts recommend. Two-thirds of Americans report that they put a great deal (27%) or quite a bit (40%) of effort
into trying to maintain or improve their own health. About one-third (32%) say they do not put in
much effort (some, very little, none at all). Those who are concerned with their future health are
more likely than those who are less concerned (71% to 61%) to say they put in substantial effort.
When given a list of 20 things that might help maintain or improve their health, the top five
things Americans say they are currently doing are frequently eating healthy fruits and vegetables
(87%), actively trying to reduce stress (83%), limiting the amount of fast food they eat (82%),
limiting the amount of alcohol
they drink (79%), and limiting
the amount of sugar-sweetened
soda or sports drinks they drink
(79%). The survey did not ask
people how frequently they took
these actions.
About three in ten Americans
(29%) report that they exercise or
participate in vigorous physical
activity every day, while 45%
say they do so a few times a
week, and about one in four
(26%) report that they exercise or
do vigorous physical activities a
few times a month or less.
One in six Americans (16%) report that they are currently on a diet to lose weight, including
10% who say they are on a low-fat diet and 8% who say they are on a low-carbohydrate diet.
NPR/Robert Wood Johnson Foundation/Harvard T.H. Chan School of Public Health, What Shapes Health, September 15 – October 15, 2014.
Americans’ Current Exercise and Dieting Habits
8%
10%
16%
26%
45%
29%
% saying currently dieting to lose weight
Every Day
A Few Times
a Week
A Few Times
a Month or Less
Total
On a Low-Fat Diet
On a Low-Carb Diet
% saying exercise or participate in vigorous physical activity…
Including those who said they are…
9
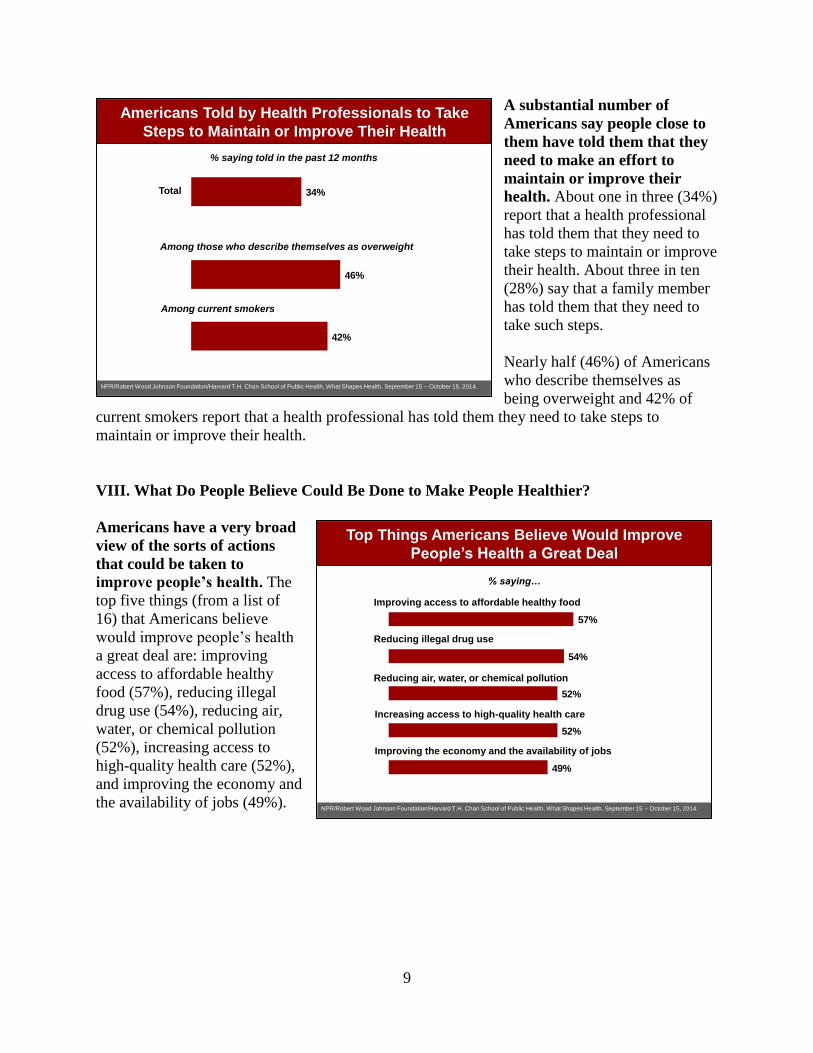
A substantial number of
Americans say people close to
them have told them that they
need to make an effort to
maintain or improve their
health. About one in three (34%)
report that a health professional
has told them that they need to
take steps to maintain or improve
their health. About three in ten
(28%) say that a family member
has told them that they need to
take such steps.
Nearly half (46%) of Americans
who describe themselves as
being overweight and 42% of
current smokers report that a health professional has told them they need to take steps to
maintain or improve their health.
VIII. What Do People Believe Could Be Done to Make People Healthier?
Americans have a very broad
view of the sorts of actions
that could be taken to
improve people’s health. The
top five things (from a list of
16) that Americans believe
would improve people’s health
a great deal are: improving
access to affordable healthy
food (57%), reducing illegal
drug use (54%), reducing air,
water, or chemical pollution
(52%), increasing access to
high-quality health care (52%),
and improving the economy and
the availability of jobs (49%).
NPR/Robert Wood Johnson Foundation/Harvard T.H. Chan School of Public Health, What Shapes Health, September 15 – October 15, 2014.
Americans Told by Health Professionals to Take
Steps to Maintain or Improve Their Health
% saying told in the past 12 months
34%Total
Among those who describe themselves as overweight
42%
46%
Among current smokers
NPR/Robert Wood Johnson Foundation/Harvard T.H. Chan School of Public Health, What Shapes Health, September 15 – October 15, 2014.
Top Things Americans Believe Would Improve
People’s Health a Great Deal
% saying…
49%
52%
52%
54%
57%
Improving access to affordable healthy food
Reducing air, water, or chemical pollution
Reducing illegal drug use
Increasing access to high-quality health care
Improving the economy and the availability of jobs

10
IX. What Do Americans Mean by “Health?”
When asked to say in their own words what “health” or “health and physical and mental
well-being” mean to them, Americans give a broad range of answers. Generally speaking,
their answers fall into three categories: (1) being healthy or not ill; (2) personal well-being; and
(3) lifestyle or taking care of yourself.
The answers differ somewhat depending on which of the two words or phrases is used. When
half the sample was asked what “health” means to them, 38% defined it in terms of being healthy
or not ill. Three in ten (30%) saw it as personal well-being, and 18% defined it as lifestyle or
taking care of yourself.
Answers differed for the half-sample who were asked what “health and physical or mental well-
being” means to them. About one-third (34%) defined the phrase in terms of personal well-being.
About one-fourth (27%) thought of it as being healthy or not ill, and 19% defined it as lifestyle
or taking care of yourself.
When Americans think about health, it is not just about sickness, but about a broad range of
concerns.
X. Conclusions
The United States is a country where most people are concerned about their health. In fact, about
one-third (31%) say they are very concerned. Americans do not see a single problem that leads to
ill health; rather, they see a broad range of causes. The top five causes of health problems that
Americans see as extremely important are lack of access to high-quality medical care (42%),
personal behavior (40%), viruses or bacteria (40%), high stress (37%), and being exposed to air,
water, or chemical pollution (35%).
In addition, it turns out that a substantial number of Americans have had negative experiences in
their childhood or adulthood that they believe had a longer-term impact on their health. Nearly
four in ten (39%) report having had adverse experiences in childhood that they believe have had
a harmful effect on their later health. The two childhood experiences Americans cite most often
as having had a harmful effect on their later health are the death or serious illness of a family
member or close friend (18%) and having a serious physical injury or accident (13%). Similarly,
about four in ten (38%) report that they have had one or more experiences as adults that they
believe have had a harmful effect on their health. These findings suggest the importance of
paying attention to key events and life circumstances that may shape individuals’ future health.
In terms of improving the health of the nation and their own communities, Americans think very
broadly about the issues that have to be addressed in the future. The public recognizes that
effective steps in improving health go beyond medical care, including economic, environmental,
and school-, work-, and diet-related measures.

11
Methodology
This poll is part of an on-going series of surveys developed by researchers at the Harvard
Opinion Research Program (HORP) at the Harvard T.H. Chan School of Public Health in
partnership with the Robert Wood Johnson Foundation and NPR. The research team consists of
the following members at each institution.
Harvard T.H. Chan School of Public Health: Robert J. Blendon, Professor of Health Policy and
Political Analysis and Executive Director of HORP; John M. Benson, Research Scientist and
Managing Director of HORP; Justin M. Sayde, Administrative and Research Manager; and Mary
T. Gorski, Research Fellow.
Robert Wood Johnson Foundation: Fred Mann, Vice President, Communications; Carolyn
Miller, Senior Program Officer, Research and Evaluation; and Brooke Van Roekel, Director
Audience Engagement and Marketing.
NPR: Anne Gudenkauf, Senior Supervising Editor, Science Desk; and Joe Neel, Deputy Senior
Supervising Editor, Science Desk.
Interviews were conducted via telephone (including both landline and cell phone) by SSRS of
Media (PA), September 15 – October 15, 2014, among a nationally representative sample of
2,423 respondents age 18 and older. The interviews were conducted in English and Spanish. The
margin of error for total respondents is +/- 2.4 percentage points at the 95% confidence level.
Possible sources of non-sampling error include non-response bias, as well as question wording
and ordering effects. Non-response in telephone surveys produces some known biases in survey-
derived estimates because participation tends to vary for different subgroups of the population.
To compensate for these known biases and for variations in probability of selection within and
across households, sample data are weighted by household size, cell phone/landline use and
demographics (sex, age, race/ethnicity, education, number of adults in household and census
region) to reflect the true population. Other techniques, including random-digit dialing, replicate
subsamples, and systematic respondent selection within households, are used to ensure that the
sample is representative.

NPR ROBERT WOOD JOHNSON FOUNDATION
HARVARD T.H. CHAN SCHOOL OF PUBLIC HEALTH
WHAT SHAPES HEALTH
This survey was conducted for National Public Radio, the Robert Wood Johnson Foundation, and the Harvard T.H. Chan School of Public Health via telephone (landline and cell phone) by SSRS, an independent research company. Interviews were conducted September 15 – October 15, 2014, among a nationally representative sample of 2,423 respondents age 18 or older. The margin of error for total respondents is +/-2.4 percentage points at the 95% confidence level.
Page # I. What Health Means to You 2 II. What People Are Doing to Stay Healthy 5 III. What Could Be Done to Improve People’s Health 12 IV. Beliefs about What Shapes Health 16 V. Community and Social Networks 22 VI. Experiences 25 VII. Health Demographics 30
VIII. Demographics 33

NPR/Robert Wood Johnson Foundation/Harvard T.H. Chan School of Public Health Survey – What Shapes Health 2
I. WHAT HEALTH MEANS TO YOU (Random Half Sample Q1/Q2 Series Respondents; n=1,214) 1. How concerned are you about your health in the future—very concerned, somewhat concerned, not too concerned, or not at all concerned? Very concerned 31 Somewhat concerned 31 Not too concerned 25 Not at all concerned 12 Don’t know/Refused 1 (Random Half Sample Q3/Q4 Series Respondents; n=1,209) 3. How concerned are you about your health and physical and mental well-being in the future—very concerned, somewhat concerned, not too concerned, or not at all concerned? Very concerned 31 Somewhat concerned 31 Not too concerned 24 Not at all concerned 12 Don’t know/Refused 2 Combined results of Q1 and Q3 (n=2,423) Very concerned 31 Somewhat concerned 31 Not too concerned 24 Not at all concerned 12 Don’t know/Refused 2

NPR/Robert Wood Johnson Foundation/Harvard T.H. Chan School of Public Health Survey – What Shapes Health 3
(Random Half Sample Q1/Q2 Series Respondents; n=1,214) 2. When you hear the word “health,” what does it mean to you? Being healthy, not sick (Net) 38 Being healthy/healthy body/in good physical health/physical well being 19 Not being sick/in pain/not having diseases/health problems 10 Bad health/health problems (sicknesses/diseases/cancer/due to accidents/etc.) 3 Life/longevity 4 Having health insurance/good health insurance 2 Well-being (Net) 30 Mental/emotional/physical/spiritual/state of mind and body 6 Good life/good quality of life/being able to do whatever you want to do/personal satisfaction/independence 6 Wellness/general/overall wellness/feeling good overall/all health aspects (general/overall) 18 Lifestyle, taking care of yourself (Net) 18 Being/keeping in good shape/physically fit 3 Exercising/being active 1 Eating properly/maintaining healthy weight 3 Taking care of your body (other) 2 Taking care of yourself/taking preventative actions (general/overall) 6 Healthy lifestyle/well-rounded 3 Nothing 1 Other 9 Don’t know/Refused 4

NPR/Robert Wood Johnson Foundation/Harvard T.H. Chan School of Public Health Survey – What Shapes Health 4
(Random Half Sample Q3/Q4 Series Respondents; n=1,209) 4. When you hear the term “health and physical and mental well-being,” what does that mean to you? Being healthy, not sick (Net) 27 Being healthy/healthy body/in good physical health/physical well being 17 Not being sick/in pain/not having diseases/health problems 4 Bad health/health problems (sicknesses/diseases/cancer/due to accidents/etc.) 2 Life/longevity 3 Having health insurance/good health insurance 1 Well-being (Net) 34 Mental/emotional/physical/spiritual/state of mind and body 17 Good life/good quality of life/being able to do whatever you want to do/personal satisfaction/independence 7 Wellness/general/overall wellness/feeling good overall/all health aspects (general/overall) 10 Lifestyle, taking care of yourself (Net) 19 Being/keeping in good shape/physically fit 2 Exercising/being active 2 Eating properly/maintaining healthy weight 2 Taking care of your body (other) 2 Taking care of yourself/taking preventative actions (general/overall) 8 Healthy lifestyle/well-rounded 3 Nothing 3 Other 12 Don’t know/Refused 5

NPR/Robert Wood Johnson Foundation/Harvard T.H. Chan School of Public Health Survey – What Shapes Health 5
II. WHAT PEOPLE ARE DOING TO STAY HEALTHY For the rest of this survey, we are going to ask for your attitudes and experiences about health, in a broad sense. When we say “health,” we mean both freedom from disease, mental illness, and disability, as well as having a sense of physical and mental well-being. 5. How much control do you think you have over your own health—a great deal, quite a bit, some, very little, or none at all? A great deal 50 Quite a bit 28 Some 16 Very little 4 None at all 2 Don’t know/Refused * 6. How much effort would you say you put into trying to maintain or improve your own health? Would you say a great deal of effort, quite a bit, some, very little, or none at all? A great deal 27 Quite a bit 40 Some 26 Very little 5 None at all 1 Don’t know/Refused 1 (Respondents that put effort into improving their health) Q6a. How often do you do something to try to maintain or improve your own health—more than once a day, once a day, a few times a week, once a week, or less than once a week? Combo Table Q6/Q6a Total Respondents (n=2,423) A great deal/Quite a bit of effort into maintain/improve health 67
More than once a day 25 Once a day 25 A few times a week 15 Once a week 2 Less than once a week 1
Some effort into maintain/improve health 26 Very little effort into maintain/improve health 5 No effort at all 1 Don’t know/Refused 1

NPR/Robert Wood Johnson Foundation/Harvard T.H. Chan School of Public Health Survey – What Shapes Health 6
7. In general, how would you describe your own health—excellent, very good, good, fair or poor? Excellent 17 Very good 35 Good 32 Fair 12 Poor 4 Don’t know/Refused * 8. During the past five years, do you think your health in general has gotten better, gotten worse, or stayed about the same? Better 20 Worse 24 Stayed about the same 56 Don’t know/Refused *

NPR/Robert Wood Johnson Foundation/Harvard T.H. Chan School of Public Health Survey – What Shapes Health 7
9. I’m going to read you a list of things that some people do because they think these things might help maintain or improve their health. For each one, please tell me whether or not that is something you currently do. (Rank-ordered by % saying “yes”)
(Random Half of Half Sample A Respondents; n=606)
i. Frequently eat healthy fruits and vegetables Yes 87 No 13 Don’t know/Refused * (Random Half of Half Sample A Respondents; n=605) q. Actively try to reduce stress Yes 83 No 16 Don’t know/Refused 1
(Random Half of Half Sample A Respondents; n=606)
d. Limit the amount of fast food you eat Yes 82 No 17 Don’t know/Refused 1 (Half Sample A Respondents; n=1,211) a. Exercise or get physical activity during your leisure time Yes 81 No 18 Don’t know/Refused 1
(Random Half of Half Sample A Respondents; n=606)
f. Limit the amount of alcohol you drink Yes 79 No 19 Don’t know/Refused 2

NPR/Robert Wood Johnson Foundation/Harvard T.H. Chan School of Public Health Survey – What Shapes Health 8
(Random Half of Half Sample A Respondents; n=606)
g. Limit the amount of sugar-sweetened soda or sports drinks you drink Yes 79 No 19 Don’t know/Refused 2
(Random Half of Half Sample A Respondents; n=606)
c. Limit the amount of sugar you eat and drink Yes 78 No 21 Don’t know/Refused 1 (Random Half of Half Sample A Respondents; n=605) n. Get enough sleep Yes 77 No 22 Don’t know/Refused 1
(Random Half of Half Sample A Respondents; n=605) t. Get appropriate vaccinations Yes 77 No 22 Don’t know/Refused 1 (Random Half of Half Sample A Respondents; n=606) j. Limit portion sizes of food and beverages you eat or drink Yes 75 No 24 Don’t know/Refused 1
(Random Half of Half Sample A Respondents; n=605) o. Go to the doctor regularly Yes 74 No 26 Don’t know/Refused *

NPR/Robert Wood Johnson Foundation/Harvard T.H. Chan School of Public Health Survey – What Shapes Health 9
(Random Half of Half Sample A Respondents; n=605) p. Go to the dentist regularly Yes 71 No 29 Don’t know/Refused --
(Random Half of Half Sample A Respondents; n=606)
k. Limit the amount of high-cholesterol food you eat Yes 69 No 30 Don’t know/Refused 1
(Random Half of Half Sample A Respondents; n=606)
h. Eat whole grains or a high-fiber diet Yes 68 No 31 Don’t know/Refused 1 (Random Half of Half Sample A Respondents; n=605) r. Use hand sanitizer Yes 68 No 31 Don’t know/Refused 1 (Random Half of Half Sample A Respondents; n=605) l. Pray for your health and well-being Yes 68 No 32 Don’t know/Refused *
(Random Half of Half Sample A Respondents; n=606)
b. Limit the amount of high-salt food you eat Yes 67 No 32 Don’t know/Refused 1

NPR/Robert Wood Johnson Foundation/Harvard T.H. Chan School of Public Health Survey – What Shapes Health 10
(Random Half of Half Sample A Respondents; n=605) s. Have a pet for your health and well-being Yes 52 No 47 Don’t know/Refused 1 (Random Half of Half Sample A Respondents; n=605) m. Meditate for your health and well-being Yes 41 No 58 Don’t know/Refused 1
(Random Half of Half Sample A Respondents; n=606)
e. Eat organic foods Yes 38 No 61 Don’t know/Refused 1 (Random Half of Half Sample A Respondents; n=605) u. Eat a gluten-free diet Yes 24 No 74 Don’t know/Refused 2

NPR/Robert Wood Johnson Foundation/Harvard T.H. Chan School of Public Health Survey – What Shapes Health 11
(Half Sample A Respondents; n=1,211) 10. Are you currently on a diet to lose weight, or are you not on a diet to lose weight right now? Yes 16 No 83 Don’t know/Refused 1 (Half Sample A Respondents who are on a diet) 11. Are you currently on a low-carbohydrate diet, or not? Combo Table Q10/Q11 Half Sample A Respondents Yes, currently on a diet 16
Yes, currently on a low-carbohydrate diet 8 No, NOT currently on a low-carbohydrate diet 8
No, not currently on a diet 83 Don’t know/Refused 1 (Half Sample A Respondents who are on a diet) 12. Are you currently on a low-fat diet, or not? Combo Table Q10/Q12 Half Sample A Respondents Yes, currently on a diet 16
Yes, currently on a low-fat diet 10 No, NOT currently on a low-fat diet 6
No, not currently on a diet 83 Don’t know/Refused 1
NPR/Robert Wood Johnson Foundation/Harvard T.H. Chan School of Public Health Survey – What Shapes Health 12
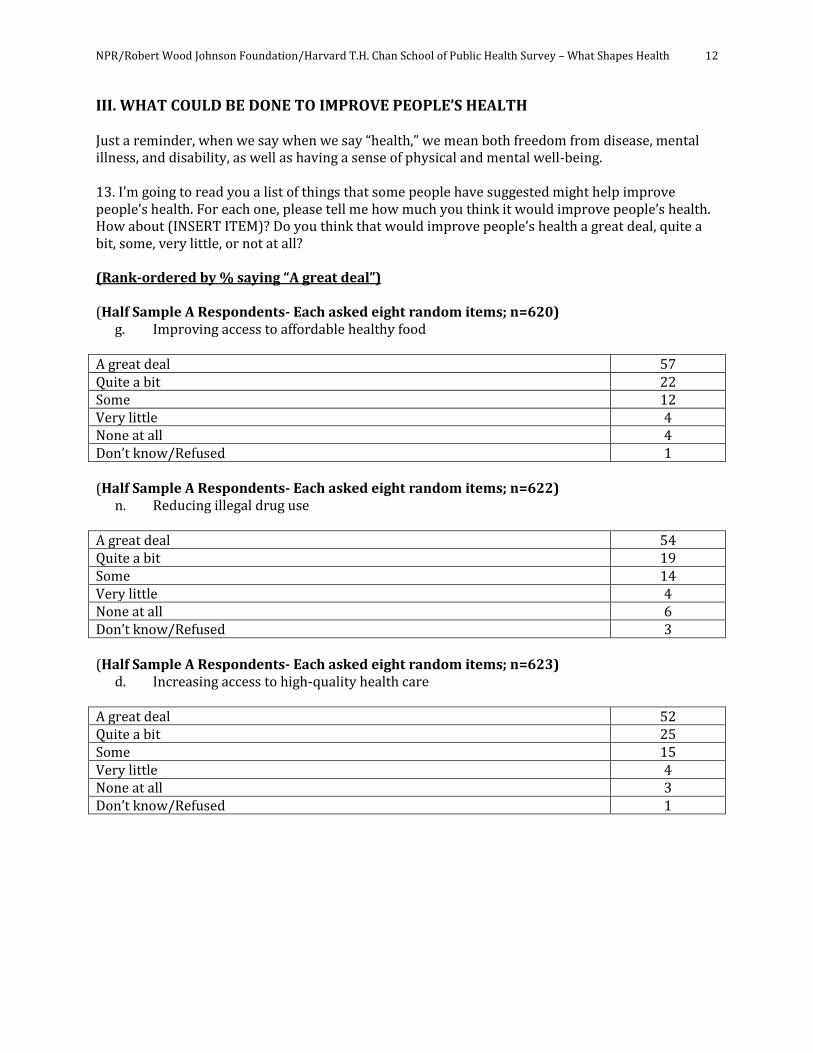
III. WHAT COULD BE DONE TO IMPROVE PEOPLE’S HEALTH Just a reminder, when we say when we say “health,” we mean both freedom from disease, mental illness, and disability, as well as having a sense of physical and mental well-being. 13. I’m going to read you a list of things that some people have suggested might help improve people’s health. For each one, please tell me how much you think it would improve people’s health. How about (INSERT ITEM)? Do you think that would improve people’s health a great deal, quite a bit, some, very little, or not at all? (Rank-ordered by % saying “A great deal”) (Half Sample A Respondents- Each asked eight random items; n=620) g. Improving access to affordable healthy food A great deal 57 Quite a bit 22 Some 12 Very little 4 None at all 4 Don’t know/Refused 1 (Half Sample A Respondents- Each asked eight random items; n=622) n. Reducing illegal drug use A great deal 54 Quite a bit 19 Some 14 Very little 4 None at all 6 Don’t know/Refused 3 (Half Sample A Respondents- Each asked eight random items; n=623) d. Increasing access to high-quality health care A great deal 52 Quite a bit 25 Some 15 Very little 4 None at all 3 Don’t know/Refused 1
NPR/Robert Wood Johnson Foundation/Harvard T.H. Chan School of Public Health Survey – What Shapes Health 13
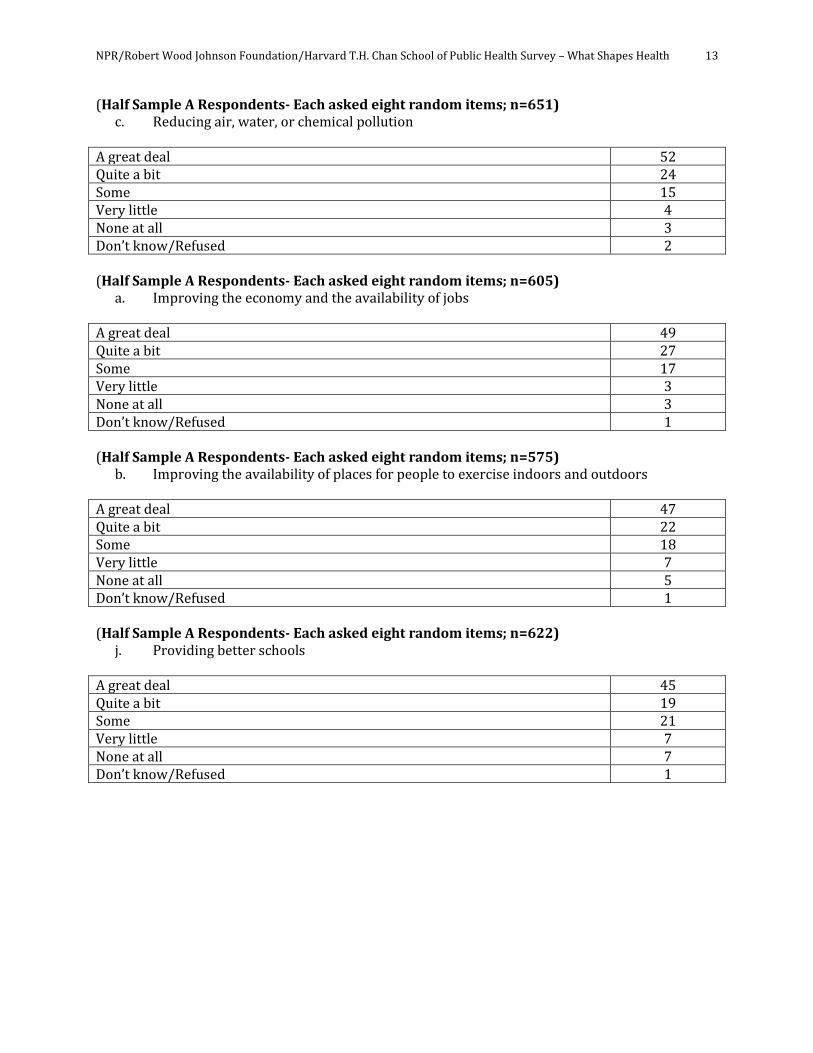
(Half Sample A Respondents- Each asked eight random items; n=651) c. Reducing air, water, or chemical pollution A great deal 52 Quite a bit 24 Some 15 Very little 4 None at all 3 Don’t know/Refused 2 (Half Sample A Respondents- Each asked eight random items; n=605) a. Improving the economy and the availability of jobs A great deal 49 Quite a bit 27 Some 17 Very little 3 None at all 3 Don’t know/Refused 1 (Half Sample A Respondents- Each asked eight random items; n=575) b. Improving the availability of places for people to exercise indoors and outdoors A great deal 47 Quite a bit 22 Some 18 Very little 7 None at all 5 Don’t know/Refused 1 (Half Sample A Respondents- Each asked eight random items; n=622) j. Providing better schools A great deal 45 Quite a bit 19 Some 21 Very little 7 None at all 7 Don’t know/Refused 1

NPR/Robert Wood Johnson Foundation/Harvard T.H. Chan School of Public Health Survey – What Shapes Health 14
(Half Sample A Respondents- Each asked eight random items; n=615) f. Reducing crime and improving neighborhood safety A great deal 44 Quite a bit 23 Some 21 Very little 6 None at all 5 Don’t know/Refused 1 (Half Sample A Respondents- Each asked eight random items; n=579) k. Improving access to high-quality child care and pre-kindergarten education A great deal 42 Quite a bit 22 Some 20 Very little 6 None at all 8 Don’t know/Refused 2 (Half Sample A Respondents- Each asked eight random items; n=587) p. Adequate paid individual and family sick leave at work A great deal 41 Quite a bit 19 Some 25 Very little 7 None at all 5 Don’t know/Refused 3 (Half Sample A Respondents- Each asked eight random items; n=618) i. Reducing racial and ethnic discrimination A great deal 40 Quite a bit 16 Some 21 Very little 10 None at all 10 Don’t know/Refused 3
NPR/Robert Wood Johnson Foundation/Harvard T.H. Chan School of Public Health Survey – What Shapes Health 15
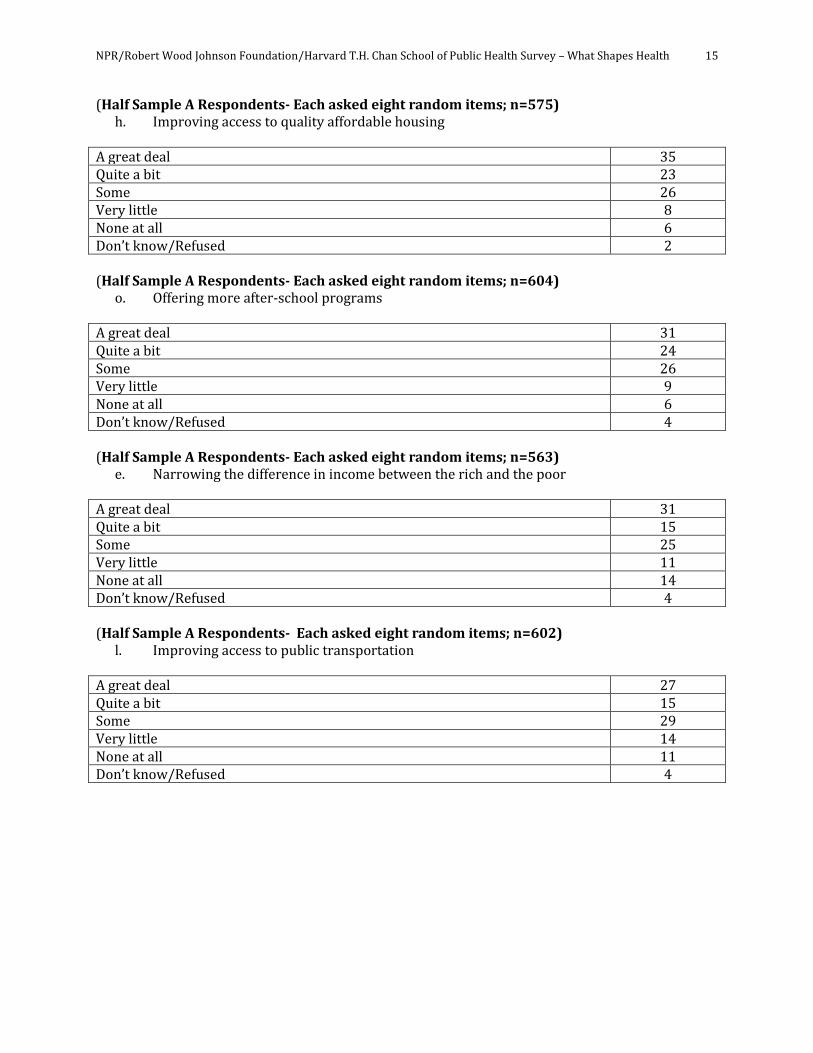
(Half Sample A Respondents- Each asked eight random items; n=575) h. Improving access to quality affordable housing A great deal 35 Quite a bit 23 Some 26 Very little 8 None at all 6 Don’t know/Refused 2 (Half Sample A Respondents- Each asked eight random items; n=604) o. Offering more after-school programs A great deal 31 Quite a bit 24 Some 26 Very little 9 None at all 6 Don’t know/Refused 4 (Half Sample A Respondents- Each asked eight random items; n=563) e. Narrowing the difference in income between the rich and the poor A great deal 31 Quite a bit 15 Some 25 Very little 11 None at all 14 Don’t know/Refused 4 (Half Sample A Respondents- Each asked eight random items; n=602) l. Improving access to public transportation A great deal 27 Quite a bit 15 Some 29 Very little 14 None at all 11 Don’t know/Refused 4

NPR/Robert Wood Johnson Foundation/Harvard T.H. Chan School of Public Health Survey – What Shapes Health 16
(Half Sample A Respondents- Each asked eight random items; n=627) m. Improving garbage collection A great deal 22 Quite a bit 13 Some 27 Very little 18 None at all 17 Don’t know/Refused 3
IV. BELIEFS ABOUT WHAT SHAPES HEALTH 14. There can be many causes of problems with a person’s health. How important do you think each of the following is as a cause of such problems? How about (INSERT ITEM)? Would you say that is extremely important, very important, somewhat important, not too important, or not at all important? (Rank-ordered by % saying “Extremely important”) (Half Sample A Respondents; n=1,211) d. Lack of access to high-quality medical care Extremely important 42 Very important 37 Somewhat important 16 Not too important 2 Not at all important 2 Don’t know/Refused 1 (Half Sample A Respondents; n=1,211) c. Personal behavior Extremely important 40 Very important 44 Somewhat important 14 Not too important 2 Not at all important 1 Don’t know/Refused * (Half Sample A Respondents; n=1,211) b. Viruses or bacteria Extremely important 40 Very important 40 Somewhat important 16 Not too important 1 Not at all important 1 Don’t know/Refused 2
NPR/Robert Wood Johnson Foundation/Harvard T.H. Chan School of Public Health Survey – What Shapes Health 17
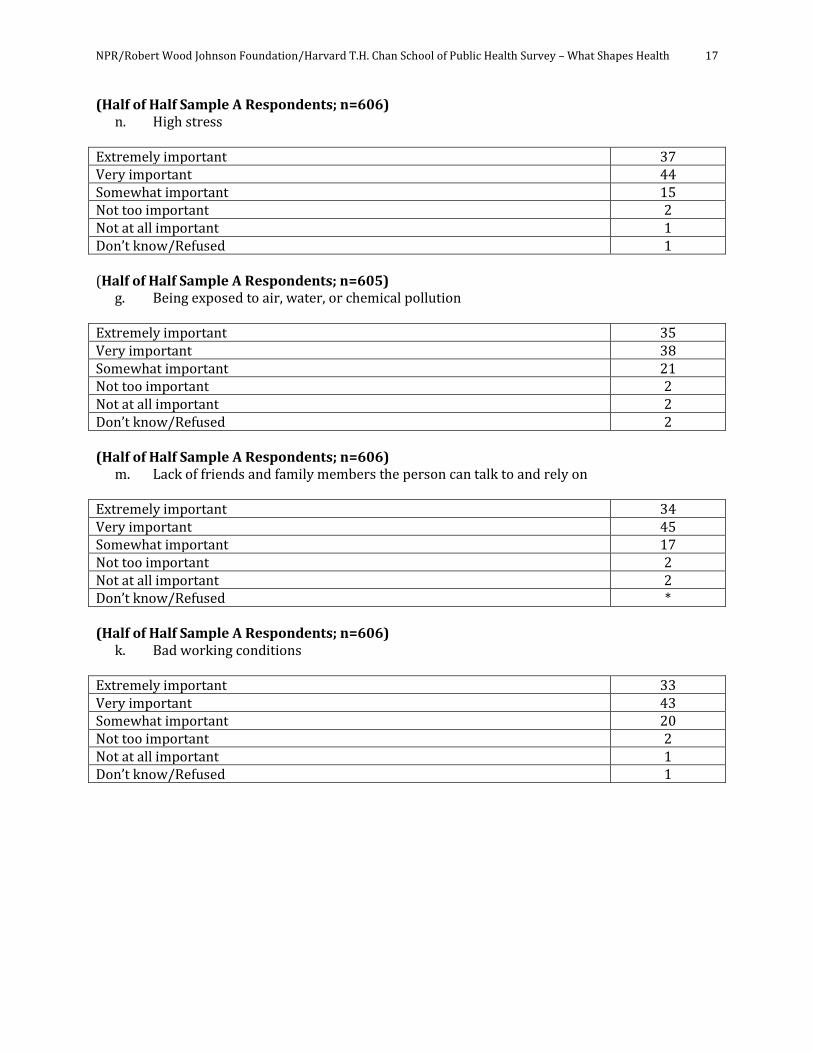
(Half of Half Sample A Respondents; n=606) n. High stress Extremely important 37 Very important 44 Somewhat important 15 Not too important 2 Not at all important 1 Don’t know/Refused 1 (Half of Half Sample A Respondents; n=605) g. Being exposed to air, water, or chemical pollution Extremely important 35 Very important 38 Somewhat important 21 Not too important 2 Not at all important 2 Don’t know/Refused 2 (Half of Half Sample A Respondents; n=606) m. Lack of friends and family members the person can talk to and rely on Extremely important 34 Very important 45 Somewhat important 17 Not too important 2 Not at all important 2 Don’t know/Refused * (Half of Half Sample A Respondents; n=606) k. Bad working conditions Extremely important 33 Very important 43 Somewhat important 20 Not too important 2 Not at all important 1 Don’t know/Refused 1
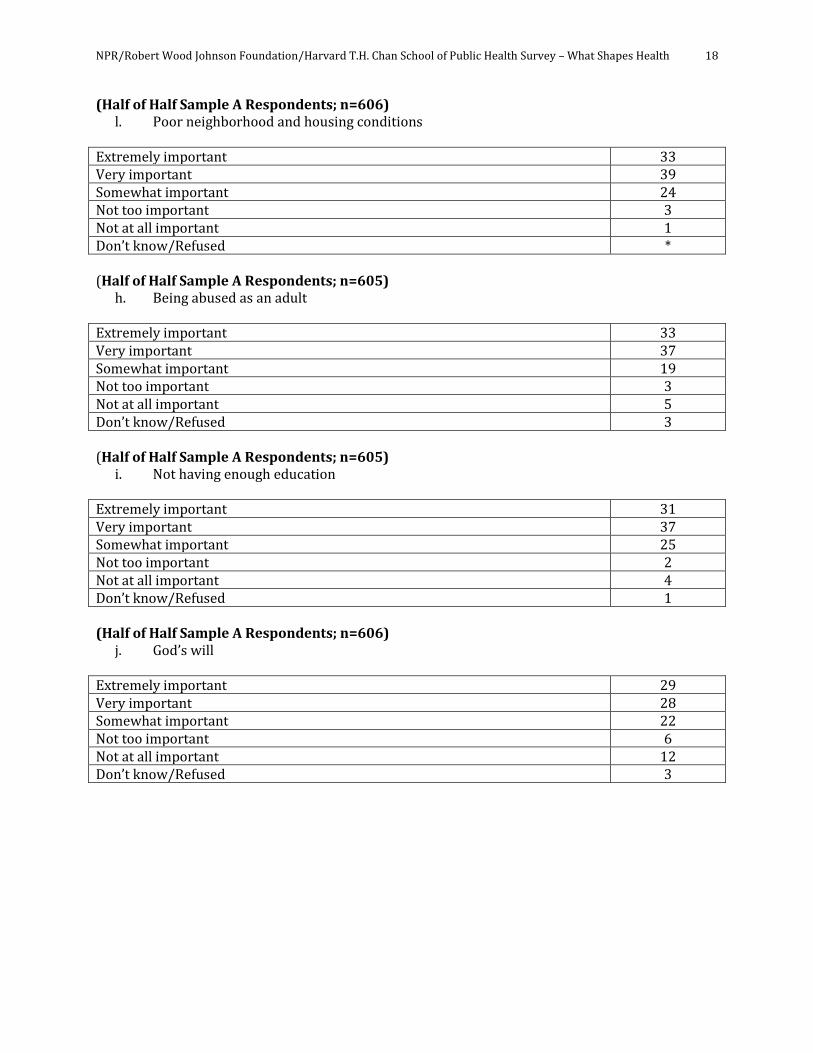
NPR/Robert Wood Johnson Foundation/Harvard T.H. Chan School of Public Health Survey – What Shapes Health 18
(Half of Half Sample A Respondents; n=606) l. Poor neighborhood and housing conditions Extremely important 33 Very important 39 Somewhat important 24 Not too important 3 Not at all important 1 Don’t know/Refused * (Half of Half Sample A Respondents; n=605) h. Being abused as an adult Extremely important 33 Very important 37 Somewhat important 19 Not too important 3 Not at all important 5 Don’t know/Refused 3 (Half of Half Sample A Respondents; n=605) i. Not having enough education Extremely important 31 Very important 37 Somewhat important 25 Not too important 2 Not at all important 4 Don’t know/Refused 1 (Half of Half Sample A Respondents; n=606) j. God’s will Extremely important 29 Very important 28 Somewhat important 22 Not too important 6 Not at all important 12 Don’t know/Refused 3

NPR/Robert Wood Johnson Foundation/Harvard T.H. Chan School of Public Health Survey – What Shapes Health 19
(Half of Half Sample A Respondents; n=605) f. Having a low income Extremely important 27 Very important 30 Somewhat important 30 Not too important 6 Not at all important 7 Don’t know/Refused * (Half Sample A Respondents; n=1,211) a. Bad genes Extremely important 19 Very important 30 Somewhat important 36 Not too important 6 Not at all important 5 Don’t know/Refused 4 (Half of Half Sample A Respondents; n=605) e. Bad luck Extremely important 9 Very important 7 Somewhat important 30 Not too important 19 Not at all important 32 Don’t know/Refused 3

NPR/Robert Wood Johnson Foundation/Harvard T.H. Chan School of Public Health Survey – What Shapes Health 20
15. There can be things that happen in childhood that can cause problems with a person’s health later in life when they are adults. How important do you think each of the following is as a cause of such problems? (Rank-ordered by % saying “Extremely important”) (Half Sample A Respondents; n=1,211) d. Being abused or neglected in childhood Extremely important 54 Very important 35 Somewhat important 8 Not too important 1 Not at all important 1 Don’t know/Refused 1 (Half Sample A Respondents; n=1,211) b. Eating a poor diet in childhood Extremely important 44 Very important 39 Somewhat important 14 Not too important 1 Not at all important 1 Don’t know/Refused 1 (Half Sample A Respondents; n=1,211) e. Living in a polluted environment in childhood Extremely important 44 Very important 36 Somewhat important 14 Not too important 2 Not at all important 2 Don’t know/Refused 2 (Half Sample A Respondents; n=1,211) f. Not getting vaccinations as a child Extremely important 43 Very important 34 Somewhat important 15 Not too important 3 Not at all important 3 Don’t know/Refused 2

NPR/Robert Wood Johnson Foundation/Harvard T.H. Chan School of Public Health Survey – What Shapes Health 21
(Half Sample A Respondents; n=1,211) c. Living in poverty in childhood Extremely important 31 Very important 35 Somewhat important 24 Not too important 5 Not at all important 4 Don’t know/Refused 1 (Half Sample A Respondents; n=1,211 g. Not graduating from high school Extremely important 29 Very important 33 Somewhat important 25 Not too important 8 Not at all important 4 Don’t know/Refused 1 (Half Sample A Respondents; n=1,211) a. Being born premature or underweight Extremely important 23 Very important 28 Somewhat important 34 Not too important 7 Not at all important 5 Don’t know/Refused 3

NPR/Robert Wood Johnson Foundation/Harvard T.H. Chan School of Public Health Survey – What Shapes Health 22
V. COMMUNITY AND SOCIAL NETWORKS (Half Sample A Respondents; n=1,211) 16. Do you participate in any unpaid activities in community or volunteer organizations, or not? This includes health-related, sports-related, school, civic, political or social organizations, or religious organizations other than attending services. Yes 55 No 45 (Half Sample A Respondents who participate in community activities; n=717) 16a. How often do you participate in these activities? Every day, at least once a week, once or twice a month, a few times a year, or less than that? Every day 9 At least once a week 40 Once or twice a month 35 A few times a year 15 Less than that 1 Don’t know/Refused * Combo Table Q16/Q16a Half Sample A Respondents Yes participate in community/volunteer organizations 55
Every day 5 At least once a week 22 Once or twice a month 19 A few times a year 8 Less than that * Don’t know/Refused *
No, do NOT participate in community/volunteer organizations 45 (Half Sample A Respondents who participate in community activities; n=717) 17. Do you think your being involved in such activities helps you maintain or improve your health, or not? Yes 83 No 17 Don’t know/Refused *

NPR/Robert Wood Johnson Foundation/Harvard T.H. Chan School of Public Health Survey – What Shapes Health 23
18. In the past 12 months has (INSERT ITEM) told you that you needed to take steps to maintain or improve your health, or not? a. A family member or friend Yes 28 No 72 Don’t know/Refused * b. A health professional, such as a doctor or nurse Yes 34 No 66 Don’t know/Refused * (Half Sample A Respondents; n=1,211) 19. How important do you think the behavior of your family and friends is in influencing your long-term health—extremely important, very important, somewhat important, not too important, or not at all important? Extremely important 29 Very important 33 Somewhat important 27 Not too important 6 Not at all important 4 Don’t know/Refused 1
NPR/Robert Wood Johnson Foundation/Harvard T.H. Chan School of Public Health Survey – What Shapes Health 24
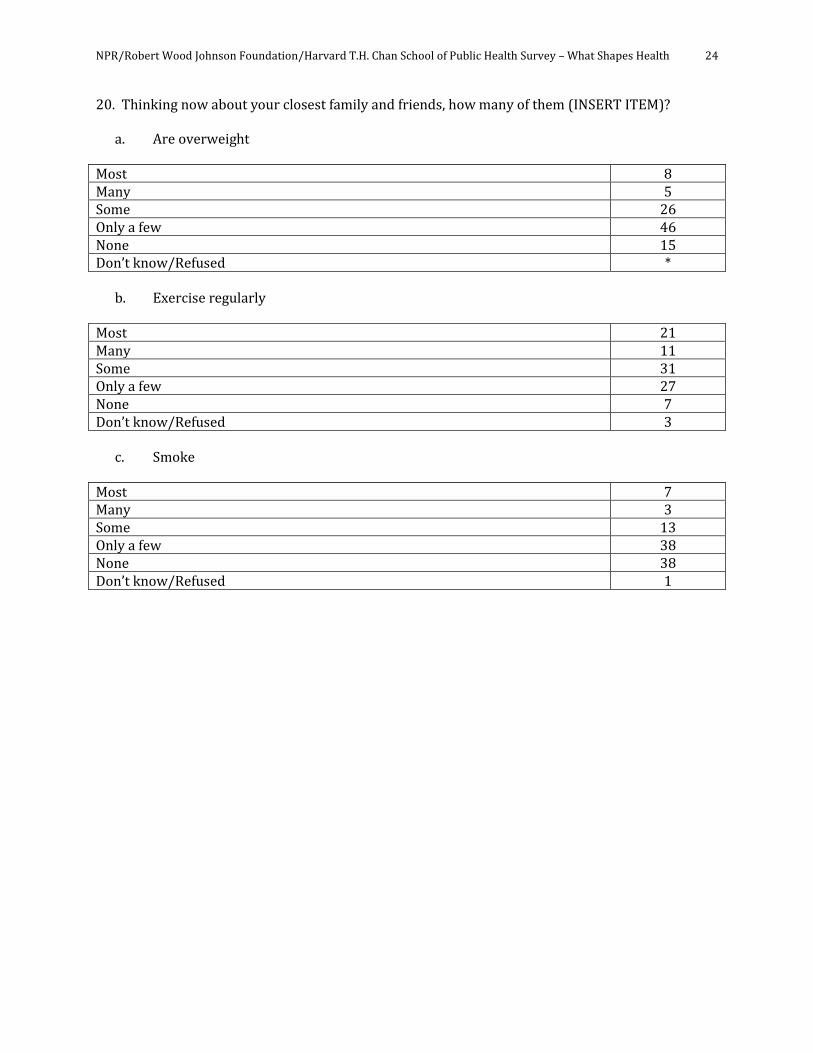
20. Thinking now about your closest family and friends, how many of them (INSERT ITEM)? a. Are overweight Most 8 Many 5 Some 26 Only a few 46 None 15 Don’t know/Refused * b. Exercise regularly Most 21 Many 11 Some 31 Only a few 27 None 7 Don’t know/Refused 3 c. Smoke Most 7 Many 3 Some 13 Only a few 38 None 38 Don’t know/Refused 1

NPR/Robert Wood Johnson Foundation/Harvard T.H. Chan School of Public Health Survey – What Shapes Health 25
VI. EXPERIENCES Just a reminder, when we say when we say “health,” we mean both freedom from disease, mental illness, and disability, as well as having a sense of physical and mental well-being. (Half Sample B Respondents; n=1,212) 21. For each of the following, please tell me whether or not you have experienced this problem as an adult. How about (INSERT ITEM)? Have you experienced this problem as an adult, or not? (IF YES, ASK) Do you think this has had a harmful effect on your health, or not? (Rank-ordered by % saying “Yes, have experienced; harmful effect on health”) a. Not having a job that pays well or being unemployed Yes, have experienced, harmful effect on health 19 Yes, have experienced, NO harmful effect on health 15 No, have NOT experienced 63 Don’t know/Refused 3 c. Living in an area with air, water, or chemical pollution Yes, have experienced, harmful effect on health 11 Yes, have experienced, NO harmful effect on health 9 No, have NOT experienced 79 Don’t know/Refused 1 g. Not being able to get affordable housing Yes, have experienced, harmful effect on health 11 Yes, have experienced, NO harmful effect on health 7 No, have NOT experienced 81 Don’t know/Refused 1 d. Problems getting quality medical care from a doctor or hospital Yes, have experienced, harmful effect on health 10 Yes, have experienced, NO harmful effect on health 6 No, have NOT experienced 84 Don’t know/Refused * e. Living in a low-income area without the resources that other communities have Yes, have experienced, harmful effect on health 10 Yes, have experienced, NO harmful effect on health 10 No, have NOT experienced 79 Don’t know/Refused 1

NPR/Robert Wood Johnson Foundation/Harvard T.H. Chan School of Public Health Survey – What Shapes Health 26
h. Experiencing racial or ethnic discrimination Yes, have experienced, harmful effect on health 9 Yes, have experienced, NO harmful effect on health 12 No, have NOT experienced 79 Don’t know/Refused * b. Not having places to exercise Yes, have experienced, harmful effect on health 8 Yes, have experienced, NO harmful effect on health 6 No, have NOT experienced 85 Don’t know/Refused 1 l. Not having places to ride a bicycle safely Yes, have experienced, harmful effect on health 8 Yes, have experienced, NO harmful effect on health 10 No, have NOT experienced 79 Not applicable (vol) 2 Don’t know/Refused 1 f. Living in a high-crime area Yes, have experienced, harmful effect on health 7 Yes, have experienced, NO harmful effect on health 14 No, have NOT experienced 79 Don’t know/Refused 1 k. Living in an area with poor public transportation Yes, have experienced, harmful effect on health 7 Yes, have experienced, NO harmful effect on health 22 No, have NOT experienced 69 Don’t know/Refused 2 i. Living in an area with poor-quality schools Yes, have experienced, harmful effect on health 5 Yes, have experienced, NO harmful effect on health 10 No, have NOT experienced 82 Don’t know/Refused 3
NPR/Robert Wood Johnson Foundation/Harvard T.H. Chan School of Public Health Survey – What Shapes Health 27
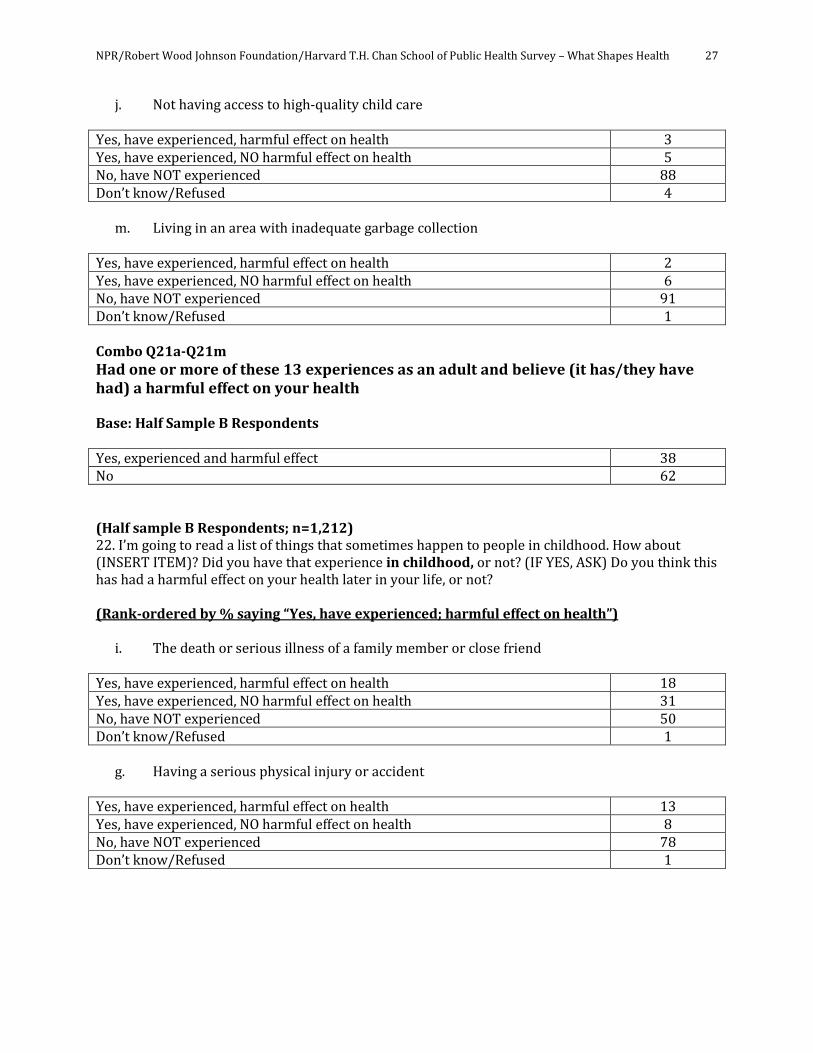
j. Not having access to high-quality child care Yes, have experienced, harmful effect on health 3 Yes, have experienced, NO harmful effect on health 5 No, have NOT experienced 88 Don’t know/Refused 4 m. Living in an area with inadequate garbage collection Yes, have experienced, harmful effect on health 2 Yes, have experienced, NO harmful effect on health 6 No, have NOT experienced 91 Don’t know/Refused 1 Combo Q21a-Q21m
Had one or more of these 13 experiences as an adult and believe (it has/they have had) a harmful effect on your health Base: Half Sample B Respondents Yes, experienced and harmful effect 38 No 62 (Half sample B Respondents; n=1,212) 22. I’m going to read a list of things that sometimes happen to people in childhood. How about (INSERT ITEM)? Did you have that experience in childhood, or not? (IF YES, ASK) Do you think this has had a harmful effect on your health later in your life, or not? (Rank-ordered by % saying “Yes, have experienced; harmful effect on health”) i. The death or serious illness of a family member or close friend Yes, have experienced, harmful effect on health 18 Yes, have experienced, NO harmful effect on health 31 No, have NOT experienced 50 Don’t know/Refused 1 g. Having a serious physical injury or accident Yes, have experienced, harmful effect on health 13 Yes, have experienced, NO harmful effect on health 8 No, have NOT experienced 78 Don’t know/Refused 1
NPR/Robert Wood Johnson Foundation/Harvard T.H. Chan School of Public Health Survey – What Shapes Health 28
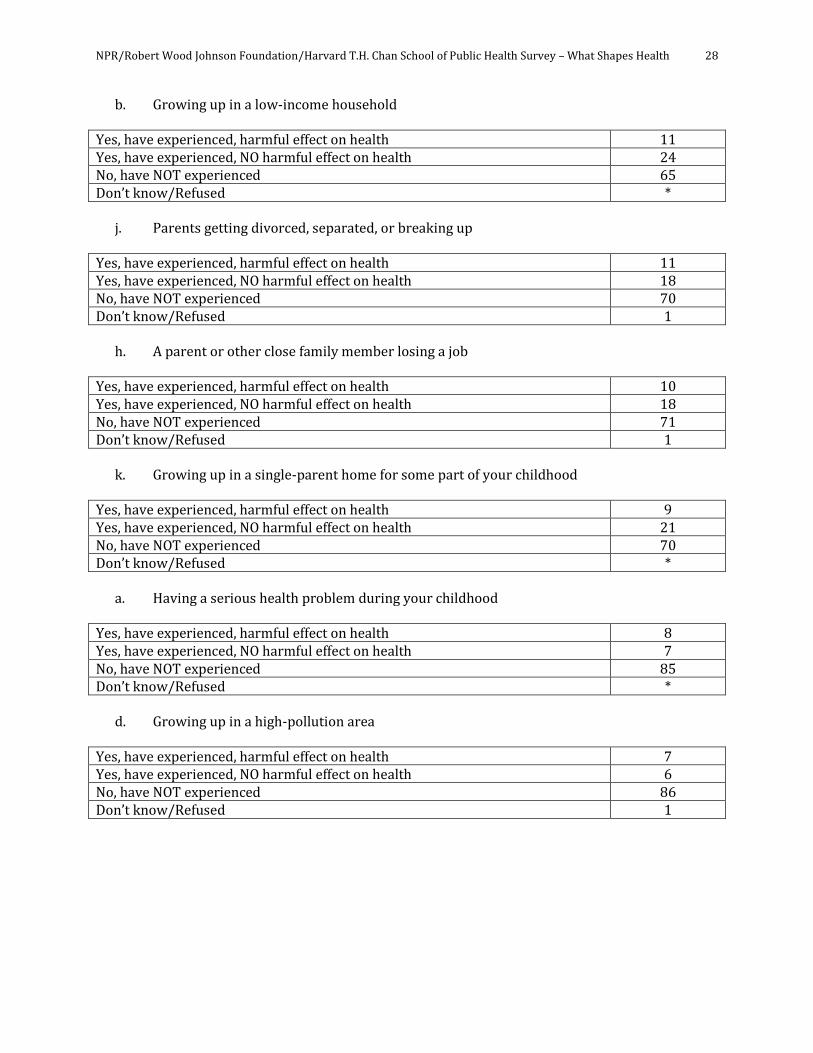
b. Growing up in a low-income household Yes, have experienced, harmful effect on health 11 Yes, have experienced, NO harmful effect on health 24 No, have NOT experienced 65 Don’t know/Refused * j. Parents getting divorced, separated, or breaking up Yes, have experienced, harmful effect on health 11 Yes, have experienced, NO harmful effect on health 18 No, have NOT experienced 70 Don’t know/Refused 1 h. A parent or other close family member losing a job Yes, have experienced, harmful effect on health 10 Yes, have experienced, NO harmful effect on health 18 No, have NOT experienced 71 Don’t know/Refused 1 k. Growing up in a single-parent home for some part of your childhood Yes, have experienced, harmful effect on health 9 Yes, have experienced, NO harmful effect on health 21 No, have NOT experienced 70 Don’t know/Refused * a. Having a serious health problem during your childhood Yes, have experienced, harmful effect on health 8 Yes, have experienced, NO harmful effect on health 7 No, have NOT experienced 85 Don’t know/Refused * d. Growing up in a high-pollution area Yes, have experienced, harmful effect on health 7 Yes, have experienced, NO harmful effect on health 6 No, have NOT experienced 86 Don’t know/Refused 1

NPR/Robert Wood Johnson Foundation/Harvard T.H. Chan School of Public Health Survey – What Shapes Health 29
c. Growing up in a high-crime area Yes, have experienced, harmful effect on health 6 Yes, have experienced, NO harmful effect on health 9 No, have NOT experienced 84 Don’t know/Refused 1 e. Growing up in bad housing Yes, have experienced, harmful effect on health 6 Yes, have experienced, NO harmful effect on health 7 No, have NOT experienced 87 Don’t know/Refused * f. Going to poor-quality schools Yes, have experienced, harmful effect on health 6 Yes, have experienced, NO harmful effect on health 8 No, have NOT experienced 85 Don’t know/Refused 1 Combo Q22a-Q22k Had one or more of these 11 experiences in childhood and believe it/they had a harmful effect on your future health Base: Half Sample B Respondents Yes, experienced as child and harmful effect 39 No 61 Combo Q21a-Q21m/Q22a-Q22k Had one or more of these 24 experiences as an adult or child adult and believe it/they had a harmful effect on your health Base: Half Sample B Respondents Yes, experienced as adult or child and harmful effect 52 No 48

NPR/Robert Wood Johnson Foundation/Harvard T.H. Chan School of Public Health Survey – What Shapes Health 30
VII. HEALTH DEMOGRAPHICS 23. At any time in the past 12 months, did you receive health care from a doctor or some other health professional, or not? Yes 76 No 24 Don’t know/Refused * 24. At any time in the past 12 months, did you have a problem getting health care you needed, or not? (IF YES ASK) Was that for a serious health problem, or for a health problem that was not serious? Yes, had a problem getting health care 10
Yes, for a serious health problem 6 Yes, for a problem that was not serious 4
No 89 Don’t know/Refused 1 25. Think of your parents when they were your age. Would you say you are in better health than they were, in worse health than they were, or about the same? Better 42 Worse 9 Stayed about the same 45 Parents were deceased before respondent’s age/didn’t know parents (vol) 1 Depends which parent 1 Don’t know/Refused 2 26. In the past five years, have you had a serious illness, medical condition, injury, or disability that has required a lot of health care, or not? Yes 29 No 71 Don’t know/Refused *

NPR/Robert Wood Johnson Foundation/Harvard T.H. Chan School of Public Health Survey – What Shapes Health 31
27. In the past five years, has a close family member had a serious illness, medical condition, injury, or disability that has required a lot of health care, or not? Yes 54 No 45 Don’t know/Refused 1 28. Has a doctor or other health professional ever told you that you have a chronic or long-term illness or condition, such as heart disease, lung disease, cancer, diabetes, high blood pressure, asthma or a mental health condition, or haven’t they? Yes 38 No 62 Don’t know/Refused * 29. How often do you exercise or participate in vigorous physical activity—every day, a few times a week, a few times a month, or less frequently than that? Every day 29 A few times a week 45 A few times a month 13 Less frequently than that 13 Don’t know/Refused * 30. How would you describe your weight? Would you say you are very underweight, a little underweight, about the right weight, a little overweight, or very overweight? Very underweight 1 A little underweight 7 About the right weight 45 A little overweight 39 Very overweight 7 Don’t know/Refused 1 31. Are you a current smoker, former smoker or have you never smoked? Current smoker 15 Former smoker 28 Never smoked 56 Don’t know/Refused 1
NPR/Robert Wood Johnson Foundation/Harvard T.H. Chan School of Public Health Survey – What Shapes Health 32
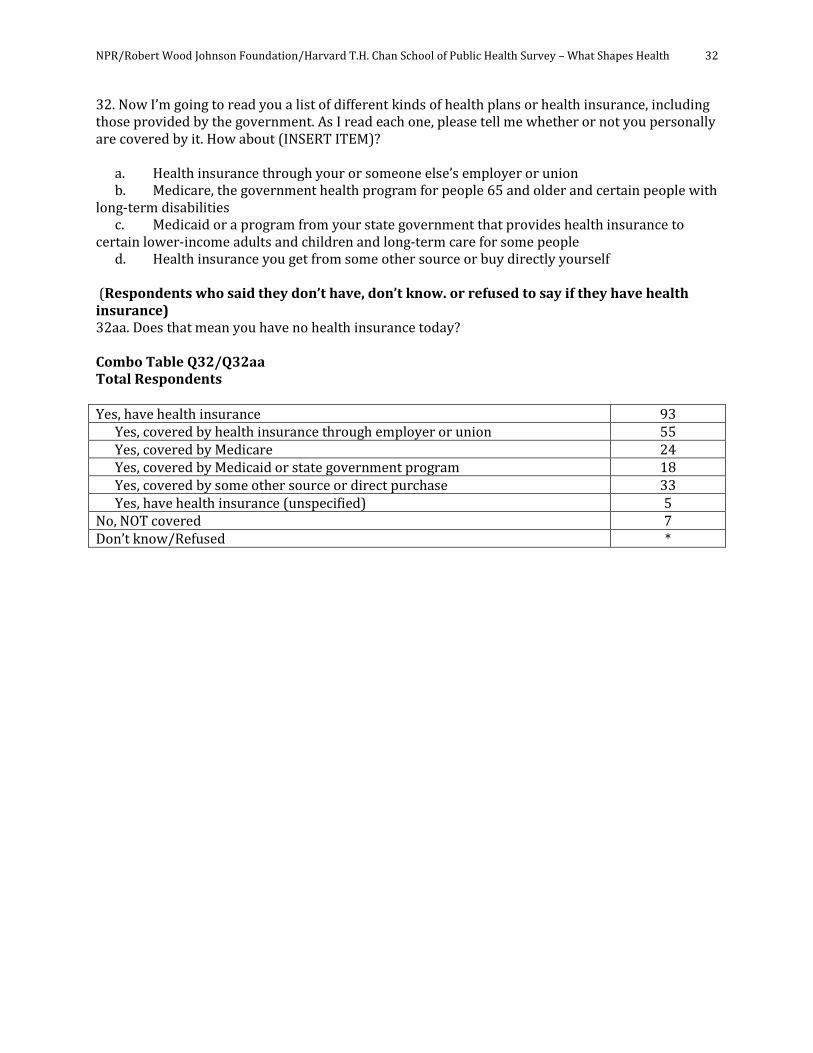
32. Now I’m going to read you a list of different kinds of health plans or health insurance, including those provided by the government. As I read each one, please tell me whether or not you personally are covered by it. How about (INSERT ITEM)? a. Health insurance through your or someone else’s employer or union b. Medicare, the government health program for people 65 and older and certain people with long-term disabilities c. Medicaid or a program from your state government that provides health insurance to certain lower-income adults and children and long-term care for some people d. Health insurance you get from some other source or buy directly yourself (Respondents who said they don’t have, don’t know. or refused to say if they have health insurance) 32aa. Does that mean you have no health insurance today? Combo Table Q32/Q32aa Total Respondents Yes, have health insurance 93
Yes, covered by health insurance through employer or union 55 Yes, covered by Medicare 24 Yes, covered by Medicaid or state government program 18 Yes, covered by some other source or direct purchase 33 Yes, have health insurance (unspecified) 5
No, NOT covered 7 Don’t know/Refused *

NPR/Robert Wood Johnson Foundation/Harvard T.H. Chan School of Public Health Survey – What Shapes Health 33
VIII. DEMOGRAPHICS 33. In politics, as of today, do you consider yourself a Republican, a Democrat, or an Independent? Republican 21 Democrat 29 Independent 39 Don’t know/Refused 11 (Respondents who are Independent) 34. As of today, do you lean more to the (Democratic Party) or the (Republican Party)? Combo Table Q33/Q34 Total Respondents Republican (incl leaners) 33 Democrat (incl leaners) 43 Independent 13 Don’t know/Refused 11 35. How important is religion or spirituality in your life—the most important thing, very important, somewhat important, not too important, or not at all important? Most important 22 Very important 36 Somewhat important 21 Not too important 10 Not at all important 9 Don’t know/Refused 2
NPR/Robert Wood Johnson Foundation/Harvard T.H. Chan School of Public Health Survey – What Shapes Health 34
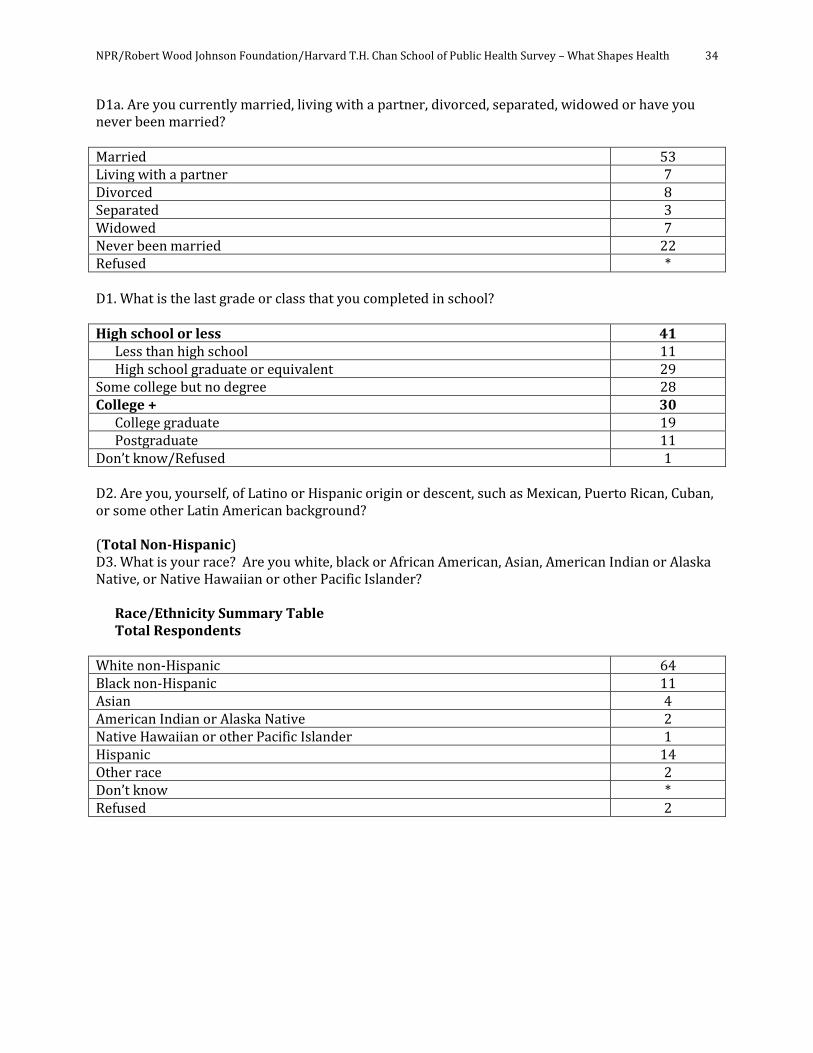
D1a. Are you currently married, living with a partner, divorced, separated, widowed or have you never been married? Married 53 Living with a partner 7 Divorced 8 Separated 3 Widowed 7 Never been married 22 Refused * D1. What is the last grade or class that you completed in school? High school or less 41
Less than high school 11 High school graduate or equivalent 29
Some college but no degree 28 College + 30
College graduate 19 Postgraduate 11
Don’t know/Refused 1 D2. Are you, yourself, of Latino or Hispanic origin or descent, such as Mexican, Puerto Rican, Cuban, or some other Latin American background? (Total Non-Hispanic) D3. What is your race? Are you white, black or African American, Asian, American Indian or Alaska Native, or Native Hawaiian or other Pacific Islander?
Race/Ethnicity Summary Table Total Respondents
White non-Hispanic 64 Black non-Hispanic 11 Asian 4 American Indian or Alaska Native 2 Native Hawaiian or other Pacific Islander 1 Hispanic 14 Other race 2 Don’t know * Refused 2

NPR/Robert Wood Johnson Foundation/Harvard T.H. Chan School of Public Health Survey – What Shapes Health 35
(Total landline Respondents; n=1,147) L1. Now thinking about your telephone use…Does anyone in your household, including yourself, have a working cell phone? (Total cell phone Respondents; n=1,276) C1. Now thinking about your telephone use, is there at least one telephone INSIDE your home that is currently working and is not a cell phone? L1/C1. Combo Table Total Respondents Landline only 7 Both LL and Cell 54 Cell phone only 39 D23a. Is your total annual household income from all sources, and before taxes: D23b. Is your total annual household income from all sources and before taxes less than $50,000, $50,000 but less than $100,000, or over $100,000? D23c. Is that 100 but less than 150 thousand, 150 but less than 200 thousand, 200 but less than 250 thousand, or 250 thousand and over?
Less than $50,000 47 Less than $15,000 13 $15,000 but less than $25,000 10 $25,000 but less than $30,000 7 $30,000 but less than $40,000 8 $40,000 but less than $50,000 7 Less than $50,000 (unspecified) 2
$50,000 but less than $100,000 24 $50,000 but less than $100,000 (unspecified) 13 $50,000 but less than $75,000 10 $75,000 but less than $100,000 1
$100,000 and over 16 $100,000 and over (unspecified) 8 $100,000 but less than $150,000 4 $150,000 but less than $200,000 2 $200,000 but less than $250,000 2 $250,000 and over *
Don’t know/Refused 4 Refused 8
Male 49 Female 51