nsw demand response
TRANSCRIPT

NSW Demand Response ARENA Knowledge Sharing Report November 2020

AGL NSW Demand Response ARENA Knowledge Sharing Report November 2020 2
Table of Contents 1. Executive Summary 3
2. Commercial and Industrial DR 4
2.1. 2019-20 Program Overview 4
2.2. Portfolio 4
2.3. Technology 5
2.4. Tests 7
2.5. Dispatch Events 9

AGL NSW Demand Response ARENA Knowledge Sharing Report November 2020 3
1. Executive Summary This is the third knowledge sharing report for the NSW Demand Response Project being conducted by
AGL. This activity received funding from ARENA as part of ARENA’s Advancing Renewables Programme –
Demand Response, and from the NSW Government.
The first year of the project was detailed in AGL’s ARENA Knowledge Sharing Report September
2018,and the second year in AGL’s ARENA Knowledge Sharing Report October 2019, both published by
ARENA at https://arena.gov.au/projects/agl-demand-response/.
This knowledge sharing report covers the period June 2019 to May 2020 and covers the performance of
the Commercial and Industrial (C&I) portfolio over that period.
Details of the third year of the residential demand response component of the project will be covered
in the final Knowledge Sharing Report to be published by AGL in 2021. The final report will also
summarise the full three years of the project and draw conclusions from the experience gained.
During the period covered by this report there were two tests of the C&I portfolio and two event
dispatches.
Both tests successfully demonstrated over 20MW of demand response.
The event dispatches occurred in January 2020 during the NSW bushfire crisis. At the time, several of
the portfolio participants were involved in emergency response activities related to the bushfires and
were not available for demand response. AGL’s declared availability to AEMO for this period was
correspondingly reduced. Even so, the demand response provided in the first event was lower than the
declared amount. This experience highlighted the potential risk of underperformance during
emergency conditions in demand response portfolios that contain a significant percentage of critical
infrastructure loads such as water utilities and telecommunications providers.
This Project received funding from ARENA as part of ARENA's Advancing Renewables Programme - Demand
Response and from the New South Wales Government.
The views expressed herein are not necessarily the views of the Australian Government, and the Australian
Government does not accept responsibility for any information or advice contained herein.

AGL NSW Demand Response ARENA Knowledge Sharing Report November 2020 4
2. Commercial and Industrial DR 2.1. 2019-20 Program Overview
Details of the 2017-18 and 2018-19 years of the C&I demand response program were covered in AGL’s
first and second Knowledge Sharing reports to be found at https://arena.gov.au/projects/agl-demand-
response/ .
The process used in the 2019-20 summer period was unchanged from the first and second year.
Broadly speaking, the process is:
• A database is maintained of participant contacts – as many contacts as each participant wants to
have informed of DR events.
• A “pre-notice” SMS and email is sent to the participants contacts either the afternoon before or the
morning of a possible event. The pre-notice gives the likely start time and duration of the event but
is not an instruction to activate.
• An “activation” SMS and email is sent to the participant contacts one hour before an event is to
start. The activation message gives the confirmed start time and duration of the event.
• An “end of event” SMS and email is sent at the conclusion of the event.
• A “cancellation” SMS and email may be sent if an event is cancelled at any stage.
At the time of writing this report, there were exactly 100 contacts in our database for the ARENA NSW
RERT project across 11 participant companies and 44 sites.
The messaging system used by AGL requires some manual work to execute an event. Although it can
send both SMSs and emails simultaneously, event communications must be sent by an operator in real
time and cannot be pre-organised.
That said, the system has generally worked well throughout the program and it takes only a few
minutes to execute the messaging part of an event from any AGL laptop, either in the office or from a
remote location. (The current system was not designed to allow event execution from a mobile device.)
It is also true to say that demand response event execution is unlikely to ever be a fully automatic
process, as telephone conversations with event participants are common and quite necessary in some
cases to ensure an adequate flow of information about the event and deal with any problems as they
arise.
2.2. Portfolio
The category of companies and sites participating in the third year of the program were:
Data centres – 2 companies, 2 sites
Telecommunications – 1 company, 5 sites

AGL NSW Demand Response ARENA Knowledge Sharing Report November 2020 5
Shopping centres – 1 company, 10 sites
Manufacturing plants – 2 companies, 3 sites
Recycling plants – 1 company, 2 sites
Water utility pumping stations and treatment plants – 4 companies, 13 sites
University campus – 1 site
The portfolio has stayed relatively stable over the reporting period. One company with two
manufacturing sites was added to the portfolio in June 2019. One water utility ceased participating in
the program in December 2019 as it churned to a different retailer (and is not included in the above
figures). The net result of these two changes on the MW capacity of the portfolio was approximately
zero.
2.3. Technology
In our previous knowledge sharing reports, AGL detailed the issues encountered in installing DR-
specific site monitoring equipment for the purpose of monitoring load in near-real time on DR sites.
These issues included:
• Customer resistance to hardware installation or SCADA integration due to a perceived cybersecurity
risk.
• Customer reluctance to provide site technical resources to assist with solution implementation
(generally perceived as a distraction to normal operations).
• The distributed nature of some sites – many metering points across a geographically dispersed
area – made it uneconomic to install hardware.
• The cost of hardware and installation being not economic for many smaller sites (ie the cost is
higher than the DR benefit that the site delivers to the program).
By the time of our October 2019 report, AGL had ceased rolling out the hardware-based monitoring
solution. Since then, the supplier of that system has made it obsolete. The small number of DR
monitoring boxes that AGL had installed in the field have now been de-commissioned, and removed
where it was practical to do so.
At the time of the last report, AGL had begun trialling the use of near real-time meter data delivered via
an API from Meter Data Providers as an alternative to using separate bespoke DR monitoring solutions.
The meter data API solution has the potential to greatly simplify the installation of site monitoring and
significantly reduce the cost, as it uses equipment and comms channels that already exist for market
metering purposes. Although, in some cases, a meter change may be required if the existing meter is
an older model, the cost to do this is relatively low, Meter Providers have an established workforce able
to do this across the NEM, and there is no need for any work to take place on site beyond the meter
panel – something we have found to be a significant barrier to the successful completion of installation
work on many sites due to site complexity and the necessity for the detailed involvement of site
technical resources.
AGL NSW Demand Response ARENA Knowledge Sharing Report November 2020 6
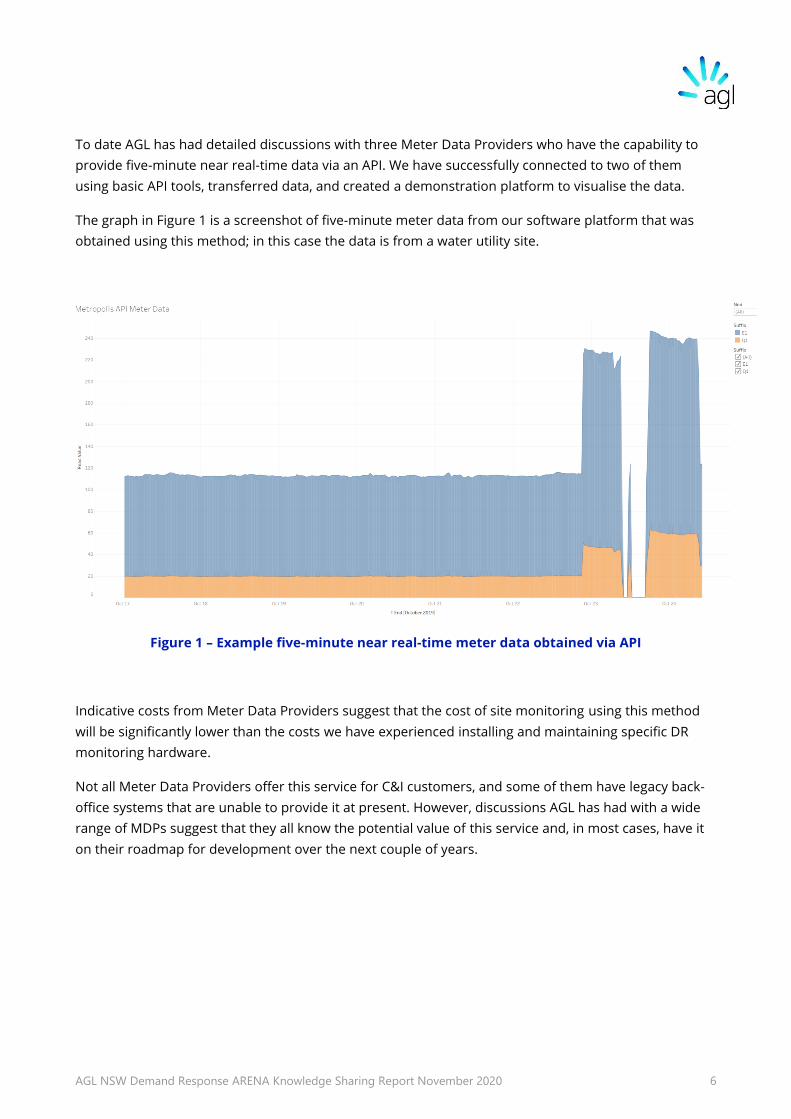
To date AGL has had detailed discussions with three Meter Data Providers who have the capability to
provide five-minute near real-time data via an API. We have successfully connected to two of them
using basic API tools, transferred data, and created a demonstration platform to visualise the data.
The graph in Figure 1 is a screenshot of five-minute meter data from our software platform that was
obtained using this method; in this case the data is from a water utility site.
Figure 1 – Example five-minute near real-time meter data obtained via API
Indicative costs from Meter Data Providers suggest that the cost of site monitoring using this method
will be significantly lower than the costs we have experienced installing and maintaining specific DR
monitoring hardware.
Not all Meter Data Providers offer this service for C&I customers, and some of them have legacy back-
office systems that are unable to provide it at present. However, discussions AGL has had with a wide
range of MDPs suggest that they all know the potential value of this service and, in most cases, have it
on their roadmap for development over the next couple of years.

AGL NSW Demand Response ARENA Knowledge Sharing Report November 2020 7
2.4. Tests
During the period covered by this report there were two AEMO initiated tests of the portfolio, on
30 May 2019 and 4 December 2019.
30 May 2019
AEMO called a test of the portfolio on 30 May 2019 for the period 14:00 to 16:00 NEM time. Availability
was declared at 17MW for this test in the AEMO markets portal.
The Sydney maximum temperature was a mild 21 degrees, with a similar temperature at Penrith.
Results for the test are shown in Figure 2.
MWh Average MW Interval 1
MW
Interval 2
MW
Interval 3
MW
Interval 4
MW
Portfolio 42.37 21.19 21.49 21.67 21.19 20.39
Figure 2 – Results of AEMO test 30 May 2019
This was a successful test with around 21 MW delivered, and there were no notable deviations from
expected performance in the portfolio.
-
5,000
10,000
15,000
20,000
25,000
30,000
35,000
40,000
kW
De
ma
nd
Interval End Time
Baseline Adjusted Baseline Actual Load

AGL NSW Demand Response ARENA Knowledge Sharing Report November 2020 8
4 December 2019
AEMO called a test of the portfolio on 4 December 2019 for the period 14:00 to 16:00 NEM time.
Availability was declared at 20MW in the AEMO portal at the time of this test.
The Sydney maximum temperature on the day was 30.9 degrees, with 34.1 degrees in Penrith.
Results for this test are shown in Figure 3.
MWh Average MW Interval 1
MW
Interval 2
MW
Interval 3
MW
Interval 4
MW
Portfolio 44.25 22.12 21.76 22.23 22.38 22.13
Figure 3 – Results of AEMO test 4 December 2019
This was again a successful test with around 22MW delivered and no notable variances from
expectation in terms of participant performance.
-
5,000
10,000
15,000
20,000
25,000
30,000
35,000
40,000
kW
De
ma
nd
Interval End Time
Adjusted Baseline Baseline Actual Load
AGL NSW Demand Response ARENA Knowledge Sharing Report November 2020 9
2.5. Dispatch Events
There were two activations of the AGL NSW RERT portfolio by AEMO during the reporting period, on 23
January 2020 and 31 January 2020.
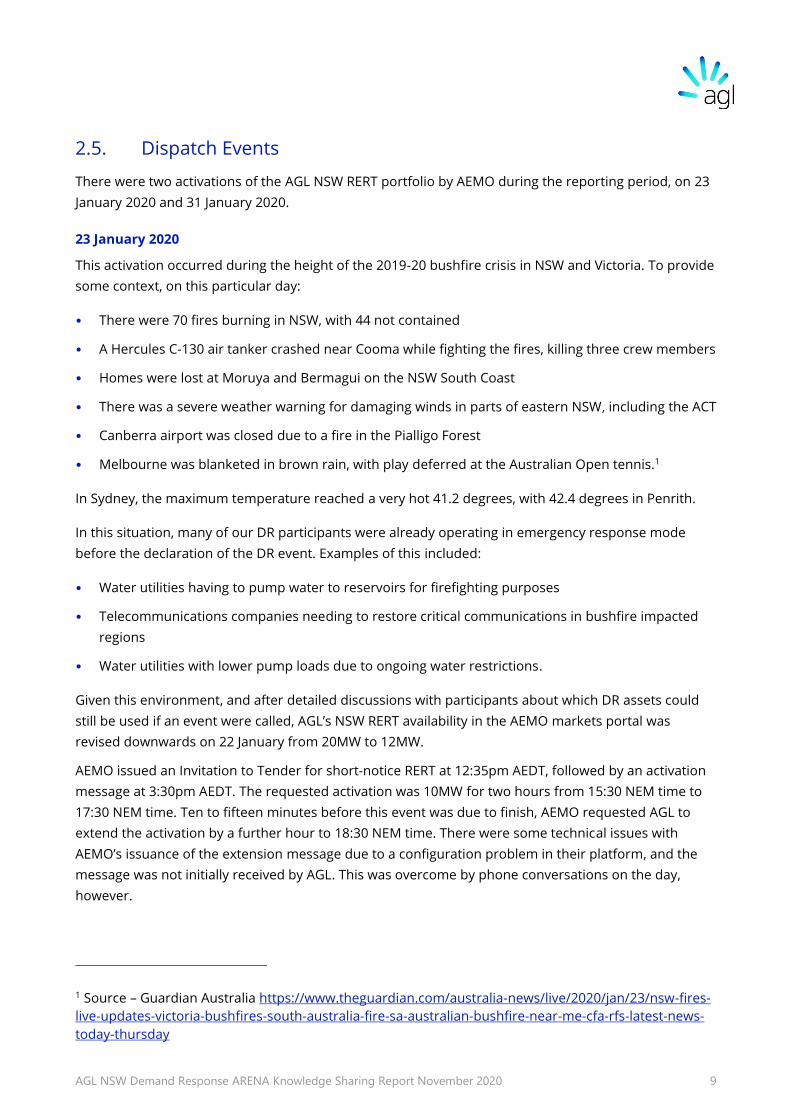
23 January 2020
This activation occurred during the height of the 2019-20 bushfire crisis in NSW and Victoria. To provide
some context, on this particular day:
• There were 70 fires burning in NSW, with 44 not contained
• A Hercules C-130 air tanker crashed near Cooma while fighting the fires, killing three crew members
• Homes were lost at Moruya and Bermagui on the NSW South Coast
• There was a severe weather warning for damaging winds in parts of eastern NSW, including the ACT
• Canberra airport was closed due to a fire in the Pialligo Forest
• Melbourne was blanketed in brown rain, with play deferred at the Australian Open tennis.1
In Sydney, the maximum temperature reached a very hot 41.2 degrees, with 42.4 degrees in Penrith.
In this situation, many of our DR participants were already operating in emergency response mode
before the declaration of the DR event. Examples of this included:
• Water utilities having to pump water to reservoirs for firefighting purposes
• Telecommunications companies needing to restore critical communications in bushfire impacted
regions
• Water utilities with lower pump loads due to ongoing water restrictions.
Given this environment, and after detailed discussions with participants about which DR assets could
still be used if an event were called, AGL’s NSW RERT availability in the AEMO markets portal was
revised downwards on 22 January from 20MW to 12MW.
AEMO issued an Invitation to Tender for short-notice RERT at 12:35pm AEDT, followed by an activation
message at 3:30pm AEDT. The requested activation was 10MW for two hours from 15:30 NEM time to
17:30 NEM time. Ten to fifteen minutes before this event was due to finish, AEMO requested AGL to
extend the activation by a further hour to 18:30 NEM time. There were some technical issues with
AEMO’s issuance of the extension message due to a configuration problem in their platform, and the
message was not initially received by AGL. This was overcome by phone conversations on the day,
however.
1 Source – Guardian Australia https://www.theguardian.com/australia-news/live/2020/jan/23/nsw-fires-
live-updates-victoria-bushfires-south-australia-fire-sa-australian-bushfire-near-me-cfa-rfs-latest-news-
today-thursday

AGL NSW Demand Response ARENA Knowledge Sharing Report November 2020 10
When the initial activation message was issued to participants, there were a several negative replies
due to the emergency response environment already active on the day. These included:
• A telecommunications company that had received an instruction from NSW Emergency Services
prohibiting the use of backup diesel generators except in cases where grid power was down. This
prohibition covered both urban and rural sites and prevented backup generators being used for
RERT.
• A water utility that had just been given permission to pump water from local catchments to
townships that were in crisis due to water restrictions and had to take advantage of that pumping
time.
• A water utility that had already curtailed load as it had received an earlier instruction to do so
directly from the NSW Government, bypassing AEMO. AEMO was unaware that this instruction had
been issued.
• Some shopping centres declined to participate due to air quality issues from bushfire smoke.
Analysis of the event afterwards showed the expected underperformance from these loads. In the case
of the shopping centres, this was also exacerbated by the long three-hour event in heat-wave
conditions, and the fact that the event occurred on a Thursday evening, with a previously identified
baseline problem emerging whereby shopping centres are penalised due to different closing times on
different days of the week. There were also questions about whether the event messaging SMSs had
been received at all the sites, possibly because of issues in the SMS network caused by the bushfire
emergency. The shopping centre portfolio actually contributed a significant negative DR result during
this event, which worsened as the event went on.
As has been previously identified, a shopping centre that closes around 5:30pm on Monday, Tuesday
and Wednesday will baseline poorly under the AEMO RERT baseline for an event on Thursday evening
when it closes much later, despite clearly shedding load during the event. Likewise, on a one-off
extremely hot day, the significantly increased underlying load from the shopping centre air
conditioners later in the day may not be reflected correctly in the same-day adjustment in the baseline
calculation, causing an under-measurement of demand response. These adverse baseline effects have
been described in more detail in AGL’s earlier NSW Demand Response Knowledge Sharing reports.
Results for the event are shown in Figure 4.

AGL NSW Demand Response ARENA Knowledge Sharing Report November 2020 11
MWh Average
MW
Interval 1
MW
Interval 2
MW
Interval 3
MW
Interval 4
MW
Interval 5
MW
Interval 6
MW
Portfolio 13.14 4.38 8.99 6.41 4.94 3.41 1.72 0.82
Figure 4 – Results of dispatch event 23 January 2020
Whilst the results show what was no doubt a useful demand reduction on the day, it was well below the
expected performance of this portfolio under non-emergency conditions and it fades significantly
towards the end of the event, mostly because of the shopping centres.
The result for the shopping centre component of the portfolio is shown in Figure 5. Other than the first
interval, the contributed DR was negative throughout the event, worsening to a maximum of -5.5MW as
the event continued.
-
5,000
10,000
15,000
20,000
25,000
30,000
35,000
kW
De
ma
nd
Interval End Time
Adjusted Baseline Baseline Actual Load

AGL NSW Demand Response ARENA Knowledge Sharing Report November 2020 12
MWh Average
MW
Interval 1
MW
Interval 2
MW
Interval 3
MW
Interval 4
MW
Interval 5
MW
Interval 6
MW
Shopping
Centres
-9.57 -3.19 0.66 -1.61 -3.07 -4.27 -5.33 -5.53
Figure 5 – Negative result for shopping centre portfolio 23 January 2020
Following this event, and after analysing the results and speaking further with participants, AGL further
adjusted its NSW RERT availability to 10MW in the AEMO portal.
31 January 2020
On 31 January 2020, destructive winds destroyed or severely damaged seven transmission towers on
the Victoria – South Australia interconnector, separating the Victorian and South Australian power
networks, islanding the Mortlake Power Station and Macarthur Wind Farm, and tripping the Portland
Smelter. This resulted in a LOR2 lack-of-reserve condition in Victoria from 15:00 to 18:00 NEM time, plus
frequency stability issues and other consequent problems across the NEM.2
2 AEMO Final Report – Victoria and South Australia Separation Event on 31 January 2020
https://aemo.com.au/-
/media/files/electricity/nem/market_notices_and_events/power_system_incident_reports/2020/final-
report-vic-sa-separation-31-jan--2020.pdf?la=en
-
2,000
4,000
6,000
8,000
10,000
12,000
kW
De
ma
nd
Interval End Time
Adjusted Baseline Baseline Actual Load

AGL NSW Demand Response ARENA Knowledge Sharing Report November 2020 13
In moving to stabilise the Victoria/NSW/Qld part of the grid following this incident, AEMO issued an ITT
for AGL’s NSW RERT portfolio at 4:16pm AEDT, followed by an activation notice at 4:59pm AEDT. This
notice was for 10MW of load reduction for the period 17:00 to 21:00 NEM time. At 8:29pm AEDT the
event was shortened to finish at 19:30 NEM time, as AEMO judged that the reserve was no longer
necessary.
Sydney weather on 31 January was hot with a maximum of 32.4 degrees, with 41.2 degrees in Penrith.
The same emergency conditions that had been there for the 23 January event were still in place for this
event, including the constraints on pumping and backup generator operation, leaving the declared
10MW as the maximum possible demand response available from the portfolio. However, bushfire
conditions had abated slightly (54 fires burning with 28 not contained)3 and the weather was marginally
cooler along the coast. Accordingly, the result for this event was better and very close to the declared
availability of 10MW.
Results for this test are shown in Figure 6.
MWh Average
MW
Interval 1
MW
Interval 2
MW
Interval 3
MW
Interval 4
MW
Interval 5
MW
Portfolio 24.10 9.64 9.46 9.92 9.61 9.40 9.82
Figure 6 – Results of dispatch event 31 January 2020
3 Source – Guardian Australia https://www.theguardian.com/australia-news/live/2020/jan/31/canberra-
fires-live-updates-act-bushfires-nsw-australia-fire-near-me-heatwave-weather-forecast-latest-news
-
5,000
10,000
15,000
20,000
25,000
30,000
35,000
kW
De
ma
nd
Interval End Time
Adjusted Baseline Baseline Actual Load

AGL NSW Demand Response ARENA Knowledge Sharing Report November 2020 14
On 17 February 2020, after an easing of bushfire conditions and further analysis and discussion with
portfolio participants regarding asset availability, the availability of AGL’s NSW RERT portfolio was
returned to 20MW in the AEMO portal.