numbers, facts and trends shaping the...
TRANSCRIPT

FOR RELEASE OCT. 26, 2016
FOR MEDIA OR OTHER INQUIRIES:
Alan Cooperman, Director of Religion Research
Gregory A. Smith, Associate Director of Research
Anna Schiller, Communications Manager
202.419.4372
www.pewresearch.org
RECOMMENDED CITATION: Pew Research Center, Oct. 26, 2016, “One-in-Five U.S. Adults Were Raised in Interfaith Homes”
NUMBERS, FACTS AND TRENDS SHAPING THE WORLD

1
ONE-IN-FIVE U.S. ADULTS WERE RAISED IN INTERFAITH HOMES
www.pewresearch.org
About Pew Research Center
Pew Research Center is a nonpartisan fact tank that informs the public about the issues, attitudes
and trends shaping America and the world. It does not take policy positions. The Center conducts
public opinion polling, demographic research, content analysis and other data-driven social
science research. It studies U.S. politics and policy; journalism and media; internet, science and
technology; religion and public life; Hispanic trends; global attitudes and trends; and U.S. social
and demographic trends. All of the Center’s reports are available at www.pewresearch.org. Pew
Research Center is a subsidiary of The Pew Charitable Trusts, its primary funder. This report was
made possible by The Pew Charitable Trusts, which received support for the project from Lilly
Endowment Inc.
© Pew Research Center 2016

2
PEW RESEARCH CENTER
www.pewresearch.org
Table of Contents
Overview 3
1. Links between childhood religious upbringing and current religious identity 18
2. Religion in marriages and families 26
Acknowledgments 37
Methodology 38
Topline 42

3
ONE-IN-FIVE U.S. ADULTS WERE RAISED IN INTERFAITH HOMES
www.pewresearch.org
Roughly one-in-five U.S. adults
were raised with a mixed
religious background, according
to a new Pew Research Center
study. This includes about one-
in-ten who say they were raised
by two people, both of whom
were religiously affiliated but
with different religions, such as
a Protestant mother and a
Catholic father, or a Jewish
mother and a Protestant
stepfather. An additional 12%
say they were raised by one
person who was religiously
affiliated (e.g., with
Protestantism, Catholicism,
Judaism or another religion)
and another person who was
religiously unaffiliated (atheist,
agnostic or “nothing in
particular”).
To be sure, religiously mixed
backgrounds remain the
exception in America. Eight-in-
ten U.S. adults say they were raised within a single religion, including two-thirds who say they
were raised by two people who shared the same religion (or both of whom were religiously
unaffiliated) and an additional 14% who say they were raised by a single parent.

4
PEW RESEARCH CENTER
www.pewresearch.org
But the number of Americans
raised in interfaith homes
appears to be growing. Fully
one-quarter of young adults in
the Millennial generation
(27%) say they were raised in a
religiously mixed family.
Fewer Generation Xers (20%),
Baby Boomers (19%) and
adults from the Silent and
Greatest generations (13%) say
they were raised in such a
household.
The religious backgrounds of
young adults also stand out in
other ways. For example,
nearly one-quarter of
Millennials (24%) say they
were raised by at least one
parent who was a religious
“none,” including 15% who
were raised by one religiously
affiliated person and one
unaffiliated person; 6% who
say they were raised by two
parents, both of whom were
unaffiliated; and 3% who were
raised by a single parent who
was unaffiliated with any
religion. By contrast, only 11%
of adults in the Silent and Greatest generations say they had one or more religiously unaffiliated
parents.
In addition, only a quarter of Millennials (24%) say they were raised by two Protestant parents,
once the archetype of an American family. Twice as many adults in the Silent and Greatest
generations (48%) say they were raised by two Protestants.
Millennials more likely to have been raised in
households with mixed religious identities
Silent / Greatest
gen. (born
before 1946)
Baby Boomer
(b. 1946-1964)
Gen. X (b. 1965-
1980)
Millennial (b. 1981-
1996)
% % % %
Raised by two people w/different religions 13 19 20 27
Both religiously affiliated 6 9 8 12
One Protestant, one Catholic 5 6 6 7
Other combination 1 2 2 5
One religiously affiliated, one unaffiliated 8 11 12 15
One Protestant, one unaffiliated 5 8 7 8
One Catholic, one unaffiliated 2 3 3 5
One other religion, one unaffiliated 0 0 2 1
Raised in single religious background 87 81 80 73
By two parents 77 69 64 56
Both Protestant 48 40 30 24
Both Catholic 23 22 23 18
Both other religion 3 5 7 8
Both unaffiliated 3 3 5 6
By single parent 9 12 16 17
Who was Protestant 7 6 8 8
Who was Catholic 1 4 5 5
Who identified with other religion 1 0 1 1
Who was unaffiliated 1 1 2 3
100 100 100 100
Note: All results repercentaged to exclude nonresponse.
Source: 2014 Religious Landscape Study recontact survey conducted March 17-May 6,
2015.
“One-in-Five U.S. Adults Were Raised in Interfaith Homes”
PEW RESEARCH CENTER

5
ONE-IN-FIVE U.S. ADULTS WERE RAISED IN INTERFAITH HOMES
www.pewresearch.org
What is the impact of coming from a religiously mixed or matched background? Here, the survey
reveals several patterns:
Religious “nones”: Americans are most likely to identify in adulthood as religiously
unaffiliated if they were raised exclusively by a parent or parents who were unaffiliated
themselves. Indeed, among adults who say they were raised either by a single parent who had
no religion or by two people who were both religious “nones,” a solid majority (62%) identify
as “nones” today.
But there also are many “nones” who come from religiously mixed backgrounds. Nearly four-
in-ten of those who say they had one parent who identified with a religion and another parent
who was religiously unaffiliated describe themselves as “nones” today (38%). And one-quarter
of those raised by a Protestant and a Catholic are now religiously unaffiliated (26%). One-in-
five people who were raised exclusively by Catholics are religious “nones” today, as are 14% of
those who say they were raised solely by Protestants.

6
PEW RESEARCH CENTER
www.pewresearch.org
Catholics: Most people raised solely by Catholics (62%) continue to identify as Catholics in
adulthood, which is on par with the share of those raised solely by “nones” who remain
religiously unaffiliated today. But those raised by one Catholic parent and one non-Catholic
parent have less than a 50-50 chance of identifying with Catholicism as adults. Among U.S.
adults from a mixed Protestant/Catholic background, for example, just 29% identify as
Catholics today, while 38% are Protestants and 26% are “nones.” And among those with a joint
Catholic/religiously unaffiliated upbringing, 32% identify with Catholicism today, while 42%
are religious “nones” and 20% are Protestants.
Protestants: Eight-in-ten people raised exclusively within Protestantism continue to identify
as Protestants today. And 56% of those raised by a Protestant parent and a religiously
unaffiliated parent now identify as Protestants.
But many Americans who were raised by at least one Protestant have left the specific
denomination of their Protestant parent or parents. For example, just 24% of all people raised
by one Protestant and one religious “none” still identify with their Protestant parent’s
denominational family – e.g., as a Baptist if the parent was a Baptist.
(For more detail on how this study defines and analyzes religious mixing, including with
respect to Protestant denominational families, see sidebar on page 18.)

7
ONE-IN-FIVE U.S. ADULTS WERE RAISED IN INTERFAITH HOMES
www.pewresearch.org
Mother knows best: Most Americans who were raised by a biological or adoptive mother
and father say their parents played an equal role in their religious upbringing. But among the
roughly four-in-ten adults who say one of their parents (either biological or adoptive) was
“more” responsible for their religious upbringing, far more name their mother than their
father.
Moms seem to have been especially influential in the religious upbringing of people from
interfaith families. Nearly half (46%) of those raised by parents affiliated with two different
religions say their mother was primarily responsible for their religious upbringing, while just
7% say their father took primary responsibility; the rest say both parents played equally
important roles in their religious upbringing (41%) or give some other answer, such as that
they were not raised in any religion (3%). Among Americans who were raised by one
religiously affiliated parent and one “none,” nearly two-thirds (63%) say their mother was
mainly responsible for their religious upbringing as a child.

8
PEW RESEARCH CENTER
www.pewresearch.org
Perhaps as a result of the leading role mothers often play in the religious upbringing of their
children, adults from religiously mixed backgrounds are more likely to adopt their mother’s
faith than to follow in their father’s religious footsteps. Fully 48% of those whose parents had
different religious identities now identify with their mother’s religion, while 28% identify with
their father’s religion and 24% identify with neither. Among those from mixed religious
backgrounds who say their mother was mainly responsible for their religious upbringing,
roughly six-in-ten (59%) now identify with their mother’s faith.
These are among the latest findings from the Pew Research Center’s 2014 U.S. Religious
Landscape Study. The study and this report – the fifth in a series – were made possible by The Pew
Charitable Trusts, which received support for the project from Lilly Endowment Inc.
The first report on the Landscape Study, based on a telephone survey of more than 35,000 adults,
examined the changing religious composition of the U.S. public and documented the fluidity of
religion in the U.S., where roughly one-third of adults now have a religious identity different from
the one in which they say they were raised and where more than a quarter of those who are
married or living with a romantic partner are in religiously mixed relationships. The second report
described the religious beliefs, practices and experiences of Americans. A third report, which
focused on the degree to which religiously observant people live their day-to-day lives in a
distinctive manner, drew on the national telephone survey but was based primarily on a
supplemental survey among participants in Pew Research Center’s American Trends Panel, a
9
ONE-IN-FIVE U.S. ADULTS WERE RAISED IN INTERFAITH HOMES
www.pewresearch.org
nationally representative group of randomly selected U.S. adults surveyed online and by mail. The
fourth report, which drew on the national telephone survey but relied primarily on questions
asked in a follow-up (“recontact”) survey of 5,000 respondents who originally completed the
national telephone poll, continued to explore the fluidity and churn within American religion by
assessing how people choose new
congregations.
This report, like the fourth, relies in part
on results from the original telephone
survey but is based primarily on results
from the recontact survey. It examines
the mixing of religious faiths in U.S.
families as well as how the dynamics of
religion and family life in America are
different in religiously mixed
environments than in religiously
homogeneous situations.
A note on terminology
The survey included a few simple questions that asked
respondents about who raised them. The questions
were designed to obtain basic information as to
whether the respondent had been raised by a single
person or by multiple people and, in the case of those
raised by multiple people, to ascertain who those
people were (for example, biological parents, adoptive
parents, a biological parent and a stepparent,
grandparents or other relatives). Throughout this report,
the terms “parent” and “parents” are used as
shorthand to refer to the person or people who raised
the respondent, regardless of their biological
relationship to the respondent. A few of the analyses
reported here are based only on those raised by two
biological or adoptive parents, and they are clearly
labeled as such.
The study does not include detailed questions about
how respondents’ parents were related to each other. It
did not ask, for instance, whether they were ever
married. It did not ask if they divorced. It also did not
ask about the atmosphere and environment of the
respondent’s childhood home life. Of course, all of
these factors, and many more, may be important
determinants of religious outcomes. In short, the study
was limited in scope, designed to obtain baseline
information about the prevalence of mixing religions
and basic information about the religious dynamics of
religiously mixed households. It is not meant to be a
definitive guide as to what sorts of factors and child-
rearing practices produce particular kinds of religious
outcomes in adulthood.

10
PEW RESEARCH CENTER
www.pewresearch.org
Today, one-quarter of married
adults say their spouse does not
share their religion. Nearly one-
in-ten married adults (9%) are
religiously affiliated and say
their spouse identifies with a
different religion, while 15% are
in marriages pairing one
religiously affiliated spouse with
another who is religiously
unaffiliated.1
1 For a more comprehensive discussion of religious mixing in marriage and domestic partnerships, see Chapter 2 of "America's Changing
Religious Landscape." Note, however, that the analysis there employs a different definition of religious mixing and is based on both those who
are married and those who are currently living with a romantic partner. This report focuses only on those who are married.

11
ONE-IN-FIVE U.S. ADULTS WERE RAISED IN INTERFAITH HOMES
www.pewresearch.org
Adults who are currently in religiously mixed marriages are far less religious compared with
religiously affiliated adults married to a spouse of the same faith. Indeed, more than three-
quarters of religiously affiliated people who are married to spouses of the same religion (77%) are
highly religious, according to an index incorporating four common measures of religious
observance (frequency of worship attendance, frequency of prayer, belief in God and the self-
described importance of religion in one’s life).2 Meanwhile, only about half of religiously affiliated
people in mixed marriages exhibit high levels of religious commitment (including 54% of those
married to a spouse who has a different religion and 51% of those married to a religious “none”).3
Religious conversations also are more common among religiously affiliated spouses who share the
same faith than among those in religiously mixed marriages.
2 For full details on how the index is constructed, see "How religious is your state?" 3 The data cannot prove which direction the causal arrow points. Religious intermarriage may lead to decreased religiosity. Alternatively,
people who are not particularly religious to begin with may be more likely to marry a spouse with a different religion.
Religious intermarriage linked with lower rates of religious observance
Level of religious observance among those who are now married
Religious observance index
Respondent and spouse both
affiliated with same faith
Respondent religiously
affiliated, spouse also affiliated but with different faith
Respondent religiously affiliated,
spouse unaffiliated
Respondent religiously
unaffiliated, spouse affiliated
Respondent and spouse
both unaffiliated
% % % % %
High 77 54 51 13 9
Medium 19 34 35 29 24
Low 4 12 15 58 67
100 100 100 100 100
Respondent and spouse talk about religion …
A lot 36 20 11 8 7
Some 42 42 41 33 29
Not much/not at all 22 38 48 58 63
Don't know/refused <1 <1 <1 1 <1
100 100 100 100 100
Note: Figures for religious observance reflect scores on an index that combines four common measures of religious commitment – self-
assessment of religion’s importance in one’s life, frequency of worship attendance, frequency of prayer and belief in God. For complete details
on how the index was created, see http://www.pewresearch.org/fact-tank/2016/02/29/how-religious-is-your-state/.
Source: For religious observance figures, 2014 Religious Landscape Study, conducted June 4-Sept. 30, 2014. For figures about religious
conversation, 2014 Religious Landscape Study recontact survey conducted March 17-May 6, 2015.
“One-in-Five U.S. Adults Were Raised in Interfaith Homes”
PEW RESEARCH CENTER

12
PEW RESEARCH CENTER
www.pewresearch.org
Furthermore, the data show that adults in religiously mixed marriages who are currently raising
minor children are far less likely to participate in religious activities with their children, compared
with those married to spouses of the same religion. For example, more than three-quarters of
parents married to spouses of the same faith say they pray or read scripture with their children,
and seven-in-ten say they send their children to religious education programs, such as Sunday
school. Those in religiously mixed marriages are much less likely to do these things.
Similarly, when asked about the religious dynamics of their childhood, adults who were raised in
interfaith households say religion was a less prominent feature in their lives when they were
growing up, compared with those in religiously matched families. For example, among those
raised by religiously affiliated parents who shared the same faith, half (52%) say religion was very
important to their family when they were growing up; 43% say religion was very important to
them, personally, during their childhood; and 36% say their parents talked about religion “a lot”
when they were children. People raised in religiously mixed households – or exclusively by
religious “nones” – are considerably less likely to say religion was a salient feature of their
childhood in these ways.

13
ONE-IN-FIVE U.S. ADULTS WERE RAISED IN INTERFAITH HOMES
www.pewresearch.org
But while religion is a more salient feature of life in religiously matched families, the survey finds
few signs of widespread religious discord in mixed-faith families. Nearly three-quarters of those
raised by parents from different religious backgrounds say their parents disagreed little, if at all,
about religion. And most people who are in religiously mixed marriages today say it is uncommon
for them to have religious disagreements with their spouse.
Little sign of discord in mixed-faith families
When you were growing up, how much did your parents disagree about religion? (based on those raised by two people)
Raised with single, religiously affiliated
background
Raised with mixed background, both
parents affiliated but with different
religions
Raised with mixed background, one
religiously affiliated parent & one unaffiliated
Raised with single, religiously
unaffiliated background
% % % %
A lot 3 6 11 5
Some 8 15 13 8
Not much/not at all 85 73 73 82
Don't know/refused 3 6 3 6
100 100 100 100
How much do you and your spouse disagree about religion? (based on those who are currently married)
Respondent and spouse both
affiliated with same faith
Respondent religiously
affiliated, spouse also affiliated but w/different faith
Respondent religiously affiliated,
spouse unaffiliated
Respondent religiously
unaffiliated, spouse
affiliated
Respondent and spouse both unaffiliated
% % % % %
A lot 3 7 11 9 4
Some 16 21 25 19 10
Not much/not at all 81 71 62 72 87
Don't know/refused <1 1 2 1 0
100 100 100 100 100
Source: 2014 Religious Landscape Study recontact survey conducted March 17-May 6, 2015.
“One-in-Five U.S. Adults Were Raised in Interfaith Homes”
PEW RESEARCH CENTER

14
PEW RESEARCH CENTER
www.pewresearch.org
Sidebar: Religiously mixed marriages and contemporary child rearing
How are parents who are currently in religiously mixed
marriages raising their children? While this is an
enticing question, it is not an easy one to answer. The
answers given by survey respondents on this topic
often depend on which member of the family you ask.
For example, in religiously mixed marriages that
combine one religiously affiliated spouse and another
who is a religious “none,” the religiously affiliated half
of such pairings overwhelmingly say their child is being
raised in a religion (82%), while just 16% say their child
is being raised with no religion. By contrast, among the
religiously unaffiliated spouses in such relationships,
nearly four-in-ten say their child is being raised with no
religion.
This is not the only example in which perceptions about
religion and family life depend on the eye of the
beholder. The survey also shows, for example, that
wives are much more likely than husbands to say they
(wives) are primarily responsible for the religious
upbringing of their children. Indeed, when asked who is
more responsible for their children’s religious
upbringing, wives are more likely to say they are by a
15-to-1 margin (29% vs. 2%). Husbands are much
more evenly divided on this question; 15%
acknowledge that their wives take the lead in this
regard, but 9% say they themselves are most
responsible for their children’s religious upbringing.4
While this study would ideally delve more deeply into
the religious upbringing of current minor children (and
not just how current adults say they were raised as
children), these differing perspectives make that a
challenge.
Religion is not the only area where men and women have different perspectives about a variety of family
dynamics. For example, a previous Pew Research Center analysis shows that mothers in two-parent households
are more likely to say they do more at home and for their families (e.g., handling household chores, managing
children’s schedules, etc.) than fathers are to say their spouse or partner does more.
4 The survey did not ask married people whether their spouse is a man or a woman; this analysis assumes that male respondents are married
to female spouses and vice versa. While it is possible that some respondents are in same-sex marriages, these marriages are estimated to
make up a small percentage of all U.S. marriages and thus would likely have minimal effect on these figures.
Religion in marriage, child rearing – in
the eye of the beholder
Based on married parents/guardians of minor children
currently residing in respondent’s home
How is your child being raised?
Religiously affiliated
respondent married to
unaffiliated spouse
Religiously unaffiliated respondent married to affiliated spouse
% %
In a religion/more than one religion 82 58
In no religion 16 38
Other/don't know 1 4
100 100
Who is more responsible for religious upbringing of your child/children?
Husbands
Wives
% %
Wife 15 29
Husband 9 2
Both equally 75 68
Other/depends/don't know 1 1
100 100
Note: In this analysis, “parents” are those who say they are currently
the parent or guardian of a minor child residing in their household.
The survey did not ask married parents whether their spouse is the
parent/guardian of the child residing in their household. Thus,
readers should bear in mind that in some cases, the child’s other
parent is someone other than the respondent’s spouse.
Source: 2014 Religious Landscape Study recontact survey
conducted March 17-May 6, 2015.
“One-in-Five U.S. Adults Were Raised in Interfaith Homes”
PEW RESEARCH CENTER
15
ONE-IN-FIVE U.S. ADULTS WERE RAISED IN INTERFAITH HOMES
www.pewresearch.org
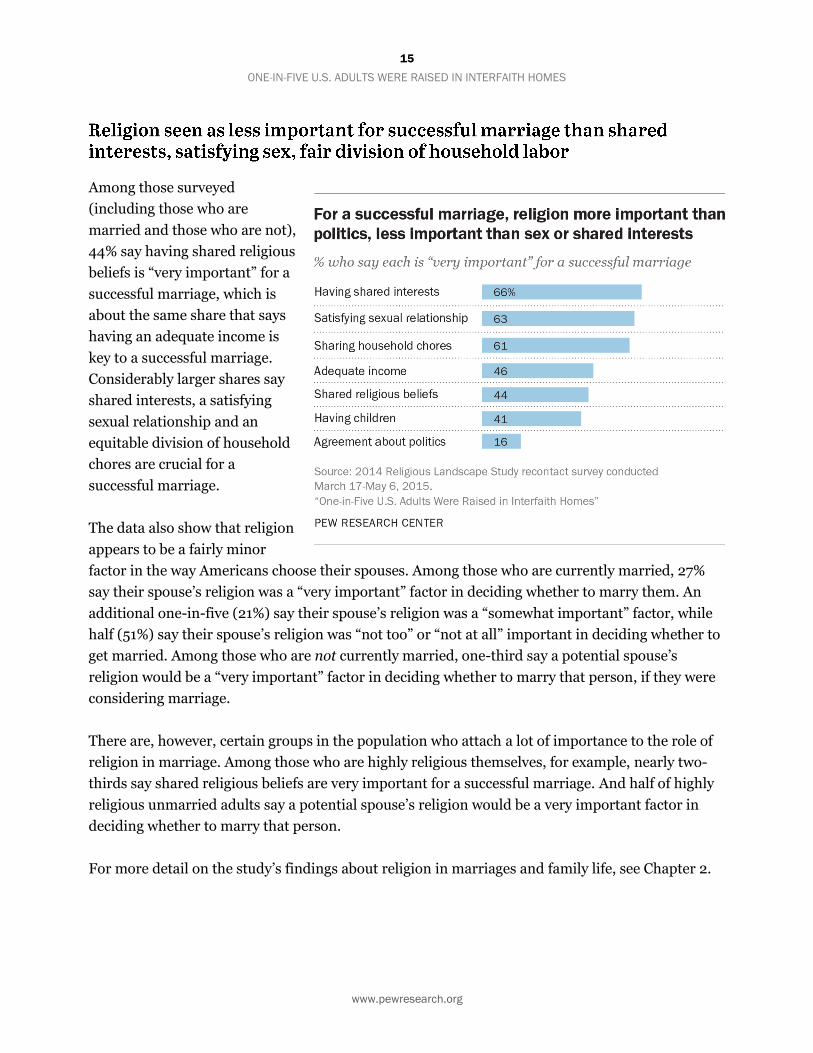
Among those surveyed
(including those who are
married and those who are not),
44% say having shared religious
beliefs is “very important” for a
successful marriage, which is
about the same share that says
having an adequate income is
key to a successful marriage.
Considerably larger shares say
shared interests, a satisfying
sexual relationship and an
equitable division of household
chores are crucial for a
successful marriage.
The data also show that religion
appears to be a fairly minor
factor in the way Americans choose their spouses. Among those who are currently married, 27%
say their spouse’s religion was a “very important” factor in deciding whether to marry them. An
additional one-in-five (21%) say their spouse’s religion was a “somewhat important” factor, while
half (51%) say their spouse’s religion was “not too” or “not at all” important in deciding whether to
get married. Among those who are not currently married, one-third say a potential spouse’s
religion would be a “very important” factor in deciding whether to marry that person, if they were
considering marriage.
There are, however, certain groups in the population who attach a lot of importance to the role of
religion in marriage. Among those who are highly religious themselves, for example, nearly two-
thirds say shared religious beliefs are very important for a successful marriage. And half of highly
religious unmarried adults say a potential spouse’s religion would be a very important factor in
deciding whether to marry that person.
For more detail on the study’s findings about religion in marriages and family life, see Chapter 2.

16
PEW RESEARCH CENTER
www.pewresearch.org
Other key findings from the survey include:
The vast majority of people raised by one
religiously affiliated parent and one
religious “none” say their mother identified
with a religion while their father was
religiously unaffiliated. Indeed, of all adults
raised by one religious “none” and one
religiously affiliated parent, just 17% say
their father was religiously affiliated and
their mother was religiously unaffiliated.
These findings are consistent with other
research showing that women are generally
more religious than men.
Two-thirds of Americans raised by one
religiously affiliated parent and one
religious “none” say their religiously
affiliated parent was most responsible for
their religious upbringing, while very few –
just 3% – say their religiously unaffiliated
parent took the lead. This is partly because
when one parent or another takes the lead
role in the religious upbringing of children,
the mother is named as the lead parent far
more often than the father. (For more
detail, see the discussion on page 7 above.)
Just as U.S. adults are far more likely to say
mothers rather than fathers took primary
responsibility for their religious upbringing,
wives are seen as somewhat more religious
than husbands. While most married people
say they and their spouse are about equally
religious, those who say one partner is more
religious than the other mostly say it is the
wife – not the husband – who is most religious in their marriage.
In religiously affiliated/unaffiliated
combinations, far more unaffiliated
were fathers than mothers
Based on those raised by one religiously affiliated parent
and one religious “none”
Religious affiliation of parents %
Mother affiliated, father unaffiliated 83
Mother Protestant 55
Mother Catholic 23
Mother other faith 6
Father affiliated, mother unaffiliated 17
Father Protestant 7
Father Catholic 7
Father other faith 3
100
Person mainly responsible for respondent’s religious upbringing was …
Religiously affiliated parent 66
Mother 62
Father 4
Religiously unaffiliated parent 3
Mother 2
Father 1
Both equally 22
Not raised in religion (VOL.) 9
Don’t know 1
100
Note: Findings about the religious affiliation of parents are based on
those raised by two biological parents, a biological parent and a
stepparent, or by adoptive parents. The findings about which parent
was mainly responsible for the respondent’s religious upbringing are
based on those raised by two biological or adoptive parents.
Source: 2014 Religious Landscape Study recontact survey
conducted March 17-May 6, 2015.
“One-in-Five U.S. Adults Were Raised in Interfaith Homes”
PEW RESEARCH CENTER

17
ONE-IN-FIVE U.S. ADULTS WERE RAISED IN INTERFAITH HOMES
www.pewresearch.org
Among adults who were raised in a single-religion household, those for whom religion was a
salient feature of their childhood (i.e., those who say their parents talked about religion and
that religion was important to them personally and to their families when growing up) are
most likely to identify with the religion of their parent or parents today.

18
PEW RESEARCH CENTER
www.pewresearch.org
A note on how the study defines religious mixing
There are many possible ways to define religiously mixed families. In this report, a religiously mixed couple consists
of either two people who have different religious identities (e.g., one identifies religiously as Jewish and the other
as Catholic) or one person who identifies with a religion (e.g., Protestantism, Islam, Buddhism or any other faith)
and another person who identifies as religiously unaffiliated (i.e., as atheist, agnostic or “nothing in particular”). For
married respondents, this report uses the term intermarried as a synonym for religiously mixed couples. Two
people who have the same religious identity are referred to as a religiously matched couple.
Pairings that combine people from different Protestant denominational families (e.g., a Methodist and a Lutheran,
or a Baptist and a nondenominational Protestant) are not treated as religiously mixed couples in this report. This
analytical decision has important consequences for the figures reported here. If couples pairing Protestants from
different denominational families were treated as religiously mixed, then the study’s estimate of the share of adults
with a religiously mixed upbringing would be significantly higher, since 6% of adults were raised by Protestants from
different denominational families.
The report uses this conservative approach to estimating religious mixing because the substantive importance of
intra-Protestant combinations is not always clear. Some may involve individuals from denominations with deep
historical, theological and cultural differences. In other cases, individuals from nominally distinct Protestant
denominations may have much in common, religiously.
If complete information about the exact denominational affiliation of respondents (and their parents and spouses)
always were available, it might be possible, theoretically, to classify some intra-Protestant pairings as highly or
“truly” mixed and others as not. But many Protestants are unable or unwilling to identify with a specific
denomination. For example, they may describe themselves as “just a Lutheran” rather than saying they belong to a
specific Lutheran denomination, such as the Lutheran Church-Missouri Synod (an evangelical Protestant
denomination) or the Evangelical Lutheran Church In America (a mainline Protestant denomination). Indeed, in the
Religious Landscape Study’s national telephone survey, more than one-third of Protestants offered this kind of
vague religious affiliation.
For all these reasons, in the absence of complete information about the denominational affiliation of all
respondents, this report errs on the side of adopting a conservative approach to estimating religious mixing by
treating Protestantism as a single religious category.
Respondents are defined as having been raised in a single religious background if they say they were raised either
by a single parent or by two people who had the same religious identity as each other, as described above.
Respondents raised in a mixed religious background are those who say they were raised by two people who did not
have the same religion as each other.

19
ONE-IN-FIVE U.S. ADULTS WERE RAISED IN INTERFAITH HOMES
www.pewresearch.org
1. Links between childhood religious upbringing and current
religious identity
People from mixed religious backgrounds take a variety of spiritual paths as adults, with many
adopting their mother’s religion as their own, some choosing to identify with their father’s faith,
and still others opting for neither. Indeed, the survey makes clear that many Americans – even
among those raised in a single religion – ultimately adopt a religious identity that is completely
different than the faith of their parents.
But one pattern regarding the passing on of religious identity from one generation to the next is
clear: Among those who were raised in a single religious background (especially within
Protestantism), the family’s religious commitment is closely linked with retaining one’s religion
into adulthood. Those adults who say religion was very important to their family while growing up
and whose parents frequently discussed religion are more likely than others to continue to identify
with their parents’ religion as adults.
The remainder of this chapter provides additional detail on the current religious identity of people
raised in a variety of religious backgrounds, and explores the likelihood of carrying one’s parents’
religion into adulthood.

20
PEW RESEARCH CENTER
www.pewresearch.org
Among those who say they were raised exclusively by Protestants, roughly eight-in-ten now
identify with Protestantism, including 80% of those raised by two Protestant parents and 75% of
those raised by a single parent who was Protestant. Most who were raised exclusively by
Protestants but who no longer identify as such are now religious “nones,” with smaller numbers
now identifying with Catholicism or other religions.
Among those raised by one Protestant and one religious “none,” 56% now identify with
Protestantism, while one-third are religiously unaffiliated (34%). Those who were raised by a
Protestant and a Catholic, meanwhile, are divided among those who now identify with
Protestantism (38%), Catholicism (29%) and no religion (26%).
Among those raised exclusively by Protestants, eight-in-ten are Protestants today
Based on those raised by at least one Protestant parent
All
Raised by two people – both
Protestant
Raised by two people – one
Protestant, one Catholic
Raised by two people – one
Protestant, one unaffiliated
Raised by single
Protestant person
% % % % %
Christian 79 84 71 63 81
Protestant 71 80 38 56 75
Catholic 6 2 29 3 4
Other Christian 2 1 4 4 2
Non-Christian faith 3 3 3 3 1
Unaffiliated 18 13 26 34 18
100 100 100 100 100
Sample size 2,905 1,838 339 357 319
Share of everyone raised by a Protestant (%) 100 61 11 13 13
Share of total population (%) 56 34 6 7 7
Note: Results repercentaged to exclude nonresponse.
Source: 2014 Religious Landscape Study recontact survey conducted March 17-May 6, 2015.
“One-in-Five U.S. Adults Were Raised in Interfaith Homes”
PEW RESEARCH CENTER

21
ONE-IN-FIVE U.S. ADULTS WERE RAISED IN INTERFAITH HOMES
www.pewresearch.org
Roughly six-in-ten people who were raised exclusively by Catholics now identify with Catholicism,
including 62% of those who were raised by two Catholic parents and 58% of those raised by a
single parent who was Catholic. By comparison, only about three-in-ten people raised by one
Catholic and one non-Catholic parent identify with Catholicism today, including 32% of those
raised by one Catholic parent and one religious “none” and 29% of those who come from a mixed
Catholic/Protestant background.
Among those raised by one Catholic parent and one non-Catholic parent, roughly
one-third identify as Catholics today
Based on those raised by at least one Catholic parent
All
Raised by two people
– both Catholic
Raised by two people – one Catholic, one
Protestant
Raised by two people – one Catholic, one unaffiliated
Raised by single
Catholic person
% % % % %
Christian 74 79 71 53 79
Protestant 20 16 38 20 18
Catholic 52 62 29 32 58
Other Christian 2 1 4 1 2
Non-Christian faith 3 2 3 4 <1
Unaffiliated 23 19 26 42 21
100 100 100 100 100
Sample size 1,706 1,016 339 159 145
Share of everyone raised by a Catholic (%) 100 59 17 9 11
Share of total population (%) 37 22 6 3 4
Note: Results repercentaged to exclude nonresponse.
Source: 2014 Religious Landscape Study recontact survey conducted March 17-May 6, 2015.
“One-in-Five U.S. Adults Were Raised in Interfaith Homes”
PEW RESEARCH CENTER

22
PEW RESEARCH CENTER
www.pewresearch.org
Analysis of the data shows that among those
who were raised by one Catholic parent and one
Protestant parent, those whose mother was
Catholic are much more likely to be Catholics as
adults. Nearly four-in-ten people raised by a
Catholic mother and a Protestant father (38%)
now identify with Catholicism, compared with
just 14% among those with a Catholic father
and a Protestant mother.
In Catholic/Protestant pairings,
Catholic mothers apparently more
effective at passing on the faith
Based on those raised by two biological or adoptive
parents
Current religious identity
Mother Catholic,
father Protestant
Father Catholic, mother
Protestant
% %
Catholic 38 14
Protestant 29 49
Other faith 4 11
None 30 25
100 100
Sample size 162 148
Note: Results repercentaged to exclude nonresponse.
Source: 2014 Religious Landscape Study recontact survey
conducted March 17-May 6, 2015.
“One-in-Five U.S. Adults Were Raised in Interfaith Homes”
PEW RESEARCH CENTER

23
ONE-IN-FIVE U.S. ADULTS WERE RAISED IN INTERFAITH HOMES
www.pewresearch.org
Nearly two-thirds of people raised by two religious “nones” (63%) are also religiously unaffiliated
today. Among those raised by one unaffiliated parent and one Protestant parent, there are more
who now identify with Protestantism (56%) than as religious “nones” (34%), though just 24%
identify with their Protestant parent’s denominational family (e.g., as Baptists if their Protestant
parent was Baptist). Respondents raised by one religiously unaffiliated parent and one Catholic
parent are now divided between those who identify as “nones” (42%) and those who identify as
Catholics (32%), with a considerable minority also identifying as Protestants (20%).
Most people raised by two religious ‘nones’ are religiously unaffiliated today
Based on those raised by at least one religiously unaffiliated parent
All
Raised by two people – both unaffiliated
Raised by two people – one
unaffiliated, one Protestant
Raised by two people – one
unaffiliated, one Catholic
% % % %
Christian 51 36 63 53
Protestant 38 29 56 20
Catholic 10 7 3 32
Other Christian 4 0 4 1
Non-Christian faith 3 1 3 4
Unaffiliated 46 63 34 42
100 100 100 100
Sample size 830 200 357 159
Share of everyone raised by a religious “none” (%) 100 23 41 20
Share of total population (%) 17 4 7 3
Note: Results repercentaged to exclude nonresponse.
Source: 2014 Religious Landscape Study recontact survey conducted March 17-May 6, 2015.
“One-in-Five U.S. Adults Were Raised in Interfaith Homes”
PEW RESEARCH CENTER

24
PEW RESEARCH CENTER
www.pewresearch.org
Looking only at those who were raised within a single religious tradition (i.e., by two people who
shared the same religion or by a single parent), adults who say religion was an important part of
their life growing up are more likely to say they now have the same religious affiliation as their
parents. Among people with an exclusively Catholic background, for instance, three-quarters of
those who say religion was very important to their family while they were growing up (73%)
describe themselves as Catholics today, compared with just 38% among those who say religion was
“not too” or “not at all” important to their families. Similarly, among adults with an exclusively
Protestant background, nine-in-ten of those who say their parents talked a lot about religion
(89%) are Protestants today, compared with 67% among those who say their parents did not
discuss religion very much.
Whether one was raised by two people who shared the same faith or by a single parent seems to
have little effect on whether that person carries the religion of his or her parent or parents into
adulthood.5 Among adults who were raised by two Catholic parents, for instance, 62% describe
themselves as Catholics today, as do 58% of those raised by a single parent who was Catholic.
5 The survey did not ask respondents whether the people who raised them were married to each other; undoubtedly, some respondents who
say they were raised by two biological or adoptive parents had parents who were divorced, while others had parents who were never married.

25
ONE-IN-FIVE U.S. ADULTS WERE RAISED IN INTERFAITH HOMES
www.pewresearch.org
Among those raised in single religious background (especially Protestantism), those
whose childhood most steeped in religion most likely to retain parents’ faith
Now
Catholic Now
Protestant Now
unaffiliated Now other N
Among those with exclusively Catholic background % % % %
Two Catholic parents 62 16 19 3=100 1,016
Single parent 58 18 21 2 145
Parents talked about religion a lot 69 15 14 2 293
Some 69 13 16 2 436
Not much/not at all 48 21 26 5 272
Religion very important to respondent growing up 73 18 6 3 455
Somewhat important 68 14 16 1 449
Not too/not at all important 34 15 46 5 249
Religion very impt. to respondent's family growing up 73 12 12 2 575
Somewhat important 53 20 25 2 442
Not too/not at all important 38 22 33 7 138
Now
Protestant Now
Catholic Now
unaffiliated Now other N
Among those with exclusively Protestant background % % % %
Two Protestant parents 80 2 13 4=100 1,838
Single parent 75 4 18 3 319
Parents talked about religion a lot 89 1 8 2 606
Some 77 3 15 5 779
Not much/not at all 67 3 21 9 440
Religion very important to respondent growing up 89 2 6 3 896
Somewhat important 79 4 13 4 858
Not too/not at all important 53 1 38 9 394
Religion very impt. to respondent’s family growing up 85 2 10 3 1,025
Somewhat important 75 3 17 5 835
Not too/not at all important 64 4 26 6 282
Note: Based on those who were raised by a single parent or by two parents who shared the same religion. Results repercentaged to exclude
nonresponse.
Source: 2014 Religious Landscape Study recontact survey conducted March 17-May 6, 2015.
“One-in-Five U.S. Adults Were Raised in Interfaith Homes”
PEW RESEARCH CENTER

26
PEW RESEARCH CENTER
www.pewresearch.org
2. Religion in marriages and families
Adults in religiously mixed marriages are, by and large, less religious than their counterparts who
are married to spouses who share their faith. They attend religious services less often, pray less
frequently, tend to be less likely to believe in God with absolute certainty and are less inclined to
say religion is very important in their lives.
People in religiously mixed marriages also discuss religious matters with their spouses less
frequently than those who are in religiously matched marriages. Religion does not, however,
appear to be the source of much strife in mixed relationships; while those in mixed marriages
report somewhat higher levels of disagreement about religion, majorities nonetheless say religious
disagreements are not common in their marriages.
When asked about what kinds of things are important for a successful marriage, 44% of adults say
shared religious beliefs are “very important.” By this metric, shared religion is seen as more
important for a good marriage than shared political attitudes, but substantially less important
than shared interests, good sex and a fair division of household labor. There are, however,
significant subsets of the population who place a higher priority on religion within marriage; most
people who are highly religious themselves say shared religious faith is critical to a good marriage,
and women are much more likely than men to say the religion of a prospective spouse is likely to
factor prominently in a decision about whether to get married.
The data also show that when parents attend religious services, they mostly do so with their
children – especially if they are in a religiously matched marriage. Religiously affiliated parents
married to spouses who share their faith also are more likely than intermarried parents to pray or
read scripture with their children.
The remainder of this chapter explores attitudes about and experiences with religion in family life.

27
ONE-IN-FIVE U.S. ADULTS WERE RAISED IN INTERFAITH HOMES
www.pewresearch.org
Religiously affiliated people in mixed marriages tend to be less religious than those who are
married to spouses who share
their religious identity. Among
Catholics married to other
Catholics, for instance, seven-
in-ten are highly religious,
according to an index of key
measures used to determine
levels of religious observance
in the Religious Landscape
Study (including frequency of
worship attendance, frequency
of prayer, belief in God and
self-described importance of
religion in one’s own life). By
comparison, only about half of
Catholics married to non-
Catholics are highly religious.
Of course, it is impossible to know for sure the direction of the causal arrow in the relationship
between religious observance and religious intermarriage. Marrying someone from a different
faith might serve to make people less religious. Alternatively, it could be that people who are not
particularly religious to begin with are more likely to marry a spouse with a different religion. Or it
could be some combination of both factors.
In any case, while intermarriage is linked with lower rates of religious observance among those
who are affiliated with a religion, there is little evidence that the relationship goes in the opposite
direction for those who are religiously unaffiliated. That is, being married to a religiously affiliated
spouse seems to have little impact on the religiosity of religious “nones.” Just 13% of religious
“nones” married to a religiously affiliated spouse are highly religious, which is only modestly
higher than the 9% of “nones” married to fellow “nones” who are highly religious.
Those in mixed marriages generally less religious than
those married to spouse who shares same religion
% who are highly religious among married people who are …
Married to spouse w/same
religion
Married to spouse w/other religion
Married to religiously
unaffiliated spouse
Respondent's religion % % %
Protestant 82 58 59
Catholic 70 56 46
Unaffiliated n/a 13 9
Note: “Highly religious” refers to those who score “high” on an index of religious observance
created by combining four common measures of religious commitment – self-assessment
of religion’s importance in one’s life, frequency of worship attendance, frequency of prayer
and belief in God. For complete details on how the index was created, see
http://www.pewresearch.org/fact-tank/2016/02/29/how-religious-is-your-state/.
Source: 2014 U.S. Religious Landscape Study, conducted June 4-Sept. 30, 2014.
“One-in-Five U.S. Adults Were Raised in Interfaith Homes”
PEW RESEARCH CENTER

28
PEW RESEARCH CENTER
www.pewresearch.org
Overall, 44% of U.S. adults say shared religious beliefs are “very important” for a successful
marriage. By that metric, religion is seen as about as important for a successful marriage as is
having an adequate income or having children, and it is considered less important than having
shared interests, a satisfying sexual relationship or an equitable distribution of housework.
Among married people, the survey finds big differences in the perceived importance of religion
depending on the nature of one’s marriage. Nearly two-thirds of religiously affiliated respondents
with spouses who share their faith (64%) say shared religious beliefs are key to a successful
marriage. Far fewer married people in interfaith relationships see shared religious beliefs as
central to a successful marriage.
Shared interests, good sex, sharing of chores seen as keys to successful marriage
% in each group who say ____ is very important for a successful marriage
All adults
NET All MARRIED
adults
Both spouses affiliated w/same religion
Both affiliated,
but w/different
religions
One spouse affiliated,
one unaffiliated
Both spouses
unaffiliated
All UNMARRIED
adults
% % % % % % %
Having shared interests 66 64 65 68 57 64 68
Satisfying sexual relationship 63 61 63 60 57 60 65
Sharing household chores 61 56 55 57 58 62 65
Adequate income 46 42 43 40 42 41 51
Shared religious beliefs 44 47 64 24 17 16 41
Having children 41 43 51 37 32 19 39
Agreement on politics 16 16 17 16 13 13 16
Source: 2014 Religious Landscape Study recontact survey conducted March 17-May 6, 2015.
“One-in-Five U.S. Adults Were Raised in Interfaith Homes”
PEW RESEARCH CENTER

29
ONE-IN-FIVE U.S. ADULTS WERE RAISED IN INTERFAITH HOMES
www.pewresearch.org
The data also show that among those who are highly religious – including both married and
unmarried respondents – shared religious beliefs are prized in marriage almost as much as shared
interests and about as much as a satisfying sex life and sharing household chores. Far smaller
shares of those who are not highly religious see shared religious beliefs as essential for a good
marriage. Having children also is seen as critical for a good marriage by more of those who are
highly religious than those who are not.
Among those who are highly religious, shared religious beliefs near top of list of
keys to successful marriage
% in each group who say ____ is very important for a successful marriage
High religious observance Medium religious observance Low religious observance
1. Shared interests (69%) 1. Sharing household chores (64%) 1. Satisfying sexual relationship (65%)
2. Shared religious beliefs (64%) 2. Shared interests (62%) 2. Shared interests (63%)
3. Satisfying sexual relationship (63%) 3. Satisfying sexual relationship (60%) 3. Sharing household chores (60%)
4. Sharing household chores (60%) 4. Adequate income (46%) 4. Adequate income (41%)
5. Having children (50%) 5. Having children (37%) 5. Having children (22%)
6. Adequate income (48%) 6. Shared religious beliefs (25%) 6. Agreement on politics (14%)
7. Agreement on politics (18%) 7. Agreement on politics (13%) 7. Shared religious beliefs (12%)
Note: Categories of religious observance are based on an index created by combining four common measures of religious commitment –
self-assessment of religion’s importance in one’s life, frequency of worship attendance, frequency of prayer and belief in God. For complete
details on how the index was created, see http://www.pewresearch.org/fact-tank/2016/02/29/how-religious-is-your-state/.
Source: 2014 Religious Landscape Study recontact survey conducted March 17-May 6, 2015.
“One-in-Five U.S. Adults Were Raised in Interfaith Homes”
PEW RESEARCH CENTER

30
PEW RESEARCH CENTER
www.pewresearch.org
While nearly half of married
people say shared religious
faith is crucial for a successful
marriage, just 27% of married
adults say their spouse’s
religion was, in fact, a “very
important” factor in deciding
whether to marry them
specifically. Roughly a third of
religiously affiliated adults who
are married to someone of the
same faith (36%) say their
spouse’s religion factored
prominently in their decision to
marry, while far fewer
intermarried adults – and just
one-in-twenty religious “nones”
married to fellow “nones” – say the same.
Most in religiously mixed marriages say spouse’s
religion was not important factor in decision to marry
How important a factor was your spouse’s religion in deciding whether to
marry them?
Very
important Somewhat important
Not too / not at all important
Don't know
% % % %
All married people 27 21 51 1=100
Both affiliated w/same religion 36 26 37 1
Both affiliated but w/different religions 18 17 65 <1
One affiliated, one unaffiliated 10 10 80 1
Both unaffiliated 5 10 84 <1
Source: 2014 Religious Landscape Study recontact survey conducted March 17-May 6,
2015.
“One-in-Five U.S. Adults Were Raised in Interfaith Homes”
PEW RESEARCH CENTER

31
ONE-IN-FIVE U.S. ADULTS WERE RAISED IN INTERFAITH HOMES
www.pewresearch.org
Among those who are not
currently married, the survey
finds the religion of a potential
spouse is more important to
women than it is to men.
Nearly four-in-ten women say
their potential spouse’s religion
would be a “very important”
factor if they were considering
marriage, while just 26% of
single men say the same.
Not surprisingly, the data also
show that the religion of a
potential spouse would be far
more important to highly
religious people than to single
people who are not highly
religious. Still, even among the
highly religious, roughly a
quarter say the religion of their
prospective spouse would be
only “somewhat important” to their decision, and one-in-five say it would be “not too” or “not at
all” important.
More unmarried women than men say religion would
be important factor in choosing potential spouse
If you were considering marriage, how important a factor do you think your
potential spouse’s religion would be in deciding whether to marry them?
Very
important Somewhat important
Not too/not at all important
Don't know
% % % %
All unmarried adults 33 29 36 2=100
Women 39 29 29 2
Men 26 29 43 1
Religious observance index
High 52 27 19 2
Medium 18 35 47 <1
Low 11 28 59 2
Note: Categories of religious observance are based on an index created by combining four
common measures of religious commitment – self-assessment of religion’s importance in
one’s life, frequency of worship attendance, frequency of prayer and belief in God. For
complete details on how the index was created, see http://www.pewresearch.org/fact-
tank/2016/02/29/how-religious-is-your-state/.
Source: 2014 Religious Landscape Study recontact survey conducted March 17-May 6,
2015.
“One-in-Five U.S. Adults Were Raised in Interfaith Homes”
PEW RESEARCH CENTER

32
PEW RESEARCH CENTER
www.pewresearch.org
Roughly six-in-ten married
people say they and their
spouses are about equally
religious. This includes about
three-quarters of “nones”
married to spouses who are
also religiously unaffiliated and
nearly two-thirds of religiously
affiliated adults married to a
spouse from the same religion.
Only about half of religiously
affiliated adults married to
someone from a different
religion (46%) say they and
their spouse are equally
religious, and just 36% of those
in a marriage combining one religiously affiliated spouse and one religious “none” say both
spouses are equally religious.
Among those in this latter type
of relationship, it is typically
the religiously affiliated spouse
who is described as more
religiously observant than the
unaffiliated spouse. The data
also show that in marriages in
which one spouse is more
religious than the other, wives
generally are seen as more
religious than husbands. About
one-third of married women
say they are more religious
Six-in-ten married people say they and their spouse
are equally religious
% in each group who say their spouse is …
Equally religious as them
More religious or
less religious Don't know
% % %
All married adults 59 41 1=100
Both unaffiliated 74 26 <1
Both affiliated w/same religion 65 35 1
Both affiliated, but w/different religions 46 53 1
One affiliated, one unaffiliated 36 64 1
Source: 2014 Religious Landscape Study recontact survey conducted March 17-May 6,
2015.
“One-in-Five U.S. Adults Were Raised in Interfaith Homes”
PEW RESEARCH CENTER
Husbands and wives agree: If anything, wives are
more religious
% in each group who say their spouse is …
More religious
than them Less
religious Equally
religious Don’t know
% % % %
Married women 8 33 59 <1
Married men 30 10 59 1
Source: 2014 Religious Landscape Study recontact survey conducted March 17-May 6,
2015.
“One-in-Five U.S. Adults Were Raised in Interfaith Homes”
PEW RESEARCH CENTER

33
ONE-IN-FIVE U.S. ADULTS WERE RAISED IN INTERFAITH HOMES
www.pewresearch.org
than their husbands, while a similar share of husbands say their wives are more religious than
them. By contrast, just 8% of women and 10% of men say the husband is more religious in their
marriage.6
Most religiously affiliated
people with spouses who share
their religion say they attend
religious services with their
spouse. Attending services at a
house of worship together is far
less common among people
married to a spouse from a
different religion. And among
married “nones” whose spouses
are also religiously unaffiliated,
most say they rarely or never
attend religious services at all.
6 The survey did not ask married people whether their spouse is a man or a woman; this analysis assumes that male respondents are married
to female spouses and vice versa. While it is possible that some respondents are in same-sex marriages, these marriages are estimated to
make up a small percentage of all U.S. marriages and thus would likely have minimal effect on these figures.
Spouses who share same religion mostly go to
religious services together
When you attend religious services, is it typically with your spouse, or not?
Yes No Don't know
Seldom/never attend
worship services
% % % %
All married adults 57 15 <1 27=100
Both affiliated w/same religion 75 12 <1 12
Both affiliated, different religions 45 28 1 26
One affiliated, one unaffiliated 22 25 1 52
Respondent affiliated, spouse unaffiliated 21 43 <1 36
Respondent unaffiliated, spouse affiliated 24 7 1 68
Both unaffiliated 11 7 <1 81
Note: The “seldom/never attend” column includes those who declined to say how often
they attend religious services.
Source: 2014 Religious Landscape Study recontact survey conducted March 17-May 6,
2015.
“One-in-Five U.S. Adults Were Raised in Interfaith Homes”
PEW RESEARCH CENTER

34
PEW RESEARCH CENTER
www.pewresearch.org
Within marriages, religious
discussion is most common
among religiously affiliated
adults who have spouses
affiliated with the same
religion. Nearly eight-in-ten
(78%) in this group say they
talk about religion “a lot” or
“some” with their spouse;
religious discussions are less
common among those married
to a spouse with a different
religion (or no religion) and
among religious “nones”
married to fellow “nones.”
Religious disagreement is most
common in religiously mixed
marriages; for example, one-
third of those in marriages
pairing a religious “none” with
a religiously affiliated spouse
have at least some
disagreements about religion.
Still, in all kinds of marital
combinations, religious discord
is the exception rather than the
rule; majorities in all types of
pairings say they disagree with
their spouse about religion “not
much” or “not at all.”
Spouses who share a religion more likely to discuss
religion on a regular basis
How much do you and your spouse talk about religion, if at all?
NET A
lot/some A lot Some Not
much Not
at all
% % % % %
All married adults 67 27 40 25 7
Both affiliated w/same religion 78 36 42 19 3
Both affiliated, different religions 62 20 42 29 9
One affiliated, one unaffiliated 46 9 37 39 14
Respondent affiliated, spouse unaffiliated 51 11 41 36 13
Respondent unaffiliated, spouse affiliated 41 8 33 42 16
Both unaffiliated 36 7 29 40 23
Note: Those who said “don’t know” or refused to answer are not shown.
Source: 2014 Religious Landscape Study recontact survey conducted March 17-May 6,
2015.
“One-in-Five U.S. Adults Were Raised in Interfaith Homes”
PEW RESEARCH CENTER
Little marital discord about religion, though
intermarried couples disagree somewhat more often
How much do you and your spouse disagree about religion, if at all?
NET A
lot/some A lot Some Not
much Not at
all
% % % % %
All married adults 21 5 17 33 45
Both affiliated w/same religion 19 3 16 35 46
Both affiliated, different religions 28 7 21 29 42
One affiliated, one unaffiliated 32 10 22 29 39
Respondent affiliated, spouse unaffiliated 36 11 25 29 34
Respondent unaffiliated, spouse affiliated 28 9 19 29 43
Both unaffiliated 13 4 10 36 51
Note: Those who said “don’t know” or refused to answer are not shown.
Source: 2014 Religious Landscape Study recontact survey conducted March 17-May 6,
2015.
“One-in-Five U.S. Adults Were Raised in Interfaith Homes”
PEW RESEARCH CENTER

35
ONE-IN-FIVE U.S. ADULTS WERE RAISED IN INTERFAITH HOMES
www.pewresearch.org
Most parents attend worship
services at least a few times a
year, and their children
typically attend with them.
About two-thirds of all parents
of children currently under 18
(65%) usually attend worship
services with their kids,
including roughly eight-in-ten
evangelical (83%) and Catholic
(78%) parents and two-thirds
of mainline Protestant parents
(67%). Religiously unaffiliated
parents are less likely to attend
religious services at all;
roughly seven-in-ten (69%) say
they seldom or never attend
church (or did not answer the
question about attendance).
Among married parents, those
who share their spouse’s
religious affiliation are among
the most likely to attend
worship services with their
children (83%). Intermarried
parents and “nones” married
to other “nones” are less likely
to attend religious services, but
when they do, they also mostly
say they take their kids with them.
Two-thirds of parents usually attend worship services
with their children
When you attend religious services, is it typically with your child/children,
or not?
Seldom or never attend
worship services Yes No
Don’t know
% % % %
All parents 65 8 1 27=100
Protestant 77 8 <1 15
Evangelical 83 7 <1 10
Mainline 67 6 1 27
Catholic 78 8 1 13
Unaffiliated 23 7 2 69
Among married parents …
Both affiliated with same religion 83 6 1 11
Both affiliated but with different religions 72 7 0 22
One affiliated, one unaffiliated 43 6 <1 50
Respondent affiliated, spouse unaffiliated 59 6 0 35
Respondent unaffiliated, spouse affiliated 28 7 1 64
Both unaffiliated 19 4 0 77
Notes: In this analysis, “parents” are those who say they are currently the parent or guardian
of a minor child residing in their household. The survey did not ask married parents whether
their spouse is the parent/guardian of the child residing in their household. Thus, readers
should bear in mind that in some cases, the child's other parent is someone other than the
respondent’s spouse.
The “seldom/never attend” column includes those who declined to say how often they
attend religious services.
Source: 2014 Religious Landscape Study recontact survey conducted March 17-May 6,
2015.
“One-in-Five U.S. Adults Were Raised in Interfaith Homes”
PEW RESEARCH CENTER

36
PEW RESEARCH CENTER
www.pewresearch.org
Religiously affiliated parents
married to spouses who share
their faith are most likely to
pray or read scripture with
their children and to send
them to religious education
programs. They also are more
likely than others to say they
do volunteer work with their
children, though the gaps
between religiously affiliated
parents married to a spouse of
the same faith and other kinds
of couples are relatively
modest on this question.
Most parents pray with their children, send them to
religious education
Pray or read
scripture with your children
Send children
to Sunday school/ religious
education
Home school or religious school
instead of public
Do volunteer
work together
All parents/guardians 63 55 15 46
Protestant 79 71 16 49
Evangelical 85 77 19 50
Mainline 63 59 11 49
Historically black 85 73 13 41
Catholic 64 50 18 43
Unaffiliated 28 27 7 37
Among married parents …
Both affiliated w/same religion 77 70 19 53
Both affiliated but w/different religions 60 52 18 46
One affiliated, one unaffiliated 43 38 12 45
Respondent affiliated, spouse unaffiliated 54 44 13 46
Respondent unaffiliated, spouse affiliated 33 33 11 45
Both unaffiliated 18 16 6 36
Note: In this analysis, “parents” are those who say they are currently the parent or guardian
of a minor child residing in their household. The survey did not ask married parents whether
their spouse is the parent/guardian of the child residing in their household. Thus, readers
should bear in mind that in some cases, the child's other parent is someone other than the
respondent’s spouse.
Source: 2014 Religious Landscape Study, conducted June 4-Sept. 30, 2014.
“One-in-Five U.S. Adults Were Raised in Interfaith Homes”
PEW RESEARCH CENTER

37
ONE-IN-FIVE U.S. ADULTS WERE RAISED IN INTERFAITH HOMES
www.pewresearch.org
Acknowledgments
The Religious Landscape Study and this report were made possible by The Pew Charitable Trusts,
which received support for the project from Lilly Endowment Inc.
This report is a collaborative effort based on the input and analysis of the following individuals.
Gregory A. Smith, Associate Director of Research
Elizabeth Podrebarac Sciupac, Research Associate
Alan Cooperman, Director of Religion Research
Jessica Hamar Martínez, Senior Researcher
Besheer Mohamed, Senior Researcher
Becka A. Alper, Research Associate
Claire Gecewicz, Research Assistant
Kyley McGeeney, Senior Research Methodologist
Sandra Stencel, Associate Director of Editorial
Michael Lipka, Senior Editor
Aleksandra Sandstrom, Copy Editor
Bill Webster, Information Graphics Designer
Stacy Rosenberg, Senior Digital Manager
Travis Mitchell, Digital Producer
Anna Schiller, Communications Manager
Stefan S. Cornibert, Communications Associate

38
PEW RESEARCH CENTER
www.pewresearch.org
Methodology
This report is based on results from two surveys – a national telephone survey of more than
35,000 adults that was the centerpiece of the Pew Research Center’s 2014 U.S. Religious
Landscape Study, and a 2015 “recontact” survey in which 5,000 Landscape Study respondents
were recontacted and asked additional questions. Full methodological details about the 2014
survey are included in Pew Research Center’s report “America’s Changing Religious Landscape.”
The remainder of this section provides details about how the recontact survey was conducted.
Interviewing for the recontact survey was done under the direction of Abt SRBI March 17 to May 6,
2015. Interviews were conducted in English and Spanish; 2,013 respondents were interviewed on a
landline telephone and 2,987 were interviewed on a cellphone.

39
ONE-IN-FIVE U.S. ADULTS WERE RAISED IN INTERFAITH HOMES
www.pewresearch.org
Respondents who participated in the 2014 Religious Landscape Study’s original telephone survey
were sorted into 15 recontact strata based on a variety of religious and demographic
characteristics. In order to support the analytical goals of the project, certain groups (e.g.,
religiously intermarried respondents) were oversampled, while others were undersampled (see
tables). After data collection, the data were weighted (as described below) such that all 15 strata
are represented in roughly their proper proportion in the study’s final, weighted estimates.
Sampling strata
2014 Religious
Landscape Study Recontact
survey
Unweighted
N Weighted
share Unweighted
N Unweighted
share Weighted
share
Strata including married/partnered evangelical Protestants, religious “nones,” Catholics and mainline Protestants whose spouse/partner identifies with one of these four religious identity categories that is different than the respondent’s own
1: Respondent is a mainline Protestant who was raised Catholic 141 <1 53 1 1
2: Respondent is an evangelical Protestant who was raised as religious “none” and now has a spouse/partner who is a mainline Protestant or a religious “none” 54 <1 17 <1 <1
3: Respondent is a mainline Protestant who was raised as religious “none” 59 <1 25 1 <1
4: Respondent is evangelical Protestant who has a spouse/partner who is Catholic 288 1 92 2 1
5: Respondent is religious “none” who has a spouse/partner who is an evangelical Protestant 270 1 111 2 1
6: Other combinations 3,630 10 1,379 28 12
Strata including anyone who has a spouse/partner who has the same religious identity as the respondent, anyone who is not married or living with a partner, as well as all other respondents not covered in strata 1-6
7: Respondent is religious “none,” is the parent of minor child, and has a spouse/partner who is also a religious “none” 714 2 175 4 3
8: Respondent is mainline Protestant, is the parent of minor child, has a spouse/partner who is also a mainline Protestant, and was NOT raised Catholic or as religious “none” 426 1 142 3 2
9: Respondent is mainline Protestant and was raised Catholic 502 1 108 2 2
10: Respondent is evangelical Protestant and was raised as religious “none” 492 1 148 3 2
11: Respondent is mainline Protestant and was raised as religious “none” 232 1 94 2 1
12: Respondent is member of historically black Protestant tradition and attends religious services a few times a year or less 471 2 141 3 2
13: Respondent is member of historically black Protestant tradition and attends religious services at least once a month 1,432 5 192 4 5
14: Respondent is Catholic, parent of a minor child, and has spouse/partner who is also Catholic 1,046 4 170 3 5
15: All others 25,314 72 2,153 43 64
35,071 100 5,000 100 100
PEW RESEARCH CENTER
40
PEW RESEARCH CENTER
www.pewresearch.org
The national results included in this report are based on weighted estimates. The weighting was
conducted in two stages. The first stage in the weighting process was the calculation of base
weights, which was accomplished by multiplying the final base weight from the 2014 Religious
Landscape Study’s original telephone survey by the inverse of the subsampling rate in the
recontact survey. This step was carried out separately for each of the 15 recontact strata. For
details on how the base weights were calculated in the 2014 Religious Landscape Study, see the
methodological appendix in “America’s Changing Religious Landscape.”
The second stage of the weighting calibrated the base-weighted data to demographic benchmarks
for the population covered by the survey (U.S. adults). This was performed via iterative
proportional fitting (or “raking”). The raking procedure aligned survey respondents to population
benchmarks on the following dimensions:
Gender by age
Gender by education level
Education level by age
Race/ethnicity
Telephone service
Population density
State of residence
Religious affiliation
The demographic benchmarks for age, gender, education level, race, and state came from an
analysis of the Census Bureau’s 2013 American Community Survey (ACS) one-year estimates,
which was the most current data source available at the time the 2014 Religious Landscape Study
data were weighted. The ACS parameters were calculated for adults ages 18 and older residing in
households in the U.S., excluding those living in institutionalized group quarters. The population
density parameter was derived from Census 2010 data and filtered on adults ages 18 and older
residing in the U.S. The benchmark for religious affiliation was based on weighted estimates of
self-reported data from the 2014 Religious Landscape Study. The telephone service parameter was
constructed from model-based estimates released by the National Center for Health Statistics for
July-December 2013, projected to the year 2014. These estimates were based on adults, ages 18
and older, living in households with a telephone (either landline or cell). The completion rate for
this study was 37.2%. Taken with the response rate to the original 2014 Religious Landscape
Study, the cumulative response rate of the new survey is 3.9%.

41
ONE-IN-FIVE U.S. ADULTS WERE RAISED IN INTERFAITH HOMES
www.pewresearch.org
Weighting and survey design
features that depart from simple
random sampling tend to result
in a loss of precision in survey
estimates. This loss of precision,
known as the design effect, is
incorporated in all margins of
error, standard errors and tests
of statistical significance
included in this report.
Generally speaking, larger
sample sizes are associated with
smaller margins of sampling
error, and smaller sample sizes
are associated with larger
margins of error. The margin of
error for national estimates from
this survey is +/- 2.0 percentage
points. Many of the analyses in
this report as based on
subgroups of respondents (e.g.,
those who provided complete
information about the religion of
their parents, or on respondents
with a particular kind of
religious background), which have larger margins of error. The accompanying table presents
sample sizes and corresponding margins of error for some of the groups commonly discussed in
this report. Sample sizes and margins of error for other groups are available upon request.
In addition to sampling error, one should bear in mind that question wording and practical
difficulties in conducting surveys can introduce error or bias into the findings of opinion polls.
Sample sizes and margins of error for religious
traditions
Sample
size
Margin of error (+/- __
percentage points)
Full sample 5,000 2.0
Raised with single religious background 3,834 2.2
Raised by Protestant parent/parents 2,157 3.0
Raised by Catholic parent/parents 1,161 4.1
Raised by religiously unaffiliated parent(s) 272 8.4
Raised with mixed religious background 1,002 4.5
One Protestant parent, one Catholic parent 339 7.9
One Protestant parent, one unaffiliated parent 357 7.5
One Catholic parent, one unaffiliated parent 159 11.3
Respondent married and…
Respondent & spouse both affil. w/same religion 1,577 3.4
Both affiliated, but w/different religions 494 6.5
One affiliated, one unaffiliated 821 4.6
Respondent affiliated, spouse unaffiliated 377 6.6
Respondent unaffiliated, spouse affiliated 444 6.4
Respondent & spouse both religiously unaffiliated 259 8.1
Source: 2014 U.S. Religious Landscape Study recontact survey conducted March 17-May
6, 2015.
“One-in-Five U.S. Adults Were Raised in Interfaith Homes”
PEW RESEARCH CENTER

42
PEW RESEARCH CENTER
www.pewresearch.org
PEW RESEARCH CENTER
FINAL TOPLINE 2014 U.S. RELIGIOUS LANDSCAPE STUDY
RECONTACT SURVEY March 17-May 6, 2015
N=5,000 NOTE: FOR FULL QUESTION WORDING, SEE THE SURVEY QUESTIONNAIRE QUESTIONS Q.A1-Q.A4 PREVIOUSLY RELEASED
ASK ALL: Q.B1 Thinking about when you were growing up, who were you raised by? Just stop me when I get to the
right response. Were you raised MOSTLY [READ IN ORDER]?
by your biological mother and father [OR] by a biological parent and a stepparent [OR] by two adoptive parents [OR] by a single parent [OR] in another way, such as by your grandparents or other family members
[VOL. – DO NOT READ] Don’t know/Refused ASK IF RAISED BY A BIOLOGICAL PARENT AND A STEPPARENT: Q.B2a Were you raised by [READ IN ORDER]?
your mother and stepfather [OR]
your father and stepmother [VOL. – DO NOT READ] in another way (SPECIFY) [VOL. – DO NOT READ] Don’t know/Refused
ASK IF RAISED BY SINGLE PARENT: Q.B2b Were you raised by [READ IN ORDER]?
your mother your father [OR] someone else (SPECIFY)
[VOL. – DO NOT READ] Don’t know/Refused
ASK IF RAISED IN A DIFFERENT WAY: Q.B2c IF RESPONDENT GIVES OPEN ENDED ANSWER IN Q.B1 ENTER IT HERE, OTHERWISE
READ: When you were growing up, who were you raised by?
One parent or guardian (SPECIFY) More than one parent or guardian (SPECIFY) Number of guardians is unclear (SPECIFY) [VOL. – DO NOT READ] Don’t know/Refused
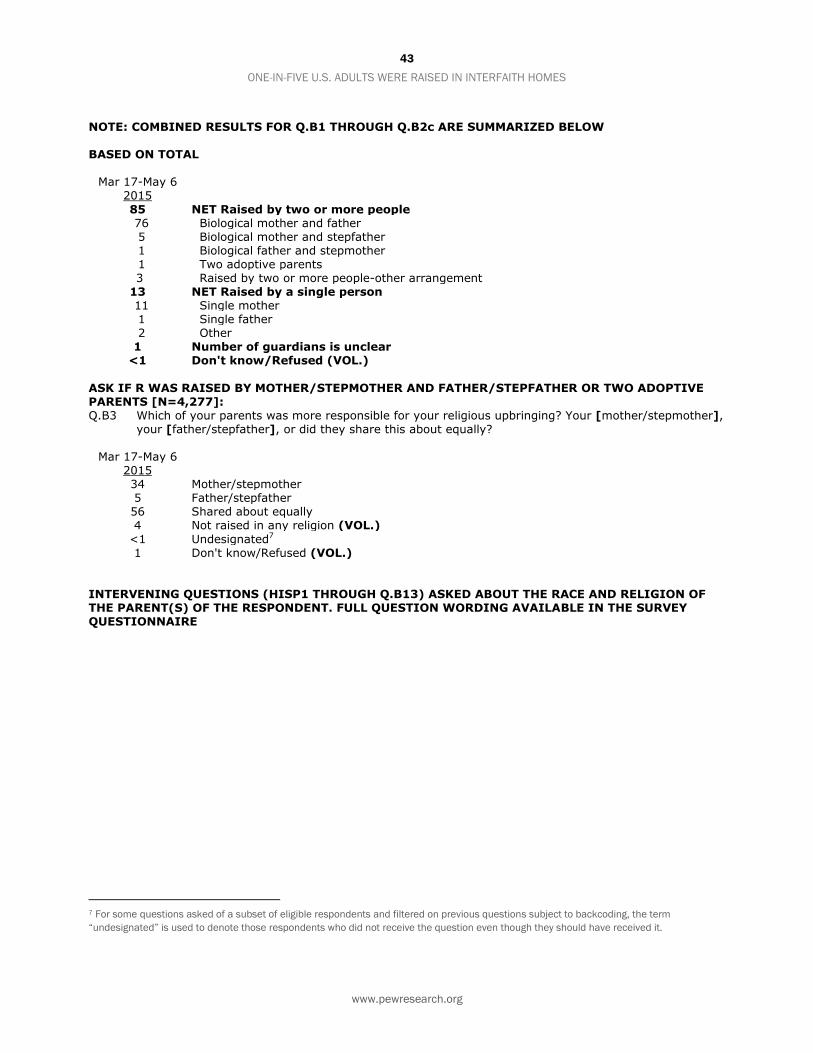
43
ONE-IN-FIVE U.S. ADULTS WERE RAISED IN INTERFAITH HOMES
www.pewresearch.org
NOTE: COMBINED RESULTS FOR Q.B1 THROUGH Q.B2c ARE SUMMARIZED BELOW BASED ON TOTAL
Mar 17-May 6 2015
85 NET Raised by two or more people 76 Biological mother and father 5 Biological mother and stepfather 1 Biological father and stepmother 1 Two adoptive parents 3 Raised by two or more people-other arrangement 13 NET Raised by a single person 11 Single mother 1 Single father 2 Other 1 Number of guardians is unclear
<1 Don't know/Refused (VOL.)
ASK IF R WAS RAISED BY MOTHER/STEPMOTHER AND FATHER/STEPFATHER OR TWO ADOPTIVE PARENTS [N=4,277]: Q.B3 Which of your parents was more responsible for your religious upbringing? Your [mother/stepmother],
your [father/stepfather], or did they share this about equally?
Mar 17-May 6 2015
34 Mother/stepmother 5 Father/stepfather 56 Shared about equally 4 Not raised in any religion (VOL.)
<1 Undesignated7 1 Don't know/Refused (VOL.)
INTERVENING QUESTIONS (HISP1 THROUGH Q.B13) ASKED ABOUT THE RACE AND RELIGION OF THE PARENT(S) OF THE RESPONDENT. FULL QUESTION WORDING AVAILABLE IN THE SURVEY QUESTIONNAIRE
7 For some questions asked of a subset of eligible respondents and filtered on previous questions subject to backcoding, the term
“undesignated” is used to denote those respondents who did not receive the question even though they should have received it.

44
PEW RESEARCH CENTER
www.pewresearch.org
SUMMARY TABLE: PARENT RELIGION BASED ON RESPONDENTS WHO GAVE COMPLETE INFORMATION ABOUT THE RELIGION OF THE PERSON OR PEOPLE WHO RAISED THEM [N=4,852]
Mar 17-May 6
2015
21 NET Raised by two people w/different religions
9 Both religiously affiliated
6 One Protestant, one Catholic
3 Other combination
12 One religiously affiliated, one religious "none"
7 One "none," one Protestant
3 One "none," one Catholic
1 One "none," one other religion
79 NET Raised in single religious background
65 By two parents
34 Both Protestant
21 Both Catholic
6 Both other religion
4 Both "none"
14 By single parent
7 Who was Protestant
4 Who was Catholic
1 Who identified with other religion
2 Who was "none"
NO Q.B14 ASK IF R HAD MORE THAN ONE PARENT [N=4,393]: Q.B15 When you were growing up how much did your parents [or guardians] talk about religion, if at all?
Mar 17-May 6
2015
31 A lot 37 Some 24 Not much 7 Not at all 1 Undesignated 1 Don't know/Refused (VOL.)
ASK IF R HAD MORE THAN ONE PARENT [N=4,393]: Q.B16 As far as you know, how much did your parents [or guardians] disagree with each other about
religion, if at all?
Mar 17-May 6 2015
5 A lot 9 Some 24 Not much 57 Not at all 1 Undesignated 4 Don't know/Refused (VOL.)

45
ONE-IN-FIVE U.S. ADULTS WERE RAISED IN INTERFAITH HOMES
www.pewresearch.org
ASK ALL: Q.B17 When you were growing up, how important was religion to you personally– very important, somewhat
important, not too important, or not at all important?
Mar 17-May 6 2015
37 Very important 35 Somewhat important 18 Not too important 9 Not at all important 1 Don't know/Refused (VOL.)
ASK ALL: Q.B18 And when you were growing up, how important was religion to your family– very important, somewhat
important, not too important, or not at all important? IF RESPONDENT SAYS IT WAS IMPORTANT FOR ONE PARENT BUT NOT BOTH, ASK: How important was religion to your family overall?
Mar 17-May 6
2015
45 Very important 35 Somewhat important 14 Not too important 6 Not at all important 1 Don't know/Refused (VOL.)
ASK ALL: Q.B19 Do you think of yourself as having been raised in more than one religion, or not?
Mar 17-May 6 2015
11 Yes, raised in more than one religion 87 No, not raised in more than one religion 1 Raised in no religion (VOL.)
<1 Don't know/Refused (VOL.)

46
PEW RESEARCH CENTER
www.pewresearch.org
ASK IF R WAS RAISED IN MORE THAN ONE RELIGION [N=516]: Q.B20 In what way were you raised in more than one religion? (SPECIFY) NOTE: RESULTS MAY NOT SUM TO 100% OR TO SUBTOTALS INDICATED BECAUSE MULTIPLE RESPONSES WERE PERMITTED
Mar 17-May 6
2015
49 NET Exposure to multiple faiths 31 Family members of various religions 7 Was taught/studied multiple religions 5 Close friend/neighbors of various religions 4 Went to religious school/camp/etc. for a different religion 3 Exposure – miscellaneous 28 NET Multiple faiths at one time 9 Went to multiple churches at the same time 3 Practiced elements of multiple faiths
2 Went to church different from own 2 Accepted beliefs from multiple religions 1 All religions are the same/all religions are right 1 Open minded/spiritual but not religious 10 Other multiple faiths at once 18 NET Religious switching 11 Respondent/family switched religions 4 Respondent/family switched churches 3 Other switching 7 Unclear 1 No answer
ASK ALL: Q.B21 Do you CURRENTLY think of yourself as belonging to more than one religion, or not?
Mar 17-May 6 2015
6 Yes, think of self as belonging to more than one religion 90 No, do not belong to more than one religion 3 Not part of any religion (VOL.) 1 Don't know/Refused (VOL.)

47
ONE-IN-FIVE U.S. ADULTS WERE RAISED IN INTERFAITH HOMES
www.pewresearch.org
ASK IF R CURRENTLY IN MORE THAN ONE RELIGION [N=318]: Q.B22 In what way do you think of yourself as belonging to more than one religion? (SPECIFY) NOTE: RESULTS MAY NOT SUM TO 100% OR TO SUBTOTALS INDICATED BECAUSE MULTIPLE RESPONSES WERE PERMITTED
Mar 17-May 6 2015
57 NET Multiple faiths at one time 14 All religions are the same/all religions are right 12 Went/go to multiple churches at the same time 10 Accept beliefs from multiple religions 5 Open minded/spiritual but not religious 4 Practiced/practice elements of multiple faiths 3 Went/go to church different from own 11 Other multiple faiths at once 13 NET Religious switching 8 Respondent/family switched religions
4 Searching for a new religion 1 Respondent/family switched churches 12 NET Exposure to multiple faiths 7 Family members of various religions 2 Was taught/studied/studies multiple religions 1 Close friend/neighbors of various religions 2 Exposure - miscellaneous 12 Unclear 7 No answer
QUESTIONS Q.C1-Q.C13 PREVIOUSLY RELEASED
READ TO ALL: Moving on to our last topic, we have some questions about marriage and raising children ASK ALL: Q.D1 Here is a list of things which some people think make for a successful marriage. Please tell me, for
each one, whether you think it is very important, somewhat important, or not important for a successful marriage. First, how important is [INSERT ITEM; RANDOMIZE a-f, c should never be first, g should always be last] for a successful marriage – very important, somewhat important, or not important? Next, how important is [INSERT ITEM; RANDOMIZE a-f, c should never be first, g should always be last] for a successful marriage? How about [INSERT ITEM; RANDOMIZE a-f, c
should never be first, g should always be last]. READ EVERY FEW ITEMS AND AS NECESSARY: How important is this for a successful marriage—
very important, somewhat important, or not important?
Very
important Somewhat important
Not important
(VOL.) DK/Ref.
Mar 17-May 6, 2015 a. an adequate income 46 45 7 1
b. agreement on politics 16 48 35 2
c. a satisfying sexual relationship 63 33 3 1
d. sharing household chores 61 34 4 1
e. having children 41 32 25 2
f. having shared interests 66 32 2 <1
g. shared religious beliefs 44 38 17 1

48
PEW RESEARCH CENTER
www.pewresearch.org
READ TO ALL MARRIED/LIVING WITH PARTNER 8 Last year you told us you were [married/living with a partner]. ASK ALL MARRIED/LIVING WITH PARTNER [N=3,574]: Q.D2 Would you say your [spouse/partner] is [READ IN ORDER TO RANDOM HALF OF SAMPLE,
REVERSE ORDER OF 1 AND 2 TO OTHER HALF OF SAMPLE]:
Mar 17-May 6
2015
19 More religious than you 21 Less religious than you 58 About as religious as you
1 [VOL. – DO NOT READ] No longer married/no longer together
1 [VOL. – DO NOT READ] Don't know/Refused
ASK ALL CURRENTLY MARRIED/LIVING WITH PARTNER THAT ATTEND RELIGIOUS SERVICES AT
LEAST A FEW TIMES A YEAR [N=2,344]: Q.D3 When you attend religious services, is it typically with your [spouse/partner], or not?
Mar 17-May 6 2015
77 Yes 23 No 1 Don't know/Refused (VOL.)
ASK ALL CURRENTLY MARRIED/LIVING WITH PARTNER [N=3,533]: Q.D4 How much do you and your [spouse/partner] talk about religion, if at all?
Mar 17-May 6 2015
25 A lot 40 Some 26 Not much 8 Not at all
<1 Don't know/Refused (VOL.) ASK ALL CURRENTLY MARRIED/LIVING WITH PARTNER [N=3,533]: Q.D5 How much do you and your [spouse/partner] disagree about religion, if at all?
Mar 17-May 6
2015
5 A lot 16 Some 33 Not much 45 Not at all 1 Don't know/Refused (VOL.)
8 Data on respondent’s marital status for questions Q.D2 through Q.D6b drawn from 2014 U.S. Religious Landscape Study. See
corresponding topline for full results for the question (MARITAL).
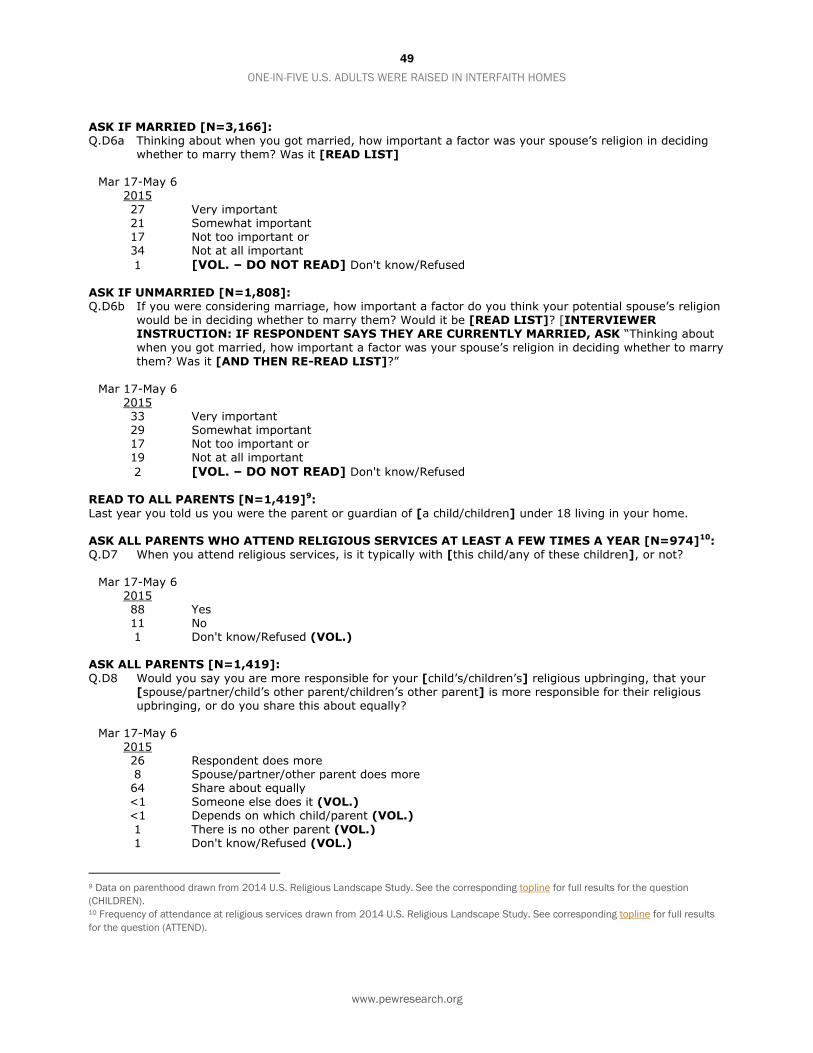
49
ONE-IN-FIVE U.S. ADULTS WERE RAISED IN INTERFAITH HOMES
www.pewresearch.org
ASK IF MARRIED [N=3,166]: Q.D6a Thinking about when you got married, how important a factor was your spouse’s religion in deciding
whether to marry them? Was it [READ LIST]
Mar 17-May 6 2015
27 Very important 21 Somewhat important 17 Not too important or 34 Not at all important
1 [VOL. – DO NOT READ] Don't know/Refused
ASK IF UNMARRIED [N=1,808]: Q.D6b If you were considering marriage, how important a factor do you think your potential spouse’s religion
would be in deciding whether to marry them? Would it be [READ LIST]? [INTERVIEWER INSTRUCTION: IF RESPONDENT SAYS THEY ARE CURRENTLY MARRIED, ASK “Thinking about when you got married, how important a factor was your spouse’s religion in deciding whether to marry
them? Was it [AND THEN RE-READ LIST]?”
Mar 17-May 6 2015
33 Very important 29 Somewhat important 17 Not too important or 19 Not at all important
2 [VOL. – DO NOT READ] Don't know/Refused
READ TO ALL PARENTS [N=1,419]9:
Last year you told us you were the parent or guardian of [a child/children] under 18 living in your home. ASK ALL PARENTS WHO ATTEND RELIGIOUS SERVICES AT LEAST A FEW TIMES A YEAR [N=974]10: Q.D7 When you attend religious services, is it typically with [this child/any of these children], or not?
Mar 17-May 6 2015
88 Yes 11 No 1 Don't know/Refused (VOL.)
ASK ALL PARENTS [N=1,419]:
Q.D8 Would you say you are more responsible for your [child’s/children’s] religious upbringing, that your [spouse/partner/child’s other parent/children’s other parent] is more responsible for their religious upbringing, or do you share this about equally?
Mar 17-May 6
2015
26 Respondent does more 8 Spouse/partner/other parent does more 64 Share about equally <1 Someone else does it (VOL.) <1 Depends on which child/parent (VOL.)
1 There is no other parent (VOL.) 1 Don't know/Refused (VOL.)
9 Data on parenthood drawn from 2014 U.S. Religious Landscape Study. See the corresponding topline for full results for the question
(CHILDREN). 10 Frequency of attendance at religious services drawn from 2014 U.S. Religious Landscape Study. See corresponding topline for full results
for the question (ATTEND).

50
PEW RESEARCH CENTER
www.pewresearch.org
ASK IF PARENT AND AFFILIATED WITH A RELIGION [N=1,035]: Q.D9a Are you raising your [child/children] in:
Mar 17-May 6 2015
86 Your current religion [OR]
1 another religion [OR] 3 more than one religion [OR] 8 with no religion
<1 [VOL. – DO NOT READ] Some children in your current religion and some not
1 [VOL. – DO NOT READ] Don't know/Refused
ASK IF PARENT AND UNAFFILIATED [N=384]: Q.D9b Are you raising your [child/children] in:
Mar 17-May 6 2015
31 A religion [OR] 9 more than one religion [OR] 56 with no religion
1 [VOL. – DO NOT READ] Depends on which child
4 [VOL. – DO NOT READ] Don't know/Refused

51
ONE-IN-FIVE U.S. ADULTS WERE RAISED IN INTERFAITH HOMES
www.pewresearch.org
PEW RESEARCH CENTER
2014 RELIGIOUS LANDSCAPE STUDY (RLS-II) TOPLINE
June 4-September 30, 2014 N=35,071
Note: figures may not sum to 100 due to rounding. Some questions previously released with the first, second or third report on the Religious Landscape Study’s findings. ASK IF R IS PARENT/GUARDIAN OF CHILDREN UNDER 18 YEARS:
Q.K10 As I read a list, please tell me if you do any of the following things with [IF ONE CHILD, INSERT: your child; IF MORE THAN ONE CHILD, INSERT: your children]. First, do you [INSERT IN ORDER]? Next, do you [INSERT NEXT ITEM]?
a. Pray or read the Scripture with [IF ONE CHILD, INSERT: your child; IF MORE THAN ONE CHILD: any of
your children]?
Yes No
Don’t know/
Refused (VOL) Total
Sample size
Total with children in home 2014 63 36 * 100 8,366
2007 63 36 1 100 10,705
Evangelical tradition 2014 85 15 * 100 2,175
2007 81 19 * 100 2,851
Mainline tradition 2014 63 37 * 100 1,218
2007 61 38 1 100 1,861
Historically black Protestant tradition 2014 85 15 0 100 487
2007 77 22 * 100 670
Catholic 2014 64 36 * 100 1,761
2007 63 37 * 100 2,678
Mormon 2014 93 7 0 100 242
2007 91 9 0 100 249
Jewish 2014 49 51 * 100 184
2007 41 59 0 100 167
Other faiths 2014 34 66 0 100 129
2007 40 59 1 100 126
Unaffiliated 2014 28 72 * 100 1,744
2007 31 68 1 100 1,502
Orthodox Christian, Jehovah’s Witness, Other Christian, Muslim, Buddhist, Hindu not shown due to insufficient sample size.

52
PEW RESEARCH CENTER
www.pewresearch.org
ASK IF R IS PARENT/GUARDIAN OF CHILDREN UNDER 18 YEARS: Q.K10 As I read a list, please tell me if you do any of the following things with [IF ONE CHILD, INSERT:
your child; IF MORE THAN ONE CHILD, INSERT: your children]. First, do you [INSERT IN ORDER]? Next, do you [INSERT NEXT ITEM]?
b. Send [IF ONE CHILD, INSERT: your child; IF MORE THAN ONE CHILD, INSERT: any of your children]
to Sunday school or another religious education program?
Yes No
Don’t know/
Refused (VOL) Total
Sample size
Total with children in home 2014 55 44 1 100 8,366
2007 60 40 1 100 10,705
Evangelical tradition 2014 77 23 1 100 2,175
2007 79 21 * 100 2,851
Mainline tradition 2014 59 41 1 100 1,218
2007 62 37 * 100 1,861
Historically black Protestant tradition 2014 73 27 * 100 487
2007 77 22 1 100 670
Catholic 2014 50 49 1 100 1,761
2007 51 48 * 100 2,678
Mormon 2014 87 13 0 100 242
2007 90 10 0 100 249
Jewish 2014 62 38 0 100 184
2007 56 44 0 100 167
Other faiths 2014 37 61 1 100 129
2007 41 59 0 100 126
Unaffiliated 2014 27 72 * 100 1,744
2007 35 64 1 100 1,502
Orthodox Christian, Jehovah’s Witness, Other Christian, Muslim, Buddhist, Hindu not shown due to insufficient sample size.

53
ONE-IN-FIVE U.S. ADULTS WERE RAISED IN INTERFAITH HOMES
www.pewresearch.org
ASK IF R IS PARENT/GUARDIAN OF CHILDREN UNDER 18 YEARS: Q.K10 As I read a list, please tell me if you do any of the following things with [IF ONE CHILD, INSERT:
your child; IF MORE THAN ONE CHILD, INSERT: your children]. First, do you [INSERT IN ORDER]? Next, do you [INSERT NEXT ITEM]?
c. home school or send [IF ONE CHILD, INSERT: your child; IF MORE THAN ONE CHILD, INSERT: any of
your children] to a religious school instead of a public school?
Yes No
Don’t know/
Refused (VOL) Total
Sample size
Total with children in home 2014 15 85 1 100 8,366
2007 15 85 1 100 10,705
Evangelical tradition 2014 19 80 1 100 2,175
2007 18 81 1 100 2,851
Mainline tradition 2014 11 88 1 100 1,218
2007 10 89 1 100 1,861
Historically black Protestant tradition 2014 13 86 1 100 487
2007 11 89 * 100 670
Catholic 2014 18 81 * 100 1,761
2007 20 79 1 100 2,678
Mormon 2014 11 89 0 100 242
2007 6 94 0 100 249
Jewish 2014 32 68 0 100 184
2007 27 73 0 100 167
Other faiths 2014 14 85 1 100 129
2007 10 90 0 100 126
Unaffiliated 2014 7 92 1 100 1,744
2007 7 93 1 100 1,502
Orthodox Christian, Jehovah’s Witness, Other Christian, Muslim, Buddhist, Hindu not shown due to insufficient sample size.

54
PEW RESEARCH CENTER
www.pewresearch.org
ASK IF R IS PARENT/GUARDIAN OF CHILDREN UNDER 18 YEARS: Q.K10 As I read a list, please tell me if you do any of the following things with [IF ONE CHILD, INSERT:
your child; IF MORE THAN ONE CHILD, INSERT: your children]. First, do you [INSERT IN ORDER]? Next, do you [INSERT NEXT ITEM]?
d. and [IF ONE CHILD, INSERT: your child; IF MORE THAN ONE CHILD, INSERT: any of your children] do
volunteer work together?
Yes No
Don’t know/
Refused (VOL) Total
Sample size
Total with children in home 46 54 * 100 8,366
Evangelical tradition 50 50 * 100 2,175
Mainline tradition 49 50 1 100 1,218
Historically black Protestant tradition 41 58 * 100 487
Catholic 43 56 1 100 1,761
Mormon 71 29 0 100 242
Jewish 50 49 1 100 184
Other faiths 52 48 0 100 129
Unaffiliated 37 63 * 100 1,744
Orthodox Christian, Jehovah’s Witness, Other Christian, Muslim, Buddhist, Hindu not shown due to insufficient sample size.