numerical modelling of reinforced concrete slender walls
TRANSCRIPT
Cheng and Zhang Int J Concr Struct Mater (2021) 15:33 https://doi.org/10.1186/s40069-021-00471-y
RESEARCH
Numerical Modelling of Reinforced Concrete Slender Walls Subjected to Coupled Axial Tension–FlexureXiaowei Cheng* and Haoyou Zhang
Abstract
Under strong earthquakes, reinforced concrete (RC) walls in high-rise buildings, particularly in wall piers that form part of a coupled or core wall system, may experience coupled axial tension–flexure loading. In this study, a detailed finite element model was developed in VecTor2 to provide an effective tool for the further investigation of the seismic behaviour of RC walls subjected to axial tension and cyclic lateral loading. The model was verified using experimental data from recent RC wall tests under axial tension and cyclic lateral loading, and results showed that the model can accurately capture the overall response of RC walls. Additional analyses were conducted using the developed model to investigate the effect of key design parameters on the peak strength, ultimate deformation capacity and plastic hinge length of RC walls under axial tension and cyclic lateral loading. On the basis of the analysis results, useful infor-mation were provided when designing or assessing the seismic behaviour of RC slender walls under coupled axial tension–flexure loading.
Keywords: reinforced concrete wall, coupled axial tension–flexure, finite element model, strength and deformation capacity, equivalent plastic hinge length
© The Author(s) 2021. This article is licensed under a Creative Commons Attribution 4.0 International License, which permits use, sharing, adaptation, distribution and reproduction in any medium or format, as long as you give appropriate credit to the original author(s) and the source, provide a link to the Creative Commons licence, and indicate if changes were made. The images or other third party material in this article are included in the article’s Creative Commons licence, unless indicated otherwise in a credit line to the material. If material is not included in the article’s Creative Commons licence and your intended use is not permitted by statutory regulation or exceeds the permitted use, you will need to obtain permission directly from the copyright holder. To view a copy of this licence, visit http:// creat iveco mmons. org/ licen ses/ by/4. 0/.
1 IntroductionShear walls are typically the major lateral load-carrying structures in high-rise buildings. Under strong ground motion, some reinforced concrete (RC) shear walls may be subjected to combined axial tensile forces and shear forces. In such a critical loading condition, RC walls are susceptible to substantial structural damage and failure, as observed in the collapse of Alto Rio apartment in the 2010 Chile earthquake (Kato et al., 2010). The collapsed Alto Rio apartment was composed of RC shear walls, with 15 stories aboveground and two stories of basement. Significant fracture of longitudinal rebar was observed in the bottom shear walls, indicating that the collapse of the Alto Rio apartment was attributed to combined
tension-bending–shear load induced by strong seis-mic load (Song et al., 2012). Past research indicates that axial tension leads to decreased stiffness and strength of RC walls, and consequently results in lateral force redis-tribution among walls (Aktan & Bertero, 1984; Paulay & Santhakumar, 1976). Therefore, in seismic design of high-rise buildings, special attention shall be given to RC walls subjected to coupled axial tension and horizontal loading.
In recent years, numerous studies on RC walls have focused on the seismic performance of RC walls under axial compression-flexure and compression-shear, but only a few has focused on RC walls under coupled axial tension–flexure or tension–shear. Recently, an increased attention has been given to the behaviour of RC walls under these complicated loading conditions. Structural walls are generally classified by wall aspect ratio or shear-to-span ratio. The slender wall (also named as “high-aspect-ratio wall”) is usually defined for walls having
Open Access
International Journal of ConcreteStructures and Materials
*Correspondence: [email protected] Laboratory of Urban Security and Disaster Engineering of Ministry of Education, Beijing University of Technology, Beijing, ChinaJournal information: ISSN 1976-0485 / eISSN 2234-1315
Page 2 of 20Cheng and Zhang Int J Concr Struct Mater (2021) 15:33
aspect ratio greater than approximately 2.0. The squat wall (also named as “low-aspect-ratio wall”) is defined for walls having aspect ratio less than approximately 1.0. The walls between these aspect ratios are referred to as the moderate-aspect-ratio wall. Ji et al. (2018), Nie et al. (2020) presented the coupled axial tension–shear behaviour of low-aspect-ratio RC walls. The test results indicated that axial tensile force significantly affects the failure modes, shear stiffness and lateral strength of RC walls. Design formulae of shear stiffness and strength of RC walls under axial tension were estimated using the test data. A series of tests of moderate-aspect-ratio RC walls subjected to axial tension and cyclic lateral load-ing were conducted (Lai, 2015; Ren, 2018; Wang et al., 2017). Various failure modes, which are related to the magnitude of applied axial tension and steel reinforce-ment ratio, were observed in these moderate-aspect-ratio RC walls. Cheng et al. (2019) conducted a series of tests of larger-aspect-ratio RC walls subjected to axial tension and cyclic lateral loading. Two failure modes, including flexural-sliding failure and flexural failure, were observed in the test with an increase of axial tensile force. Besides, some researchers (Wang et al., 2018, 2019; Yao, 2015) conducted the tension–flexure and tension–shear behav-iour of steel plate reinforced concrete (SRC) composite walls and steel tube reinforced concrete (STRC) walls. Tests results indicated that the axial tensile force also decreased the lateral strength capacity and stiffness of steel plate reinforced concrete (SRC) walls and steel tube reinforced concrete (STRC) walls, and special attention should be paid for the interface of wall–foundation to prohibit the sliding failure. In summary, the applied axial tensile force significantly decreased the lateral strength capacity and stiffness of RC walls, SRC walls and STRC walls.
Although, four large-scale rectangular RC slender walls under combined constant axial tension and cyclic lateral loading were tested by Cheng et al. (2019), the four tested walls had identical geometry dimensions and reinforce-ment details, except for the constant axial tensile force. Other important variables, such as horizontally and ver-tically distributed reinforcement, boundary longitudi-nal reinforcement, concrete strength and shear-to-span ratio, were not investigated in this test. To investigate a wide range of parameters for RC walls under axial ten-sion, a numerical model which can accurately capture overall and local responses is required. Note that despite the existence of extensive modelling techniques for RC walls, few numerical models have been developed or ver-ified for RC slender walls under axial tension and flexural loading, especially for flexural-sliding failure modes.
This study aimed to develop a reliable model of RC walls that can accurately capture the tension–flexure
overall response in addition to local response, such as crack patterns and failure modes. A detailed finite ele-ment model (FEM) was developed using plane stress membrane elements in VecTor2 and verified against experimental results from recent tests on RC walls under axial tension and cyclic lateral loading. Additional analyses were conducted using the developed model to investigate the effect of key design parameters that are considered important for RC walls under axial tension and cyclic lateral loading but have not previously been investigated experimentally. On the basis of the analysis results, key design parameters of RC slender walls under coupled axial tension–flexure were discussed, recom-mendations were provided when designing or assessing the seismic behaviour of RC slender walls under coupled axial tension–flexure. It is acknowledged that the load-ing pattern in this study, combined with initially applied constant axial tensile forces and increased cyclic lateral loads, may not exactly represent the actual loading con-dition of walls in a high-rise building. For example, in a couple wall system, the wall pier would be subjected to varied axial tensile forces at different lateral drifts, and the axial forces would change from tension to compres-sion during the lateral drift reversal. Nevertheless, the loading pattern in this study provides an effective way to examine how different magnitudes of axial tension influ-ence the flexural behaviour of the RC walls, which is the main objective of the study. The influence of loading his-tory on the crack pattern and behaviour of the walls is out of the scope of this paper and is left for future study.
2 Numerical Model for RC Walls Under Coupled Axial Tension–Flexure
2.1 Review of Test WallsFour large-scale RC rectangular slender walls (labelled as HSW1 to HSW4) under combined constant axial ten-sion and cyclic lateral loading were tested by Cheng et al. (2019). The four tested RC rectangular walls had iden-tical geometry dimensions and reinforcement details (as shown in Fig. 1), except for the applied axial tensile force. The tested walls had 1.5 m in length, 0.18 m in thickness and 2.7 m in clear height. The boundary ele-ment comprised eight D14 longitudinal steel rebar and the transverse reinforcement is D8 at a spacing of 100, corresponding to 2.3% boundary longitudinal reinforce-ment ratio and 1.5% volumetric transverse reinforcement ratio, respectively. The vertically and horizontally distrib-uted reinforcement were D10 at a spacing of 150 mm and D8 at a spacing of 100 mm, corresponding to 0.58% and 0.56% reinforcement ratios, respectively. The measured reinforcement yield strength, ultimate strength and ulti-mate strain are shown in Table 1.

Page 3 of 20Cheng and Zhang Int J Concr Struct Mater (2021) 15:33
Table 2 summarises the values of axial tensile force Nt and the corresponding normalised concrete tensile stress (nc) and normalised reinforcement tensile stress
ns for each test wall. The normalised concrete tensile stress nc is used to quantify the degree of axial tensile force which is less than crack strength, which is taken as nc = Nt/(Ac + AsEs/Ec)ft, where Nt denotes the axial ten-sile force of the wall, Ac denotes the cross-sectional area
Fig. 1 Geometry and reinforcement of specimens (units: mm).
Table 1 Material properties of steel rebar used in experimental specimens.
Diameter (mm) Yield strength fy (MPa)
Ultimate strength fu (MPa)
Ultimate strain δ (%)
8 426.3 555.2 12.6
10 396.3 555.3 11.4
14 466.7 539.4 7.9
Table 2 Axial tensile force values of RC wall specimens.
Spec. no HSW1 HSW2 HSW3 HSW4
Nt / (kN) 322 538 897 1291
nc 0.33 0.73 0.98 1.73
ns 0.23 0.38 0.63 0.91
Page 4 of 20Cheng and Zhang Int J Concr Struct Mater (2021) 15:33
of concrete, As denotes the cross-sectional area of verti-cal reinforcement (including vertically distributed rebar and boundary longitudinal rebar), Es and Ec denote the elastic modulus of steel and concrete, respectively, and fy and ft denote the tensile yield strength of steel rebar and axial tensile strength of concrete, respectively. For the applied axial tensile force exceeded crack strength, con-crete sustains tensile cracking and the tensile force is carried only by vertical reinforcement at cracked sec-tions. Therefore, normalised reinforcement tensile stress (ns) is used to quantify the degree of axial tensile force, which is taken as ns = Nt/Asfy. Two failure modes, includ-ing flexural-sliding failure (for specimens HSW1 ~ HSW3 with ns = 0.23 ~ 0.63) and flexural failure (for specimen HSW4 with ns = 0.91) were observed in the tests. More detailed information on these tests can be found else-where (Cheng et al., 2019).
2.2 Model DescriptionSeveral remarkable numerical models have been devel-oped to simulate the nonlinear cyclic response of RC walls subjected to axial force and shear loading. These models mainly included the smeared crack models in which the cracks are smeared over the whole concrete material, and the strength and stiffness degradation of concrete are represented by the propagation of the cracks (Hsu, 1988, Hsu & Zhu, 2002; Vecchio & Collins, 1986, Vecchio, 2000) and damage plasticity models that the
material degradation is generalised as an internal vari-able, and the damage and plasticity are well used together to represent the mechanical behaviour of concrete (Caner & Bazant, 2013; Cervenka, 1970; Feng et al., 2018; Wu & Li, 2007).
In this study, two-dimensional nonlinear finite ele-ment program VecTor2 (Wong et al., 2013) was used to develop a finite element model (FEM) for RC walls. VecTor2 is based on modified compression field theory (MCFT) (Vecchio & Collins, 1986) and disturbed stress field model (DSFM) (Vecchio, 2000), in which concrete is modelled as an orthotropic material with smeared cracks (smeared crack models). In this study, the numerical model is based on disturbed stress field model (DSFM), which decoupled the orientation of the principal stress and principal strain field, resulting in a smeared delayed rotating-crack model (Vecchio, 2000). Additionally, Vec-Tor2 uses state-of-the-art material models that can con-sider the compression softening and tension stiffening of concrete, the shear sliding along cracks and the dowel action offered by the reinforcement crossing the cracks. Therefore, VecTor2 has been used by numerous research-ers to predict the lateral cyclic response of RC walls (Cor-tes-Puentes & Palermo, 2011; Lu et al., 2017; Luu et al., 2012; Hoult, 2017, Hoult et al., 2018a, 2018b; Palermo & Vecchio, 2004, 2007).
The FEM was built for the test wall specimens with identical dimensions, material properties and
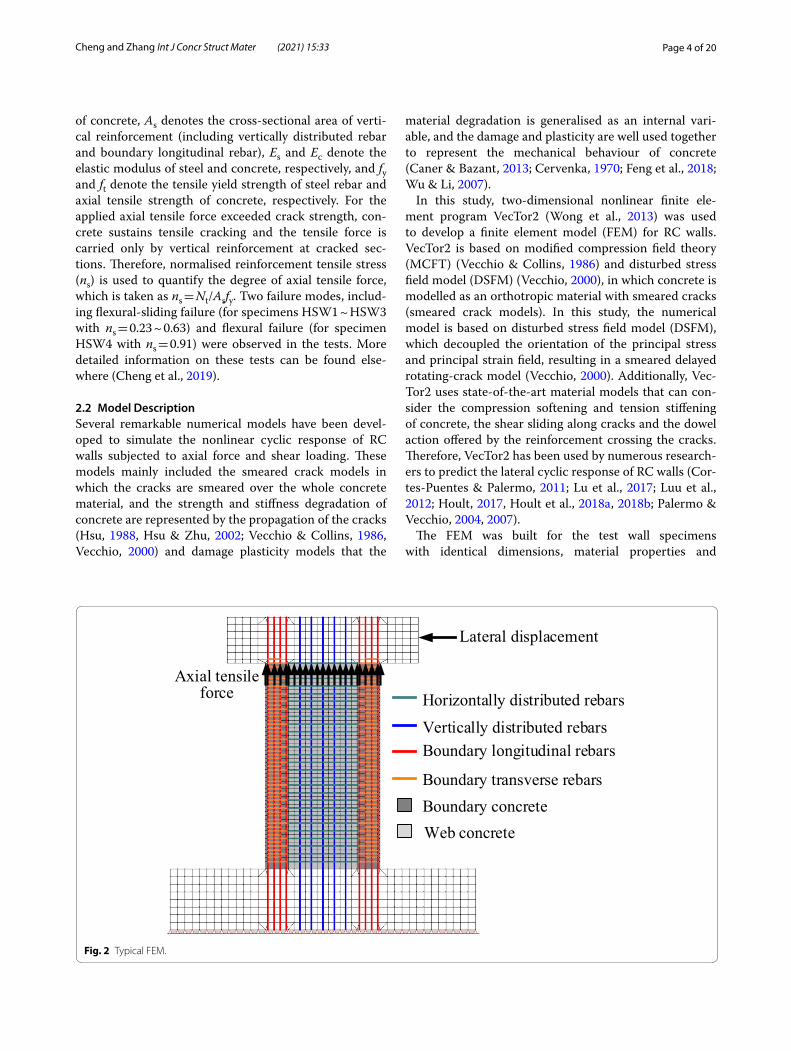
Fig. 2 Typical FEM.
Page 5 of 20Cheng and Zhang Int J Concr Struct Mater (2021) 15:33
reinforcement details, as shown in Fig. 2. Four-node quadrilateral elements were used to model the concrete, while the all reinforcement in walls was modelled explic-itly by truss elements. The reinforcement in the foun-dation and loading beams were modelled as smeared reinforcement with an identical reinforcement ratio with test wall specimens. The bond slip between concrete and reinforcement was not included in this FEM. Figure 2 also depicts a typical mesh size of FEM. The wall was divided into 22 and 35 mesh elements in the length and height direction, respectively; these elements can best represent the wall behaviour after conducting a mesh sensitivity study that will be presented later. The elements’ aspect ratios (height-to-length ratios) were less than 1.5 except to cover concrete that the mesh size was governed by the wall cover dimensions (Wong et al., 2013). Axial tensile force was firstly applied to the nodes of the loading beam uniformly and held constant during the model analyses. Thereafter, cyclic lateral displacement was applied at the middle of the loading beam. All nodes at the base of the foundation beam were entirely fixed to represent the anchorage of the foundation beam to the laboratory floor.
Table 3 lists the material constitutive models used in modelling the concrete and reinforcement. The Hog-nestad model (Hognestad, 1951) and Kent–Park formula-tion (Scott et al., 1982) were used to model the pre-peak and post-peak responses of concrete in compression, respectively, as shown in Fig. 3a. The stress–strain response of concrete in tension was modelled by a Modi-fied Bentz model (Wong et al., 2013), as shown in Fig. 3c. The tension softening curve descends linearly from the cracking stress and strain to zero stress at the charac-teristic strain (Wong et al., 2013). The tension softening stiffness was decided based on fracture energy criterion that is independent of element size (Wong et al., 2013).
The hysteric response of concrete was modelled on the basis of the Palermo model proposed by Palermo & Vec-chio (2007), as shown in Fig. 3b. The effect of concrete confinement provided by closed stirrups at wall bounda-ries was considered in accordance with the Kupfer/Rich-ard confinement strength model (Kupfer et al., 1969). The Mohr–Coulomb criterion was used to determine the fail-ure stress and failure plane for concrete. The model also considered the lateral expansion effects of concrete using the Kupfer variable Poisson’s ratio model (Kupfer et al., 1969). The shear slip analysis after concrete cracking was calculated using the Vecchio–Lai (cyclic) model proposed by Vecchio and Lai, (2004). The hysteretic behaviour of the steel reinforcement was modelled in accordance with the Seckin model (Seckin, 1981), as shown in Fig. 3d. The fracture behaviour of steel rebar was also considered based on the ultimate strain from standard rebar ten-sile tests, as shown in Table 1. It needs to be noted that due to possible low cycle fatigue of steel rebar, 0.6 time ultimate strain found from monotonic testing was used for cyclic behaviour analysis of RC walls as suggested by Priestley et al. (2007). The dowel action offered by rein-forcement crossing cracks was modelled by the Tassios model, which is based on beam-on-an-elastic-concrete-foundation theory (He & Kwan, 2001). It needs to be noted that the sliding failure induced by sliding deforma-tion of wall–foundation interface was often simulated by discrete element (Feenstra et al., 1991; Figueira et al., 2020; He & Kwan, 2001), which incorporated the consti-tutive model of dowel action of reinforcement and aggre-gate interlock of concrete. In this study, the sliding failure was simulated base on the concrete and steel material model in the software Vector2, and the numerical results showed the method provided reasonably simulation for sliding failure of RC wall. Besides, geometric nonlinearity
Table 3 Material constitutive models used in the RC wall model.
Materials Parameters Models used in FE analysis
Concrete Concrete compressivePre-peak
Hognestad model (Hognestad, 1951)
Concrete compressivePost-peak
Kent–Park model (Scott et al., 1982)
Tension stiffening Modified Bentz model (Wong et al., 2013)
Tension softening Linear (Wong et al., 2013)
Hysteretic response Palermo model (Palermo & Vecchio, 2007)
Confinement strength Kupfer/Richart model (Kupfer et al., 1969)
Cracking criterion Mohr–Coulomb (stress)
Dilation Variable-Kupfer (Kupfer et al., 1969)
Crack slid calculate Vecchio–Lai (cyclic) (Vecchio & Lai, 2004)
Reinforcement Hysteric response Seckin (Seckin, 1981)
Dowel action Tassios model (He & Kwan, 2001)

Page 6 of 20Cheng and Zhang Int J Concr Struct Mater (2021) 15:33
is used to consider secondary displacements and P-Delta effects and other large displacements in this numerical model.
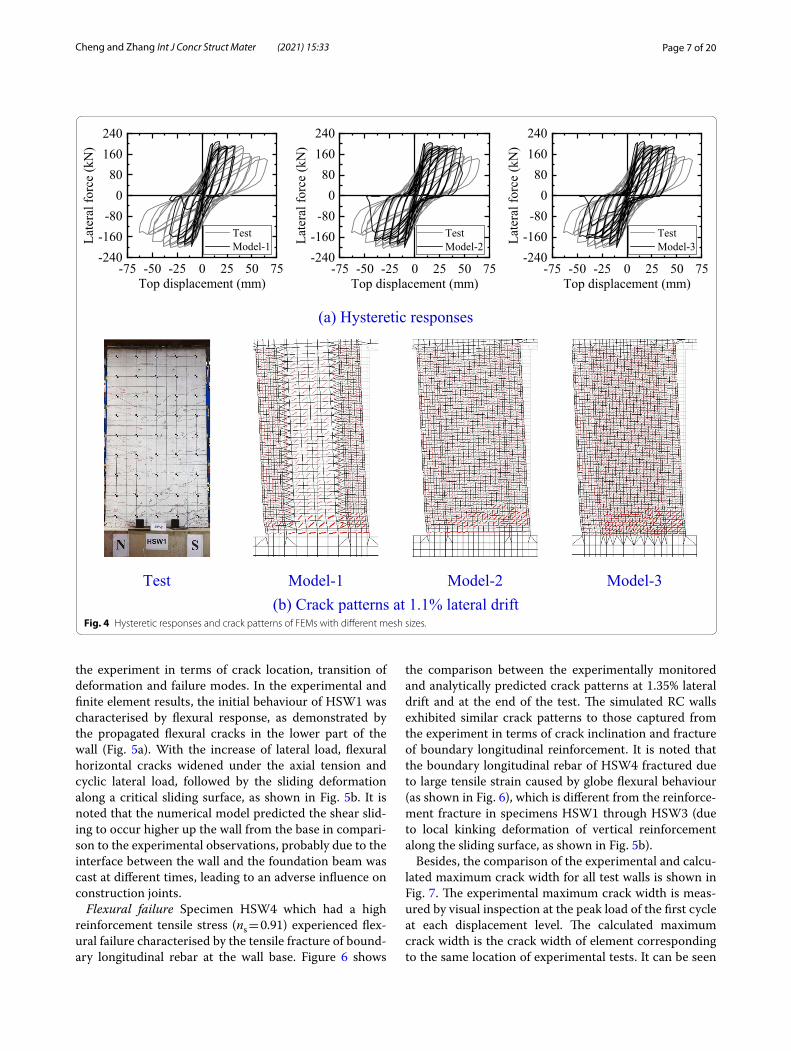
3 Validation of the FEM3.1 Sensitivity of the Mesh SizeThe sensitivity of the mesh size was considered during the development of FEM. Three models with different num-bers of elements (labelled as Model-1 to Model-3) for HSW1 were formed to investigate the sensitivity of the mesh size. Figure 4 shows the comparison of hysterical response and crack patterns at 1.1% lateral drift between the finite-element analysis and test results. It is clear that the two hysteretic curves of Model-2 and Model-3 are very similar with an insignificant difference (less than 3%) in peak strength and correlate well with test results until strength degradation. Model-1 with a coarse mesh appears to underestimate the deformation capacity of HSW1 seriously. Despite a similar global hysteretic response, the predicted crack patterns of HSW1 at 1.1% lateral drift vary substantially amongst the three models with different mesh sizes, as shown in Fig. 4b. Model-2 and Model-3 can capture the dominant discrete cracks
that were observed during the test. By contrast, the mesh size of Model-1 was too coarse to capture the formation of discrete primary flexural cracks. On the basis of the results of the mesh sensitivity study and the recommen-dation of element size by Hoult (2017), Model-2 with ele-ment sizes of 75 mm and 50 mm in length (X direction) and height direction (Y direction) was recommended for use in the subsequent study.
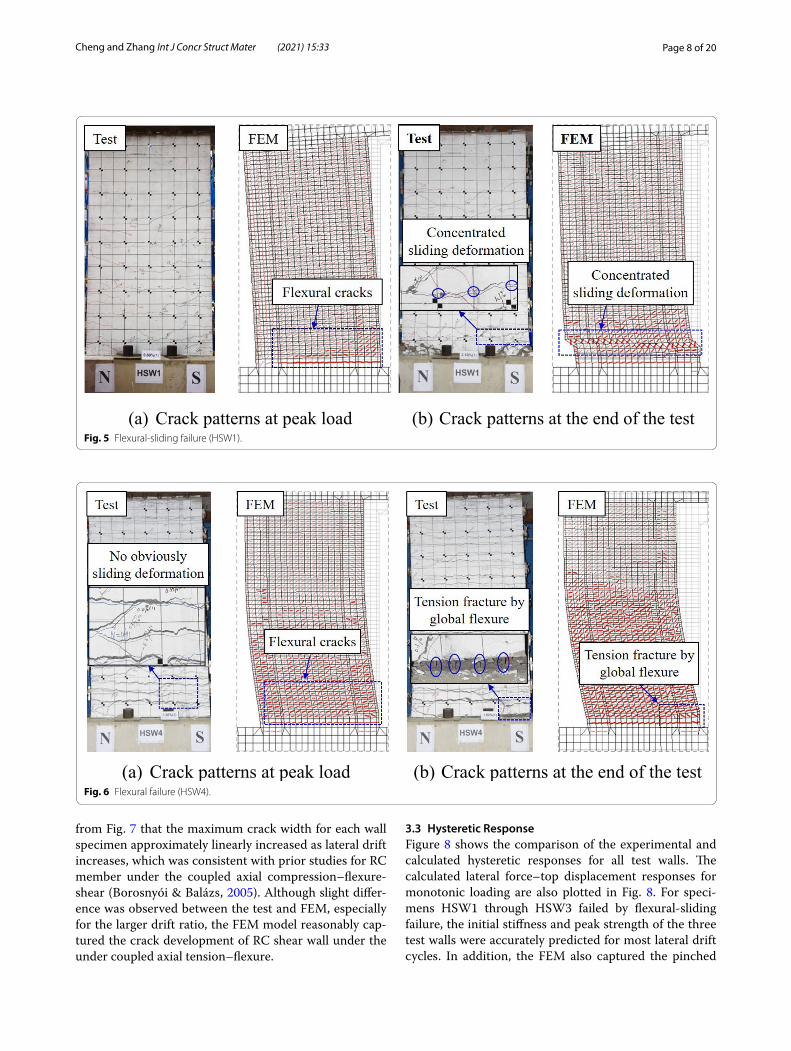
3.2 Crack Patterns and Failure ModesFlexural-sliding failure Specimens HSW1 through HSW3 sustained flexural-sliding failure, which is character-ised by a transition from the initial yielding of the wall’s boundary longitudinal rebar mainly induced by flex-ural deformation to the sliding failure along the critical crack surface (Cheng et al., 2019). In this study, specimen HSW1 was taken as an example for illustration of the accuracy of this FEM in modelling the crack patterns and failure modes of flexural-sliding failure. Figure 5 shows the comparison between the experimentally monitored and analytically predicted crack patterns at the peak load and at the end of the test. Generally, the simulated HSW1 exhibited similar crack patterns to those captured from
Fig. 3 Material constitutive models used in the RC wall model.
Page 7 of 20Cheng and Zhang Int J Concr Struct Mater (2021) 15:33
the experiment in terms of crack location, transition of deformation and failure modes. In the experimental and finite element results, the initial behaviour of HSW1 was characterised by flexural response, as demonstrated by the propagated flexural cracks in the lower part of the wall (Fig. 5a). With the increase of lateral load, flexural horizontal cracks widened under the axial tension and cyclic lateral load, followed by the sliding deformation along a critical sliding surface, as shown in Fig. 5b. It is noted that the numerical model predicted the shear slid-ing to occur higher up the wall from the base in compari-son to the experimental observations, probably due to the interface between the wall and the foundation beam was cast at different times, leading to an adverse influence on construction joints.
Flexural failure Specimen HSW4 which had a high reinforcement tensile stress (ns = 0.91) experienced flex-ural failure characterised by the tensile fracture of bound-ary longitudinal rebar at the wall base. Figure 6 shows
the comparison between the experimentally monitored and analytically predicted crack patterns at 1.35% lateral drift and at the end of the test. The simulated RC walls exhibited similar crack patterns to those captured from the experiment in terms of crack inclination and fracture of boundary longitudinal reinforcement. It is noted that the boundary longitudinal rebar of HSW4 fractured due to large tensile strain caused by globe flexural behaviour (as shown in Fig. 6), which is different from the reinforce-ment fracture in specimens HSW1 through HSW3 (due to local kinking deformation of vertical reinforcement along the sliding surface, as shown in Fig. 5b).
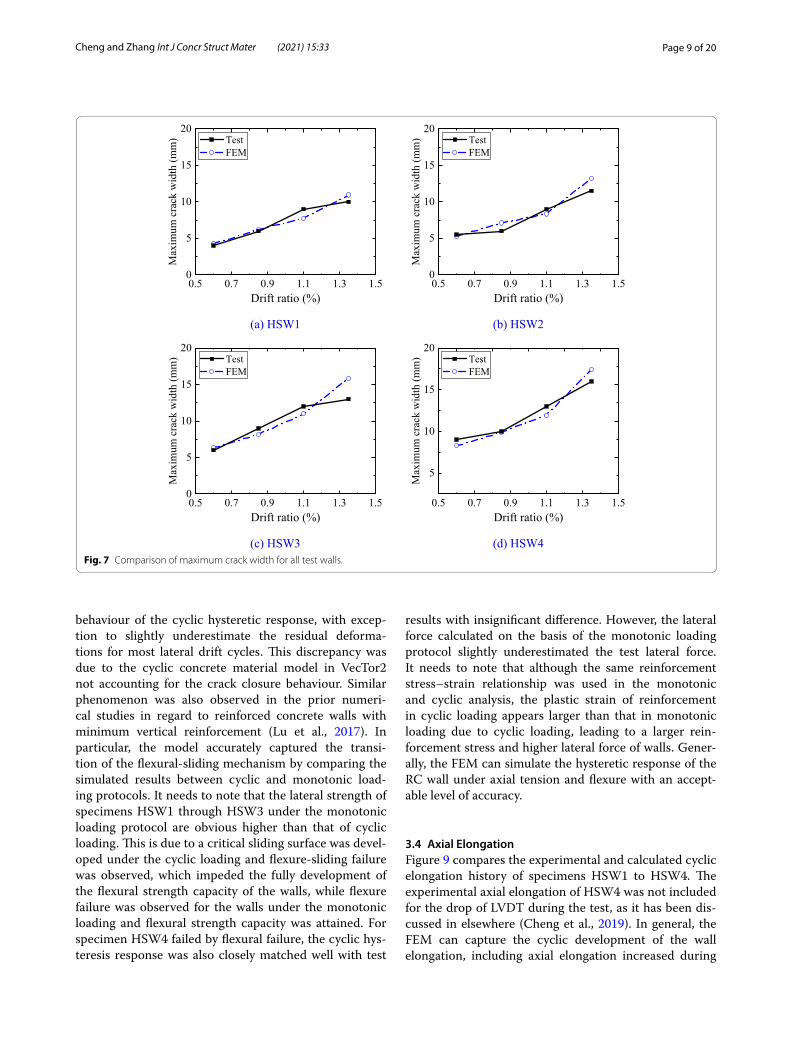
Besides, the comparison of the experimental and calcu-lated maximum crack width for all test walls is shown in Fig. 7. The experimental maximum crack width is meas-ured by visual inspection at the peak load of the first cycle at each displacement level. The calculated maximum crack width is the crack width of element corresponding to the same location of experimental tests. It can be seen
Fig. 4 Hysteretic responses and crack patterns of FEMs with different mesh sizes.
Page 8 of 20Cheng and Zhang Int J Concr Struct Mater (2021) 15:33
from Fig. 7 that the maximum crack width for each wall specimen approximately linearly increased as lateral drift increases, which was consistent with prior studies for RC member under the coupled axial compression–flexure-shear (Borosnyói & Balázs, 2005). Although slight differ-ence was observed between the test and FEM, especially for the larger drift ratio, the FEM model reasonably cap-tured the crack development of RC shear wall under the under coupled axial tension–flexure.
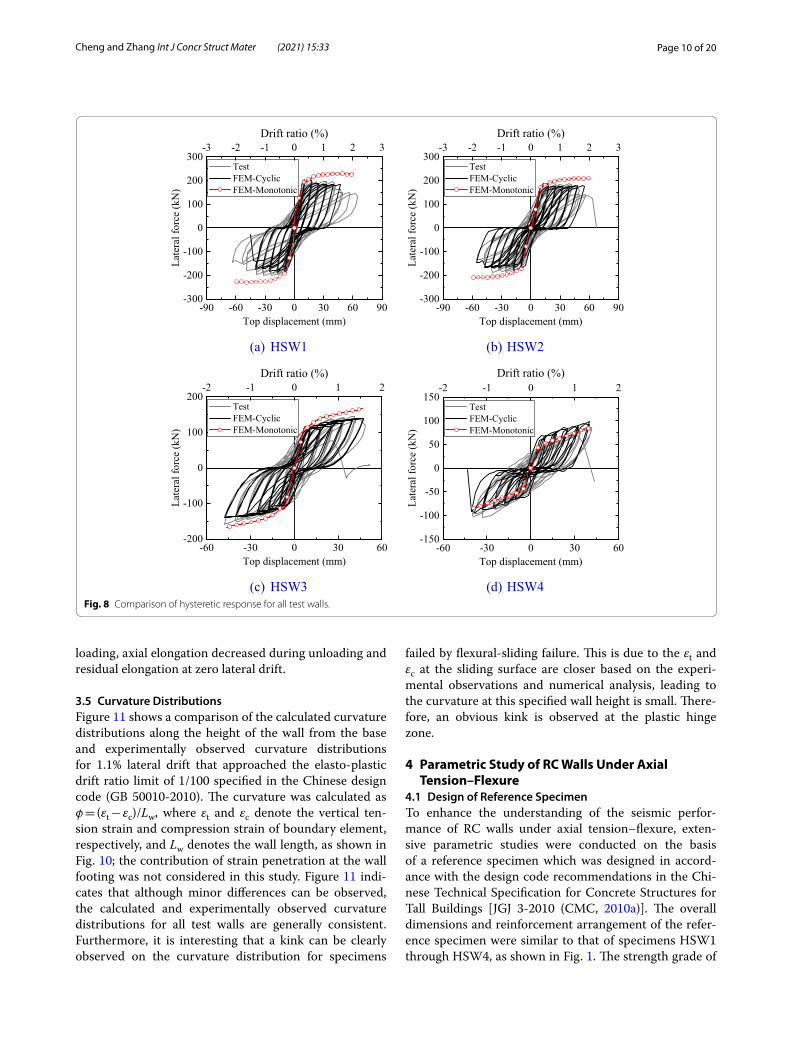
3.3 Hysteretic ResponseFigure 8 shows the comparison of the experimental and calculated hysteretic responses for all test walls. The calculated lateral force–top displacement responses for monotonic loading are also plotted in Fig. 8. For speci-mens HSW1 through HSW3 failed by flexural-sliding failure, the initial stiffness and peak strength of the three test walls were accurately predicted for most lateral drift cycles. In addition, the FEM also captured the pinched
Fig. 5 Flexural-sliding failure (HSW1).
Fig. 6 Flexural failure (HSW4).
Page 9 of 20Cheng and Zhang Int J Concr Struct Mater (2021) 15:33
behaviour of the cyclic hysteretic response, with excep-tion to slightly underestimate the residual deforma-tions for most lateral drift cycles. This discrepancy was due to the cyclic concrete material model in VecTor2 not accounting for the crack closure behaviour. Similar phenomenon was also observed in the prior numeri-cal studies in regard to reinforced concrete walls with minimum vertical reinforcement (Lu et al., 2017). In particular, the model accurately captured the transi-tion of the flexural-sliding mechanism by comparing the simulated results between cyclic and monotonic load-ing protocols. It needs to note that the lateral strength of specimens HSW1 through HSW3 under the monotonic loading protocol are obvious higher than that of cyclic loading. This is due to a critical sliding surface was devel-oped under the cyclic loading and flexure-sliding failure was observed, which impeded the fully development of the flexural strength capacity of the walls, while flexure failure was observed for the walls under the monotonic loading and flexural strength capacity was attained. For specimen HSW4 failed by flexural failure, the cyclic hys-teresis response was also closely matched well with test
results with insignificant difference. However, the lateral force calculated on the basis of the monotonic loading protocol slightly underestimated the test lateral force. It needs to note that although the same reinforcement stress–strain relationship was used in the monotonic and cyclic analysis, the plastic strain of reinforcement in cyclic loading appears larger than that in monotonic loading due to cyclic loading, leading to a larger rein-forcement stress and higher lateral force of walls. Gener-ally, the FEM can simulate the hysteretic response of the RC wall under axial tension and flexure with an accept-able level of accuracy.
3.4 Axial ElongationFigure 9 compares the experimental and calculated cyclic elongation history of specimens HSW1 to HSW4. The experimental axial elongation of HSW4 was not included for the drop of LVDT during the test, as it has been dis-cussed in elsewhere (Cheng et al., 2019). In general, the FEM can capture the cyclic development of the wall elongation, including axial elongation increased during
Fig. 7 Comparison of maximum crack width for all test walls.
Page 10 of 20Cheng and Zhang Int J Concr Struct Mater (2021) 15:33
loading, axial elongation decreased during unloading and residual elongation at zero lateral drift.
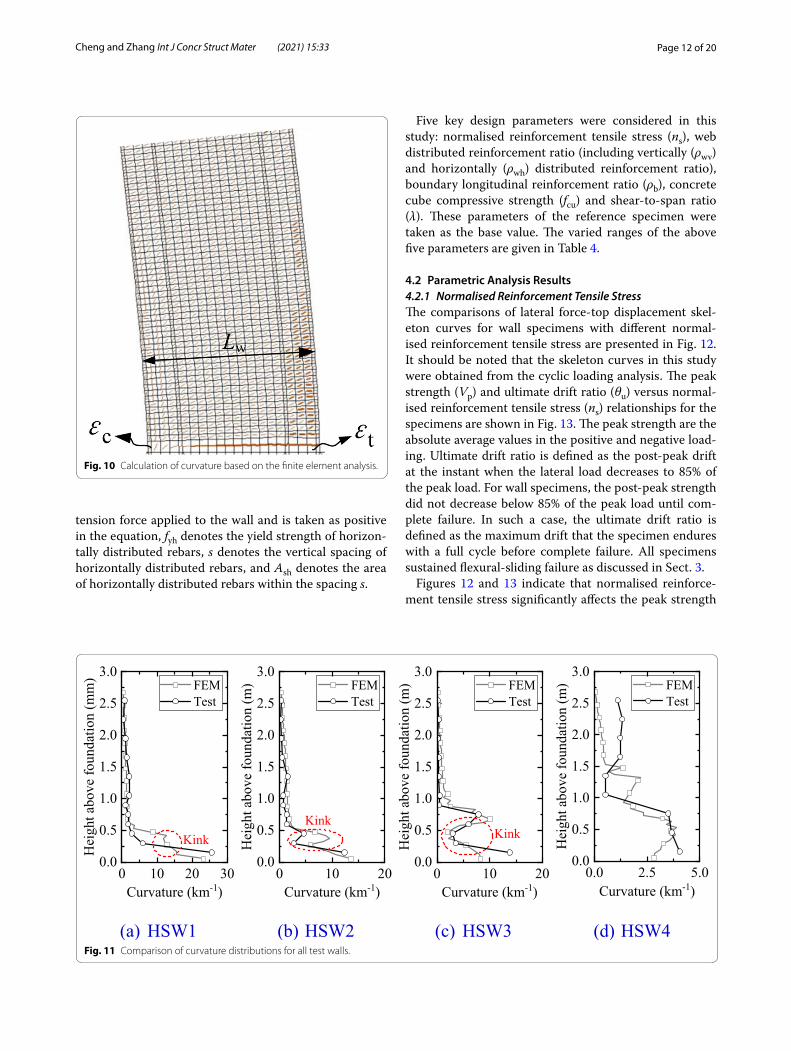
3.5 Curvature DistributionsFigure 11 shows a comparison of the calculated curvature distributions along the height of the wall from the base and experimentally observed curvature distributions for 1.1% lateral drift that approached the elasto-plastic drift ratio limit of 1/100 specified in the Chinese design code (GB 50010-2010). The curvature was calculated as φ = (εt − εc)/Lw, where εt and εc denote the vertical ten-sion strain and compression strain of boundary element, respectively, and Lw denotes the wall length, as shown in Fig. 10; the contribution of strain penetration at the wall footing was not considered in this study. Figure 11 indi-cates that although minor differences can be observed, the calculated and experimentally observed curvature distributions for all test walls are generally consistent. Furthermore, it is interesting that a kink can be clearly observed on the curvature distribution for specimens
failed by flexural-sliding failure. This is due to the εt and εc at the sliding surface are closer based on the experi-mental observations and numerical analysis, leading to the curvature at this specified wall height is small. There-fore, an obvious kink is observed at the plastic hinge zone.
4 Parametric Study of RC Walls Under Axial Tension–Flexure
4.1 Design of Reference SpecimenTo enhance the understanding of the seismic perfor-mance of RC walls under axial tension–flexure, exten-sive parametric studies were conducted on the basis of a reference specimen which was designed in accord-ance with the design code recommendations in the Chi-nese Technical Specification for Concrete Structures for Tall Buildings [JGJ 3-2010 (CMC, 2010a)]. The overall dimensions and reinforcement arrangement of the refer-ence specimen were similar to that of specimens HSW1 through HSW4, as shown in Fig. 1. The strength grade of
Fig. 8 Comparison of hysteretic response for all test walls.

Page 11 of 20Cheng and Zhang Int J Concr Struct Mater (2021) 15:33
concrete used in the reference specimen was C40 (nomi-nal cubic compressive strength fcu = 40 MPa and design value of axial compressive strength fc,d = 19.1 MPa). Eight D12 (diameter of 12 mm) steel reinforcement were used as boundary longitudinal reinforcement, corresponding to a 1.5% reinforcement ratio (ratio of the gross cross-sectional area of the longitudinal rebar to that of the boundary element). D8 steel reinforcement was used as web vertically and horizontally distributed reinforce-ment at a spacing of 150 mm, which corresponds to a 0.4% reinforcement ratio. The boundary transverse rein-forcement consisted of D8 steel rebar fabricated as rec-tangular hoops with a vertical spacing of 100 mm (1.5% volumetric transverse reinforcement ratio). The axial tensile force of the reference specimen was 362 kN, cor-responding to normalised reinforcement tensile stress ns = 0.4 and normalised concrete tensile stress nc = 0.72, which are commonly existed in the RC walls at the lower stories of super-tall buildings in accordance with the Chinese Technical Guideline of Peer Review for Seismic
Design of Super-Tall Buildings (CMC 2015b). The refer-ence specimen was designed to be flexural-critical with a ratio value of in-plane shear strength (V) to its shear force (Vf = Mu/He) corresponding to flexural strength (Mu) exceeding 4.0, He denotes wall height. The flexural strength Mu of the reference specimen was assessed using the program XTRACT for cross-section analysis, while the in-plane shear strength V was calculated on the basis of the equation specified in the Chinese Technical Specification for Concrete Structures of Tall Buildings [JGJ 3-2010 (CMC, 2010a)], as follows:
where V denotes the shear strength of the RC wall under axial tension, λ = Mhw0/V denotes the shear-to-span ratio of the wall, ft denotes the axial tensile strength of concrete in MPa, bw denotes the wall thickness, hw0 denotes the effective sectional depth of the wall, Nt denotes the axial
(1)V =
1
�− 0.5
(
0.5ftbwhw0 − 0.13Nt
)
+ fyhAsh
shw0,
Fig. 9 Comparison of axial elongation for all test walls.
Page 12 of 20Cheng and Zhang Int J Concr Struct Mater (2021) 15:33
tension force applied to the wall and is taken as positive in the equation, fyh denotes the yield strength of horizon-tally distributed rebars, s denotes the vertical spacing of horizontally distributed rebars, and Ash denotes the area of horizontally distributed rebars within the spacing s.
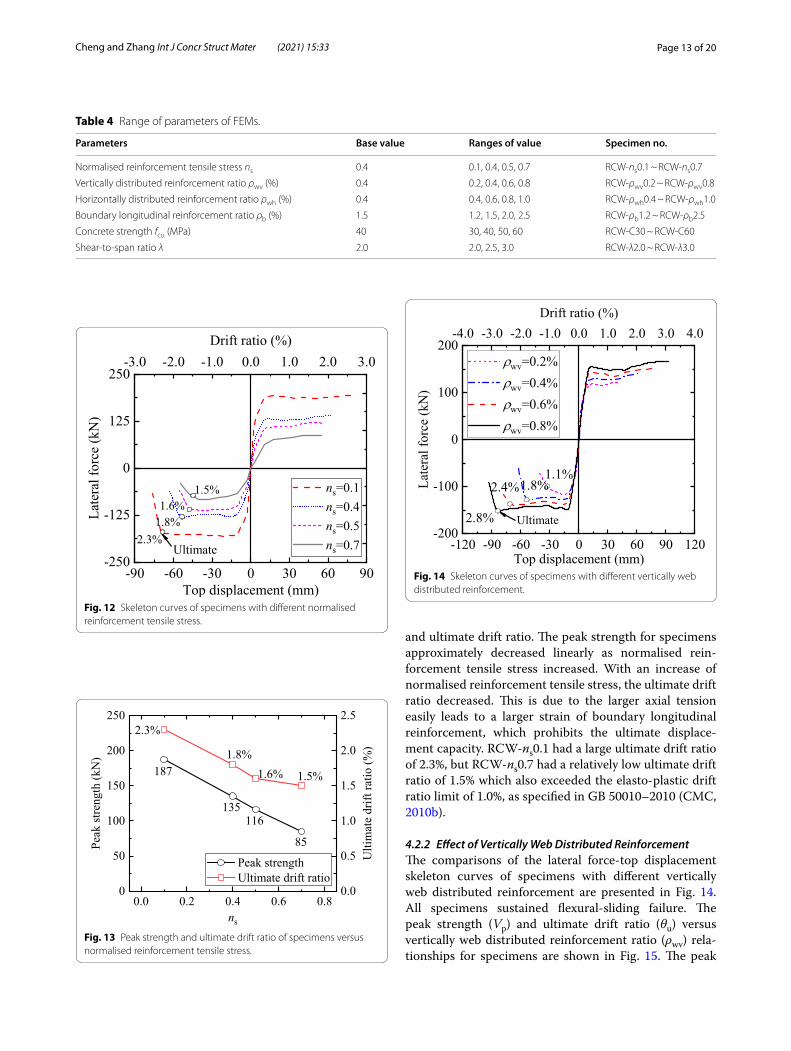
Five key design parameters were considered in this study: normalised reinforcement tensile stress (ns), web distributed reinforcement ratio (including vertically (ρwv) and horizontally (ρwh) distributed reinforcement ratio), boundary longitudinal reinforcement ratio (ρb), concrete cube compressive strength (fcu) and shear-to-span ratio (λ). These parameters of the reference specimen were taken as the base value. The varied ranges of the above five parameters are given in Table 4.
4.2 Parametric Analysis Results4.2.1 Normalised Reinforcement Tensile StressThe comparisons of lateral force-top displacement skel-eton curves for wall specimens with different normal-ised reinforcement tensile stress are presented in Fig. 12. It should be noted that the skeleton curves in this study were obtained from the cyclic loading analysis. The peak strength (Vp) and ultimate drift ratio (θu) versus normal-ised reinforcement tensile stress (ns) relationships for the specimens are shown in Fig. 13. The peak strength are the absolute average values in the positive and negative load-ing. Ultimate drift ratio is defined as the post-peak drift at the instant when the lateral load decreases to 85% of the peak load. For wall specimens, the post-peak strength did not decrease below 85% of the peak load until com-plete failure. In such a case, the ultimate drift ratio is defined as the maximum drift that the specimen endures with a full cycle before complete failure. All specimens sustained flexural-sliding failure as discussed in Sect. 3.
Figures 12 and 13 indicate that normalised reinforce-ment tensile stress significantly affects the peak strength
Fig. 10 Calculation of curvature based on the finite element analysis.
Fig. 11 Comparison of curvature distributions for all test walls.
Page 13 of 20Cheng and Zhang Int J Concr Struct Mater (2021) 15:33
and ultimate drift ratio. The peak strength for specimens approximately decreased linearly as normalised rein-forcement tensile stress increased. With an increase of normalised reinforcement tensile stress, the ultimate drift ratio decreased. This is due to the larger axial tension easily leads to a larger strain of boundary longitudinal reinforcement, which prohibits the ultimate displace-ment capacity. RCW-ns0.1 had a large ultimate drift ratio of 2.3%, but RCW-ns0.7 had a relatively low ultimate drift ratio of 1.5% which also exceeded the elasto-plastic drift ratio limit of 1.0%, as specified in GB 50010–2010 (CMC, 2010b).
4.2.2 Effect of Vertically Web Distributed ReinforcementThe comparisons of the lateral force-top displacement skeleton curves of specimens with different vertically web distributed reinforcement are presented in Fig. 14. All specimens sustained flexural-sliding failure. The peak strength (Vp) and ultimate drift ratio (θu) versus vertically web distributed reinforcement ratio (ρwv) rela-tionships for specimens are shown in Fig. 15. The peak
Table 4 Range of parameters of FEMs.
Parameters Base value Ranges of value Specimen no.
Normalised reinforcement tensile stress ns 0.4 0.1, 0.4, 0.5, 0.7 RCW-ns0.1 ~ RCW-ns0.7
Vertically distributed reinforcement ratio ρwv (%) 0.4 0.2, 0.4, 0.6, 0.8 RCW-ρwv0.2 ~ RCW-ρwv0.8
Horizontally distributed reinforcement ratio ρwh (%) 0.4 0.4, 0.6, 0.8, 1.0 RCW-ρwh0.4 ~ RCW-ρwh1.0
Boundary longitudinal reinforcement ratio ρb (%) 1.5 1.2, 1.5, 2.0, 2.5 RCW-ρb1.2 ~ RCW-ρb2.5
Concrete strength fcu (MPa) 40 30, 40, 50, 60 RCW-C30 ~ RCW-C60
Shear-to-span ratio λ 2.0 2.0, 2.5, 3.0 RCW-λ2.0 ~ RCW-λ3.0
Fig. 12 Skeleton curves of specimens with different normalised reinforcement tensile stress.
Fig. 13 Peak strength and ultimate drift ratio of specimens versus normalised reinforcement tensile stress.
Fig. 14 Skeleton curves of specimens with different vertically web distributed reinforcement.
Page 14 of 20Cheng and Zhang Int J Concr Struct Mater (2021) 15:33
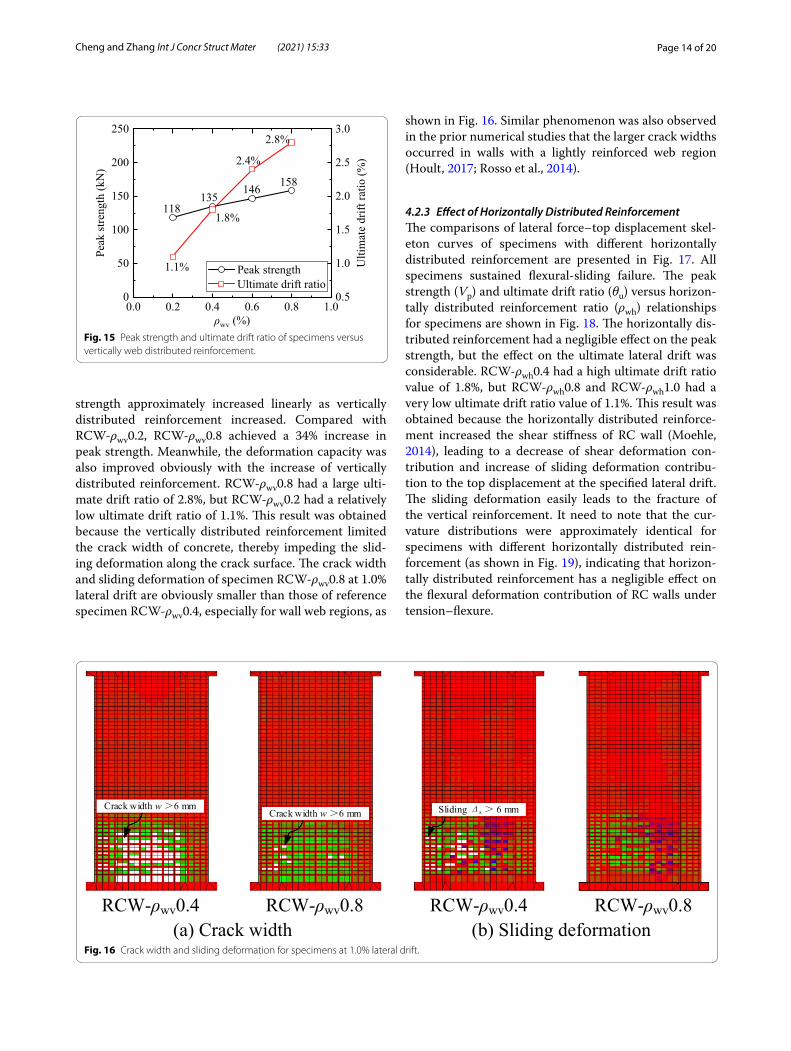
strength approximately increased linearly as vertically distributed reinforcement increased. Compared with RCW-ρwv0.2, RCW-ρwv0.8 achieved a 34% increase in peak strength. Meanwhile, the deformation capacity was also improved obviously with the increase of vertically distributed reinforcement. RCW-ρwv0.8 had a large ulti-mate drift ratio of 2.8%, but RCW-ρwv0.2 had a relatively low ultimate drift ratio of 1.1%. This result was obtained because the vertically distributed reinforcement limited the crack width of concrete, thereby impeding the slid-ing deformation along the crack surface. The crack width and sliding deformation of specimen RCW-ρwv0.8 at 1.0% lateral drift are obviously smaller than those of reference specimen RCW-ρwv0.4, especially for wall web regions, as
shown in Fig. 16. Similar phenomenon was also observed in the prior numerical studies that the larger crack widths occurred in walls with a lightly reinforced web region (Hoult, 2017; Rosso et al., 2014).
4.2.3 Effect of Horizontally Distributed ReinforcementThe comparisons of lateral force–top displacement skel-eton curves of specimens with different horizontally distributed reinforcement are presented in Fig. 17. All specimens sustained flexural-sliding failure. The peak strength (Vp) and ultimate drift ratio (θu) versus horizon-tally distributed reinforcement ratio (ρwh) relationships for specimens are shown in Fig. 18. The horizontally dis-tributed reinforcement had a negligible effect on the peak strength, but the effect on the ultimate lateral drift was considerable. RCW-ρwh0.4 had a high ultimate drift ratio value of 1.8%, but RCW-ρwh0.8 and RCW-ρwh1.0 had a very low ultimate drift ratio value of 1.1%. This result was obtained because the horizontally distributed reinforce-ment increased the shear stiffness of RC wall (Moehle, 2014), leading to a decrease of shear deformation con-tribution and increase of sliding deformation contribu-tion to the top displacement at the specified lateral drift. The sliding deformation easily leads to the fracture of the vertical reinforcement. It need to note that the cur-vature distributions were approximately identical for specimens with different horizontally distributed rein-forcement (as shown in Fig. 19), indicating that horizon-tally distributed reinforcement has a negligible effect on the flexural deformation contribution of RC walls under tension–flexure.
Fig. 15 Peak strength and ultimate drift ratio of specimens versus vertically web distributed reinforcement.
Fig. 16 Crack width and sliding deformation for specimens at 1.0% lateral drift.

Page 15 of 20Cheng and Zhang Int J Concr Struct Mater (2021) 15:33
4.2.4 Effect of Boundary Longitudinal ReinforcementThe comparisons of lateral force–top displacement skeleton curves of specimens with different boundary longitudinal reinforcement are presented in Fig. 20. The peak strength (Vp) and ultimate drift ratio (θu) versus boundary longitudinal reinforcement (ρb) relationships for specimens are shown in Fig. 21. The peak strength approximately increases linearly with the increase of boundary longitudinal reinforcement. Compared with RCW-ρb1.2, RCW-ρb2.5 achieved 77% increase in peak strength. The boundary longitudinal reinforcement had limited influence on the ultimate lateral drift due to the
yielding of boundary longitudinal reinforcement at the flexural deformation phase for flexural-sliding failure.
4.2.5 Effect of Concrete StrengthThe comparisons of lateral force–top displacement skel-eton curves of specimens with different concrete cube compressive strength are presented in Fig. 22. All speci-mens sustained flexural-sliding failure. The peak strength (Vp) and ultimate drift ratio (θu) versus concrete cube compressive strength (fcu) relationships for specimens are shown in Fig. 23. The concrete cube compressive strength had negligible influence on the peak strength
Fig. 17 Skeleton curves of specimens with different horizontally distributed reinforcement.
Fig. 18 Peak strength and ultimate drift ratio of specimens versus horizontally distributed reinforcement ratio.
Fig. 19 Curvature distribution of specimens with different horizontally distributed reinforcement (θ = 1.0%).
Fig. 20 Skeleton curves of specimens with different boundary longitudinal reinforcement.

Page 16 of 20Cheng and Zhang Int J Concr Struct Mater (2021) 15:33
and ultimate lateral drift because RC walls easily cracked under the tension, causing the peak strength and ultimate lateral drift to depend mainly on steel reinforcement and not concrete strength. In practical design, the Chinese Technical Guideline of Peer Review for Seismic Design of Ultra-High-Rise Buildings (CMC 2015a) stipulated nor-malised concrete tensile stress (nc) for RC walls under the design basis earthquake. Figure 23 indicates that nor-malised concrete tensile stress nc is not a very reasonable index for guaranteeing the seismic performance of RC wall under the tension because concrete strength has a negligible influence on peak strength and ultimate lateral drift.
4.2.6 Effect of Shear‑to‑Span RatioThe comparisons of lateral force-top displacement skel-eton curves of specimens with different shear-to-span ratios are presented in Fig. 24. All specimens sustained flexural-sliding failure. The peak strength (Vp) and ulti-mate drift ratio (θu) versus shear-to-span ratio (λ) rela-tionships for specimens are shown in Fig. 25. The peak strength decreased linearly with the increase of shear-to-span ratios, but the effect on ultimate lateral drift is insig-nificant. Compared with RCW-λ2.0, RCW-λ3.0 achieved a 35% decrease in peak strength.
5 Plastic Hinge Length of RC Wall Under Axial Tension–Flexure
In order to conveniently calculate the displacement demand and capacity of RC walls, the equivalent plas-tic hinge method often was adopted to investigate the
Fig. 21 Peak strength and ultimate drift ratio of specimens versus boundary longitudinal reinforcement ratio.
Fig. 22 Skeleton curves of specimens with different concrete cube compressive strength.
Fig. 23 Peak strength and ultimate drift ratio of specimens versus concrete cube compressive strength.
Fig. 24 Skeleton curves of specimens with different shear-to-span ratios.

Page 17 of 20Cheng and Zhang Int J Concr Struct Mater (2021) 15:33
seismic performance of RC walls that an equivalent plas-tic hinge length (lp) is usually defined, over which the plastic hinge rotations are assumed to occur, as shown in
Fig. 26. The plastic rotation (θp) was calculated by inte-grating the plastic curvature profile over the entire wall height. The equivalent plastic hinge length was then cal-culated as follows:
where φm denotes the maximum curvature, φy denotes the yield curvature which was defined as φy = 2εy/lw (Priestley & Kowalsky, 1998), εy is the yielding strain of the boundary longitudinal reinforcement, lw is the length of the wall section.
Larger number of studies have been conducted to derive the analytical expression for the estimation of equivalent plastic length (lp) of cantilever RC wall under the axial compression using experimental tests and non-linear finite-element analysis. ASCE/SEI 41-13 (2014) and Thomsen and Wallace (2004) recommend 0.5lw and 0.33lw for RC walls, respectively, as shown in Table 5. Paulay and Priestley (1992) and Kazaz (2013) recommend the equivalent plastic hinge length (lp) shown in Eqs. (5) and (6), where the equivalent plastic hinge length linearly increases as shear-to-span ratio increases. Priestley et al. (2007) recommend the equivalent plastic hinge length (lp) shown in Eq. (7), where the strain penetration length in the plastic zone (lsp) was considered. Besides, Kazaz (2013), Hoult, (2017), Hoult et al. (2018a, 2018b) found that the equivalent plastic hinge length approximately decreased as a function of axial compressive force, due to the strain capacity of the concrete (0.003) being reached at lower displacements (Hoult, 2017). Although these equations have been compared and validated with test data of walls under combined axial compression-flexure (Hoult, 2017; Hoult et al., 2018a, 2018b; Kazaz, 2013; Lu et al., 2017), whether these equations can be extended to RC walls subjected to axial tension–flexure remains unclear. Therefore, the applicability of these calculated expression was validated based on the numerical analysis results in this study.
Figure 27 shows the relationship of equivalent plastic hinge length lp normalised with respect to wall length lw versus different design parameters, including nor-malised reinforcement tensile stress (ns), vertically and
(2)θp =(
ϕm − ϕy)
lp,
Fig. 25 Peak strength and ultimate drift ratio of specimens versus shear-to-span ratios.
Fig. 26 Plastic hinge analysis methodology.
Table 5 Equivalent plastic hinge length (lp) for RC walls.
ASCE/SEI 41-13 (2014) 0.5lw (3)
Thomsen and Wallace (2004) 0.33 lw (4)
Paulay and Priestley (1992) 0.2 lw + 0.07 (M/V) (5)
Kazaz (2013) 0.143 lw + 0.072 (M/V) (6)
Priestley et al. (2007) kHw + 0.1lw + lsplsp = 0.022fyedb; k = 0.2(fu/fy-1) ≤ 0.08; fye = 1.1fy; db denotes the diameter of the
longitudinal rebars
(7)

Page 18 of 20Cheng and Zhang Int J Concr Struct Mater (2021) 15:33
horizontally distributed reinforcement (ρwv and ρwh), boundary longitudinal reinforcement (ρb), concrete cube compressive strength (fcu) and shear-to-span ratio (λ). The equivalent plastic hinge length in Fig. 27 was calcu-lated using Eq. (2) based on the curvature distributions of RC walls from the FEM analysis discussed in Sect. 4. It needs to note that equivalent plastic hinge length var-ies at each lateral drift cycles, the equivalent plastic hinge length in Fig. 27 corresponds to 1.0% lateral drift, which is the elasto-plastic drift ratio limit specified in the Chi-nese design code [GB 50011 (CMC, 2010c)].
The following observations can be obtained from Fig. 27: (1) the equivalent plastic hinge length of the RC
walls seems to increase as normalised reinforcement ten-sile stress and shear-to-span ratio increase. This is due to the applied axial tensile force lead to a more higher crack in potential plastic region to distribute the plastic defor-mation of RC wall. (2) Web distributed reinforcement and boundary longitudinal reinforcement have limited influence on the equivalent plastic hinge length of the RC walls under axial tension–flexure, except for specimens with very low web distributed reinforcement and bound-ary longitudinal reinforcement. (3) Although the axial tension increased the equivalent plastic hinge length of the RC walls, ASEC/SEI 41–13 code and Priestley et al. (Eq. (7)) overestimated the equivalent plastic hinge
Fig. 27 Equivalent plastic hinge length lp of RC walls under coupled axial tension–flexure.

Page 19 of 20Cheng and Zhang Int J Concr Struct Mater (2021) 15:33
length of RC walls under axial tension–flexure. (4) The equation proposed by Thomsen and Wallace provides a reasonable estimation for the equivalent plastic hinge length of RC walls with a shear-to-span ratio of 2.0 but still underestimates the equivalent plastic hinge length of RC walls with a shear-to-span ratio exceeding 2.0. This result is obtained because the equation cannot con-sider the effect of shear-to-span ratio. (5) The equation proposed by Paulay and Priestley (Eq. (5)) captures the general trend of the equivalent plastic hinge length vari-ation with shear-to-span ratio and can provide a reason-able estimation for the equivalent plastic hinge length. (6) Although the equation proposed by Kazaz (Eq. (6)) captures the general trend of the equivalent plastic hinge length variation with shear-to-span ratio, it still under-estimates the equivalent plastic hinge length of RC walls subjected to axial tension–flexure.
6 ConclusionsA detailed FEM was developed to simulate the cyclic behaviour of RC walls under coupled axial tension–flex-ure. The developed model was verified against experi-mental results from recent RC wall tests to guarantee the accuracy of the model in terms of capturing the main behaviour. The study was extended to investigate the effect of important design parameters, including nor-malised reinforcement tensile stress, vertically and horizontally distributed reinforcement, boundary longi-tudinal reinforcement, concrete strength and shear-to-span ratios. Finally, the equivalent plastic hinge length of RC walls under coupled axial tension–flexure was stud-ied. The main conclusions drawn from this study are as follows:
(1) The developed finite element model can capture the overall response of RC walls under axial tension–flexure with good accuracy, including the cyclic hysteresis response, crack pattern, axial elongation and curvature distribution.
(2) With the increase of vertically web distributed reinforcement and boundary longitudinal rein-forcement, the tension-flexure peak strength of RC walls approximately increases linearly. Horizontally distributed reinforcement and concrete strength have a negligible effect on peak strength. Ultimate deformation capacity is improved obviously as ver-tically web distributed reinforcement increases, but boundary longitudinal reinforcement and con-crete strength have no significant effect. Horizon-tally distributed reinforcement obviously decreases ultimate deformation capacity. Shear-to-span ratio decreases linearly the tension-flexure peak strength
of RC walls, but the effect on ultimate deformation capacity is insignificant.
(3) The equivalent plastic hinge length of RC walls under coupled axial tension–flexure increases as axial tension and shear-to-span ratio increase. Other design parameters, including vertically and horizontally distributed reinforcement, boundary longitudinal reinforcement and concrete strength, appear to have negligible influence on equivalent plastic hinge length.
(4) Although the axial tension increased the equiva-lent plastic hinge length of the RC walls, ASEC/SEI 41-13 code and Priestley et al. still overestimated the equivalent plastic hinge length of RC walls under axial tension–flexure. The equation proposed by Thomsen and Wallace can provide a reason-able estimation for RC walls with a shear-to-span ratio of 2.0, but it still underestimates for RC walls with a shear-to-span ratio exceeding 2.0. The equa-tion proposed by Paulay and Priestley can provide a reasonable estimation for the equivalent plastic hinge length of RC walls. Although the equation proposed by Kazaz captures the general trend of the equivalent plastic hinge length variation with shear-to-span ratio, it still underestimates the equivalent plastic hinge length of RC walls under coupled axial–flexure. Therefore, the equation proposed by Kazaz probably can be used in the design for the security consideration.
AcknowledgementsThe authors gratefully acknowledge sponsorship by Chinese Postdoctoral Science Foundation (Grant No. BX20200024, 2020M680276) and Beijing Post-doctoral Science Foundation, China (Grant No. Q6004012202001). The writers wish to express their sincere gratitude to the sponsors.
Authors’ contributionsXW Cheng contributed to validation of the FEM, parametric study, and writing original draft. HY Zhang contributed to the discussion of plastic hinge length and final manuscript. All authors read and approved the final manuscript.
Authors’ informationXW Cheng is a PhD lecturer affiliated with Beijing University of Technology, HY Zhang is a master student at the Beijing University of Technology.
FundingChinese Postdoctoral Science Foundation (Grant No. BX20200024, 2020M680276); Beijing Postdoctoral Science Foundation, China (Grant No. Q6004012202001).
Availability of data and materialsThe data used to support the findings of this study are available from the authors upon request.
Competing interestsThe authors declare that they have no competing interests.
Received: 3 March 2021 Accepted: 19 June 2021

Page 20 of 20Cheng and Zhang Int J Concr Struct Mater (2021) 15:33
ReferencesAktan, A. E., & Bertero, V. V. (1984). Seismic response of R/C frame-wall structures.
Journal of Structural Engineering, 110(8), 1803–1821.ASCE/SEI 41–13. (2014). Seismic rehabilitation of existing buildings. ASCE/SEI
41-13. Reston, VA: American Society of Civil Engineers.Borosnyói, A., & Balázs, G. L. (2005). Models for flexural cracking in concrete: State
of the art. Structural Concrete, 6(2), 53–62.Caner, F., & Bazant, Z. (2013). Microplane model M7 for plain concrete. I: Formula-
tion. Journal of Engineering Mechanics, 139(12), 1714–1723.Cervenka, V. (1970). Inelastic finite element analysis of reinforced concrete panels
under in plane loads. Dissertation, University of Colorado.Cheng, X. W., Ji, X. D., Henry, R. S., & Xu, M. C. (2019). Coupled axial tension-flexure
behavior of slender reinforced concrete walls. Engineering Structures, 188, 261–276.
CMC. (2010a). Technical specification for concrete structures of tall building JGJ 3-2010. Beijing, China Ministry of Construction.
CMC. (2010b). Code for design of concrete structures. GB50010-2010. Beijing, China Ministry of Construction.
CMC. (2010c). Code for seismic design of buildings. GB50011-2010, Beijing, China Ministry of Construction.
CMC. (2015). Technical specification for review of design of ultra-high-rise buildings. Beijing, China Ministry of Construction.
Cortes-Puentes, W. L., & Palermo, D. (2011). Modelling seismically repaired and retrofitted reinforced concrete shear walls. Computers and Concrete, 8(5), 541–861.
Feenstra, P. H., Borst, R., & Rots, J. G. (1991). Numerical study on crack dilatancy Part I: Models and stability analysis. Journal of Engineering Mechanics, 117(4), 733–753.
Feng, D. C., Ren, X. D., & Li, J. (2018). Cyclic behavior modeling of reinforced con-crete shear walls based on softened damage-plasticity model. Engineering Structures, 166, 363–375.
Figueira, D., Sousa, C., & Neves, A. S. (2020). Constitutive model for aggregate interlock in FEM analyses of concrete interfaces with embedded steel bars. International Journal of Concrete Structures and Materials, 14(1), 15.
He, X. G., & Kwan, A. K. H. (2001). Modeling dowel action of reinforcement bars for finite element analysis of concrete structures. Computers & Structures, 79(6), 595–604.
Hognestad, E. (1951). A study on combined bending and axial load in reinforced concrete members. University of Illinois.
Hoult, R. D. (2017). Minimum longitudinal reinforcement requirements for boundary elements of limited ductile walls for AS 3600. Electronic Journal of Structural Engineering, 17(1), 43–52.
Hoult, R. D., Goldsworthy, H. M., & Lumantarna, E. (2018a). Plastic hinge length for lightly reinforced C-shaped concrete walls. Journal of Earthquake Engineer-ing, 24(7), 1083–1114.
Hoult, R. D., Goldsworthy, H. M., & Lumantarna, E. (2018b). Plastic hinge length for lightly reinforced rectangular concrete walls. Journal of Earthquake Engineer-ing, 22(8), 1447–1478.
Hsu, T. T. C. (1988). Softened truss model theory for shear and torsion. ACI Struc-tural Journal, 85(6), 624–635.
Hsu, T. T. C., & Zhu, R. R. H. (2002). Softened membrane model for reinforced concrete elements in shear. ACI Structural Journal, 99(4), 460–469.
Imbsen. (2007). XTRACT-cross section analysis program for structural engineers-Step by step examples, IMBSEN software systems v3.0.8, California.
Ji, X. D., Cheng, X. W., & Xu, M. C. (2018). Coupled axial tension-shear behavior of reinforced concrete walls. Engineering Structures, 167, 132–142.
Kato, H., Tajiri, S., & Mukai, T. (2010). Preliminary reconnaissance report of the Chile earthquake 2010. Building Research Institute.
Kazaz, I. (2013). Analytical study on plastic hinge length of structural walls. Journal of Structural Engineering, 139(11), 1938–1950.
Kurfer, H. B., Hilsdorf, H. K., & Rusch, H. (1969). Behavior of concrete under biaxial stresses. ACI Structural Journal, 66(8), 656–666.
Lai, T. Y. (2015). Experimental research on mechanical behavior of concrete shear walls under tension and shear. Dissertation, Tianjin University.
Lu, Y. Q., Henry, R. S., & GultomMa, R. Q. T. (2017). Cyclic testing of reinforced concrete walls with distributed minimum vertical reinforcement. Journal of Structural Engineering, 143(5), 04016225.
Luu, H., Ghorbanirenani, I., Léger, P., & Tremblay, R. (2012). Numerical model-ling of slender reinforced concrete shear wall shaking table tests under
high-frequency ground motions. Journal of Earthquake Engineering, 17(4), 517–542.
Moehle, J. (2014). Seismic design of reinforced concrete buildings. McGraw-Hill Education.
Nie, X., Wang, J. J., & Tao, M. X. (2020). Experimental study of shear critical reinforced-concrete shear walls under tension bending shear-combined cyclic load. Journal of Structural Engineering, 146(5), 04020047.
Palermo, D., & Vecchio, F. J. (2004). Compression field modeling of reinforced concrete subjected to reversed loading: Verification. ACI Structural Journal, 101(2), 155–164.
Palermo, D., & Vecchio, F. J. (2007). Simulation of cyclically loaded concrete struc-tures based on the finite-element method. Journal of Structural Engineering, 133(5), 728–738.
Paulay, T., & Priestley, M. J. N. (1992). Seismic design of reinforced concrete and masonry buildings. Wiley.
Paulay, T., & Santhakumar, A. R. (1976). Ductile behavior of coupled shear walls. Journal of the Structural Division, 102(1), 93–108.
Priestley, M. J. N., Calvi, G. M., & Kowalsky, M. J. (2007). Displacement-based seismic design of structures. IUSS Press.
Priestley, M. J. N., & Kowalsky, M. J. (1998). Aspects of drift and ductility capacity of rectangular cantilever structural walls. Bulletin of the New Zealand National Society for Earthquake Engineering, 31(2), 73–85.
Ren, C. C. (2018). Experimental study on tension-shear performance of reinforced concrete shear wall. Dissertation, China Academy of Building Research.
Ren, C. C., Xiao, C. Z., & Xu, P. F. (2018). Experimental study on tension-shear per-formance of reinforced concrete shear wall. China Civil Engineering Journal, 51(4), 20–33.
Rosso, A., Almeida, J. P., Constantin, R., Beyer, K., & Sritharan, S. (2014). Influence of longitudinal reinforcement layouts on RC wall performance. In the Second European Conference on Earthquake Engineering and Seismology.
Scott, B. D., Park, R., & R., & Priestley, M. J. N. . (1982). Stress-strain behavior of concrete confined by overlapping hoops at low and high strain rates. ACI Structural Journal., 79(1), 13–27.
Seckin, M. (1981). Hysteretic behavior of cast-in-place exterior beam column-slab subassemblies. Dessertation, University of Toronto.
Song, C., Pujol, S., & Lepage, A. (2012). The collapse of the Alto Rio building during the 27 February 2010 Maule, Chile, Earthquake. Earthquake Spectra, 28(S1), S301–S334.
Thomsen, J. H., & Wallace, J. W. (2004). Displacement-based design of slender reinforced concrete structural walls-experimental verification. Journal of Structural Engineering, 130(4), 618–630.
Vecchio, F. J. (2000). Disturbed stress field model for reinforced concrete: Formula-tion. Journal of Structural Engineering, 126(9), 1070–1077.
Vecchio, F. J., & Collins, M. P. (1986). Modified compression-field theory for rein-forced concrete elements subjected to shear. ACI Structural Journal, 83(2), 219–231.
Vecchio, F. J., & Lai, D. (2004). Crack shear-slip in reinforced concrete elements. Journal of Advanced Concrete Technology, 2(3), 289–300.
Wang, J. J. (2019). Research on high fidelity numerical model for high rise shear wall structures under sophisticated loading conditions. Dissertation, Tsinghua University.
Wang, T. C., Lai, T. Y., Zhao, H. L., & Wang, Y. (2017). Tensile-shear mechanical perfor-mance test of reinforced concrete shear wall. Building Structure, 47(2), 64–69.
Wang, J. J., Tao, M. X., Fan, J. S., & Nie, X. (2018). Seismic behavior of Steel Plate reinforced concrete composite shear walls under tension-bending-shear combined cyclic load. Journal of Structural Engineering, 177(7), 04018075.
Wong, P. S., Vecchio, F. J., & Trommels, H. (2013). VecTor2 and formworks user’s manual. In user’s manual, 2nd edition. Toronto: University of Toronto.
Wu, J. Y., & Li, J. (2007). Unified plastic-damage model for concrete and its applica-tions to dynamic nonlinear analysis of structure. Structural Engineering and Mechanics, 25(5), 519–540.
Yao, Z. Q. (2015). Experimental research on tension and tensile-shear behaviors of shear wall with steel tube confined high-strength concrete. Beijing:South China University of Technology.
Publisher’s NoteSpringer Nature remains neutral with regard to jurisdictional claims in pub-lished maps and institutional affiliations.