numerical modelling of wave interaction with coastal structures · numerical modelling of wave...
TRANSCRIPT
Troch, p. 1
Numerical modelling of wave interaction with coastal structures
dr ir Peter Troch
Afdeling Weg-& Waterbouwkunde, Vakgroep Civiele Techniek TW15Universiteit Gent, Technologiepark 904, 9052 Zwijnaarde
Tel: 09/264 54 89 Fax: 09/264 58 37 Email: [email protected]
Abstract
The classic approach of studying the wave interaction with coastal structures isperforming physical model testing on a scaled model of the structure in a waveflume in the laboratory. During the last decade, numerical modelling has becomea powerful and efficient research tool in the field of coastal engineering. In thispaper the numerical model VOFbreak2, based on the Navier-Stokes equations andthe Volume-Of-Fluid (VOF) technique for treating free surfaces, is presentedwhich is capable of simulating the wave propagation and interaction with avariety of coastal structures. Two practical test cases illustrate features,advantages and limitations of the numerical model. In the first test case, wavepropagation into a porous rubble mound breakwater and attenuation of theinduced pore pressures is investigated. The second test case presents simulationsof wave run-up and overtopping at an impermeable sea dike.
1 IntroductionCoastal zones typically have high densities of population, and important harbours with intenseeconomic activities are located along the coastlines. Usually coastal structures, such as seadikes, breakwaters, quay walls, jetties, etc… are constructed to protect people and harbouractivities against large waves and flooding from storm surges. In this paper two types ofcoastal structures will be looked at in more detail: the rubble mound breakwater and the seadike. Both types are well-known coastal structures in Belgium and the Netherlands.
Traditionally, the design of coastal structures such as breakwaters and dikes is based on smallscale physical modelling. A scaled model of the structure (typically on a scale between 1/20to 1/50) is subjected to the loading from high water level and large waves in a physical waveflume. Due to the complexity of both the loading (wave characteristics) and the structuralcharacteristics, physical modelling was the appropriate design tool. Since the early seventies,a ‘new’ design tool developed simultaneously with the progress of computer performance: theuse of numerical modelling.
The use of physical scale models has the advantage that the physical (mostly very detailed andcomplex non-linear) processes are inherent in the physical model, and can be easilyreproduced. In a numerical model, all the processes have to be identified beforehand, andhave to be built-in correctly inside the numerical code. At this stage, not all processes havebeen described adequately for use in the numerical models. Water flow is accuratelysimulated, but e.g. stability of armour units cannot yet be studied in the numerical flume.
Terug naar overzicht

Troch, p. 2
Also, due to time-constraints (cpu time), only the most important processes are solved in thenumerical codes, and assumptions and simplifications are a major part of the simulation. Thephysical model allows a direct visualisation of the flow, allowing a proper and accuratephysical understanding of the flow and the structural behaviour.
Numerical models on the other hand have the advantage that less man power is required forexecution of the tests. Once the numerical model has been calibrated using physical modelresults, the numerical model is more suitable for comprehensive parametric studies whichrequire a lot of test repetition. Parameters which are difficult to measure in the physical waveflume, may be easily derived from the numerical calculation results (e.g. the velocity fieldspatially distributed over the whole computational domain, or the pressure distribution along awall). Numerical simulations are useful during preparation of complex physical model tests,e.g. in selecting the most efficient model orientation and model dimensions for the requiredwave loading, or e.g. by predicting the expected flow characteristics.
Today the struggle between both types of models seems to be pacified. Indeed, only a synergyand integration of both tools into the design process will lead to the best design result. Bycombining the advantages of both models, an interaction grows between the two tools thatwill lead to an improved evaluation of the governing physical processes and eventually to anoptimised design of the coastal structure.
This paper provides an overview of the potential of the numerical model VOFbreak²,developed at Ghent University, which can be used as a numerical wave flume for studying theinteraction between waves and a structure. First the numerical model itself with the governingequations will be shortly presented in section 2. The key innovations in the numerical waveflume that are necessary for simulation of wave interaction with permeable and impermeablecoastal structures are a porous flow model, and wave boundary conditions for generation andabsorption of the waves. Two practical test cases will illustrate the present possibilities andlimitations of the code. First the attenuation of wave induced pore pressures inside the core ofa porous rubble mound breakwater at Zeebrugge will be studied in section 3. Section 4presents results on wave overtopping over an impermeable sea dike. Both types of structureshave been built along the Belgian coast. Finally in section 5 conclusions are drawn and apersonal view on future developments is given.
2 The numerical model VOFbreak2
2.1 The hydrodynamic flow solverThe numerical wave flume VOFbreak2, VOF-algorithm for breaking waves on breakwaters, isbased on the original SOLA-VOF code (Nichols et al., 1980) and the RIPPLE code (Kothe etal., 1991) capable to compute free surface flow when the fluid domain becomes multiplyconnected. Incompressible Newtonian fluid with uniform density is assumed in the vertical plane(two-dimensional), governed by the Navier-Stokes equations:
x2
2
2
2g
yu
xu
xp1
yuv
xuu
tu
+
∂
∂+
∂
∂ν+
∂∂
ρ−=
∂∂
+∂∂
+∂∂ (1)
y2
2
2
2g
yv
xv
yp1
yvv
xvu
tv
+
∂
∂+
∂
∂ν+
∂∂
ρ−=
∂∂
+∂∂
+∂∂ (2)
Troch, p. 3
and the continuity equation:
0 = yv +
xu
∂∂
∂∂ (3)
where t (s) is time, u and v (m/s) are the velocity components in x and y direction respectively., p(N/m²) is pressure, and gx, gy (m/s²) are horizontal and vertical gravity components respectively,ρ (kg/m³) is the density of the water, ν (m²/s) is the kinematic coefficient of viscosity.
The free surface is described by introducing a function F(x, y, t) that represents the fractionalvolume of fluid in the mesh cells. The volume of fluid evolution equation (4) expresses that thevolume fraction F moves with the fluid:
0 = yF v+
xFu +
tF
∂∂
∂∂
∂∂ (4)
Finite difference solutions of the four unknowns u, v, p and F, are obtained on an Eulerianrectangular mesh in a Cartesian co-ordinate system (x,y). The volume of fluid function F,defining the fluid regions, is updated using the donor-acceptor flux approximation for thecalculation of fluxes from a donor cell to an acceptor cell. A unit value of F corresponds to a fullcell, while a zero value indicates an empty cell. Cells with values between zero and one andhaving at least one empty neighbour cell contain a free surface. A line is constructed in eachsurface cell with the correct calculated surface slope and correct amount of fluid lying on thefluid size, and is used as an approximation to the actual free surface. In the current version aconstant eddy viscosity turbulence model is used.
The code is implemented on a UNIX workstation using ANSI C, providing general computercompatibility, and providing a flexible code structure for adaptations with little effort. A series ofpost-processing tools has been developed for the visualisation, processing and interpretation ofthe computed results. Numerical instrumentation for the acquisition of relevant phenomena(wave height, run-up level, pore pressure, surface elevation, ...) is included for easy access tocalculated data. A complete description of the underlying mathematical model, the details of thegoverning equations and the solution algorithms is available in Troch (2000).
2.2 Porous flow and wave boundary conditionsA number of extensions have been implemented into the code in order to allow the simulationof the wave interaction with a rubble mound breakwater and a sea dike.
2.2.1 Porous Flow ModelThe governing Navier-Stokes equations are extended, to include the simulation of porous flowinside the permeable core of the breakwater, using Forchheimer flow resistance terms. TheForchheimer porous flow model, as an extension to the well-known Darcy model ingroundwater flow, takes into account the turbulent flow contribution which –for the case ofrubble mound breakwaters– is larger than the viscous contribution to the flow resistance.
2.2.2 Wave Boundary ConditionsA number of wave boundary conditions are implemented. Incident waves are generated usingboundary wave generation. Linear wave theory is applied at the boundary of thecomputational domain to provide the surface elevation and the velocity components of theincident wave at the boundary. For absorption at the boundary of reflected waves, the activewave absorbing technique AWAVOF is used (Troch and De Rouck, 1999). This new
Troch, p. 4
numerical boundary condition is based on an active wave absorption system that is wellknown already for physical wave flume application using a wave paddle. Velocities aremeasured at one location inside the computational domain. The reflected wave train isseparated from the incident wave field in front of the structure by means of digital filteringand subsequent superposition of the measured velocity signals. This way an additionalincident wave train is determined in order to absorb the reflected wave train. The AWAVOFmethod is optimised for efficient use in a numerical wave flume and applies to regular andirregular waves.
These modifications allow the numerical modelling of the wave induced pore pressureattenuation inside a breakwater core as presented in the next section. The detailed descriptionof the theoretical background and the implementation of the modifications are reported inTroch (2000).
3 Attenuation of pore pressures inside the Zeebrugge rubble mound breakwater
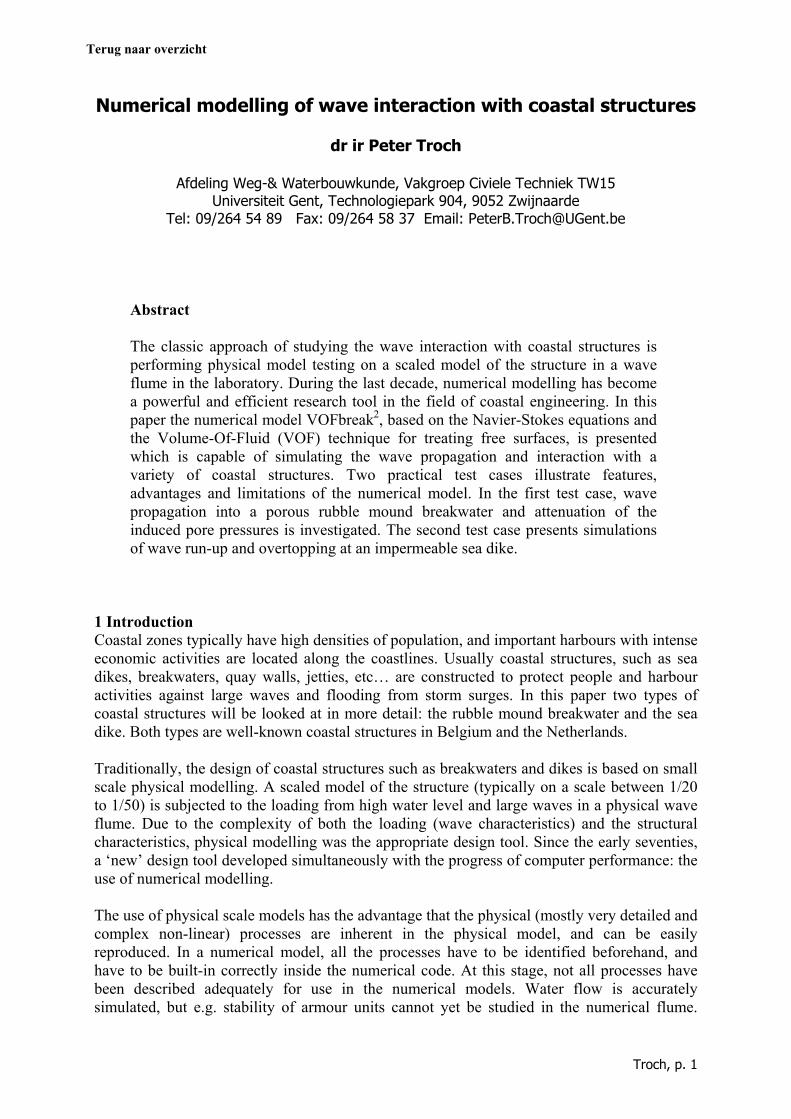
3.1 Pore pressures inside a rubble mound breakwaterA typical design cross section of a rubble mound breakwater is shown in Fig. 1. The core ismade of rock and constitutes the main part of the breakwater. The porous flow inside thepermeable core is caused by the waves and experiences high energy dissipation due to frictionlosses. An armour layer of individual heavy concrete blocks protects the core from the waves.A toe at the sea bottom acts as a foundation for the armour layer. A filter layer between thecore and the armour layer also acts as foundation layer for the armour layer, and prevents thatthe fine rock in the core is washed out in between the holes of the armour layer.
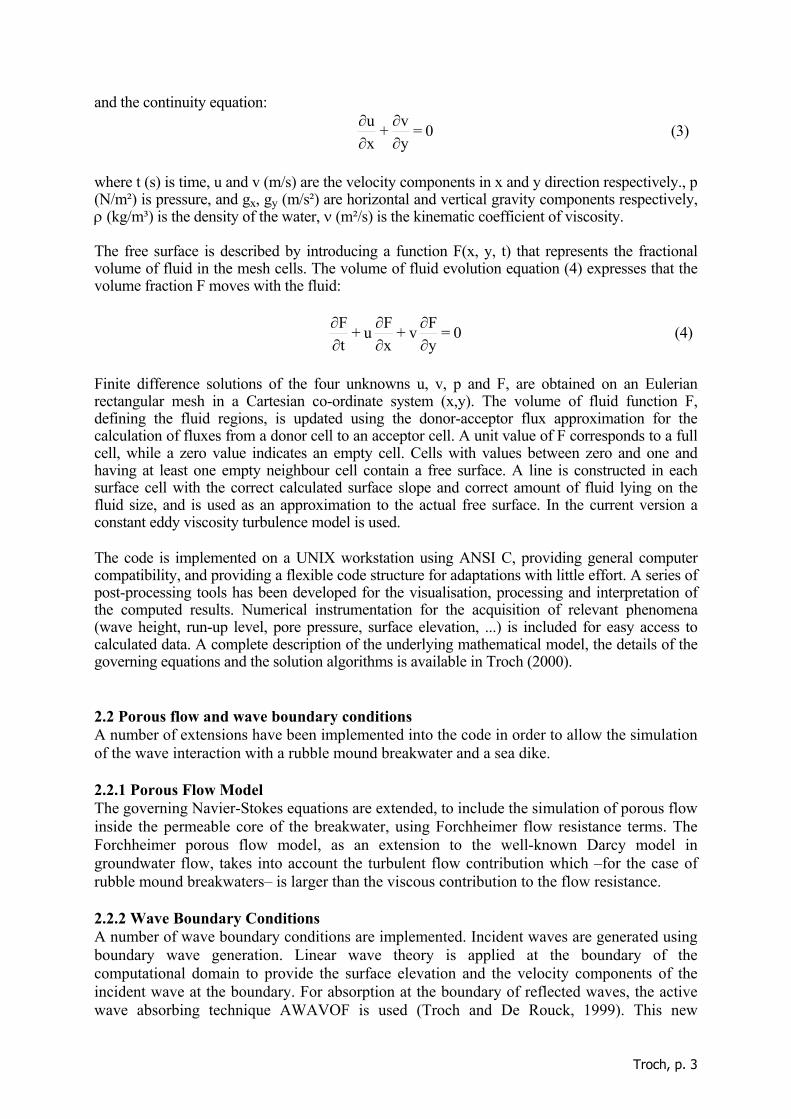
The interaction between the waves and the breakwater is described by a large number ofrelated physical processes. As an example, the breakwater at Zeebrugge in Belgium is shownduring storm conditions (Fig. 2). Waves propagate towards the breakwater and run up anddown the armour layer. Part of the wave energy is reflected back to the sea, part of the energyis dissipated in the armour and filter layer and in the core, the remaining part is transmittedthrough the breakwater. The porous flow inside the core has both laminar and turbulent flowcharacteristics and is connected to the wave attack via infiltration and seepage through thearmour layer. The hydrodynamic pore pressures associated with the porous flow (i.e. the waveinduced water pressure inside the holes of the skeleton of the rock material) decrease withincreasing distance from the seaward slope. Harlow (1980) reports a number of recent failuresof rubble mound breakwaters during storms and concludes that in most cases the failure iscaused by very large pore pressures in the breakwater core. De Groot et al. (1994) present theimportance of the knowledge of the pore pressures in the design of a breakwater, in particularfor the slope stability analysis, for the design of filter constructions near the bottom of thebreakwater, and for the influence of pore pressures on hydraulic stability of armour units, onwave run-up and overtopping, on wave transmission and on internal set-up of the phreaticwater table. The exact knowledge of the pore pressures therefore is very important for a stableand safe breakwater structure. However it is very difficult to estimate the magnitude of thepore pressures accurately. Due to the complexity of both wave loads and structure itself thereare no analytical expressions available. In conventional small scale model tests (scale rangingbetween 1:30 till 1:70) viscous scale effects influence the porous flow inside the breakwatercore adversely. A numerical simulation of the pore pressure attenuation inside the breakwatercore provides an alternative answer to this problem.
Troch, p. 5
Fig. 1. Typical cross section of a rubble mound breakwater (no overtopping conditions).
Fig. 2. Photo of wave interaction with the Zeebrugge rubble mound breakwater duringstorm conditions (significant wave height estimated around 3 meters).
Before the numerical simulation of the wave interaction is started, a detailed validationprocess has been carried out using physical model data. The results from this validation aredescribed briefly in the next section.
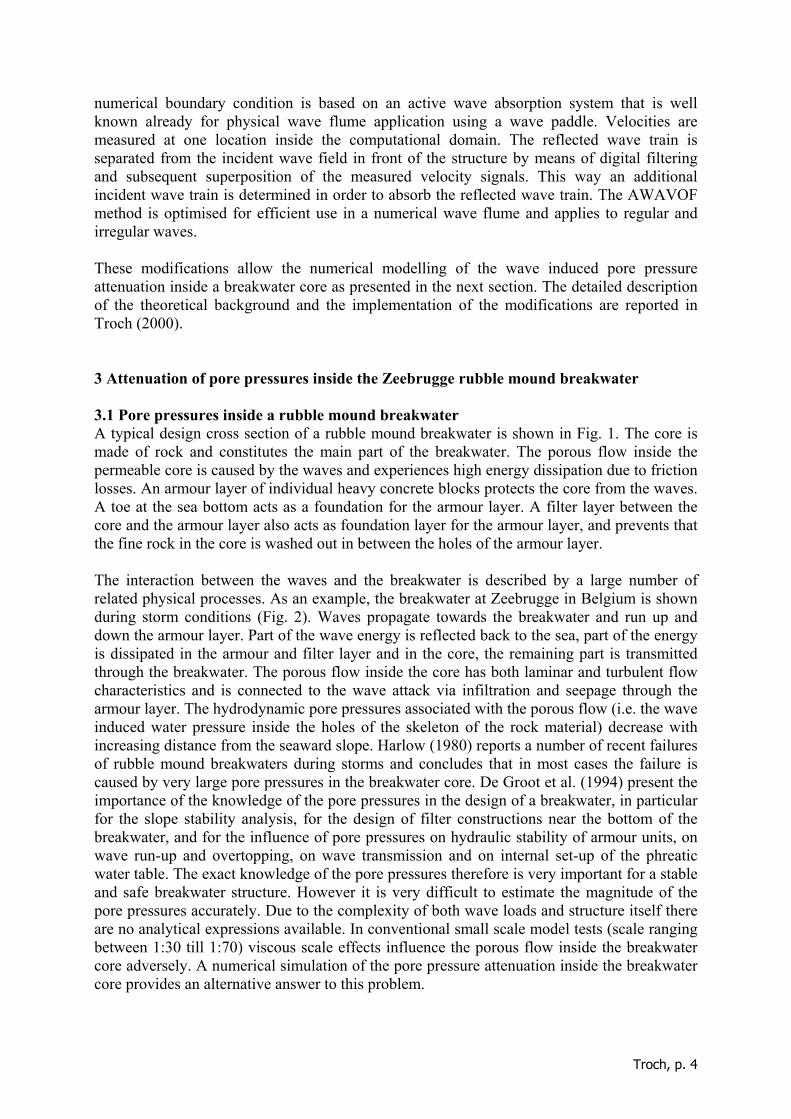
3.2 Validation of numerical wave flume using physical model testsPhysical model test data have been acquired in a wave flume at Aalborg University(Denmark) for the validation of the wave interaction with a breakwater. The test set-upincluded a relatively simple breakwater lay-out with a vertical front wall and a core ofhomogeneous rock (porosity n = 0.426, mean grain size 50d = 0.0181 m), Fig. 3.
Fig. 3. Geometry of the wave flume set-up, with wave generation and absorption at the leftboundary (x = 0) and the breakwater near the right boundary.
Troch, p. 6
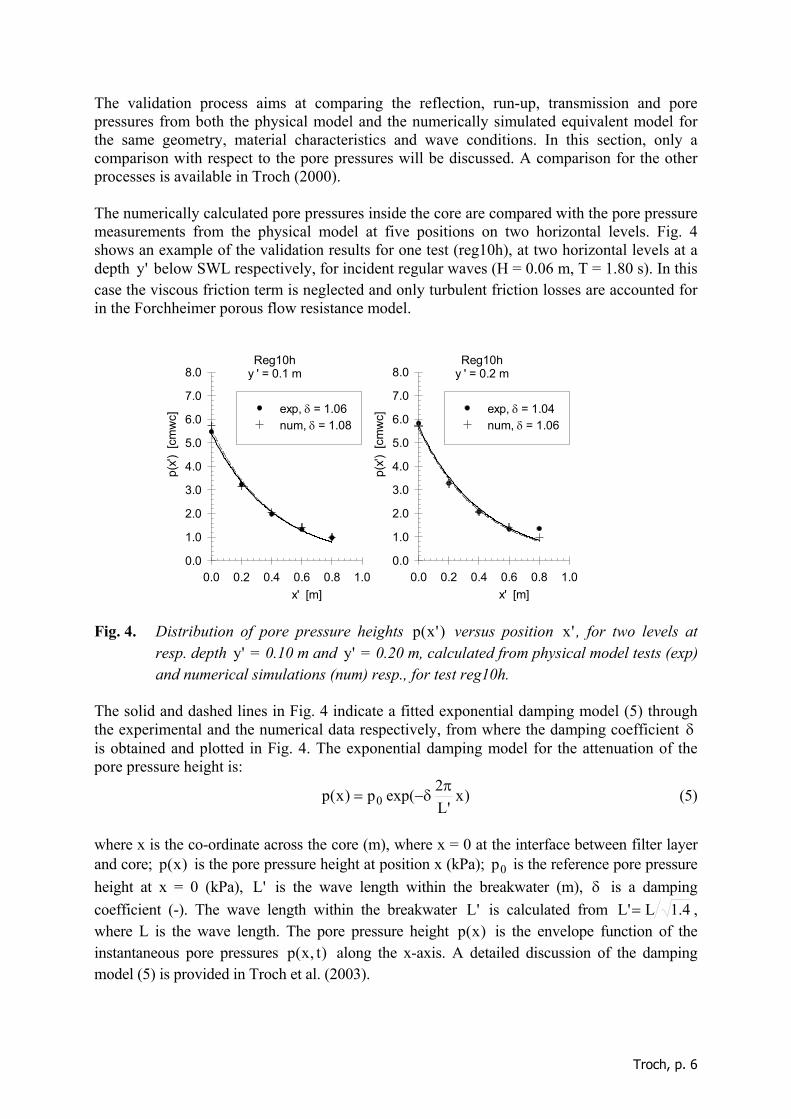
The validation process aims at comparing the reflection, run-up, transmission and porepressures from both the physical model and the numerically simulated equivalent model forthe same geometry, material characteristics and wave conditions. In this section, only acomparison with respect to the pore pressures will be discussed. A comparison for the otherprocesses is available in Troch (2000).
The numerically calculated pore pressures inside the core are compared with the pore pressuremeasurements from the physical model at five positions on two horizontal levels. Fig. 4shows an example of the validation results for one test (reg10h), at two horizontal levels at adepth 'y below SWL respectively, for incident regular waves (H = 0.06 m, T = 1.80 s). In thiscase the viscous friction term is neglected and only turbulent friction losses are accounted forin the Forchheimer porous flow resistance model.
Fig. 4. Distribution of pore pressure heights )'x(p versus position 'x , for two levels atresp. depth 'y = 0.10 m and 'y = 0.20 m, calculated from physical model tests (exp)and numerical simulations (num) resp., for test reg10h.
The solid and dashed lines in Fig. 4 indicate a fitted exponential damping model (5) throughthe experimental and the numerical data respectively, from where the damping coefficient δis obtained and plotted in Fig. 4. The exponential damping model for the attenuation of thepore pressure height is:
)x'L
2exp(p)x(p 0π
δ−= (5)
where x is the co-ordinate across the core (m), where x = 0 at the interface between filter layerand core; )x(p is the pore pressure height at position x (kPa); 0p is the reference pore pressureheight at x = 0 (kPa), 'L is the wave length within the breakwater (m), δ is a dampingcoefficient (-). The wave length within the breakwater 'L is calculated from 4.1L'L = ,where L is the wave length. The pore pressure height )x(p is the envelope function of theinstantaneous pore pressures )t,x(p along the x-axis. A detailed discussion of the dampingmodel (5) is provided in Troch et al. (2003).
Reg10hy ' = 0.1 m
x' [m]0.0 0.2 0.4 0.6 0.8 1.0
p(x')
[cm
wc]
0.0
1.0
2.0
3.0
4.0
5.0
6.0
7.0
8.0Reg10h
y ' = 0.2 m
x' [m]0.0 0.2 0.4 0.6 0.8 1.0
p(x')
[cm
wc]
0.0
1.0
2.0
3.0
4.0
5.0
6.0
7.0
8.0
exp, δ = 1.04num, δ = 1.06
exp, δ = 1.06num, δ = 1.08
Troch, p. 7
It is clear from Fig. 4 that very good agreement is found between the physical model test dataand the numerically calculated data. From these results (in fact from a much more detailedvalidation analysis, see Troch, 2000) it is concluded that the numerical model VOFbreak2 iscapable of simulating the wave interaction with a simple breakwater.
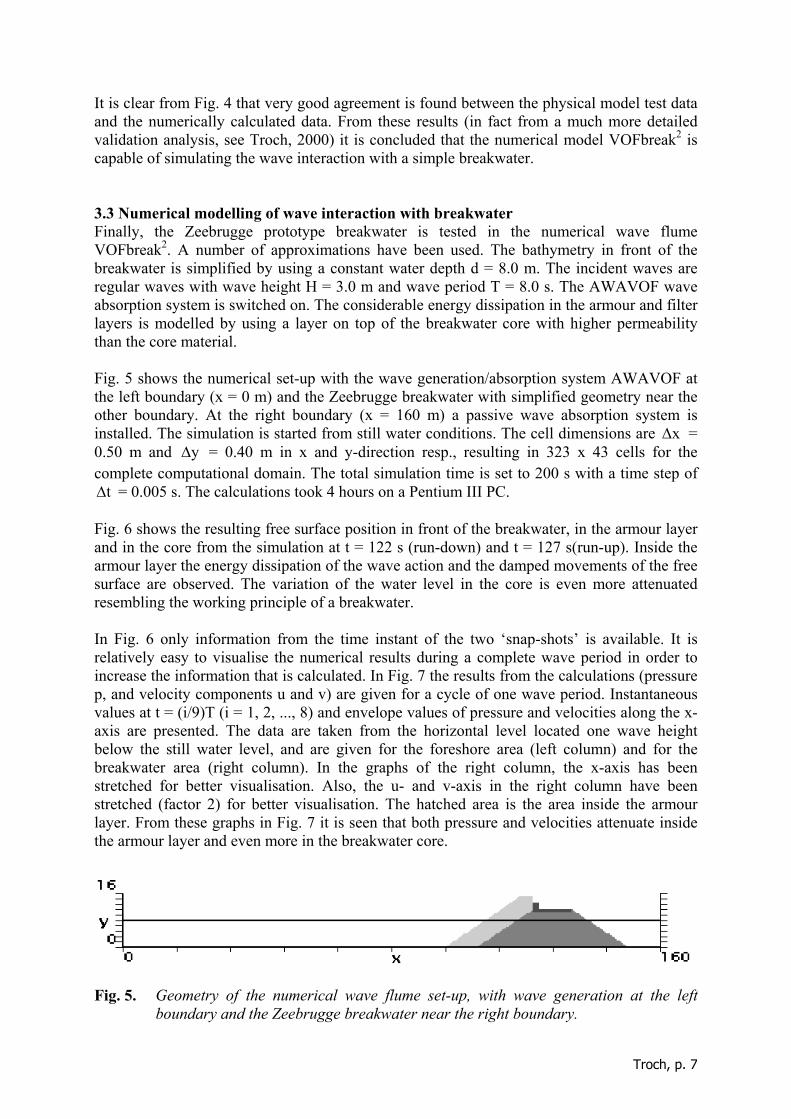
3.3 Numerical modelling of wave interaction with breakwaterFinally, the Zeebrugge prototype breakwater is tested in the numerical wave flumeVOFbreak2. A number of approximations have been used. The bathymetry in front of thebreakwater is simplified by using a constant water depth d = 8.0 m. The incident waves areregular waves with wave height H = 3.0 m and wave period T = 8.0 s. The AWAVOF waveabsorption system is switched on. The considerable energy dissipation in the armour and filterlayers is modelled by using a layer on top of the breakwater core with higher permeabilitythan the core material.
Fig. 5 shows the numerical set-up with the wave generation/absorption system AWAVOF atthe left boundary (x = 0 m) and the Zeebrugge breakwater with simplified geometry near theother boundary. At the right boundary (x = 160 m) a passive wave absorption system isinstalled. The simulation is started from still water conditions. The cell dimensions are x∆ =0.50 m and y∆ = 0.40 m in x and y-direction resp., resulting in 323 x 43 cells for thecomplete computational domain. The total simulation time is set to 200 s with a time step of
t∆ = 0.005 s. The calculations took 4 hours on a Pentium III PC.
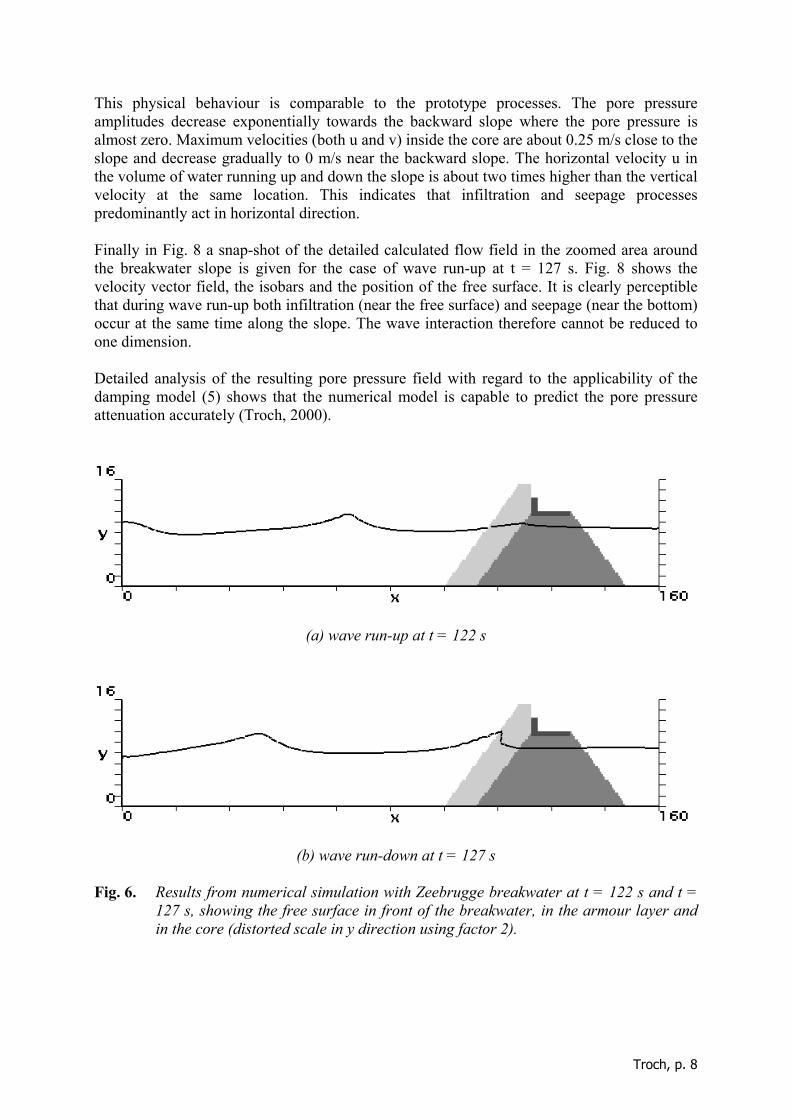
Fig. 6 shows the resulting free surface position in front of the breakwater, in the armour layerand in the core from the simulation at t = 122 s (run-down) and t = 127 s(run-up). Inside thearmour layer the energy dissipation of the wave action and the damped movements of the freesurface are observed. The variation of the water level in the core is even more attenuatedresembling the working principle of a breakwater.
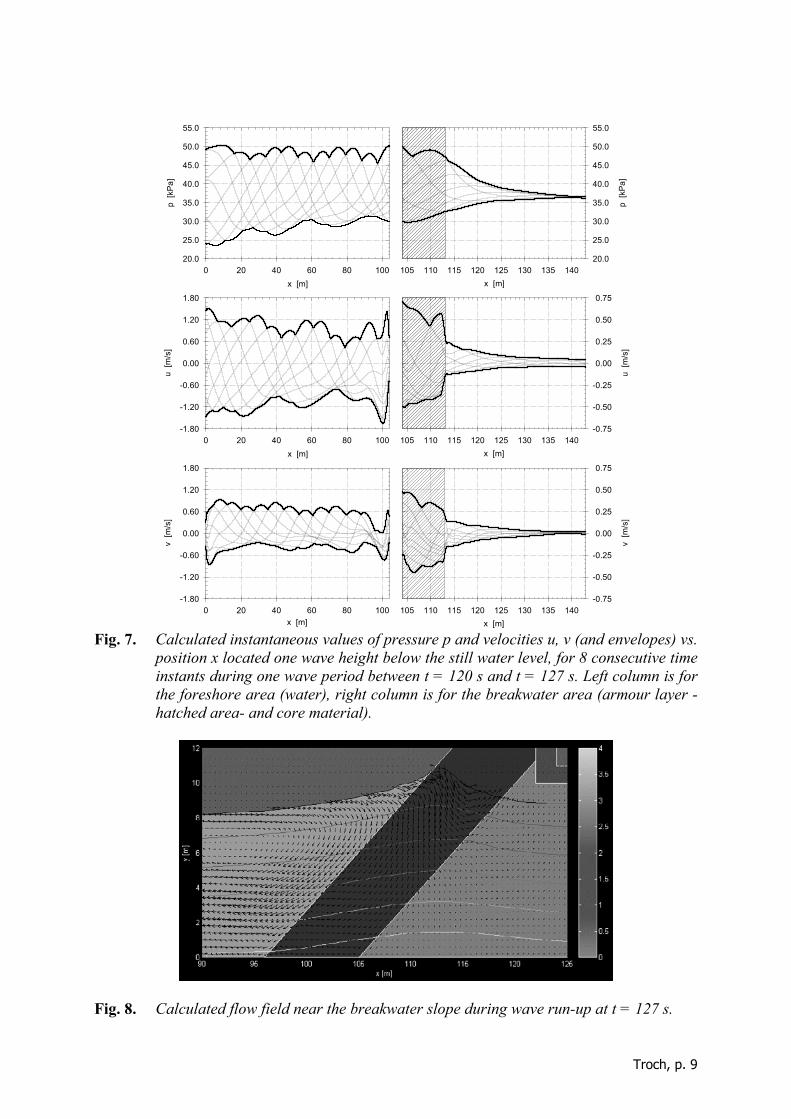
In Fig. 6 only information from the time instant of the two ‘snap-shots’ is available. It isrelatively easy to visualise the numerical results during a complete wave period in order toincrease the information that is calculated. In Fig. 7 the results from the calculations (pressurep, and velocity components u and v) are given for a cycle of one wave period. Instantaneousvalues at t = (i/9)T (i = 1, 2, ..., 8) and envelope values of pressure and velocities along the x-axis are presented. The data are taken from the horizontal level located one wave heightbelow the still water level, and are given for the foreshore area (left column) and for thebreakwater area (right column). In the graphs of the right column, the x-axis has beenstretched for better visualisation. Also, the u- and v-axis in the right column have beenstretched (factor 2) for better visualisation. The hatched area is the area inside the armourlayer. From these graphs in Fig. 7 it is seen that both pressure and velocities attenuate insidethe armour layer and even more in the breakwater core.
Fig. 5. Geometry of the numerical wave flume set-up, with wave generation at the leftboundary and the Zeebrugge breakwater near the right boundary.
Troch, p. 8
This physical behaviour is comparable to the prototype processes. The pore pressureamplitudes decrease exponentially towards the backward slope where the pore pressure isalmost zero. Maximum velocities (both u and v) inside the core are about 0.25 m/s close to theslope and decrease gradually to 0 m/s near the backward slope. The horizontal velocity u inthe volume of water running up and down the slope is about two times higher than the verticalvelocity at the same location. This indicates that infiltration and seepage processespredominantly act in horizontal direction.
Finally in Fig. 8 a snap-shot of the detailed calculated flow field in the zoomed area aroundthe breakwater slope is given for the case of wave run-up at t = 127 s. Fig. 8 shows thevelocity vector field, the isobars and the position of the free surface. It is clearly perceptiblethat during wave run-up both infiltration (near the free surface) and seepage (near the bottom)occur at the same time along the slope. The wave interaction therefore cannot be reduced toone dimension.
Detailed analysis of the resulting pore pressure field with regard to the applicability of thedamping model (5) shows that the numerical model is capable to predict the pore pressureattenuation accurately (Troch, 2000).
(a) wave run-up at t = 122 s
(b) wave run-down at t = 127 s
Fig. 6. Results from numerical simulation with Zeebrugge breakwater at t = 122 s and t =127 s, showing the free surface in front of the breakwater, in the armour layer andin the core (distorted scale in y direction using factor 2).
Troch, p. 9
x [m]0 20 40 60 80 100
p [k
Pa]
20.0
25.0
30.0
35.0
40.0
45.0
50.0
55.0
x [m]105 110 115 120 125 130 135 140
p [k
Pa]
20.0
25.0
30.0
35.0
40.0
45.0
50.0
55.0
x [m]0 20 40 60 80 100
u [m
/s]
-1.80
-1.20
-0.60
0.00
0.60
1.20
1.80
x [m]105 110 115 120 125 130 135 140
u [m
/s]
-0.75
-0.50
-0.25
0.00
0.25
0.50
0.75
x [m]0 20 40 60 80 100
v [m
/s]
-1.80
-1.20
-0.60
0.00
0.60
1.20
1.80
x [m]105 110 115 120 125 130 135 140
v [m
/s]
-0.75
-0.50
-0.25
0.00
0.25
0.50
0.75
Fig. 7. Calculated instantaneous values of pressure p and velocities u, v (and envelopes) vs.position x located one wave height below the still water level, for 8 consecutive timeinstants during one wave period between t = 120 s and t = 127 s. Left column is forthe foreshore area (water), right column is for the breakwater area (armour layer -hatched area- and core material).
Fig. 8. Calculated flow field near the breakwater slope during wave run-up at t = 127 s.
Troch, p. 10
4 Wave overtopping at an impermeable sea dike
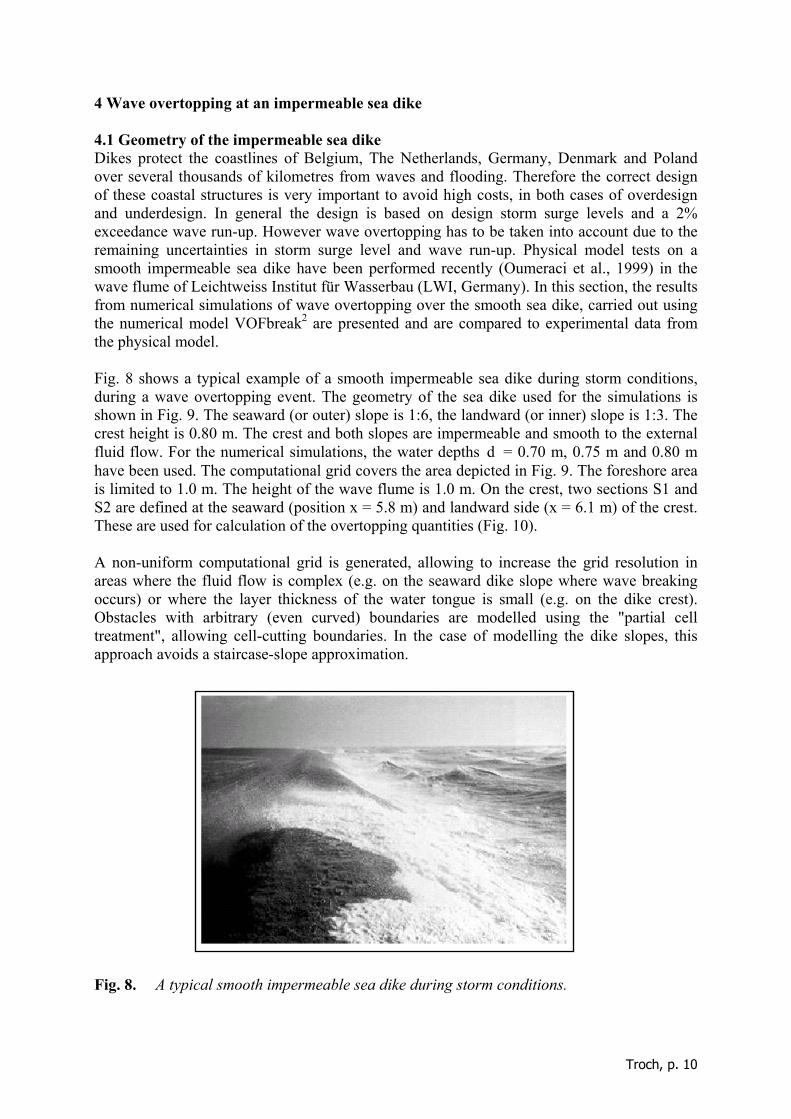
4.1 Geometry of the impermeable sea dikeDikes protect the coastlines of Belgium, The Netherlands, Germany, Denmark and Polandover several thousands of kilometres from waves and flooding. Therefore the correct designof these coastal structures is very important to avoid high costs, in both cases of overdesignand underdesign. In general the design is based on design storm surge levels and a 2%exceedance wave run-up. However wave overtopping has to be taken into account due to theremaining uncertainties in storm surge level and wave run-up. Physical model tests on asmooth impermeable sea dike have been performed recently (Oumeraci et al., 1999) in thewave flume of Leichtweiss Institut für Wasserbau (LWI, Germany). In this section, the resultsfrom numerical simulations of wave overtopping over the smooth sea dike, carried out usingthe numerical model VOFbreak2 are presented and are compared to experimental data fromthe physical model.
Fig. 8 shows a typical example of a smooth impermeable sea dike during storm conditions,during a wave overtopping event. The geometry of the sea dike used for the simulations isshown in Fig. 9. The seaward (or outer) slope is 1:6, the landward (or inner) slope is 1:3. Thecrest height is 0.80 m. The crest and both slopes are impermeable and smooth to the externalfluid flow. For the numerical simulations, the water depths d = 0.70 m, 0.75 m and 0.80 mhave been used. The computational grid covers the area depicted in Fig. 9. The foreshore areais limited to 1.0 m. The height of the wave flume is 1.0 m. On the crest, two sections S1 andS2 are defined at the seaward (position x = 5.8 m) and landward side (x = 6.1 m) of the crest.These are used for calculation of the overtopping quantities (Fig. 10).
A non-uniform computational grid is generated, allowing to increase the grid resolution inareas where the fluid flow is complex (e.g. on the seaward dike slope where wave breakingoccurs) or where the layer thickness of the water tongue is small (e.g. on the dike crest).Obstacles with arbitrary (even curved) boundaries are modelled using the "partial celltreatment", allowing cell-cutting boundaries. In the case of modelling the dike slopes, thisapproach avoids a staircase-slope approximation.
Fig. 8. A typical smooth impermeable sea dike during storm conditions.

Troch, p. 11
Fig. 9. Cross section of the sea dike cf. physical model tests at LWI .
Fig. 10. Detail of the dike crest, with sections S1 and S2 at seaward (position x = 5.8 m) andlandward side (x = 6.1 m) of the crest, respectively.
4.2 Calculation of overtopping quantities and test programmeA number of overtopping quantities are calculated from the numerical simulations. The directsolutions to the numerical calculations are the velocity components v,u in horizontal andvertical direction, the pressure p and the volume fraction F in each cell of the computationaldomain. The instantaneous configuration of the free surface is reconstructed from the discretemesh values of the volume fraction F . Velocities and pressure are available in discretelocations of the cells only. Using the information from these solved variables at each timestep, the overtopping quantities such as layer thickness )t(h , instantaneous discharge )t(qand cumulative overtopped volume of water )t(V are derived in both sections S1 and S2. Adetailed discussion of the derivation is given in Troch et al. (2002).
Table 1. Test programme for numerical simulations of the 1:6 sea dike, including wavecharacteristics H and T , water depth d , surf similarity parameter 0ξ andaverage overtopping rate labq .
TestNo.
H
[m]
T
[s]
d
[m]
0ξ
[-]
labq
[l/sm]
1 1 0.155 1.959 0.70 1.0 3.332 2 0.117 2.446 0.70 1.5 2.323 3 0.119 3.154 0.70 1.9 5.79
Troch, p. 12
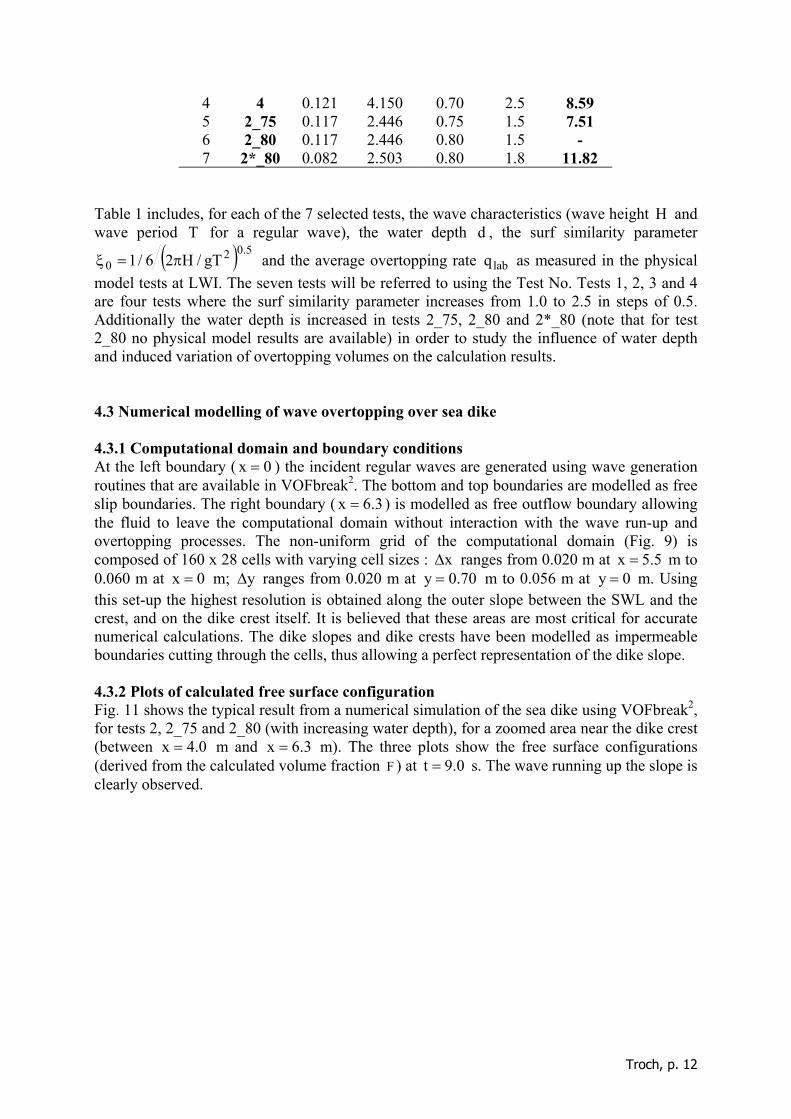
4 4 0.121 4.150 0.70 2.5 8.595 2_75 0.117 2.446 0.75 1.5 7.516 2_80 0.117 2.446 0.80 1.5 -7 2*_80 0.082 2.503 0.80 1.8 11.82
Table 1 includes, for each of the 7 selected tests, the wave characteristics (wave height H andwave period T for a regular wave), the water depth d , the surf similarity parameter
( ) 5.020 gT/H26/1 π=ξ and the average overtopping rate labq as measured in the physical
model tests at LWI. The seven tests will be referred to using the Test No. Tests 1, 2, 3 and 4are four tests where the surf similarity parameter increases from 1.0 to 2.5 in steps of 0.5.Additionally the water depth is increased in tests 2_75, 2_80 and 2*_80 (note that for test2_80 no physical model results are available) in order to study the influence of water depthand induced variation of overtopping volumes on the calculation results.
4.3 Numerical modelling of wave overtopping over sea dike
4.3.1 Computational domain and boundary conditionsAt the left boundary ( 0x = ) the incident regular waves are generated using wave generationroutines that are available in VOFbreak2. The bottom and top boundaries are modelled as freeslip boundaries. The right boundary ( 3.6x = ) is modelled as free outflow boundary allowingthe fluid to leave the computational domain without interaction with the wave run-up andovertopping processes. The non-uniform grid of the computational domain (Fig. 9) iscomposed of 160 x 28 cells with varying cell sizes : x∆ ranges from 0.020 m at 5.5x = m to0.060 m at 0x = m; y∆ ranges from 0.020 m at 70.0y = m to 0.056 m at 0y = m. Usingthis set-up the highest resolution is obtained along the outer slope between the SWL and thecrest, and on the dike crest itself. It is believed that these areas are most critical for accuratenumerical calculations. The dike slopes and dike crests have been modelled as impermeableboundaries cutting through the cells, thus allowing a perfect representation of the dike slope.
4.3.2 Plots of calculated free surface configurationFig. 11 shows the typical result from a numerical simulation of the sea dike using VOFbreak2,for tests 2, 2_75 and 2_80 (with increasing water depth), for a zoomed area near the dike crest(between 0.4x = m and 3.6x = m). The three plots show the free surface configurations(derived from the calculated volume fraction F ) at 0.9t = s. The wave running up the slope isclearly observed.

Troch, p. 13
LWI dike: Test 2, t = 9.0 s, d = 0.70 m, F variable
LWI dike: Test 2_75, t = 9.0 s, d = 0.75 m, F variable
LWI dike: Test 2_80, t = 9.0 s, d = 0.80 m, F variable
Zoom
0.4
1.0
4.0 6.3
Fig. 11. Free surface configurations (derived from volume fraction F ) at time step 0.9t = s,for a zoomed area near the dike crest, for three tests with increasing water depth.
The voids in the up-running water tongue do not represent air bubbles in the breaking wavefront. These voids are rather inaccuracies in modelling the free surface configuration for thathighly turbulent flow area. A comparison of wave overtopping on the dike crest for test 2,2_75 and 2_80 respectively, at 0.9t = s is made. For higher water depths the layer thicknesson the crest and the volume of overtopping water increases clearly. Fig. 11 illustrates that thephysical processes of wave run-up and overtopping seem to be modelled in a realistic way.Quantitative validations using laboratory data will be carried out next.
4.3.3 Layer thickness and dischargeIn both sections S1 (at 8.5x = m) and S2 (at 1.6x = m), layer thickness )t(h and instanta-neous discharge )t(q have been calculated from the solved variables. A typical example ofthe resulting plot of time history of )t(h and )t(q is given in Fig. 12 for test 3. After onewave already (at 0.6t = s) a reasonable regular pattern of wave overtopping is seen with alayer thickness of 0.07 m on average and a discharge of 0.02 m3/sm on average, for section 1.At section 2 the regular pattern is not very clear, and although there is a clear correlation intime (time shift of the peaks at S2) both )t(q and )t(q may be underestimated. Comparison ofcumulative overtopping volumes is required to conclude on this. The same regular pattern ispresent in most of the other tests as well and is acceptable as the transients from the "coldstart" (from still water conditions) may have some limited influence on the results.

Troch, p. 14
Fig. 12. Time series of layer thickness )t(h and discharge )t(q at S1 and S2 for test 3.
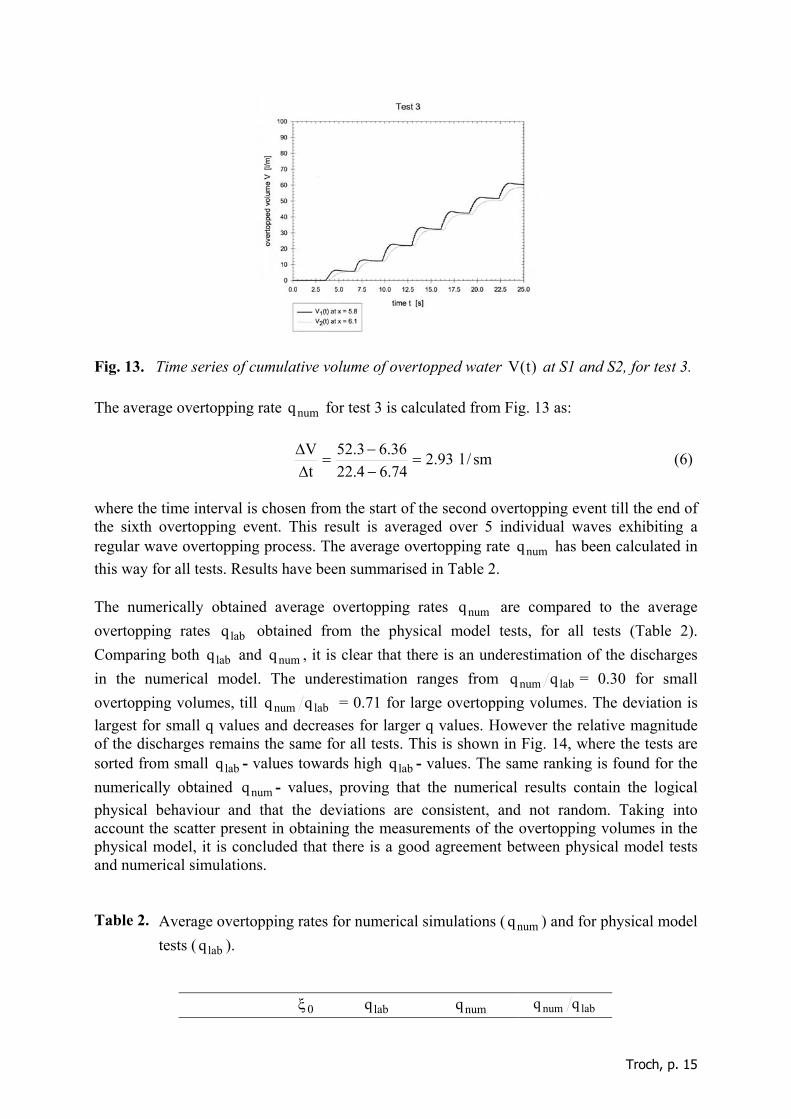
6.2.3 Cumulative volume )t(V and average overtopping rate numqThe cumulative volume V of overtopped water at both sections is calculated from )t(q , andis given in Fig. 13 for test 3. It is observed that a regular pattern of the wave overtopping insection S1 is present again. The cumulative overtopping volume in section S2 is time shifted(time required for the water to propagate over the crest), and seems to underestimate slightlythe recorded overtopping volume in section S1. Seven individual overtopping events arepresent. The cumulative volume of water increases first and decreases slightly afterwards,during one wave period. This effect is due to the negative values of the discharge (in Fig. 12)meaning that water is flowing in the negative (i.e. seaward) direction at the start of the run-down.
Troch, p. 15
Fig. 13. Time series of cumulative volume of overtopped water )t(V at S1 and S2, for test 3.
The average overtopping rate numq for test 3 is calculated from Fig. 13 as:
sm/l93.274.64.2236.63.52
tV
=−−
=∆∆ (6)
where the time interval is chosen from the start of the second overtopping event till the end ofthe sixth overtopping event. This result is averaged over 5 individual waves exhibiting aregular wave overtopping process. The average overtopping rate numq has been calculated inthis way for all tests. Results have been summarised in Table 2.
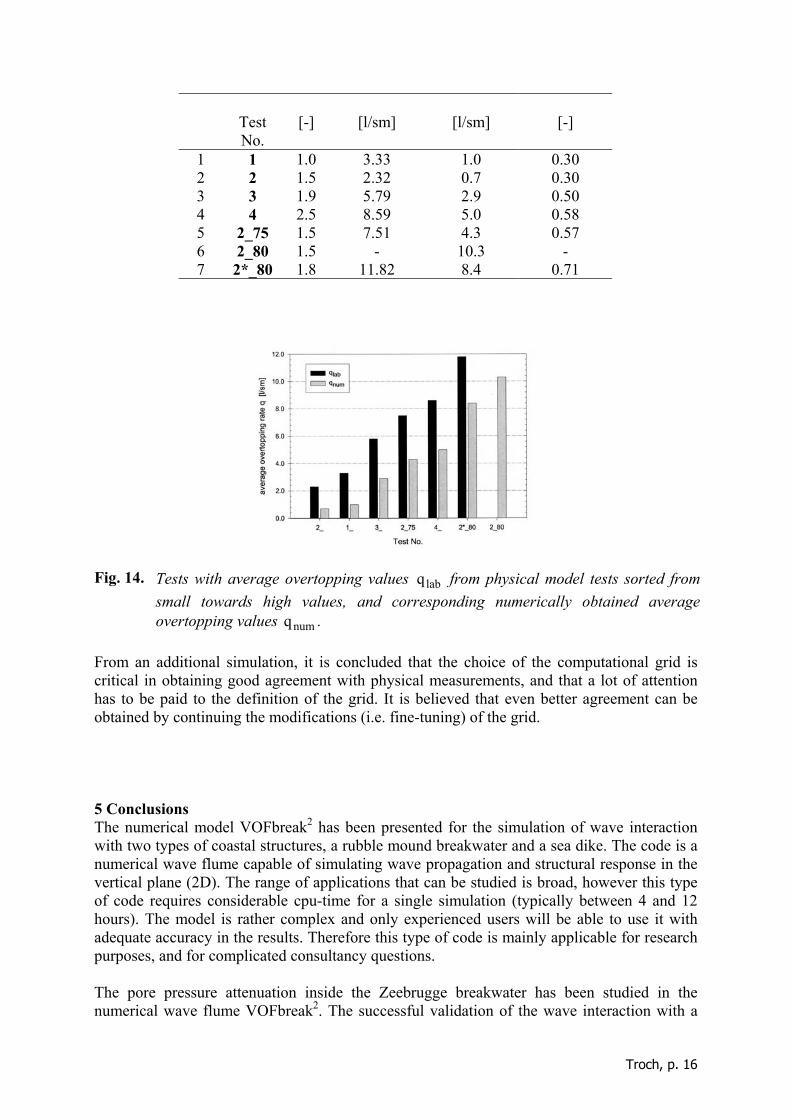
The numerically obtained average overtopping rates numq are compared to the averageovertopping rates labq obtained from the physical model tests, for all tests (Table 2).Comparing both labq and numq , it is clear that there is an underestimation of the dischargesin the numerical model. The underestimation ranges from labnum qq = 0.30 for smallovertopping volumes, till labnum qq = 0.71 for large overtopping volumes. The deviation islargest for small q values and decreases for larger q values. However the relative magnitudeof the discharges remains the same for all tests. This is shown in Fig. 14, where the tests aresorted from small labq - values towards high labq - values. The same ranking is found for thenumerically obtained numq - values, proving that the numerical results contain the logicalphysical behaviour and that the deviations are consistent, and not random. Taking intoaccount the scatter present in obtaining the measurements of the overtopping volumes in thephysical model, it is concluded that there is a good agreement between physical model testsand numerical simulations.
Table 2. Average overtopping rates for numerical simulations ( numq ) and for physical modeltests ( labq ).
0ξ labq numq labnum qq
Troch, p. 16
TestNo.
[-] [l/sm] [l/sm] [-]
1 1 1.0 3.33 1.0 0.302 2 1.5 2.32 0.7 0.303 3 1.9 5.79 2.9 0.504 4 2.5 8.59 5.0 0.585 2_75 1.5 7.51 4.3 0.576 2_80 1.5 - 10.3 -7 2*_80 1.8 11.82 8.4 0.71
Fig. 14. Tests with average overtopping values labq from physical model tests sorted fromsmall towards high values, and corresponding numerically obtained averageovertopping values numq .
From an additional simulation, it is concluded that the choice of the computational grid iscritical in obtaining good agreement with physical measurements, and that a lot of attentionhas to be paid to the definition of the grid. It is believed that even better agreement can beobtained by continuing the modifications (i.e. fine-tuning) of the grid.
5 ConclusionsThe numerical model VOFbreak2 has been presented for the simulation of wave interactionwith two types of coastal structures, a rubble mound breakwater and a sea dike. The code is anumerical wave flume capable of simulating wave propagation and structural response in thevertical plane (2D). The range of applications that can be studied is broad, however this typeof code requires considerable cpu-time for a single simulation (typically between 4 and 12hours). The model is rather complex and only experienced users will be able to use it withadequate accuracy in the results. Therefore this type of code is mainly applicable for researchpurposes, and for complicated consultancy questions.
The pore pressure attenuation inside the Zeebrugge breakwater has been studied in thenumerical wave flume VOFbreak2. The successful validation of the wave interaction with a
Troch, p. 17
breakwater with simple geometry has been presented. The Zeebrugge breakwater has beenmodelled in the numerical wave flume. Several types of results derived from the calculatedvariables have been presented, and are useful for further interpretation of the wave interaction.Comparing the numerically obtained pore pressures to the experimentally obtainedconclusions, the same conclusions on the pore pressure distribution have been found.
Measurements from physical model tests of wave overtopping on a smooth impermeable seadike have been used to validate the VOFbreak2 numerical model for this type of wave-structure interaction. A dike geometry with a 1:6 outer slope has been used for thesimulations, and a test programme including 9 simulations was executed. Overtoppingquantities, such as layer thickness, discharge and cumulative volume of overtopping waterhave been calculated from the simulations. The resulting average overtopping rates have beenderived, and compared to the average overtopping rates obtained in the physical model tests.Wave run-up and overtopping are modelled in a realistic way. A quantitative comparison ofthe results from the simulations and the physical model tests show good agreements for theaverage overtopping rates. This agreement is better for higher overtopping volumes. Finally itis indicated that the results are dependent on the grid definition.
With regard to future developments of the numerical wave flume, a number of importantaspects have to be looked at, and are currently under development. For a better simulation ofthe wave breaking process, a state-of-the-art turbulence model will be implemented.Improvements with regard to the VOF method, the discretisation in finite volumes and the useof higher order discretisation schemes are underway. Validation of the code for the case ofwave impact against vertical and horizontal walls is carried out.
Troch, p. 18
References
De Groot M.B., Yamazaki H., van Gent M.R.A., Kheyruri Z., 1994. Pore pressures in rubblemound breakwaters. Proc. 24th Int. Conference on Coastal Engineering, Kobe, Japan. ASCE,New York, Vol. 2, pp 1727-1738.
Harlow E.H., 1980. Large rubble mound breakwater failures. Proc. ASCE Jo. W'way, Portand Coastal Div., Vol. 106, WW2.
Kothe D.B., Mjolsness R.C., Torrey M.D., 1991. RIPPLE: a computer program forincompressible flow with free surfaces. Report LA-12007-MS, Los Alamos Scientific Report,Los Alamos, New Mexico, USA.
Nichols B.D., Hirt C.W., Hotchkiss R.S, 1980. SOLA-VOF: a solution algorithm for transientfluid flow with multiple free boundaries. Report LA-8355, Los Alamos, California, USA.
Oumeraci H., Schüttrumpf H., Bleck M., 1999. Wave overtopping at sea dikes. Comparisonof physical model tests and numerical computations. OPTICREST technical report Task 3.2and Task 5.
Troch P., 2000. Experimental study and numerical simulation of wave interaction with rubblemound breakwaters. Ph.D. thesis, Dept. Of Civil Engineering, Ghent University, Belgium.
Troch P., De Rouck J., 1999. An active wave generating-absorbing boundary condition forVOF type numerical model. Coastal Engineering, Vol. 38 (4), pp. 223-247.
Troch P., De Rouck J., Burcharth H.F., 2002. Experimental study and numerical modelling ofwave induced pore pressure attenuation inside a rubble mound breakwater. 28th InternationalConference on Coastal Engineering, 7 – 12 July 2002, Cardiff, Wales (UK).
Troch P., De Rouck J., Schüttrumpf H., 2002. Numerical simulation of wave overtoppingover a smooth impermeable sea dike. Proc. Advances in Fluid Mechanics AFM2002, Ghent,Belgium, pp. 715 – 724.