numerical study of the influence of reactor design on...
TRANSCRIPT

316 Journalof CrystalGrowth 112 (1991)316—336North-Holland
Numerical study of the influence of reactordesignon MOCVDwith a comparisonto experimentaldata
Andrew N. Jansen*, Mark E. Orazem*
Departmentof ChemicalEngineering, University of Virginia, Charlottesville, Virginia 22901, USA
BradleyA. Fox and William A. Jesser
Departmentof Materials Science, University of Virginia, Charlottesville, Virginia 22901, USA
Received14 August 1990; manuscript receivedin final form 28 January 1991
Comparisonswere madebetweenexperimentaldata and a two-dimensionalmodel for the MOCVD of GaAs from trimethylgal-
hum and arsinein two horizontal air cooled reactor geometries.A unique featureof this work wasthat comparisonwas made,not
only on the wafer, but over the entire deposition regime. Excellent agreementwas achievedfor growth at low systempressures.
Experimentaldeposition profiles under atmosphericpressurewere much less uniform than those predicted by the model. This
difference couldnot be attributedto a pressuredependenceof heterogeneousreactions. Inclusionof thermal diffusion had little effect
on the uniformity of the calculateddepositionprofile but decreasedthe magnitudeof the growth rate by up to 12%.Through model
calculations and experiments,it was determinedthat a channelwith a tilted upper wall and a horizontal susceptorhas the same
growth rate profile asdoesa standardhorizontal upperwall channelwith a tilted susceptor.Substraterotation was predictedto cause
growth rate uniformity within less than 4.3% in horizontal channel flow and 3.8% in a channelwith tilted walls.
I. Introduction tam gallium. Typical models are based on aLevêque development in which the governing
Metalorganic chemical vapor deposition equationsare those for fluid mechanicscoupled(MOCVD) differs from otherchemicalvapor de- with convectiveheat and mass transfer. In theseposition processesin the type of phenomenathat models, gas phaseand surfacereactionsare usu-limits the growth rate. In silicon depositionfrom ally neglected(seeref. [1] for a review). Typicalsilane, for example,it has beendeterminedthat boundary conditions for the convective massthe growth rateis limited by the ratesof gasphase transfer are that concentrationsof reactantsup-reactions.Models basedon this with appropriate streamof the substrateare the sameas the inletchemical reactionsand rate constantsare able to concentrationsand that the concentrationof thepredict the resultsof various experimentalcondi- limiting reactanton the substratesurfaceis zero.tions [1,2]. In contrast, MOCVD processesare Depositionis assumedto occur only on the sub-usually assumedto be masstransportlimited un- strate, and the resulting flux of the limiting re-der conventionaloperatingconditions[3—13].In actant is infinite at the leading edge of the sub-the caseof GaAsgrown from arsineand trimeth- strate.ylgallium, the limiting speciesis assumedto con- The object of this work was to develop a
mathematicalmodel that could be used as a pre-dictive tool for the design of MOCVD reactors.
* Current address: Department of Chemical Engineering, One of the first numericalmodels developedex-
University of Florida, Gainesville, Florida 32611, USA. plicitly for MOCVD was the three-dimensional
0022-0248/91/$03.50© 1991 Elsevier SciencePublishersB.V. (North-Holland)

A.N. Jansenet al. / influenceof reactordesignon MOCVD 317
model of Moffat and Jensen[4]. A unique feature reactionmechanismapplied over the entire de-of this model was that it predictedthe formation position region. The two-dimensional analysisof axial roll cells that are observedduring growth treatedthe reactorchanneland flow conditionsinunderatmosphericpressures.Theseroll cells can- MOCVD of gallium arsenide (GaAs) from tn-not bepredictedby two-dimensionalmodels.Their methylgallium (TMG) and arsine (AsH3) in anumerical method required that diffusion of carrier gas of hydrogen(H2). The model predict-momentum,energy,and massin the direction of ions were compared to experimentaldata thatflow be neglected.Thermaldiffusion was not in- encompassedthe entire deposition region. Thecluded, and the heterogeneousreaction was as- two-dimensional formulation was valid for lowsumedto be first order with a rate constantcho- pressureswhere axial roll cells were not expectedsen to be sufficiently largethat the depositionwas to develop.masstransferlimited. Ouazzaniandcoworkers[5]developeda two-dimensionalmodel that includedaxial diffusion of momentum,energy, and masswith thermal diffusion. The model also included 2. Reactionkineticsan entrance region. Chinoy and coworkers [6]modeled the effect of susceptortilt with a model Models for the growth of Ill—V materialsbythat was similar to the abovebut neglectedther- MOCVD seem to fall into two classes.Two- ormal diffusion. Holsteinandcoworkers[7] analyzed three-dimensionalmodels that account for corn-the effect of a tilted susceptorthrough a two-di- plicated flow and masstransferpatternstypicallymensional model that included axial diffusion of assumethat the depositioncan be describedinmomentum,energy, and massand thermal diffu- terms of a simplesurfacereaction,e.g.,sion.
Depositionof GaAshas beenobservedexperi- Ga(CH3)3+ AsH3 —s GaAs+ CH4. (1)mentallyon regionsbeforeandafter the substrate.In order to model this effect, a surfacereaction Models for one-dimensionalsystemshave beenexpressionmust be applied to the entranceand developedthat account for the large numberofexit regions. The usual models do not address homogeneousandheterogeneousreactionsthataretheseregions.As a result,whenmostmodel calcu- predicted by thermodynamic considerations.lations are comparedto experimentaldata, only Tirtowidjojo and Pollard [9] have presented adata from the middleportionof the substratecan model for the reaction of trimethylgallium andbe used.Comparisonto data in the leading and arsinein an impinging jet reactorthat included60trailing regionsof the substratemay providevalu- speciesand 232 reactions in the gas phaseandable information since it is in theseregions that another19 speciesand 115 processesat the sub-the transportmechanismsundergothemostabrupt strate.Their work explored the operatingcondi-changes.The presenceof largetemperaturegradi- tions underwhich different reactionscan controlents and the modestPecletnumbersobtainedfor the depositionprocess.these flows suggestthat thermal diffusion and Comparison of experimental data to modelaxial diffusion termsshouldbe retained.Bulsari et calculationsseemsto indicatethat the growth rateal. [8] treated depositionin leading and trailing is diffusion limited undertypical operatingcondi-regionsof a tilted susceptorthrougha two-dimen- tions for flow-by reactors[3,9—13].Thus, TMGsional model that included the effects of axial was assumedto be the limiting reactant for adiffusion. This work extended the model devel- heterogeneousdepositionof GaAs. The kineticopedby Bulsanet al. [8] throughincorporationof rateexpressionusedwas eitherfirst order in con-thermal diffusion and treatmentof the influence centration(R = kWTMG) or expressionsbasedonof a tilted upperwall andof substraterotation. Langmuir—Rideal or Langmuir—Hinshelwood
Thework presentedhereaddresseda horizontal mechanisms[13]. With the assumptionsof strongreactor through the incorporation of a surface arsineadsorption[13—15], constantconcentration

318 A. N.Jansenet al. / influenceof reactor designon MOCVD
of arsine,anda relatively smallpartial pressureof were chosen to match those of the experiment.TMG, theLangmuir expressionsreduceto The only adjustable parameter involved in the
/ model wasthat of theheterogeneousreactionrateRLR kLR~TM(~P, ~2 constant, k.
and
2 / 3.1. ExperimentalRLH=kLHWTMGP , ~3)where RLR and RLH are the rate of reaction for The experimentalsystemwasa Crystal Special-theLangmuir—Ridealand theLangmuir—Hinshel- ties Model 425 horizontalair-cooledMOCVD epi-wood mechanisms,respectively,and kLR and kLH taxial reactor. Two different quartzchannelswere
arepseudorateconstantsthat follow an Arrhenius used in the experiments.The first was a standardrelation.Theseexpressionarereferredto assurface horizontal channelwith a height of 4 cm and anreactionmechanismsthat are first order and sec- angleof inclination of 9.0° for the susceptor.The
ond order in total pressure(first order in con- secondchannelwasa customdesignfabricatedforcentrationof TMG) sincetheseexpressionsrepre- this researchwhich hada horizontal susceptoronsent asymptotic limits of the completeLangmuir the lower surfacewall anda tilted upper wall. The
expressions. height of this channelwas 3 cm and the angleofdeclination was 7.4°.Both reactorchannelswereof a length of 19.3 cm from the inlet manifold to
3. Procedure the exit manifold and a width of 9 cm (see figs. Iaand2a).
The conditions and properties used in the The carrier gaswas hydrogen at pressuresofmodel, including Fickian and thermal diffusion 0.1 or 1.0 atm. Two massflow rateswereused at
coefficients, viscosities, densities, and flow rates, both pressuresfor each channel (the high mass
-11 = 3 cm~
— = 4 cm
= 9 cm
14 = 19 cm— (a)1=22.3cm
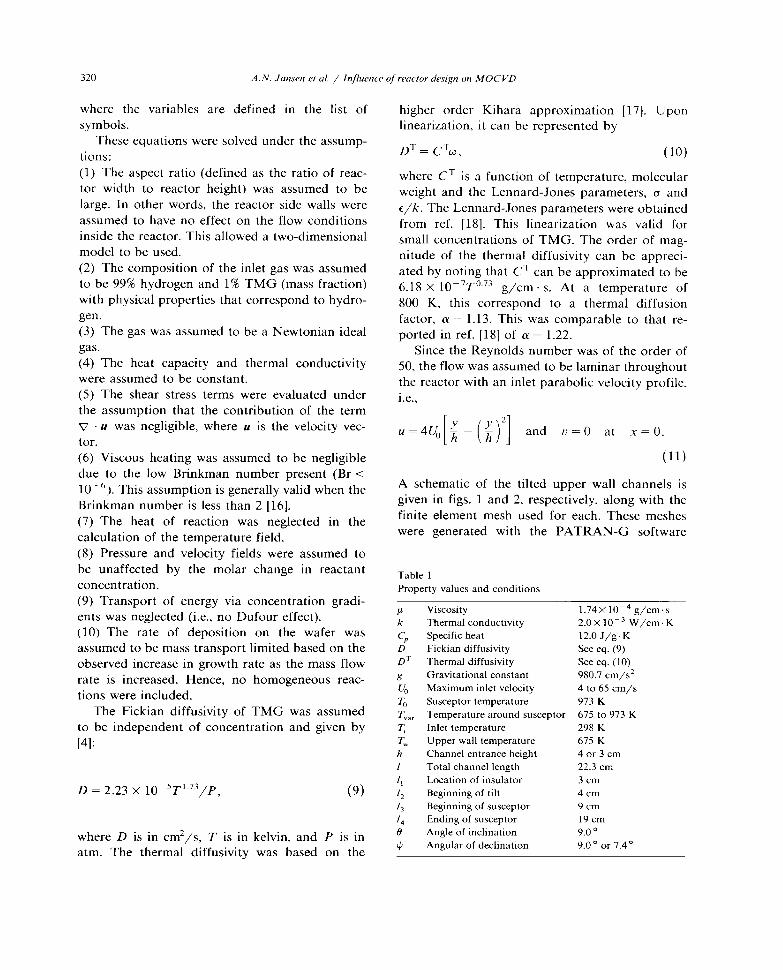
~H~jFig. 1. Thehorizontal tilted susceptorreactor:(a) geometry;(b) finite elementmesh.

A. N. Jansenet al. / Influenceof reactordesignon MOCVD 319
LThT~R
13 = 9 ciii1
4=l9crn (a)I = 22.3 cm
Fig. 2. Thehorizontal tilted upperwall reactor: (a) geometry;(b) finite elementmesh.
flow rate was twice the low massflow rate). This theequationsof motion,correspondedto a total of eight runs,four for each
channel.The massfraction of TMG in thecarrier ~ + ~ = — .~ + ~ ~—~- + ~ (5)gas was 0.01% at the high mass flow rate and 8x 0)’ Ox Ox
2 8y2
0.02% at the low mass flow rate,and the ratio of dpartial pressureof arsineto TMG was20 to 1 in anboth cases.In order to gain insight into theperfor- av OP 02v 82v
manceof themodel, a quartzstrip wasusedas the pU~ + pv~ = — + ft + — pg,substrateto match the surroundingwalls. Thispermittedneglectof crystalorientation effectson 6the growth profile. The substratewasmaintained
theequationof energyat a temperatureof 973 K by radio frequencyheatingcoils. A warm-up time of severalminutes 02T 02Twasusedbeforetheadmittanceof the reactantsin PC~U~’+ k ~ + ~ ‘ (7)order to attain a steadystate temperatureprofile,after which depositionoccurredfor 20 mm. and the equationof convectivediffusion for the
limiting reactant,3.2. Numerical
Ow Ow+
The two-dimensionalsteadystatemodel of the X
horizontalCVD reactorincorporatedthe simulta- — a ~ Ow\ 0 Owneoussolution of the equationof continuity, — Ox ~~ Ox) + ~—~pD Oy
(4) ~ (8)Ox Oy Ox ~ Ox j Oy ~ Oy /
320 AN. Jansenci al. / influenceof reactordesignon MOCVD
where the variables are defined in the list of higher order Kihara approximation [17]. Uponsymbols. linearization, it can be representedby
Theseequationsweresolvedunderthe assump- DT = CW, (10)
tions:(1) The aspectratio (defined as the ratio of reac- where CT is a function of temperature,moleculartor width to reactorheight) was assumedto be weight and the Lennard-Jonesparameters,a andlarge. In other words, the reactorside walls were c/k. The Lennard-Jonesparameterswereobtainedassumedto haveno effect on the flow conditions from ref. [181. This linearization was valid forinside the reactor. This alloweda two-dimensional small concentrationsof TMG. The order of mag-
model to be used. nitude of the thermal diffusivity can be appreci-(2) The compositionof the inlet gaswas assumed atedby noting that CT can be approximatedto be
to be 99% hydrogenand 1% TMG (massfraction) 6.18 X 10⁷T°’73 g/cm. s. At a temperatureof
with physicalpropertiesthat correspondto hydro- 800 K, this correspond to a thermal diffusiongen. factor, a = 1.13. This was comparableto that re-(3) The gaswasassumedto be a Newtonianideal portedin ref. [18] of a= 1.22.
gas. SincetheReynoldsnumberwasof the orderof(4) The heat capacity and thermal conductivity 50, the flow wasassumedto be laminar throughoutwereassumedto be constant, the reactorwith an inlet parabolicvelocity profile,(5) The shear stress terms were evaluatedunder i.e.,the assumptionthat the contributionof the termv u was negligible, where u is the velocity vec- u = 4U[~’ — (‘)2] and v = 0 at x = 0.tor.(6) Viscous heatingwas assumedto be negligible (11)due to the low Brinkman numberpresent(Br <
A schematicof the tilted upper wall channelsis10-6). This assumptionis generallyvalid whentheBrinkman numberis less than 2 [16]. given in figs. I and2, respectively,along with the
finite elementmesh used for each. Thesemeshes(7) The heat of reaction was neglected in thewere generatedwith the PATRAN-G software
calculationof the temperaturefield.(8) Pressureand velocity fields were assumedtobe unaffected by the molar change in reactant Table 1
concentration. Property valuesand conditions
(9) Transportof energy via concentrationgradi- g Viscosity 1.74X10⁴ g/cms
entswasneglected(i.e., no Dufoureffect). k Thermalconductivity 2.0X 10 ‘ W/cm’ K
(10) The rate of deposition on the wafer was c~, Specificheat 12.0 J/gK
assumedto be masstransportlimited basedon the D Fickian diffusivity Seeeq. (9)
observedincreasein growth rateas the massflow DT Thermaldiffusivity Seeeq. (10)
rate is increased.Hence, no homogeneousreac- g Gravitationalconstant 980.7 cm/s2U~ Maximum inlet velocity 4 to 65 cm/s
tionswere included. T
0 Susceptortemperature 973 K
The Fickian diffusivity of TMG was assumed Tvar Temperaturearoundsuseeptor 675 to 973 K
to be independentof concentrationandgiven by T Inlet temperature 298 K
[4]: T~ Upper wall temperature 675 Kh Channelentranceheight 4 or 3 cm
I Total channellength 22.3 cm
l~ Locationof insulator 3 cmD 2.23 X 10
5T173/P, (9) 12 Beginningof tilt 4cm
13 Beginningof susceptor 9 cm
/4 Endingof susceptor 19 cm
where D is in cm2/s, T is in kelvin, and p is in 0 Angle of inclination 9.00~ Angular of declination 9.00 or 740
atm. The thermal diffusivity was based on the _____________________________________________

AN. Jansenci aL / Influenceof reactordesignon MOCVD 321
1000 I I I I I I I Ipackage[19]. The dimensionsof the reactorchan- -
nels, the fluid properties, and the temperature -950
boundaryconditionsare givenin table 1.The boundary conditions used for the fluid
900mechanics equation were: a parabolic velocity ~profile (eq. (11)) at the inlet, a zero normal veloc- 0j
C. 950
ity gradientat the exit, andzero velocity compo-nents at the upper and lower surfacewalls. The ro
pressurewas specifiedat theexit of the reactoras ~E0)P=P~+pgy, (12)
whereP0 is the referencepressure.
For the energy equation,an inlet temperature 700
was specified up to a boundaryline where the - -
temperatureincreasesabruptly to account for an 650 - I I I -0.0 1.0 2.0 3.0 4.0
inlet manifold. A zero normal temperaturegradi-Axial distance from susceptor, cm
ent wasspecified at theexit. The temperaturefortheuppersurfacewall wasassumedto beconstant Fig. 3. Temperature profile of the quartz wall around the
substrate.at 675 K. The upperwall temperaturewas belowthe detectionlimit by optical pyrometry; thereforethis valuewaschosenbasedon the observationofthe onsetof depositionon the upperwall which where it should be noted that x in this contextcan be consideredto be negligibleat temperatures refers to the edgeof the substrateat temperaturebelow 650 K [13]. The susceptorwas assumedto
be held at a constant temperature(973 K). This T0 = 973 K. The substitutionof p = dT/dx trans-forms eq. (13) totemperaturewas measuredwith a thermocouple
built into the susceptor. ~ = a(T4 — T~,4)/L. (16)
The lower surfacewall temperaturearound thesubstratewas determinedvia an energy balance This expressioncan be integratedto yieldon thequartzwall that surroundsthe substrate.Itwas assumedthat the quartz wall conducts the dT — — (2o/5kL)1~2heat in an axial direction with heat loss due to dx —radiation to the upperwall. This canbeexpressed >< — Ta5) — s(T1~4— T5)J1/2 (17)
asThis differential equationwas solved by the for-
k~ = — ~4)/L, (13) ward difference method,andthe result is shownindx2
fig. 3. This temperatureprofile was used as thewhere k is the thermal conductivity of quartz boundary condition on the quartz wall that sur-taken as 0.0138W/cm’ K, a is the Stefancon- rounds thesubstrate.The aboveboundarycondi-stant taken as5.67 X 10— 12 W/cm2. K4, Ta is the tions were then used in thesimultaneoussolutiontemperatureof the upperwall (675 K), and L is of eqs. (4) to (7).thequartz thickness(0.5 cm). The boundarycon- The boundaryconditions for eq. (8) were: theditions were massfraction of TMG wassetto 0.01 at the inlet,
T= 7~ at x = 0, (14) andthenormal flux of TMG wassetequalto zeroon theupperwall surface, at the exit, andon the
andlower surfacewall of theentranceregion, ‘2• The
dT flux of TMG normal to the bottom wall was set—=0 at T=T~, (15)dx equal to a kinetic rate expressionon thesusceptor
322 AN. Janseneta!. / Influenceofreactor designon MOCVD
andthe regionbeforeandafter it. This expression and temperature throughout the reactor. Thesecan be representedas resultswere then used in the massbalanceequa-
tion to solve for theconcentrationprofile through-R = kOWTM(;P”, (18) out the reactor.
where P is total pressure,n = 0, 1, or 2, and k Eqs.(4) through(7) weresolvedwith the useof
follows an Arrheniusrelation: a finite element software packagedeveloped byRice and Schnipke[20,21]. A unique feature of
k0 = A e~i?T, (19) this softwarewas its useof an equal-orderveloc-
ity—pressureformulation which eliminatedspun-with E = 270 kJ/mol and AP°= 0.6 X 10¹⁴ ous pressuremodes. This method was incorpo-g/cm
2.5 [81. ratedin programTURBO2D,a tailoredversionof
the commercial program package FLOTRAN3.2.1. Solution of fluid mechanicsand energy equa- which is distributed by COMPUFLO Inc. [22].lions This program usedaniterative methodthat could
A significantsimplification wasmadewhen the be monitored by theerror residualsfor the veloc-
equationsof fluid mechanicsand energy (eqs. (4) ity components,temperature,andpressureat eachto (7)) weredecoupledfrom the equationfor con- iteration. The program was terminated after thevectivediffusion (eq. (8)). This can be done with error residual leveled off at typically 1O~. Inthe assumption that the heat of reactions and most casesthis required300 to 400 iterations.Thismolar changesbetween reactants and products program was executedon a PRIME 4150 in typi-had negligible effect on the fluid mechanicsand cally 6 h of CPU time in an interactivemode.energy equation(the mass fraction of TMG was The codecalculatednodalvelocity components,
lessthan 1.0% of the total gasflow). Thus the fluid temperature,andpressure.Theseresultscan eithermechanicsand energy equationscould be solved be used for input into the mass transfer analysisseparatelyto determinethe velocity components or to view the streamlines, temperature,or pres-
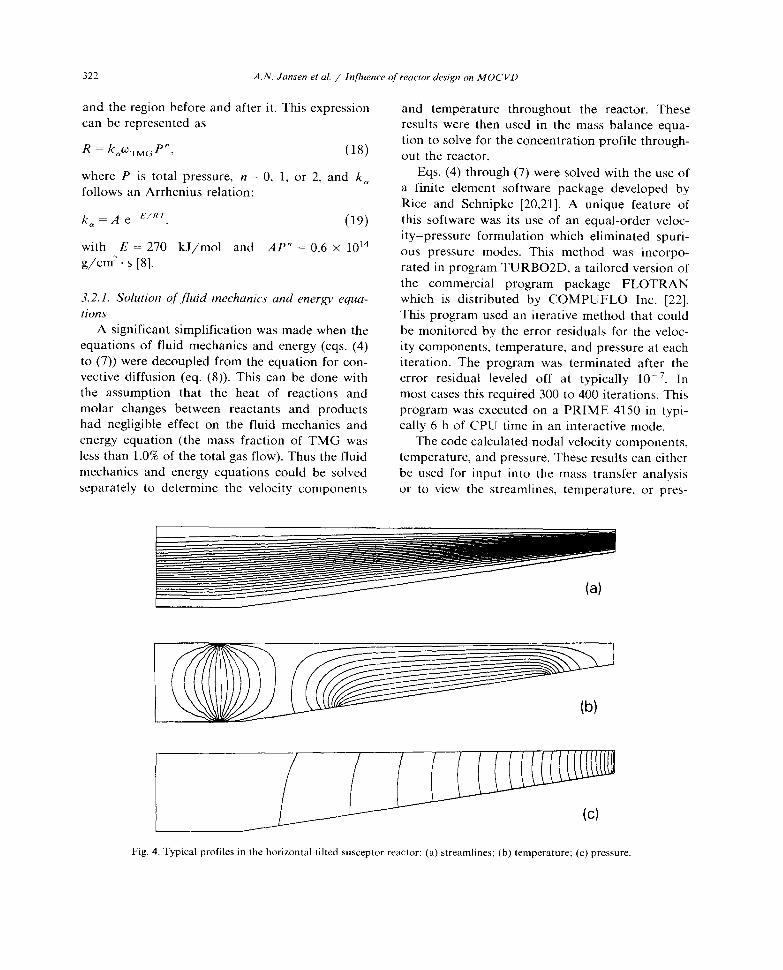
Fig. 4. Typical profilesin the horizontal tilted susceptorreactor: (a) streamlines;(h) temperature;(c) pressure.
AN. Janseneta!. / Influenceofreactordesignon MOCVD 323
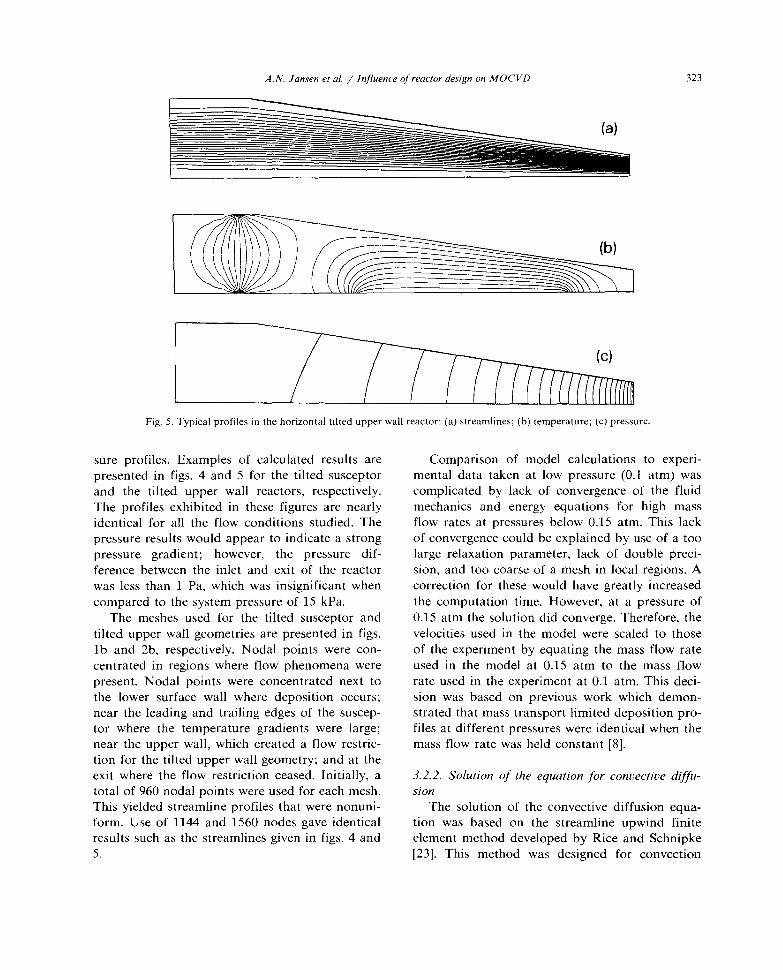
Fig. 5. Typical profiles in thehorizontal tilted upperwall reactor:(a) streamlines;(b) temperature;(c) pressure.
sure profiles. Examples of calculated results are Comparison of model calculations to expeni-presentedin figs. 4 and 5 for the tilted susceptor mental data taken at low pressure(0.1 atm) wasand the tilted upper wall reactors, respectively, complicatedby lack of convergenceof the fluidThe profiles exhibited in thesefigures are nearly mechanicsand energy equations for high massidentical for all the flow conditions studied. The flow ratesat pressuresbelow 0.15 atm. This lackpressureresultswould appearto indicatea strong of convergencecould be explainedby useof a toopressure gradient; however, the pressure dif- large relaxationparameter,lack of double preci-ference betweenthe inlet and exit of the reactor sion, and too coarseof a meshin local regions.Awas less than 1 Pa, which was insignificant when correction for thesewould havegreatly increasedcomparedto thesystempressureof 15 kPa. the computation time. However, at a pressureof
The meshesused for the tilted susceptorand 0.15 atm the solution did converge.Therefore,thetilted upperwall geometriesarepresentedin figs. velocities used in the model were scaledto thoselb and 2b, respectively.Nodal points were con- of theexperimentby equatingthe mass flow rate
centratedin regionswhere flow phenomenawere used in the model at 0.15 atm to the mass flowpresent. Nodal points were concentratednext to rate usedin theexperimentat 0.1 atm. This deci-the lower surfacewall where depositionoccurs; sion was basedon previouswork which demon-near the leading and trailing edgesof the suscep- stratedthat masstransportlimited depositionpro-ton where the temperaturegradients were large; files at different pressureswere identicalwhen thenear the upperwall, which createda flow restnic- massflow ratewas held constant[8].tion for the tilted upperwall geometry;andat theexit where the flow restriction ceased.Initially, a 3.2.2. Solution of the equationfor convectivediffu-total of 960 nodalpoints wereused for eachmesh. sionThis yielded streamlineprofiles that werenonuni- The solution of the convectivediffusion equa-form. Useof 1144 and 1560 nodesgave identical tion was basedon the streamlineupwind finiteresultssuchas thestreamlinesgiven in figs. 4 and element methoddevelopedby Rice and Schmpke5. [23]. This method was designed for convection
324 AN. Jansenet al. / Influenceof reactordesignon MOCVD
dominated flows such as those that exist in a 030 iT I I I I I I I I I I I I I I I -
horizontalCVD reactor.The meshusedwas iden- = Itical to the meshused in thesolution of the fluid ~ o.~s — —
mechanics and energy equations. This program ~ =was written by this group to incorporatethermal ~ Idiffusion effectsandheterogeneousreaction rates ~ 0.20 i- -ias surfaceboundaryconditionsinto theconvective .b i
diffusion equation. This program yielded the flux 515 — —
on the substrateand the concentrationprofile in .2~the reactor. ~ ~ i.~
This program did not require an iterative ~method since the fluid mechanicsand energy ~oo
0oo00ix00oooo Ii
equationsweredecoupledfrom theconvectivedif- ~ — 000
fusion equation. In order to test the accuracyof 1 00
the results, a check of the massbalancewas per- 000 - -
formed. This consistedof a comparisonbetween 5.0 0.0 5.0 10.0 15.0
the sum of the total flux that left the reactor “05itiQfl, cm
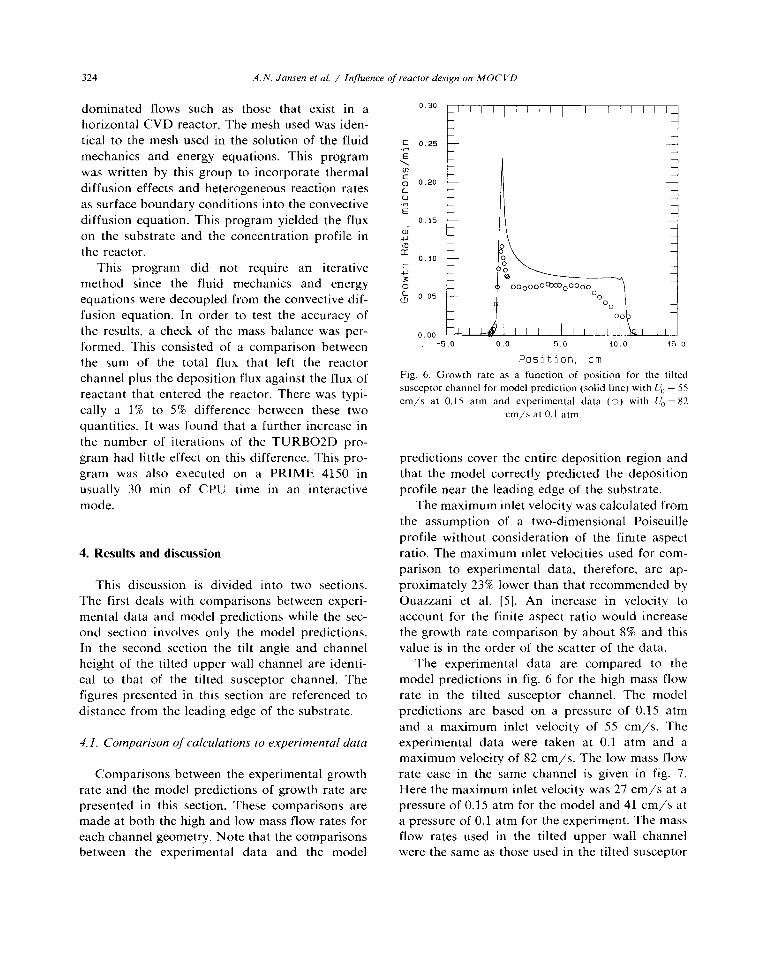
channelplus thedepositionflux againstthe flux of Fig. 6. Growth rate as a function of position for the tiltedsusceptorchannelfor modelprediction (solid line) with Co = 55
reactantthat enteredthe reactor.There was typi-cm/s at 0.15 atm and experimental data (0) with U0 = 82
cally a 1% to 5% difference between these two cm/s at 0.1 atm
quantities. It was found that a further increaseinthe number of iterations of the TURBO2D pro-
gram had little effect on this difference.This pro- predictionscover the entire deposition regionandgram was also executed on a PRIME 4150 in that the model correctly predicted the depositionusually 30 mm of CPU time in an interactive profile nearthe leadingedgeof the substrate.mode. Themaximuminlet velocitywascalculatedfrom
the assumptionof a two-dimensional Poiseuilleprofile without considerationof the finite aspect
4. Results and discussion ratio. The maximuminlet velocitiesusedfor com-parison to experimental data, therefore, are ap-
This discussion is divided into two sections. proximately 23% lower than that recommendedbyThe first dealswith comparisonsbetweenexpeni- Ouazzani et al. [5]. An increase in velocity tomental data and model predictionswhile the sec- accountfor the finite aspectratio would increaseond section involves only the model predictions. thegrowth rate comparisonby about8% and thisIn the second section the tilt angle and channel value is in the orderof thescatterof thedata.height of the tilted upperwall channelare identi- The experimentaldata are compared to thecal to that of the tilted susceptorchannel. The model predictionsin fig. 6 for thehigh mass flow
figures presentedin this sectionare referencedto rate in the tilted susceptorchannel.The modeldistancefrom the leadingedgeof the substrate. predictions are basedon a pressureof 0.l5 atm
and a maximum inlet velocity of 55 cm/s. The4.1. Comparisonof calculations to experimentaldata experimental data were taken at 0.1 atm and a
maximum velocity of 82 cm/s. The low massflowComparisonsbetweenthe experimentalgrowth rate case in the samechannel is given in fig. 7.
rate and the model predictionsof growth rateare Here the maximuminlet velocity was27 cm/sat apresentedin this section.Thesecomparisonsare pressureof 0.15 atm for the model and41 cm/satmadeat both thehigh andlow massflow ratesfor a pressureof 0.1 atm for theexperiment.The masseachchannelgeometry.Note that thecomparisons flow rates used in the tilted upper wall channelbetween the experimental data and the model were the sameasthoseusedin the tilted susceptor

AN. Jansenet aL / Influenceof reactordesignon MOCVD 325
0.30 ~II I I I I I I I I I I I I I I 030 I I I I I I I I I I I I I I I I I
C 0.25 — — 0.25 — —
E E -
0 - ...-. - -
__ DOD illililil III
—5.0 0.0 5.0 10.0 15.0 —5.0 0.0 1.0 10.0 15.0
Position, cm Position, cmFig. 7. Growth rate as a function of position for the tilted Fig. 9. Growth rate as a function of position for the tiltedsusceptorchannelfor modelprediction (solid line) with Uo = 27 upper wall channel for model prediction (solid line) with
cm/s at 0.15 atm and experimental data (o) with LI0 = 41 U0 = 30 cm/s at 0.15 atm and experimental data (o) with
cm/sat 0.1 atm. LI0 = 45 cm/s at 0.1 atm.
channel. The resultantflow velocities were, how- in fig. 8. The maximum inlet velocity for theever, higherdue to the lower channelheight. The model was 65 cm/s at 0.15 atm, which corre-growth rate comparison for the high mass flow spondedto 92 cm/s for theexperimentconductedrate in the tilted upper wall channelis illustrated at 0.1 atm. Theresultsof the low massflow ratein
this channelare given in fig. 9. For this case,the_________________________________ maximum inlet velocity was 30 cm/s at 0.15 atm
0 30 _ I I I I I I I I I I I I I I I I for the model and 45 cm/s at 0.1 atm for the
experiment.0.20 — — Thesecomparisonsdemonstratethat themodel
predictions were well within an order of magni-
0.20 tude of theexperimentaldata and that the modelpredictedcorrectlythe influenceof massflow rate
0 0 1 andchannelgeometry.The depositionprofile was
Si 0.15 ~ 1 more uniform and the magnitudeof deposition\0~o 00 ~0 000 1 wasgreaterat thehigh mass flow rate (figs. 6 and
I.. _I 8) ascomparedto the low mass flow rate (figs. 7I and9). Theseobservationsheld for both the tilted
I - upperwall channeland the tilted susceptorchan-C. SOS — I —
0.0 - - nel.I = The experimentaldata for the tilted upperwall
0.00 I I I I I I I I I I I I channel exhibited more scatter than the data for—5 0 0.0 5.0 10.0 15.0 the tilted susceptorchannel.This might be attri-
Position. cm .
buted to irregularities in the tilted upper wallFig. 8. Growth rate as a function of position for the tilted
channelsuch as the supports for the upper wall.upper wall channel for model prediction (solid line) withU0 = 65 cm/s at 0.15 atm and experimental data (o) with Also, therewasno orientationto thegrowth since
U,~= 92 cm/s at 0.1 atm. the substratewas quartz and not a single GaAs

326 A. N. Jansenci al. / influenceof reactor designon MOC VD
~—° ~T I I I I I I I I I I I I I I Icrystal. This resulted in a deposit that was poly- I I -~
crystalline.The pressureand velocities used in the above -
4.0 —
casesreflect typical operatingconditions for theMOCVD growth of GaAs. At a pressureof 1.0 >< -
0
atm the experimentaldepositionprofile was non- ~uniform, as is illustrated in fig. 10 for the tilted -
susceptorchannel.This correspondedto thesame - aa) -
high mass flow rate as usedat a pressureof 0.1 ‘~ 2 0 0
C -atm. Here the maximum inlet velocity prediction C.0 -was 8.0 cm/s at 1.0 atm and 7.7 cm/s at 1.0 atm z -
for the experimentaldata. At this pressure, the i.o ~ ~ ~
model did not adequatelypredict the profile ex- - 0
hibited by the experimentaldata. Similar results 00
were obtained for the low mass flow rate in this ~ I I I I I I DID I I—5.0 0,0 5.0 10.0 05 0
channelaswell as for the high and low mass flowPosition, cm
ratesin the tilted upper wall channel.Therewereseveralpossibleexplanationsfor this poor correla- Fig. 11. Experimental and calculated (solid line) normalized
flux as a function of position for the tilted susceptorchannel.tion. The first was that homogeneousreactions Calculation engageda surface reaction mechanismthat was
may becomeimportant at higher pressures,and first order in total pressure.(a) Calculatedvalues for U~, 55
these were not treated in the presentmodel. The cm/s at 0.15 atm, (b) calculatedvalues for LI0 = 8.0 cm/s at
second was the effect of roll cells which were 1.0 atm, (o) experimentaldata with U,, = 82 cm/s at 0.1 atm.
possible at this pressure[24—27]. Since roll cells and (0) experimentalwith Ui = 7.7 cm/s at 1.0 atm.
are inherently three-dimensionaland the modelwas only two-dimensional, theeffect of these rollcellscould not bedeterminedby thecurrentmodel. A third possibility waspressuredependenceof the
surfacereaction, which could be analyzedby thismodel.
0.30 ~ Initially the model used a simple surfacereac-tion mechanismthat was first order in concentra-
C 0 25 — — tion of TMG. but independentof pressure.This- - yielded model predictionsthat were also indepen-
0.20 — —
C. - - cient was pressuredependent.This resultwas oh-U - -
- - tamedbecausethemass transportwas convectionC - -
0_is dominated. A surface reaction mechanismthat02
- I was linearly dependenton total pressureand ona) -
JH0IIII - dent of pressureeventhough thediffusivity coeffi-- .I concentrationof TMG was used.The resultsare0.10 — I illustrated in fig. 11 wherethe normalized flux for.0 - ~o I the high mass flow rate in the tilted susceptor— 0- 0 T channel is plotted as a function of position at- pressuresof 1.0 atm and around 0.1 atm. TheI I I I I ~0 I I - normalized flux was used to make comparisons—5 0 0.0 5.0 10.0 15.0 betweenthedepositionuniformity rather than the
Position, cm magnitudeof the growth. At around 0.1 atm theFig. 10. Growth rate as a function of position for the tilted model prediction agreed with the experimentalsusceptorchannelfor modelprediction (solid line) with U~,= 8.0
data. However, at 1.0 atm the model did notcm/s at 1.0 atm and experimentaldata(o) with U
0 = 7.7 cm/sat 1.0 atm. predict the abrupt decreasein deposition 4 cm
A. N.Jansenci a!. / Influenceof reactordesignon MOC VD 327
5.0
any greatextent.rrTTFTEThTrTTiTJfT”TT’T~ total pressuredid not yield results thatdeviatedto
4.2. Analysis of numericalpredictions
30 -0 - - Three major results are discussedin this see-
3.0 — —
02 = reactorgeometry,and substraterotation. The firstsubject provides physical insight between the~0 - a - tion. Theseare the effects of thermal diffusion,
~ - mathematicalmodel andreality. The last two sub-
~ 0 ~ the tilted upper wall channelis a mirror imageofjects result from the useof the model to predictS the effects of reactorconditions. In this section- the tilted susceptorchannel.-5.0 0.0 S.0 00.0 ISO 4.2.1. Effectsof thermaldiffusion
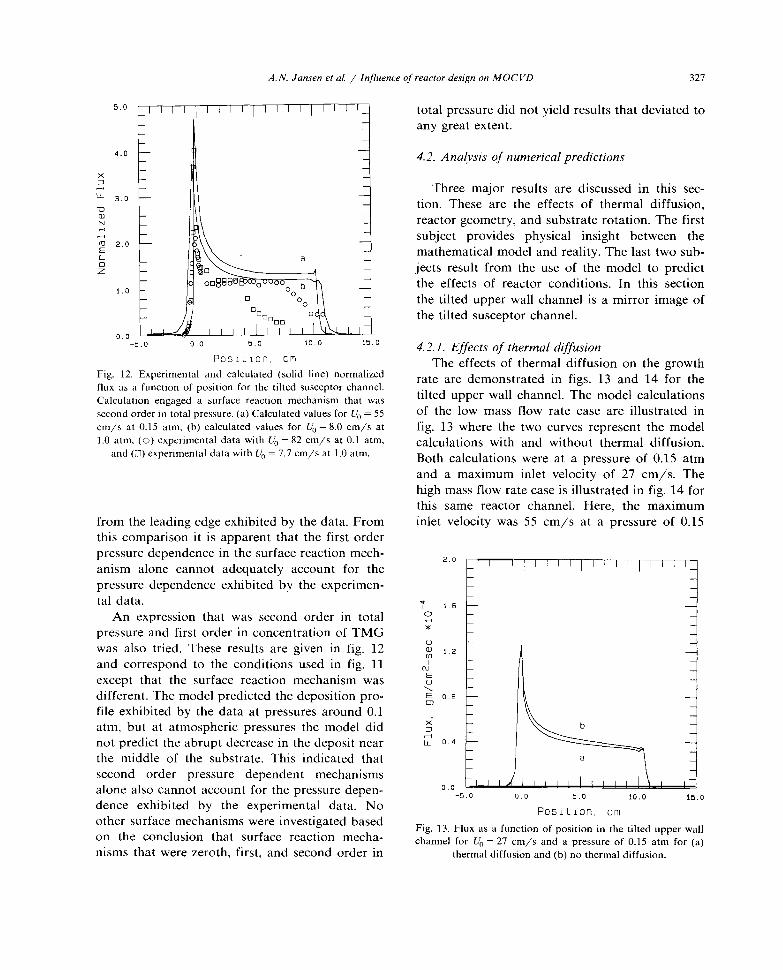
Pos at ion. cm The effectsof thermaldiffusion on the growthFig. 12. Experimental and calculated (solid line) normalized rate are demonstratedin figs. 13 and 14 for theflux as a function of position for the tilted susceptorchannel. tilted upperwall channel.The model calculationsCalculation engageda surface reaction mechanismthat was
secondorderin total pressure.(a) Calculatedvaluesfor U0 = 55 of the low massflow rate case are illustrated in
cm/s at 0.15 atm, (b) calculatedvalues for Li~,= 8.0 cm/s at fig. 13 where the two curvesrepresentthe model1.0 atm, (o) experimentaldata with U0 = 82 cm/s at 0.1 atm, calculationswith and without thermal diffusion.
and (0) experimentaldatawith U0 = 7.7cm/s at 1.0 atm. Both calculationswere at a pressureof 0.15 atmand a maximum inlet velocity of 27 cm/s. The
high massflow ratecaseis illustrated in fig. 14 for
this same reactor channel. Here, the maximumfrom the leadingedgeexhibitedby thedata.From inlet velocity was 55 cm/s at a pressureof 0.15
this comparisonit is apparentthat the first orderpressuredependencein the surfacereactionmech- 2 0 I I I I
anism alone cannot adequatelyaccount for the - =pressuredependenceexhibited by the experimen- - -
tal data. - -I 1.6 — —
An expressionthat was secondorder in total = =‘OSpressureandfirst order in concentrationof TMG - -U
was also tried. Theseresults are given in fig. 12 1.2and correspondto the conditions used in fig. 11
0)20)
except that the surfacereaction mechanismwasdifferent. The model predictedthe depositionpro- o.e
file exhibited by the dataat pressuresaround0.1
~IIIIIIIII~atm, but at atmosphericpressuresthe model didnot predict theabruptdecreasein thedepositnear 0,4the middle of the substrate.This indicated thatsecond order pressure dependent mechanismsalone also cannotaccountfor thepressuredepen- 0.0_s a o 0 5.0 10 0 15,0
dence exhibited by the experimental data. No Position, cmother surfacemechanismswere investigatedbased Fig. 13. Flux as a function of position in the tilted upper wallon the conclusion that surface reaction mecha- channel for U0 = 27 cm/s and a pressureof 0.15 atm for (a)
nisms that werezeroth, first, and secondorder in thermaldiffusion and (b) no thermaldiffusion.
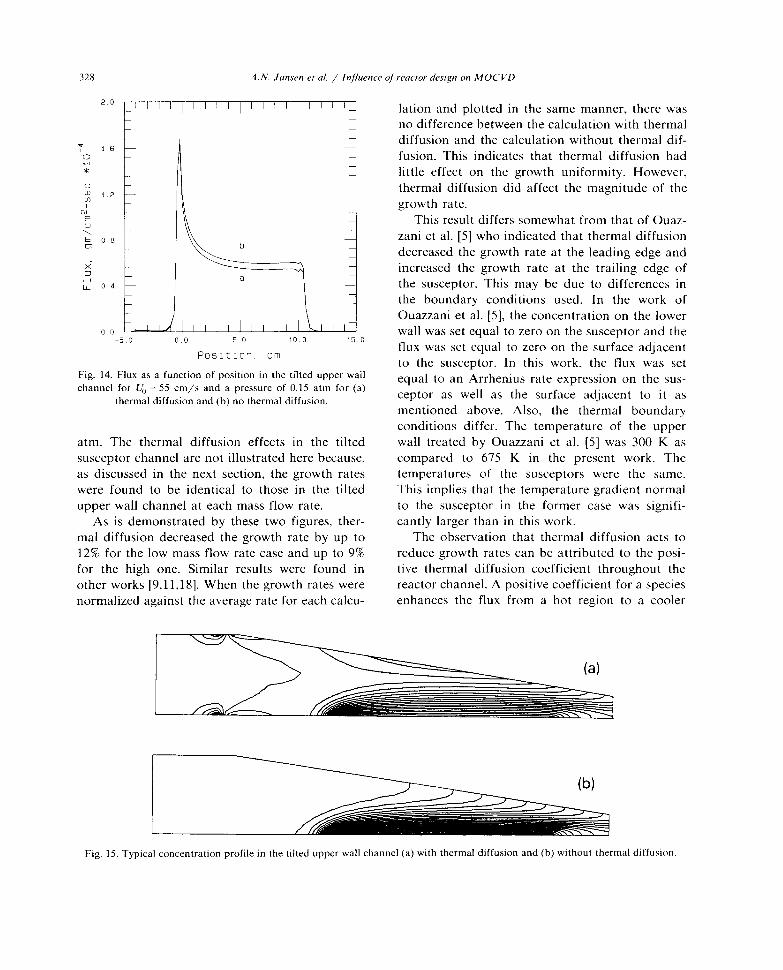
328 AN. Jansenci at / influenceof reactordesignon MOCVD
2.0 — I I I I I I I I I I I I I I I I I - lation and plotted in the samemanner, therewas
no differencebetweenthecalculationwith thermal
diffusion andthe calculationwithout thermaldif-a - - fusion. This indicatesthat thermal diffusion had
little effect on the growth uniformity. However,
1 2 thermaldiffusion did affect themagnitudeof the- growth rate.
- This resultdiffers somewhatfrom that of Ouaz-
0.6 ‘~ zani et al. [5] who indicatedthat thermaldiffusion0 I decreasedthe growth rateat the leadingedgeand
increasedthe growth rate at the trailing edge of
0.4 — a — the susceptor.This may be due to differencesinI the boundary conditions used. In the work of
Ouazzaniet al. [5], theconcentrationon the lower0.0 wall wasset equalto zero on thesusceptorandthe
—5.0 0,0 5.0 10.0 15.0flux was set equal to zero on the surfaceadjacent
Position, cmto the susceptor. In this work, the flux was set
Fig. 14. Flux as a function of position in the tilted upper wail equal to an Arrhenius rate expressionon the sus-channel for U = 55 cm/s and a pressureof 0.15 atm for (a)
0 , , , , ceptor as well as the surface adjacent to it asthermaldiffusion and (h) no thermaldiffusion. mentioned above. Also, the thermal boundary
conditions differ. The temperatureof the upperatm. The thermal diffusion effects in the tilted wall treated by Ouazzaniet al. [5] was 300 K as
susceptorchannelarenot illustrated herebecause, compared to 675 K in the present work. Theas discussedin the next section, the growth rates temperaturesof the susceptorswere the same.were found to be identical to thosein the tilted This implies that the temperaturegradientnormalupperwall channelat eachmassflow rate. to the susceptorin the former case was signifi-
As is demonstratedby these two figures, then- cantly largerthan in this work.mal diffusion decreasedthegrowth rate by up to The observationthat thermal diffusion acts to12% for the low massflow rate caseandup to 9% reducegrowth ratescan be attributed to theposi-for the high one. Similar results were found in tive thermal diffusion coefficient throughout theother works 19,11,181.When thegrowth rateswere reactorchannel.A positivecoefficient for a speciesnormalizedagainsttheaverageratefor eachcalcu- enhancesthe flux from a hot region to a cooler
_ (a)
Fig. 15. Typical concentrationprofile in the tilted upperwall channel(a) with thermaldiffusion and (b) without thermaldiffusion.

AN. Jansenci at / Influenceofreactor designon MOCVD 329
Fig. 16. Typical concentrationprofile in the tilted susceptorchannel(a)with thermal diffusion and(b) without thermal diffusion.
region [16]. In the reactorchannelthis causedthe tilted susceptor.The normalizedflux distributionsTMG to diffuse away from the hot susceptonand for each reactorchannelunderseveralflow condi-
towardsthecooler upperwall. This wasin opposi- tions arecomparedin figs. 17 to 19. In fig. 17, thelion to the Fickian diffusion which caused the normalizedflux is plottedasa functionof positionTMG to diffuse towards the susceptor. Fig. 15 alongthe susceptorfor both geometriesat a pres-depictstheconcentrationprofile with andwithout sureof 0.15 atm and a maximum inlet velocity ofthermaldiffusion for the tilted upperwall channel 55 cm/s in each reactor channel. This was thefor a typical flow condition. Likewise, fig. 16 high mass flow rate case. Likewise, fig. 18 il-depicts thesesame profiles in a tilted susceptor lustratesthe normalized flux versusposition forchannel. The uppermost isoconcentration line both channelsat the low mass flow rate case.Forabove the susceptorfor the profiles that include this case,the maximuminlet velocity was27 cm/sthermal diffusion was around 1.1 (the inlet was1.0). This demonstratesthat thermaldiffusion en- so 1 I I I I I I ‘ I I I I I I I I I
hancedtheconcentrationof TMG nearthecooler I I I I =upperwall. - =
Sincethermaldiffusion drove TMG toward the 40 —
cooler upperwall over thesusceptor,this suggests =that it might be possibleto hinderor enhancethe = =flux of TMG with an imposedtemperatureprofile ~- ~.o — —
on the upper wall. Growth uniformity may be = =enhancedby an imposedtemperatureprofile on = =the upperwall such that it would be cooler over 2.0 — —
the leading edgeof the susceptorand hotterover -
the trailing edgeof the susceptor.This approach Z - _______ =would be limited, however, by the requirementthat the temperatureof theupperwall not exceed -
the temperatureat which depositionoccurs. ~ I I I I I I I I I I I I I -
—5.0 0.0 1.0 10.0 15.04.2.2. Effectsof reactor geometry Position, cm
A direct comparisonis made in this section . . . ..Fig. 17. Normalized flux as a function of position with U
0 = 55betweenthe model calculationsbasedon a tilted cm/s at 0.15 atm for the tilted upper wall channel and the
upperwall andthe model calculationsbasedon a tilted suseeptorchannel.

330 A. N. Jansenet a!. / Influenceofreactor designon MOC VD
I I I I I I I I I I I I I I I I I I I - in fig. 19. The high and low mass flow ratesused
= in this channelwere the sameas in the tilted wall- - channels.Comparisonof figs. 17 and18 to fig. 19
4.0 — —
- - shows that use of a tilted wall significantly im-so - proved thegrowth uniformity. Plots of thegrowth0 -
- rate versusposition are not included since this3.0 —
0 - - simply involves a changeof scales.The results of0) - -‘a - - figs. 17 and 18 demonstratethat the tilted upper
wall model predictedthe sameresultsas thetilted(ii 2.0 — —
- susceptormodel if the tilt angle and the height0 - -
were the same for each. In other words, the de-z ~ =
position profiles were identical if the two geome-
tries were mirror images.The remainder of this
0,O~ section is devotedto an explanationof this phe-nomenon.—5.0 0.0 1.0 10.0 05.0 Thedominant transportmechanismin MOCVD
Position, cmdiffers from the Knudsen diffusion observedin
Fig. 18. Normalized flux as a function of position with U0 = 27 low pressureepitaxial processessuch as molecular
cm/s at 0.15 atm for the tilted upper wall channeland the
tilted suseeptorchannel, beam epitaxy (MBE) and sputtering [1]. Underusual operatingconditions the mean free path ison the order of 9000 cm for MBE and 1 cm for
at a pressureof 0.15 atm in eachchannel. Since sputtering deposition.Typical MOCVD reactors
thecurvesin both figures areidentical, no attempt operateat comparativelyhigh pressures.Even Un-was made to distinguish betweenthe curves on denlow pressureoperation(10 kPa), themeanfreeeachp~ot. path is estimatedto be 0.0002 cm. Since the di-
The normalizedflux as function of position in mensionsof eachof thesereactor systemsare ofthechannelwith two horizontal walls is illustrated theorderof centimeters,the increaseof thegrowth
rate uniformity must bedueto somechangein the_______________________________ bulk fluid flow.
50 I I I I ‘I I I I I I I I I I I I I- A first approximationwould be to characterizeI = the flow over thesusceptonas if it werean isother-- - mal flow over a smooth semi-infinite flat plate
4.0 — —
[16]. This is a well-known boundary layer flow30
LU ~ .iI into theplate:-
0) -
N - = ~=Cx2u~2y, (20)
~ 2.0 — —F -
- I I I I which yields an analytic expression for the fluxC. ‘~. = where ,4t is thespeciesflux, C is a constant, u,5,,0 - ‘N,Z - ‘N.”.~ = is the approach velocity outside the boundary1.0 — ~““0co,,~J\ layer, x is the distance from the leading edgeof= - theplate measuredtangentto theplate,and y is
0 -..~._-1_1.~( I I I I I I I I = the species concentrationoutside the boundary0 layer. Note that eq. (20) implies that the flux can
never be uniform due to its x dependence(uPosition, cm
and y areconstantfor eachflow condition). TheFig. 19. Normalized flux as a function of position with (a)U0 = 27 cm/s and (b) U0 = 55 cm/s at 0.15 atm for the flux predicted by this expressionwould beinfinite
channelwith two horizontal walls, at the leadingedgeand decreasein accordanceto
AN. Janseneta!. / Influenceof reactordesignon MOCVD 331
I 00i[~ alongthe flat plate. This would also be true
on x would be a function of the tilt angle. This
expressioncannotadequatelyexplain theuniform 0 9
growth region that wasobservedexperimentally.
0.7-..The reason this expressiondoes not apply tofor a tilted plate although the power dependencepreventsthe formation of a true boundary layer. m -- 0 9the reactorchannelsused is that the upper wall — 0.7 >- a-
0A concentrationboundary layer developson the
susceptorin the entranceregion, but intersectsthe 0 5
upper wall a short distance down the reactor.Depletion changes the effective reactant con-
centration,andreduction of thecross-sectionnon- -
mal to the direction of flow (as with a tilted - I I I —03 I I I I I I I I I I I I I I I I I I I 0.3
susceptor) increases the effective flow velocity. ~ 0 ~.o 5.0 00 0 10.0
Thus, upstreamvelocities and concentrations,u~ Position, cm
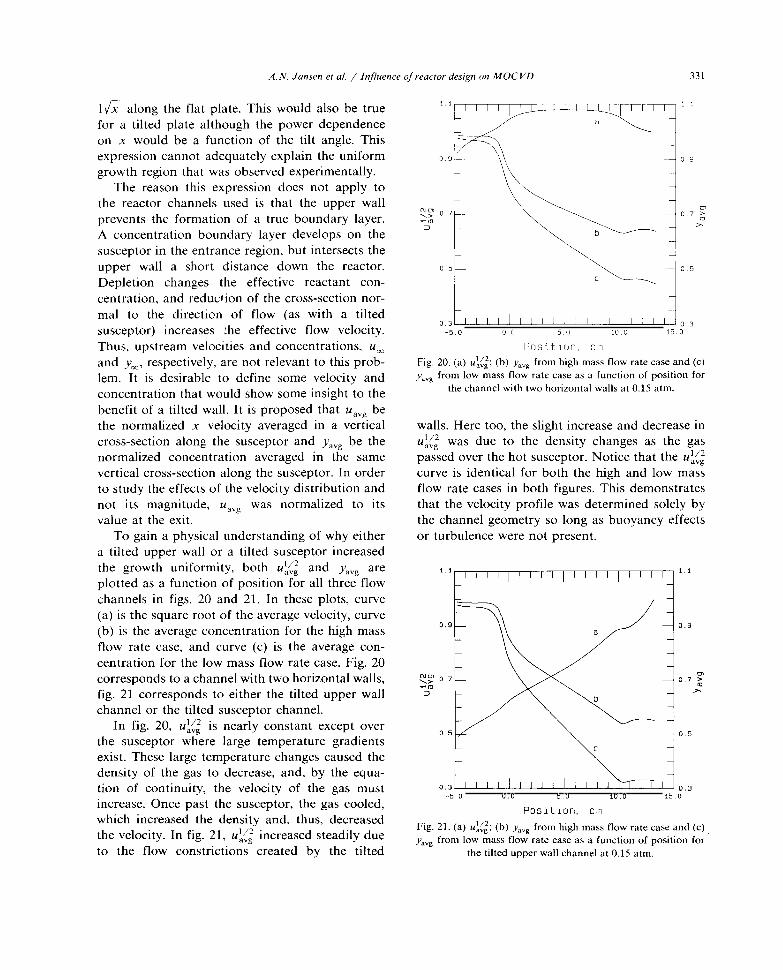
and y~,respectively,arenot relevantto this prob- Fig. 20. (a) u~ (b) Yavg from high massflow ratecaseand (c)
lem. It is desirable to define some velocity and ‘~from low mass flow ratecaseas a function of position forthe channelwith two horizontal walls at 0.15 atm.concentrationthatwould showsomeinsight to the
benefit of a tilted wall. It is proposedthat uavg bethe normalized x velocity averagedin a vertical walls. Here too, theslight increaseanddecreaseincross-sectionalong the susceptorand yavg be the u~ was due to the density changesas the gasnormalized concentration averagedin the same passedoverthehot susceptor.Notice that the u~vertical cross-sectionalongthesusceptor.In order curveis identical for both the high and low massto study theeffectsof thevelocity distribution and flow rate casesin both figures. This demonstratesnot its magnitude, uavg was normalized to its that the velocity profile was determinedsolely byvalueat theexit, thechannelgeometryso long asbuoyancyeffects
To gain a physicalunderstandingof why either on turbulencewerenot present.a tilted upper wall or a tilted susceptonincreasedthe growth uniformity, both u~i~and yavg are 1.1 I I I I I I I I I I I I I I I I I I Iplotted asa function of position for all threeflow -
channelsin figs. 20 and 21. In theseplots, curve(a) is thesquareroot of theaveragevelocity, curve 0.9
— 0.9(b) is theaverageconcentrationfor the high massflow rate case,and curve (c) is the averagecon-
centrationfor the low massflow ratecase.Fig. 200
(U
-correspondsto a channelwith two horizontalwalls, o.~ — 0,7fig. 21 correspondsto either the tilted upperwallchannelon the tilted susceptonchannel.
In fig. 20, u~ is nearly constantexceptover 0 -— 0.5
the susceptorwhere large temperaturegradients -
exist. Theselarge temperaturechangescausedthe -
density of the gas to decrease,and, by the equa- -
tion of continuity, the velocity of the gas must o,~ I I 0,3—5.0 0.0 1.0 10,0 16.0
increase.Oncepast the susceptor,thegascooled, Posit ion, cm
which increasedthe density and, thus, decreased Fig. 21. (a) u~ (b) .ravg from high mass flow ratecaseand (c)thevelocity. In fig. 21, u~ increasedsteadilydue y from low massflow rateeaseas a function of position for
to the flow constrictions created by the tilted the tilted upperwall channelat 0.15 atm.

332 AN. Jansenet at / Influenceofreactor designon MOCVD
In both figures, the averageconcentrationwas tion. This allowed the calculation of the radiallarger for the caseof the high massflow rate.This growth distribution from the stationary modelwas dueto the dependenceof the inlet flux on u. predictionsvia trigonometricrelations.If the reaction was kinetically controlled, an in- It is stressedthat this analysisis valid only atcreasein mass flow rate would haveno effect on low rotation speeds.The upper limit of the rota-thedepositionrateandtheexit compositionwould tion speedconsideredhere can be estimatedby
becomea strongerfunction of velocity, the ratio of the kinematic viscosity and a char-The reason that a tilted wall increased the actensticlength (reactorheight in this case).The
growth uniformity along the susceptor is ex- kinematic viscosity was38.1 cm2/s at 800 K andplained with the aid of figs. 20 and 21. In both 0.15 atm. With a reactor height of 4 cm, thisfigures, theaverageconcentrationdecreasedalong yielded a characteristicvelocity of 10 cm/s whichthe susceptor.The velocity can be consideredin- correspondsto a rotation rate of 23 revolutionsdependentof position in the channel with two per minute for a susceptorradiusof 4 cm. In orderhorizontal walls, it increasedfor both the tilted for the axial velocity profile to be unaffectedbyupperwall and the tilted susceptorchannels.This thesusceptorrotation, therotation rate must be atincreasein velocity compensatedfor the decrease least one on two orders of magnitudebelow 23in concentrationdueto depositionof the reactant RPM. This analysismay thereforeapply to rota-species.Thenet effectwasa more uniform growth tion ratesthat areless than 2 RPM. Analysis forprofile. An optimum uniformity in growth is ob- rotation rateslargerthan this will requirea three-tamed when the rate of reactant replenishment dimensionalmodel.(due to the increasein velocity) matchesthe rate Considera rotating disk of radius r inscribedof reactant consumption.This optimum was re- in a squareplane with an x, z origin at the left
achedin thehigh mass flow rate caseasdepicted most intersectionof the planeand thedisk, wherein fig. 17, Note that this explanation does not x is in the direction of the flow field oven the
dependon how the velocity is increased.Thus, it plane(seefig. 22). Thedisk rotatesclockwisewithis expectedthat either a tilted upper wall or a an angularvelocity f2. Only the motion in the xtilted susceptorchannelwill have the sameeffect direction of a particle on this disk is of impor-
so long as thechannelheight andtilt angleare the tance,sincedepositionis only a function of x. Thesamefor each.
4.2.3. Effectsof substraterotationThereis a growing trend in the semiconductor
industry to incorporatesubstraterotation in hori-zontal reactorsto improveuniformity [28—30].Therotation averages the deposition over the sub- /
strate.The object of this study was to investigate /theeffect of geometryandoperatingconditionson Z /the degreeof uniformity achievedby rotation ofthe substrate. — ~
Since the presentmodel was only two-dimen-sional,it wasnot possibleto incorporatethe radialmotion of the substrateinto the model. Thus, itwasassumedthat the flux of TMG to the rotatingsubstratewas the sameas the flux of TMG to astationarysubstrate.In other words, the notationspeedof the substratewas assumedto be suffi-ciently slow that the gas phasevelocity profile Fig. 22. A schematicrepresentationof the method used to
above thesubstratewasnot affectedby the rota- calculatethe growth rateon a rotating substrate.
AN. Jansenet at / Influenceof reactordesignon MOCVD 333
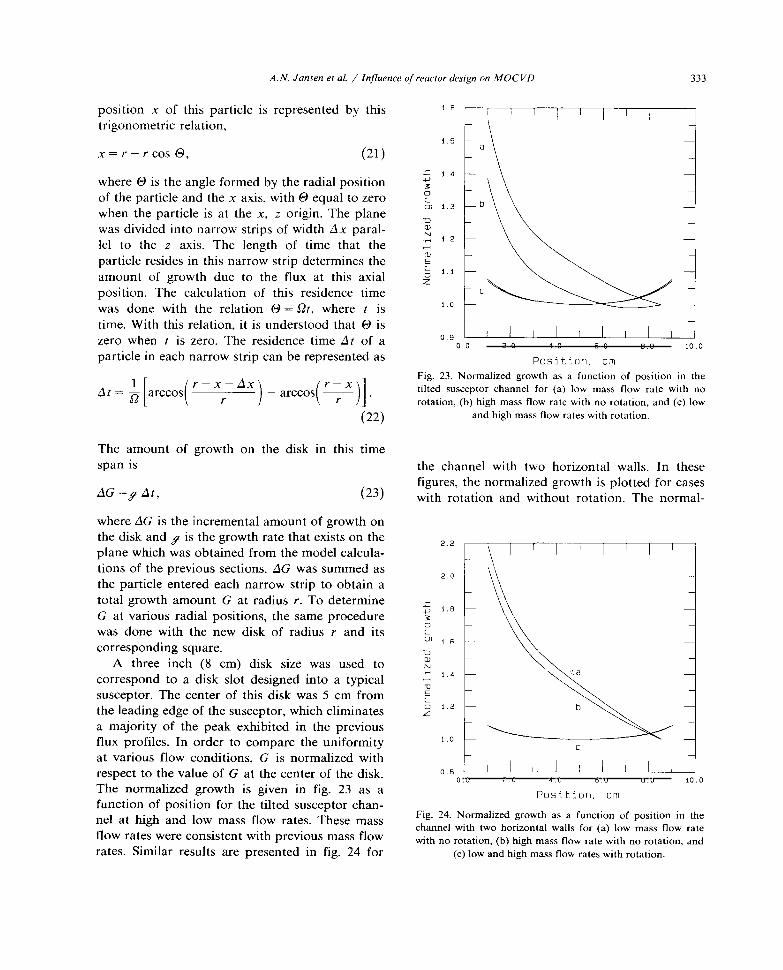
position x of this particle is representedby this ~ I I I I I I I Itrigonometricrelation, a
x=r—rcose, (21)r 1.4 —.0where0 is the angleformedby the radial position0 -of theparticleandthex axis,with 0 equalto zero C.0) 1,3 —
particle residesin this narrow strip determinesthewhen theparticle is at the x, z origin. The plane ,~ -a)wasdivided into narrow strips of width /~xparal- 2 —lel to the z axis. The length of time that the (U -C. ~ —0
amount of growth due to the flux at this axialposition. The calculation of this residencetime C
was done with the relation 0 = Qt, where t is 1.0
time. With this relation, it is understoodthat 0 is -
zero when t is zero. The residencetime L~tof a 0.9 I I I I I I I I I0.0 2.0 4,0 6.0 8.0 10.0
particle in eachnarrow strip can be representedas Position, cm
Fig. 23. Normalized growth as a function of position in the
~ [arccos( r — x — Z~xa 1 r — .~ tilted susceptorchannel for (a) low mass flow rate with nor ) — arccos~ r I j’ rotation, (b) ~gh mass flow rate with no rotation, and (c) low
(22) and high massflow rateswith rotation.
The amount of growth on the disk in this timespanis the channel with two horizontal walls. In these
figures, thenormalizedgrowth is plotted for casesL~G g ~t, (23) with rotation and without rotation. The normal-
wherez1iG is the incrementalamountof growthonthedisk andg is thegrowthrate thatexistson the 2 2
planewhichwas obtainedfrom themodel calcula- - I I I I I I Ilions of theprevioussections./.XG wassummedas 2 0
theparticle enteredeachnarrow strip to obtain atotal growth amount G at radius r. To determine .c
G at various radial positions, the sameprocedure 300
was done with the new disk of radius r and its C.1.0
correspondingsquare.0)A three inch (8 cm) disk size was used to N
1,4correspondto a disk slot designedinto a typicalsusceptor.The centerof this disk was 5 cm from F
C.0 1.2the leadingedgeof thesusceptor,which eliminates
a majority of the peakexhibited in the previousflux profiles. In order to comparethe uniformity 1.0 c
at various flow conditions, G is normalized with - I -
respectto thevalue of G at thecenterof thedisk. oa I I I I I I I I I0.0 2 0 4.0 6.0 8.0 10.0
The normalized growth is given in fig. 23 as a Pos a t ion, cm
function of position for the tilted susceptorchan-Fig. 24. Normalized growth as a function of position in thenel at high andlow mass flow rates.These mass channelwith two horizontal walls for (a) low mass flow rate
flow rateswereconsistentwith previousmassflow with no rotation, (b) high massflow ratewith no rotation, and
rates. Similar results are presentedin fig. 24 for (c) low and highmass flow rateswith rotation.

334 AN. Janseneta!. / Influenceofreactor designon MOCVD
ized growth curves for the caseswithout rotation 5. Conclusionsdiffer from the figures previously presentedbe-causefor these casesthe normalizationwas with This work illustrates thevalue of comparisonofrespectto the lowest value of thegrowth rateover model calculationsto thecompletedepositionpro-the 8 cm section of interest and not the average file. The model correctly predicted the depositionvalueover thewhole depositionarea, nearthe leadingedgeof the substratethrough the
Figs. 23 and 24 demonstratethat rotation in- useof an Arrheniusrate constantappliedover thecreasedthedepositionuniformity over thesection whole susceptorregion. The model agreed well
of interest.The depositionuniformity was nearly with the experimentaldata at typical operatingidentical for all four conditionsanalyzed,with the pressuresaround 0.1 atm but not as well forlargest deviation less than 4,3% for the channel atmosphericpressures.It wasalso found that pres-with two horizontal walls and less than 3.8% for suredependentsurfacereactionmechanismsthatthe tilted wall channel.Theseresultswereclose to were first orderandsecondorder in total pressurethe experimental results obtained by Okamoto (first order in concentrationof TMG) alone could
and coworkers [29,30], who testedthe effects of not accountfor thepressuredependenceexhibitedrotation on the growth uniformity in a channel by theexperimentaldata.Basedon this result, it iswith two horizontal walls. Theyobtaineduniform- suggestedthat either homogeneousreactions,theities of ±2.6% in growth rate and ±3.5% in inclusion of the third dimension,or both may hedoping concentrationover a 8 cm section of the required to predict the deposition profile undersubstratein ageometryalmost identical to theone atmosphericconditions.studied in this work. It should be noted that this Thermaldiffusion hadlittle effecton thegrowthagreementwas obtainedin spite of the fact that rate uniformity under the conditions studied butthe rotation rate used in their experiments(12 decreasedthe magnitudeof the growth rate by upRPM) waslargerthan the notationratesfor which to 9% to 12%, dependingon the mass flow rate,this analysis can be expected to apply. These Thermal diffusion drove the TMG away from theresults will be sensitive to variations in growth hot susceptorand towards the cooler regions ofrate in the direction transverseto the flow and to the reactor such as the upper wall. Due to this
the locationof thesubstrateto berotated. effect, the concentration of TMG at the upperThe results presentedin this section have a wall wasgreaterthan the inlet concentration.
number of (perhaps)surprising features.The first Throughexperimentsandmodel calculations,ais that, upon rotationof the substrate,thedeposi- channelwith a tilted upper wall anda horizontaltion uniformity becameinsensitive to flow rate. susceptorwasfound to behavein thesamemannerThis wasin contrastto the casewith a stationary as a tilted susceptorchannel.The resultsof each
substratewherean optimal flow rate existedfor a were identical if the height of each channelandgiven angle of inclination. The secondis that the the tilt angle were the same,This was due to thetilted susceptorunder near optimal flow rates identicalaveragedvelocity andconcentrationpro-improves the uniformity of growth on a rotating files that werecreatedin eachof theseflow chan-substrateby only 0.5% ascomparedto theuntilted nels, In this manner, the growth rate profile wascase.Theseresults show that uniformity can be independentof the method used to create a de-achievedby notation if the growth rate is a linear sired velocity profile (i.e. the tilted upper wall
function of position. The extentof uniformity was channelcreatedthe sameflow constriction as didnot influenced by the magnitude of the linear the tilted suscepton).decreaseof growth rate with position. Onceagain, Substrate notation increasedthe growth uni-the readeris cautionedthat theseresultsapply in formity with deviations less than 4.3% for thethe limit of slow rotation speedsandthat predict- channel with two horizontal walls and less thanion of the influence of larger rotation speedswill 3.8% for the tilted wall channels.In this case,arequire developmentof an appropriate three-di- tilted wall improved the uniformity by only 0.5%.mensionalmodel. This reducesthe incentiveto designa tilted chan-

AN. Jansenci at / Influenceof reactordesignon MOCVD 335
nelif a rotating substrateis also incorporatedinto U0 Maximum velocity in parabolic profile,
the design. The deposition uniformity was also cm/sshown to be insensitive to flow rate if the sub- u Velocity in x direction, cm/sstrateis rotated. v Velocity in y direction, cm/s
x Horizontal coordinatey Vertical coordinate
Acknowledgements
0 Polarangleof disk, radThe authors thank JamesG. Rice and Rita J. O Angle of inclination, deg
Schnipke of COMPUFLO Inc., Charlottesville, Viscosity, g/cm .
Virginia, for the use of their computersoftwarep Density, g/cm
3andseminars.The majority of this work was con- Angle of declination,degducted at the University of Virginia under the Rotation rateof disk, rad/minsupportof NASA grant numberNAG-1-350. This w Normalized massfraction of TMGpaperwas written at the University of Floridawith the support of DARPA under the Optoe-lectronics program of the Florida Initiative in
ReferencesAdvancedMicroelectronicsand Materials.
[1] K.F. Jensen,Chem.Eng. Sci. 42 (1987)923.
[2] D.W. Hess, K.F. Jensenand T.J. Anderson,Rev. Chem.List of symbols Eng. 3 (1985)97.
[3] PD. Dapkus, Ann. Rev. Mater. Sci. 12 (1982) 243.
A Arrheniusrate parameter,g/cm2 ‘ s [4] H. Moffat and K.F. Jensen,J. Crystal Growth 77 (1986)
C~ Heatcapacity, J/g. K 108.
D Fickian diffusivity, cm2/s [5] J. Ouazzani, K-C. Chiu and F. Rosenberger,J. CrystalGrowth 91(1988)497.
DT Thermaldiffusivity, g/cm. [6] PB. Chinoy, PD. Agnello and S.K. Ghandhi, J. Electron.
E Arrhenius activationenergy,kJ/mol Mater. 17 (1988)493.
G Growth amount, ~sm [7] W.L. Holstein, J.L. Fitzjohn, E.J. Fahy, P.W. Gilmour
g Gravitational constant,cm/s2 and ER. Schmelzer,J. Crystal Growth 94 (1989) 131.
Growth rate,1o/min [8] A.B. Bulsari, ME. Orazem and J.G. Rice, J. Crystal
Growth 92 (1988) 294.h Reactorchannelheight, cm [9] M. Tirtowidjojo and R. Pollard, J. Crystal Growth 93
k Thermalconductivity, W/cm. K (1988) 108.
k~ Reactionrate constant,g/cm2 . S [10] MR. Leys and H. Veenvliet,J. Crystal Growth 55 (1981)
I Reactorchannellength,cm 145.
l~ Distanceto manifold insulation,cm [11] M. Tirtowidjojo and R. Pollard, Theoretical analysis oforganometallicvapor phaseepitaxy of gallium arsenide,
12 Distanceto start of tilt, cm in: Proc. 1st Intern. Conf. on Processingof Electronic
13 Distanceto leadingedgeof suscepton,cm Materials, 1986.
14 Distanceto trailing edgeof suscepton,cm [12] J. van de Ven, G.M.J. Rutten, M.J. Raaijmakersand L.J.
,4/” Speciesflux, g/cm . s Giling, J. Crystal Growth 76 (1986) 352.
P Pressure,atm [13] D.H. Reep and S.K. Ghandhi, J. Electrochem. Soc. 130
R Surfacereactionrate,g/cm2 . (1983) 675.[14] H. Luth, J. Vacuum Sci. Technol. A7 (1989) 696.r Radiusof susceptordisk, cm [15] J. Nishizawa, T. Kurabayashi,H. Abe and N. Sakurai, J.
T Temperature,K Electrochem. Soc. 134 (1987)945.
Temperatureof susceptor,K [161 R.B. Bird, WE. Stewart and E.N. Lightfoot, Transport
Inlet temperature,K Phenomena(Wiley, New York, 1960).[17] JO. Hirschfelder, CF. Curtiss and RB. Bird, Molecular
Tvar Temperaturearoundsusceptor,K Theory of Gasesand Liquids (Wiley, New York, 1954) p.
T Temperatureof upperwall, K 609.
TMG Trimethylgallium [181 W.L. Holstein, J. Electrochem.Soc. 135 (1988) 1788.

336 AN. Janseneta!. / Influenceofreactordesign on MOCVD
[19] PATRAN-G User’s Guide (PDA Engineering,SantaAna, [25] R. Takahashi,Y. Koga and K. Sugawara,J. Electrochem.
CA, 1984). Soc. 119 (1972) 1406.[20] J.G. Rice and R.J. Schnipke,Computer Methods Appl. [26] S. Rhee,J. Szekely and O.J. Ilegbusi, J. Electrochem.Soc.
Mech.Eng. 58 (1986) 135. 134 (1987)2552.
[21] R.J. Schnipke and J.G. Rice, Finite Elements in Analysis [27] G.H. Westphal, J. Crystal Growth 65 (1983)105.
and Design 1 (1985)227. [28] F. Woelk and H. Beneking, J. Crystal Growth 87 (1988)
[22] FLOTRAN computer software package (COMPUFLO 201.
Inc., Charlottesville,VA, 1988). [29] A. Okamoto, 1-I. Sunakawa,H. Teraoand H. Watanabe,J.[23] J.G. Rice and R.J. Schnipke.Computer Methods Appi. Crystal Growth 70 (1984) 140.
Mech. Eng. 48 (1985) 313. [30] A. Okamoto, H. Terao and T. Kamejima, Japan.J. AppI.[24] L.J. Giling, J. Electrochem.Soc. 129 (1982) 634. Phys. 25 (1986)238.