nureg/ia-0019, 'trac-pf1/mod1 post-test calculations of ... · nureg/ia-0019 international...
TRANSCRIPT

Fl L -(,-NUREG/IA-0019
InternationalAgreement Report
TRAC-PF1/MOD1 Post-TestCalculations of the OECDLoft Experiment LP-SB-2
Prepared byF. Pelayo
United Kingdom Atomic Energy AuthorityWinfrith, DorchesterDorset, England
Office of Nuclear Regulatory ResearchU.S. Nuclear Regulatory CommissionWashington, DC 20555
December 1990
Prepared as part ofThe Agreement on Research Participation and Technical Exchangeunder the International Thermal-Hydraulic Code Assessmentand Application Program (ICAP)
Published byU.S. Nuclear Regulatory Commission

NOTICE
This report was prepared under an international cooperativeagreement for the exchange of technical information. Neitherthe United States Government nor any agency thereof, or any oftheir employees, makes any warranty, expressed or implied, orassumes any legal liability or responsibility for any third party'suse, or the results of such use, of any information, apparatus pro-duct or process disclosed in this report, or represents that its useby such third party Would not infringe privately owned rights.
Available from
Superintendent of DocumentsU.S. Government Printing Office
P.O. Box 37082Washington, D.C. 20013-7082
and
National Technical Information ServiceSpringfield, VA 22161

NUREG/IA-0019
InternationalAgreement Report
TRAC-PF1/MOD1 Post-TestCalculations of the OECDLoft Experiment LP-SB-2
Prepared byF. Pelayo
United Kingdom Atomic Energy AuthorityWinfrith, DorchesterDorset, England
Office of Nuclear Regulatory ResearchU.S. Nuclear Regulatory CommissionWashington, DC 20555
December 1990
Prepared as part ofThe Agreement on Research Participation and Technical Exchangeunder the International Thermal-Hydraulic Code Assessmentand Application Program (ICAP)
Published byU.S. Nuclear Regulatory Commission

NOTICE
This report is based on work performed under the sponsorship of the
United Kingdom Atomic Energy Authority. The information in this
report has been provided to the USNRC under the terms of the
International Code Assessment and Application Program (ICAP)
between the United States and the United Kingdom (Administrative
Agreement - WH 36047 between the United States Nuclear Regulatory
Commission and the United Kingdom Atomic Energy Authority Relating
to Collaboration in the Field of Modelling of Loss of Coolant
Accidents, February 1985). The United Kingdom has consented to the
publication of this report as a USNRC document in order to allow
the widest possible circulation among the reactor safety community.
Neither the United States Government nor the United Kingdom or any
agency thereof, or any of their employees, makes any warranty,
expressed or implied, or assumes any legal liability of
responsibility for any third party's use, or the results of such
use, or any information, apparatus, product or process disclosed
in this report, or represents that its use by such third party
would not infringe privately owned rights.

ABSTRACT
An analysis of the OECD-LOFT-LP-SB-2 experiment making use ofTRAC-PFl/MODl is described in the report'.
LP-SB2 experiment studies the effect of a delayed pump tripin a small break LOCA scenario with a 3 inches equivalentdiameter break in the hot leg of a commercial PWR operatingat full power.
The experiment was performed on 14 July 1983 in the LOFTfacility at the Idaho National Engineering Laboratory underthe auspices of the Organisation for Economic Co-operationand Development (OECD). This analysis presents an evaluationof the code capability in reproducing the complex phenomenawhich determined the LP-SB-2 transient evolution. The.analysis comprises the results obtained from two differentruns. The first run is described in detail analysing themain variables over two time spans: short and longer term.Several conclusions are drawn and then a second run testingsome of these conclusions is shown.
All of the calculations were performed at the United KingdomAtomic Energy Establishment at Winfrith under the auspices ofan agreement between the UKAEA (United Kingdom Atomic EnergyAuthority) and the Consejo de Seguridad Nuclear Espafol(CSN).
AEEW - R 2202

ACKNOWLEDGEM4ENTS
Appreciation is expressed to all the staff members of theLOCA'Thermal Hydraulics Group at Winfrith Establishment withspecial mention to Dr C Richards and Miss E Allen for theirvaluable contribution to the realisation of this work.
IIAEEW - R 2202 •"

CONTENTS
Page
ABSTRACT I
ACKNOWLEDGEMENTS II
1 INTRODUCTION 1
2 LOFT FACILITY 1
2.1 System Description 1
3 TRAC PF1 MOD1 MODEL OF LOFT FACILITY 2
3.1 Reactor Vessel 3
3.2 Steam Generator and Steam Line 4
3.3 Intact and Broken Loops 4
4 EXPERIMENT LP-SB-2 .4
4.1 Steady State Calculation 5
4.2 Transient Boundary Conditions 6
4.3 Chronology of Events for Experiment LP-SB-2 6
5 POST-TEST CALCULATIONS 7
5.1 Run A 7
5.1.1 Code Performance 7
5.1.2 Short Time Behaviour (0.0 - 850 secs) 7
5.1.2.1 Pressure Behaviour: Primary Side 8
5.1.2.2 Pressure Behaviour: Secondary Side 8
5.1.2.3 Temperatures 9
5.1.2.4 Density Distribution 9
5.1.2.5 Fluid Velocities 10
IIIAEEW - R 2202

CONTENTS (Contd)
Page
5.1.2.6 Transient Mass Inventory
5.1.3 Long Time Behaviour (850 - 3000 secs)
5.1.3.1 Pressure Behaviour
5.1.3.2 Temperatures
5.1.3.3 Density Distribution
5.1.3.4 Fluid Velocities
5.1.3.5 Transient Mass Inventory
5.1.4 Conclusions Derived from Run A
5.2 Run B
5.2.1 Results Review
5.2.2 Conclusions Derived from Run B
6 SELECTED ITEMS
6A LP-SB2 Pumps Modelling
6B Break Flow Density in Experiment LP-SB-2
6C Flow Regimes Prediction for LP-SB-2
7 SUMMARY AND FINAL CONCLUSIONS
REFERENCES
11
11
11
12
13
14
15
16
16
17
19
20
20
22
24
25
28
FIGURES
TABLES
32
112
APPENDIX A Run B Snapshots at Selected' Times
APPENDIX B Modifications Implemented in
TRAC-PFl/MOD1 Winfrith Versions
Bo2A and BO2C
148
149
AEEW - R 2202 IV

FIGURES
NUMBER TITLE PAGE
1 LOFT FACILITY AXONOMETRIC PROJECTION 33
2 LOFT PIPING SCHEMATIC WITH INSTRUMENTATION. 34
-3 LOFT FACILITY NODING DIAGRAM 35
4 CORE BYPASS FLOW PATHS 36
.5 ONE-DIMENSIONAL VESSEL REPRESENTATION 37
6 STEAM GENERATOR NODING 38
RUN A
7 TOTAL TIME STEPS 39
8 TIME STEP SIZE 40
- SHORT TERM (0.0 - 850 SECS)
9 INTACT LOOP HOT LEG PRESSURE 41
10 VOID FRACTION IN THE UPPER PLENUM AND BOX .42
BEFORE HOT LEG NOZZLES
11 BREAK MASS FLOW RATE 43
.12 PRESSURE DIFFERENCE OVER THE MAIN COOLANT 44
PUMPS
13 SECONDARY SIDE PRESSURE .45.!
14 LIQUID TEMPERATURE IN THE HOT LEG OF THE 46
INTACT LOOP
15 LIQUID TEMPERATURE IN THE COLD LEG OF THE 47
INTACT LOOP
16 PRIMARY AND SECONDARY PRESSURES IN TRAC .48
17 DENSITY IN THE HOT LEG OF THE .INTACT LOOP 49
18 DENSITY IN THE COLD LEG OF THE INTACT LOOP 50
AEEW - R 2202 V

FIGURES (Contd)
NUMBER TITLE PAGE
19 GAMMA DENSITOMETERS LAYOUT IN THE HOT AND 51
COLD LEG
20 VOID FRACTION AT TOP OF THE U-TUBES 52
21 LOOP SEAL DENSITY 53
22 DENSITY IN THE BREAK LINE 54
23 LIQUID AND VAPOUR VELOCITY IN THE COLD LEG 55
24 LIQUID AND VAPOUR VELOCITY IN THE HOT LEG 56
25 LIQUID AND VAPOUR VELOCITY IN THE DOWNCOMER 57
OF THE REACTOR VESSEL
26 LIQUID AND VAPOUR VELOCITY AT CORE INLET 58
27 LIQUID AND VAPOUR VELOCITY AT CORE OUTLET 59
28 LIQUID AND VAPOUR VELOCITY IN THE BREAK LINE 60
29 PRIMARY SYSTEM MASS INVENTORY 61
- LONG TERM (850 - 3000 SECS)
30 SECONDARY PRESSURE 62
31 PRIMARY AND SECONDARY SIDE PRESSURES IN TRAC 63
32 INTACT LOOP HOT LEG PRESSURE 64
33 LIQUID TEMPERATURE IN THE HOT LEG OF THE 65.
INTACT LOOP
34 COLD LEG TEM SAT - TEM LIQ 66
35 CLADDING TEMPERATURE NEAR TOP OF THE CORE 67
36 DENSITY IN THE HOT LEG INTACT LOOP 68
VIAEEW- R 2202
FIGURES (Contd)
NUMBER TITLE PAGE
37 DENSITY IN THE COLD LEG OF THE INTACT LOOP 69
38 DENSITY IN THE BREAK LINE 70
39 LIQUID AND VAPOUR VELOCITY IN THE DOWNCOMER 71
OF THE REACTOR VESSEL
40 LIQUID AND VAPOUR VELOCITY AT CORE INLET 72
41 PRESSURE DIFFERENCE OVER THE MAIN COOLANT 73
PUMPS
42 LIQUID AND VAPOUR VELOCITY AT CORE OUTLET 74
43 LIQUID AND VAPOUR VELOCITY IN THE HOT LEG 75
44 LIQUID AND VAPOUR VELOCITY IN THE COLD LEG 76
45 LIQUID AND VAPOUR VELOCITY IN THE BREAK 77
LINE
46 HOT LEG MASS FLOW-RATE AT VENTURI LOCATION 78
47 BREAK MASS FLOW RATE 79
48 PRIMARY SYSTEM MASS INVENTORY 80
RUN B
49 BREAK LINE DENSITY 81
50 BREAK MASS FLOW RATE 82
51 PRIMARY SYSTEM MASS INVENTORY 83
52 INTACT LOOP HOT LEG PRESSURE 84
53 SECONDARY SIDE PRESSURE 85
VIIAEEW - R 2202

FIGURES (Contd)
NUMBER TITLE PAGE
54 LIQUID TEMPERATURE IN THE HOT LEG OF THE 86
INTACT LOOP
55 CLADDING TEMPERATURE NEAR TOP-OF THE CORE 87
56 DENSITY IN THE HOT LEG INTACT LOOP 88
57 DENSITY IN THE COLD LEG OF THE INTACT LOOP 89
58 LIQUID AND VAPOUR VELOCITY IN THE DOWNCOMER 90
OF THE REACTOR VESSEL
59 VOID FRACTION TOP FUEL REGIONý 91
60 LIQUID AND VAPOUR VELOCITY AT CORE INLET 92
61 LIQUID AND VAPOUR VELOCITY IN THE HOT LEG 93
62 PRESSURE DIFFERENCE OVER THE MAIN COOLANT 94
PUMPS
63 HOT LEG MASS FLOW RATE AT VENTURI LOCATION 95
64 LIQUID AND VAPOUR VELOCITY IN THE BREAK LINE 96
SELECTED'ITEMS
NUMBER TITLE PAGE
Al MEASURED AND ADJUSTED COLD LEG DENSITIES AT 97
THE STEAM GENERATOR OUTLET
A2 PUMP HEAD AS-A FUNCTION OF VOID FRACTION FOR 98
EXPERIMENTS LP-SB-2 AND L3-6
AEEW -R 2202 VIII

FIGURES (Contd)
NUMBER TITLE PAGE
A3 PUMP HEAD AS A FUNCTION OF VOID FRACTION 99
OBTAINED USING THE ADJUSTED DENSITY AT THE
STEAM GENERATOR OUTLET FOR EXPERIMENT
LP-SB-2
A4 PUMP HEAD VS VOID FRACTION IN RUN A 100
A5 LOOP SEAL DENSITY IN RUN A, 101
A6 PUMPS PRESSURE INCREASE VS VOLUMETRIC FLOW 102
RATE IN RUN A
A7 PUMPS MASS FLOW RATE IN RUN A 103
AS PRIMARY COOLANT PUMP POWER 104
A9 PUMPS TORQUES IN RUN B 105
A10 PUMPS MASS FLOWS IN RUN B 106
Bl EXPERIMENTAL HOT LEG DENSITY AND BREAK LINE 107
DENSITY
B2 NODING MODIFICATIONS IN THE BREAK LINE 108
B3 QUALITY CONTROL VALVE CONTROL LOGIC 109
Cl TRAC FLOW REGIME MAP FOR LOFT LP-SB-2 HOT 110
LEG CONDITIONS RUN B
C2 TIME VS HOT LEG VOID FRACTION IN RUN B 1il
AEEW - R 2202 IX

TABLES
NUMBER TITLE PAGE
1 INITIAL CONDITIONS FOR EXPERIMENT LP-SB-2 113
- RUN A
2 OPERATIONAL SET POINT FOR EXPERIMENT 114
.LP-SB-2
3 CHRONOLOGY OF EVENTS FOR EXPERIMENT LP-SB-2 115
- RUNA
4 INSTRUMENT LOCATIONS FLOW AREAS 116
5 INITIAL CONDITIONS FOR EXPERIMENT LP-SB-2 117
- RUN B
6 CHRONOLOGY OF EVENTS FOR EXPERIMENT LP-SB-2 118
-RUNEB.
Al PUMP HEAD MULTIPLIERS - RUN A 119
A2 PUMP HEAD MULTIPLIERS - RUN B 120
Bl DESIRED BRANCH QUALITY VS VOID FRACTION IN 121
THE HOT LEG
MIMIC DIAGRAMS
MIMIC DIAGRAMS FOR RUN B 122
AEEW - R 2202 X

COMMERCIAL IN CONFIDENCE
1 INTRODUCTION
Experiment LP-SB-2 studies the effect of a delayed pumps.tripin a Small Break LOCA scenario with a three inches equivalentdiameter break in the hot leg of a commercial PWR operatingat full power. The experiment was performed on 14 July 1983in the LOFT facility at the Idaho National EngineeringLaboratory under the auspices of the Organisztion forEconomic Co-operation and Development (OECD). The evolutionof the experiment was determined by several features, amongthe most important of which were the flow patterns present inthe loop, vapour pull-through and liquid entrainment observedin the break line, and pumps behaviour.
Early in the transient a density gradient developed in thevertical section of the hot leg. The break line density wassensitive to this gradient; moreover a preferential flow ofsteam was detected as soon as two-phase conditions occurred.Under stratified conditions and later in the transient, thebreak suddenly uncovered increasing the d~pressurisationrate; from then on some liquid entrainment was observed tooccur.
The pumps behaviour was important in determining the fluidvelocities and density distribution as well as changes inflow distribution and flow patterns in the loop.
Many of the features of TRAC-PFl/MODl were used 'during theanalysis of the experiment, ie the flow regime dependentconstitutive equation package, choked flow model, pump modelunder two-phase conditions, fluid transport and associatedtwo-phase pressure losses along the whole loop, etc.
The SETS numerics were applied to all the components in thesystem as no three-dimensional vessel was used.
All the calculations were performed on a CRAY X-MP computerand the Code versions used were the Winfrith versions BO2Afor RUN A and BO2C for RUN B. Both versions contain LosAlamos updates up to Version 12.7. A description of thedifference between the Winfrith code version and Version 12.7is given in Appendix B...
2 LOFT FACILITY
2.1 System Descripti6n .0 -
The LOFT test facility simulates a four loop PWR 1000 MW(electric) commercial plant. It has a thermal power of 50 MWproduced by nuclear fission sustained in the reactor core.The system was designed to simulate the major components andsystem responses during LOCAs or operational transientaccidents. The facility components were instrumented torecord the main system variables during the experiments.
AEEW - R 2202 1 I. -

The facility consists of a reactor vessel volumetricallyscaled to 1/47; an intact loop with an active steamgenerator, pressuriser, and two primary coolant pumpsconnected in parallel; a broken loop connected byrecirculation lines to the intact loop to keep the fluidtemperature at about the core inlet temperature prior toexperiment, a reflood assist bypass valve connecting bothlegs of the broken loop as a safety device, and two quickopening valves (kept closed during SB-2 experiment)connecting both legs of the broken loop to the suppressiontank header. During experiment LP-SB-2 the blowdown valvesand isolation valves were kept closed as the break was in thehot leg of the "intact" loop. The broken loop spool pieceswith orifices to simulate the steam generator and pumphydraulic resistance were not installed for this experiment,but were replaced by a straight piping spool piece.
The LOFT ECCS simulates that of a commercial PWR. Itconsists of two accumulators, a high pressure injectionsystem, and a low pressure injection system. Each system isarranged to inject scaled flows of emergency core coolantdirectly into the primary coolant system. Duringexperiments LP-SB-I and 2 the accumulators and LPIS were notused and scaled HPIS flow was directed into the intact coldleg. Volume scaling of the HPIS flow was based on theassumption that only one of three charging pumps and one ofthree HPIS pumps in the reference plant were available.
The LOFT steam generator located in the intact loop is avertical U-tube design steam generator. The use of auxiliaryfeedwater flow to the steam generator during the experimentreflected the initiation and employment of backup emergencyfeedwater in a commercial PWR until the simulated depletionof feedwater source (about 30 minutes).
In experiments LP-SB-I and 2 the breakline was connectedbetween the midplane of the hot leg and the blowdownsuppression tank.
An axonometric projection of the LOFT system configurationfor experiments LP-SB-I and LP-SB-2, and a LOFT pipingschematic with instrumentation are shown respectively inFigures 1 and 2. More detailed information on the LOFTsystem configuration is provided in Reference 1.
3 TRAC PFl/MODl MODEL OF LOFT FACILITY
Starting from the nodalisation used in the analyses of theexperiments LP-LB-I and LP-FP-l, an existing Atomic EnergyEstablishment of Winfrith (AEEW) input deck was adapted toreproduce the actual configuration of experiments LP-SB-l andLP-SB-2 (Ref 2) these modifications were:-
Removal of the three-dimensional vessel andimplementation of a one-dimensional model.
AEEW - R 2202 2
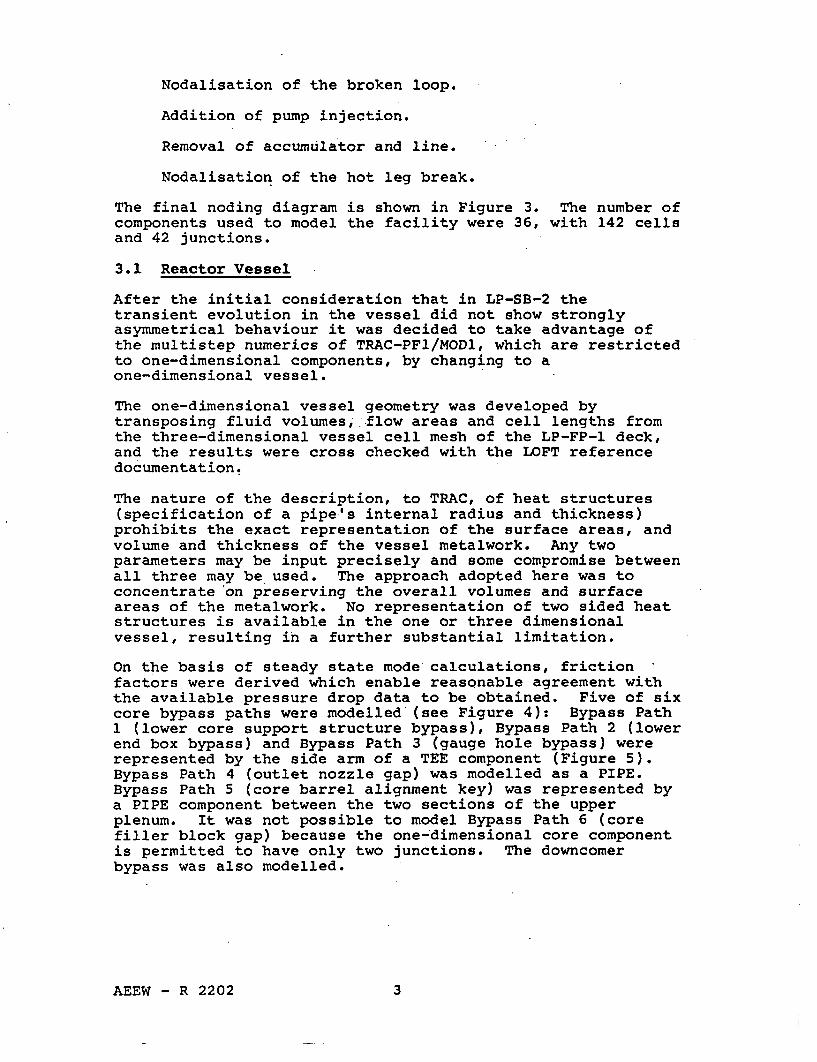
Nodalisation of the broken loop.
Addition of pump injection.
Removal of accumulator and line.
Nodalisation of the hot leg break.
The final noding diagram is shown in Figure 3. The number ofcomponents used to model the facility were 36, with 142 cellsand 42 junctions.
3.1 Reactor Vessel
After the initial consideration that in LP-SB-2 thetransient evolution in the vessel did not show stronglyasymmetrical behaviour it was decided to take advantage ofthe multistep numerics of TRAC-PF1/MOD1, which are restrictedto one-dimensional components, by changing to aone-dimensional vessel.
The one-dimensional vessel geometry was developed bytransposing fluid volumes,.flow areas and cell lengths fromthe three-dimensional vessel cell mesh of the LP-FP-1 deck,and the results were cross checked with the LOFT referencedocumentation.
The nature of the description, to TRAC, of heat structures(specification of a pipe's internal radius and thickness)prohibits the exact representation of the surface areas, andvolume and thickness of the vessel metalwork. Any twoparameters may be input precisely and some compromise betweenall three may be used. The approach adopted here was toconcentrate on preserving the overall volumes and surfaceareas of the metalwork. No representation of two sided heatstructures is available in the one or three dimensionalvessel, resulting in a further substantial limitation.
On the basis of steady state mode calculations, frictionfactors were derived which enable reasonable agreement withthe available pressure drop data to be obtained. Five of sixcore bypass paths were modelled (see Figure 4): Bypass Path1 (lower core support structure bypass), Bypass Path 2 (lowerend box bypass) and Bypass Path 3 (gauge hole bypass) wererepresented by the side arm of a TEE component (Figure 5).Bypass Path 4 (outlet nozzle gap) was modelled as a PIPE.Bypass Path 5 (core barrel alignment key) was represented bya PIPE component between the two sections of the upperplenum. It was not possible to model Bypass Path 6 (corefiller block gap) because the one-dimensional core componentis permitted to have only two junctions. The downcomerbypass was also modelled.
AEEW - R 2202 3

3.2 Steam Generator and Steam Line
The steam generator consisted of a boiler, a separator and adowncomer region. In order to adequately reproduce thesubcooled region of the boiler, the bottom cell of the boilerwas halved in length, as well as the corresponding primaryside cells. The steam separator was simply modelled byimposing perfect separation at its top junction.
The overall heat losses were set to 21.4 Kw as the best fitto the available data (Ref 3).
Heat structures in the steam generator were betterrepresented than in the vessel due to the capability of thesteam generator component to cope with two-sided and multipleheat structures.
The friction loss in the junction between the downcomer andthe boiler was modified to fit the reported recirculationration 4.8. No steam bypass valve was modelled; its functionwas taken over by the main steam control valve. A detaileddescription of the modelling can be seen in Figure 6.
3.3 Intact and Broken Loops
The loss of coolant occurred through a break in the intactloop hot legi therefore the hot leg representation in theTRAC deck was modified to accommodate the break.
The length of the biqeat line was 5.61 m with flow arelsection of 6.82 10-4 m4 and a nozzle ?f 1.2668 10- m thatcorresponds to a diameter of 1.27 10- m. The length of thecell connecting to the nozzle was made equal to 0.1 m. TheHPIS discharged into the cold leg at an angle of 900 to themainline.
A characteristic of the LOFT facility is the existence 6f afluid path connection between both legs of the broken loop inorder to equalise the pressures between the upper core andupper downcomer, making it easy to flood the core underunexpected conditions. This bypass was supposed to be closedduring the experiment but a leakage of about 5.3% of thecircuit flow (480 kg/sec) passed through the reflood assistbypass valves (Reference 3). In the nodalisation the flowarea of this junction was adjusted to obtain a flow rate inreasonable agreement with the data.
4 EXPERIMENT LP-SB-2
Experiment LP-SB-2 addresses the analysis of a small breakloss of coolant accident with the break at the midplane ofthe intact loop hot leg. In contrast with LP-SB-l theprimary coolant pumps were running for most of the experimentuntil the trip set point on pressure was reached.
AEEW - R 2202 4

A detailed description of the experiments is found inReference 4.
4.1 Steady State Calculations
Starting with input conditions well away from the operatingsteady state, 500 seconds of steady state calculations wererun to achieve a reasonable degree of convergence. Duringthis period the predominant timestep was 1 sec and the(CPU/Problem) time was 0.36. In order to obtain a finalsteady state a subsequent run of 70 secs with a maximumtimestep of 0.1 sec was performed; the (CPU/Problem) time was2.0. The total (CPU/Problem) time ratio was 0.56.
To establish the required steady state a control system -wasimplemented acting on the following variables:-
Steam generator mass balance
Downcomer liquid level
Secondary pressure
Primary system pump speed
A further description of the control system may be found inReferences 5 and 6.
The model environmental heat losses from the primary sidewere 224 Kw and 21.4 Kw from the steam generator in agreementwith Reference 3.
The percentage of the loop mass flow (480 Kg/s) divertedthrough the different bypasses was the following:-
Component
79 Core Barrel Alignment Key 0.04%83 Outlet Nozzle Gap 2.7%85 Downcomer Bypass 20%89 Core Bypass 3.5%31 Reflood Assist Bypass Valve 5.3%
The obtained primary side initial mass was 5640 Kg. Thetotal deviation with the computed inventory for the LOFTfacility of around + 7.6%. A further study on the brokenloop structure allowed for a reduction of this offset up to a+3.8%.
The steam generator secondary side water mass inventoryobtained for the steady state was 2089 Kg.
The steady state initial conditions obtained are shown inTable 1.
AEEW - R 2202 5
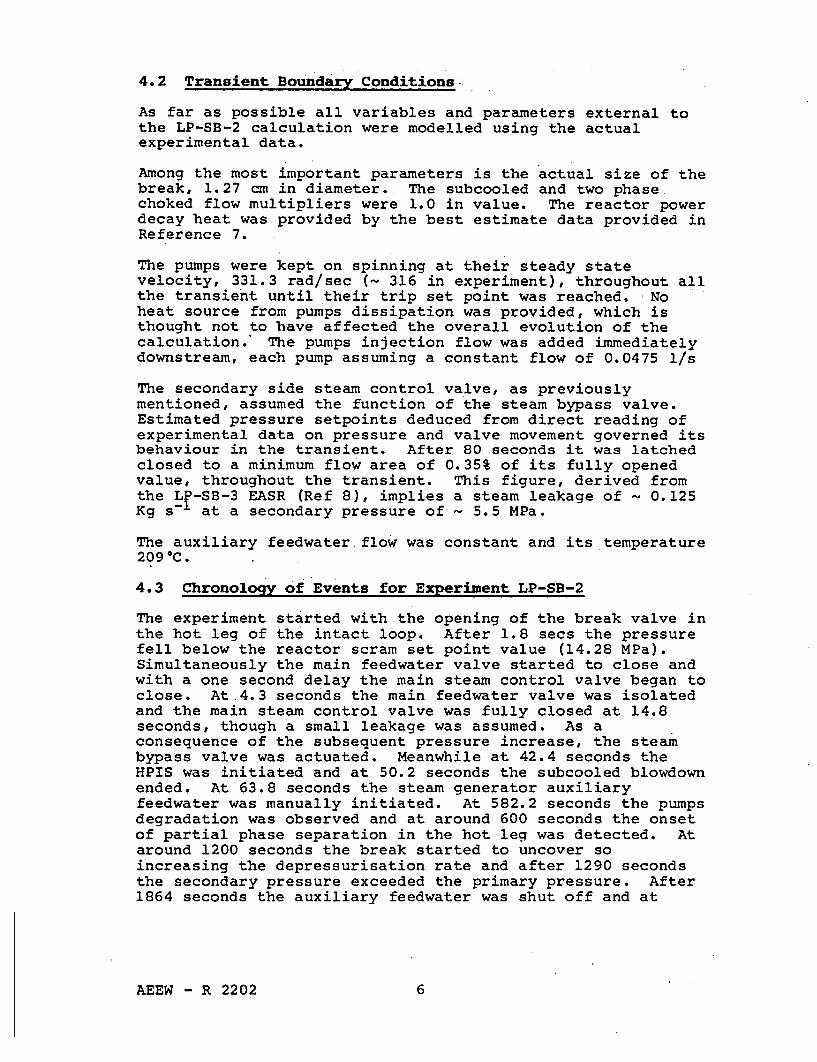
4.2 Transient Boundary Conditions.
As far as possible all variables and parameters external tothe LP-SB-2 calculation were modelled using the actualexperimental data.
Among the most important parameters is the actual size of thebreak, 1.27 cm in diameter. The subcooled and two phasechoked flow multipliers were 1.0 in value. The reactor powerdecay heat was provided by the best estimate data provided inReference 7.
The pumps were kept on spinning at their steady statevelocity, 331.3 rad/sec (- 316 in experiment), throughout allthe transient until their trip set point was reached. Noheat source from pumps dissipation was provided, which isthought not to have affected the overall evolution of thecalculation. The pumps injection flow was added immediatelydownstream, each pump assuming a constant flow of 0.0475 1/s
The secondary side steam control valve, as previouslymentioned, assumed the function of the steam bypass valve.Estimated pressure setpoints deduced from direct reading ofexperimental data on pressure and valve movement governed itsbehaviour in the transient. After 80 seconds it was latchedclosed to a minimum flow area of 0.35% of its fully openedvalue, throughout the transient. This figure, derived fromthe LP-SB-3 EASR (Ref 8), implies a steam leakage of - 0.125Kg s-1 at a secondary pressure of - 5.5 MPa.
The auxiliary feedwater flow was constant and its temperature2090C.
4.3 Chronology of Events for Experiment LP-SB-2
The experiment started with the opening of the break valve inthe hot leg of the intact loop. After 1.8 secs the pressurefell below the reactor scram set point value (14.28 MPa).Simultaneously the main feedwater valve started to close andwith a one second delay the main steam control valve began toclose. At.4.3 seconds the main feedwater valve was isolatedand the main steam control valve was fully closed at 14.8seconds, though a small leakage was assumed. As aconsequence of the subsequent pressure increase, the steambypass valve was actuated. Meanwhile at 42.4 seconds theHPIS was initiated and at 50.2 seconds the subcooled blowdownended. At 63.8 seconds the steam generator auxiliaryfeedwater was manually initiated. At 582.2 seconds the pumpsdegradation was observed and at around 600 seconds the onsetof partial phase separation in the hot leg was detected. Ataround 1200 seconds the break started to uncover soincreasing the depressurisation rate and after 1290 secondsthe secondary pressure exceeded the primary pressure. After1864 seconds the auxiliary feedwater was shut off and at
AEEW - R 2202 6

- 2853 seconds both primary coolant pumps were tripped afterreaching their pressure set point (3.16 MPa in primarysystem).
5 POST TEST CALCULATIONS
The results from two different runs are described in thisSection. The first one, called Run A, was the first attemptto reproduce the experiment LP-SB-2 and no feature other thanthose implemented in the current standard version of the code(12.7) was used. Important conclusions were derived fromthis run. To confirm these results a major modification inthe break line, together with a Winfrith implemented model,were used to make a second run, called Run B; at the sametime other minor modifications were added to the input deck.
5.1 Run A
Operational set points and chronology of events are shown inTables 2 and 3 respectively.
5.1.1 Code Performance
The code speed can be clearly separated in three regions(Figure 7). The first one comprises from 0.0 to 1000seconds, the code is mostly using its maximum allowedtime step of 0.5 seconds (Figure 8) and the(CPU/Problem) time is - 0.45. From 1000 seconds to 2650seconds the code drops its speed and the average timestep is - 0.08 seconds. The (CPU/Problem) time is -3.1. This change of behaviour is found to be related tochanges in flow directions in the broken loop and inPump No 1 (discussed later). From - 2650 up to the endof the calculation the average time step recovers to -0.4 and the (CPU/Problem) time is - 0.51. This recoveryof speed in the calculation is found after the pumpstrip. At 3000 secs the total number of time steps is -25500 and the total (CPU/Problem) time is 1.95.
The SETS numerical method allows for the violation ofthe material Courant limit. A Courant value of - 12 iscommon in the cold leg during the fastest period of thetransient (4t = 0.5 sec). A Courant value of 1 wouldimply At = 0.04. This capability to violate the Courantlimit allows the detailed modelling of bypass pathwaysin the vessel.
5.1.2 Short Time Behaviour (0.0 - 850 sec)
The evolution of the main variables: pressure,temperature and density is now described, finally thefluid velocities and transient mass inventory will bediscussed.
AEEW - R 2202 7

5.1.2.1 Pressure Behaviour: Primary Side
Following the opening of the break valve a suddendecrease of the pressure (Fig 9) is observed. Thisperiod corresponding to the subcooled blowdown, isadequately predicted by the code, reaching the scram setpoint at 2.3 seconds. After - 53 seconds the fluid getsinto saturated conditions; as voidage develops, theupper plenum of the vessel becomes vapour bound (Fig10). The steam generation helps to stabilise thepressure, which is well reproduced by the code.Discrepancies in the break flow (Fig 11) may account forthe slight differences obtained between experimental andcalculated primary pressures.
The calculated pressure drop from the bottom of the loopseal to the pumps inlet was about 75 Kpa at time 0.0while the experiment indicates - 20 Kpa. The reason forthe discrepancy is the big pressure loss predicted byTRAC at the symmetrically flow dividing tee. As theoverall system pressure loss is reasonably wellreproduced, the actual pump pressure increase shouldremain unaffected. Having in mind this result thepressure increase through Pump No 2 is compared with thereading from PDE-PC-001 (Fig 12). It shows a biggersensitivity at low void fractions than the experimentthat is due to the selection of the head multipliers(Appendix A). The overall result is considered toreproduce the experimental result adequately. Thisindicates that the combination of mass flow, pump speed(constant), density and void fraction, together with thepump head degradation multipliers and pump homologouscurves is consistent with the experiment.
5.1.2.2 Pressure Behaviour: Secondary Side
Simultaneously to the reactor scram, the main feedwatervalve starts to close, followed by the closure of thesteam control valve. As a consequence an increase ofthe secondary side pressure (Fig 13) is observed. Therate of pressurisation is overpredicted producing anearly activation of the steam bypass valve. Thisoverpressurisation was found to be dependent on steadystate initial pressure, mass distribution and timing forthe closure of main feedwater and steam valves. In anycase the pressure rise rate was above the experimentalone. Due to the secondary role played by the steamgenerator this problem did not affect the resultsseriously.
The energy removal from the steam generator was throughthe steam valve leakage (0.125 kg/s at 5.5 MPa) and heatlosses through the shell. The combined effects of theseand the introduction of subcooled water via theauxiliary feedwater dealt with the heat transferred from
AEEW - R 2202 8

the primary side and finally determined the secondaryside pressure.
5.1.2.3 Temperatures
As soon as the chain reaction ceases in the core themain source of heat during the transient is the coredecay heat. The early slow decrease of the hot legliquid temperature during the subcooled blowdown (Fig14) is associated with the rapid increase of thepressure in the steam generator. On reaching saturationthe temperatures follow the same behaviour as thepressures.
The temperature in the cold leg of the intact loop (Fig15) rises during the first - 20 seconds due to thedecrease of AT through the steam generator. After theopening of the steam bypass valve and up to its finalclosing the temperature decreases as AT increases. Inthe experiment this behaviour is not observed. The coldleg temperature remains almost constant until the finalclosure of the steam bypass valve, at which time itrises and finally follows the presure trend.
During all the period studied the steam generatorbehaves as a heat sink (Fig 16) due to the existence ofa small positive difference in the presures betweenprimary and secondary side. Most of the energy however,is released through the break.
5.1.2.4 Density Distribution
In the experiment LP-SB-2 the distribution of thedensities is strongly affected by the running pumps. InFigures 17 and 18 the hot leg and cold leg densities arerepresented. The experimental measurements are relatedto the absorption of three beams of gamma rays coveringthe top, middle and bottom cross section of the hot andcold leg specified locations (see Fig 19).
Early in the transient voidage started to develop in theupper plenum of the vessel (- 46 sec), in the top of thesteam generator U-tubes and in the loop seal (- 60 sec),Figures 10, 20 and 21. This voidage (SG and loop seal)was strongly influenced by the secondary side behaviourin the first seconds of the transient. As soon as theheat transfer to the secondary side falls, the cold legtemperature increases, and as the loop seal is theminimum pressure location of the loop some voidageoccurs there. After 80 seconds the secondary side steambypass valve finally closes, thus increasing thesecondary side pressure and enhancing the voidagegeneration. In the experiment this voidage is partiallycollapsed in the cold leg, ie the cold leg densitydecreases later than the density in the loop seal. This
AEEW - R 2202 9
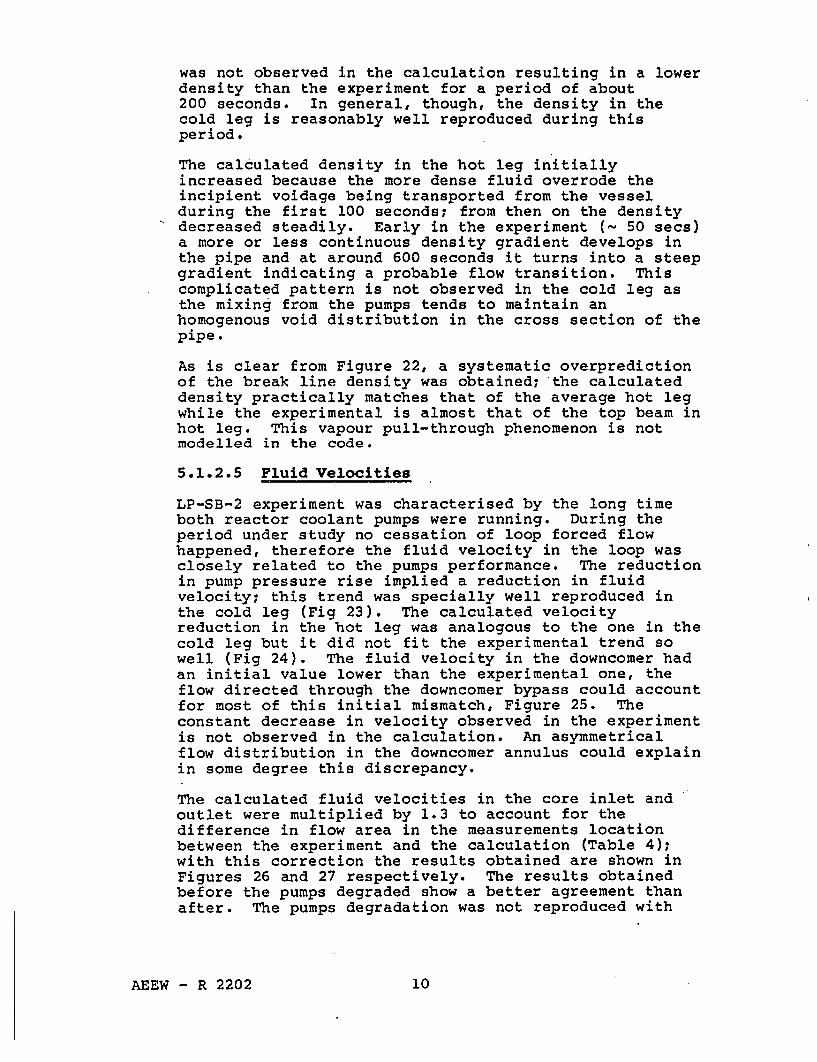
was not observed in the calculation resulting in a lowerdensity than the experiment for a period of about200 seconds. In general, though, the density in thecold leg is reasonably well reproduced during thisperiod.
The calculated density in the hot leg in itiallyincreased because the more dense fluid overrode theincipient voidage being transported from the vesselduring the first 100 seconds; from then on the densitydecreased steadily. Early in the experiment (- 50 secs)a more or less continuous density gradient develops inthe pipe and at around 600 seconds it turns into a steepgradient indicating a probable flow transition. Thiscomplicated pattern is not observed in the cold leg asthe mixing from the pumps tends to maintain anhomogenous void distribution in the cross section of thepipe.
As is clear from Figure 22, a systematic overpredictionof the break line density was obtained; the calculateddensity practically matches that of the average hot legwhile the experimental is almost that of the top beam inhot leg. This vapour pull-through phenomenon is notmodelled in the code.
5.1.2.5 Fluid Velocities
LP-SB-2 experiment was characterised by the long timeboth reactor coolant pumps were running. During theperiod under study no cessation of loop forced flowhappened, therefore the fluid velocity in the loop wasclosely related to the pumps performance. The reductionin pump pressure rise implied a reduction in fluidvelocity; this trend was specially well reproduced inthe cold leg (Fig 23). The calculated velocityreduction in the hot leg was analogous to the one in thecold leg but it did not fit the experimental trend sowell (Fig 24). The fluid velocity in the downcomer hadan initial value lower than the experimental one, theflow directed through the downcomer bypass could accountfor most of this initial mismatch, Figure 25. Theconstant decrease in velocity observed in the experimentis not observed in the calculation. An asymmetricalflow distribution in the downcomer annulus could explainin some degree this discrepancy.
The calculated fluid velocities in the core inlet andoutlet were multiplied by 1.3 to account for thedifference in flow area in the measurements locationbetween the experiment and the calculation (Table 4);with this correction the results obtained are shown inFigures 26 and 27 respectively. The results obtainedbefore the pumps degraded show a better agreement thanafter. The pumps degradation was not reproduced with
AEEW - R 2202 10

the sharpness of the experiment, correspondingly thevelocities did not fall so sharply.
The fluid velocity in the break line (Fig 28) is wellreproduced, with a small underprediction in thesubcooled region.
5.1.2.6 Transient Mass Inventory
To achieve a proper description of the actual massinventory detailed calculations of the inlet and outletflows are required. The fluid inlet sources to theprimary system were the pumps cooling injection and theHPIS. During the period under study the mass lossthrough the break was much bigger, being well withinLOCA conditions. In Figure 11 the break mass flow rateis shown. As soon as the break opened, choked flowconditions were detected. During the subcooled blowdownthe code subcooled choked flow model was invoked with amultiplier factor of 1. The results show a slightunderprediction. The code two-phase model was invokedwith a multiplier factor of 1. For the very low qualityregion a slight underprediction was observed. From 600seconds on, a permanent overestimation of the break massflow rate is obtained. The evolution of the calculatedand experimental mass (obtained from the integrated flowbalance) can be seen in Figure 29.
5.1.3 Lon2 Time Behaviour (850 - 3000 Seconds)
5.1.3.1 Pressure Behaviour
The secondary side pressure decline appears to bereasonably well reproduced indicating that leakagethrough the steam valve is about correct (Fig 30).After 1307 seconds the primary side pressure fell belowthe secondary side. Thus the steam generator no longeracted as a heat sink (Fig 31). At a 1864 seconds theauxiliary feedwater to the steam generator was suppresedand as a consequence the rate of depressurisation sloweddown. Unexpectedly the experimental trend is theopposite.
In the primary side (Fig 32) a discrepancy with respectto the experimental result arises from 800 secondsonwards, the break uncovery which in the experimenthappened at about 1200 seconds was delayed in thecalculation up to 1900 seconds. The experimental breakuncovery appears to happen when the hot leg collapsedlevel reaches the break level (Ref 9) while in thecalculation transition to steam flow corresponds to acomplete depletion of the hot leg. This depletion isconsequence of the loss of sufficient mass inventoryto eventually allow the vessel swell level to fall belowthe nozzles at around 1920 secs. The hot leg was
AEEW - R 2202 11

emptied and consequently only steam was released throughthe break with the subsequent increase in depres-surisation rate. At around 2100 and 2660 seconds theprimary pressure curve shows the existence of two spikeswhich correspond to the sudden transport of water to thebreak line after a momentary increase in the swelllevel in the core (first spike), and to the waterdrained from the inlet plenum of the steam generatorafter the pumps trip for the second one.
The time at which the pumps were tripped (3.16 MPa inprimary side) was 200 seconds before that in theexperiment.
5.1.3.2 Temperatures
In the hot leg the fluid temperatures Figure 33 were atsaturated conditions and therefore followed the trend inpressures. The situation in the cold leg was stronglydependent on the distance from the HPIS injectionlocation. As can be seen in Figure 34 the differencefrom saturation temperature 1.52 m before the HPISlocation was almost nil until the pumps were tripped,after which part of the HPIS subcooled water was flowingback to the loop seal. In the experiment no suddendecrease in temperature was observed because after thepump trip the cold leg was partially flooded with watercoming from the vessel outweighing the cooling from theHPIS.
The subcooling at the HPIS injection location and at thecold leg nozzle (- 1.15 m from HPIS) started to benoticeable after 1200 seconds, the inlet subcooling(Tsat- Tli ) to the vessel was around 5 0C up to - 1850seconds, w•en the cold leg was depleted. At this timethe subcooling temperature in the cell where the HPISwas discharging jumped to - 1200C and the subcooling atthe inlet nozzle of the vessel was around 100C. Afterthe pumps were tripped the non-uniformity was morepronounced with a subcooling of - 170 0 C at the injectionpoint and a subcooling - 40°C at the inlet of thevessel.
The fuel cladding temperature merely followed the trendof the saturation temperature corresponding to theexisting pressure. After the pumps were tripped thedowncomer and core levels equalised and as a result thetop of the core slightly uncovered producing anegligible excursion in the cladding temperature ofabout 10°K (Fig'35) until the growth of the swell levelquenched the rod.
AEEW - R 2202 12

5.1.3.3 Density Distribution
The calculated hot leg density (Fig 36) shows anevolution in reasonable agreement to the experiment upto - 1500 seconds in which the calculated andexperimental trend noticeably starts to differ. In thecalculation no forced flow cessation is detected and at- 1800 seconds the hot leg is completely depleted whilein the experiment forced flow cessation is observedwhich results in a fall in the hot leg level but laterthe level rises again. The explanation- given inReference 4 is the following: The level rise is..."due to a coolant density decrease in the core as aresult of decreased fluid velocity and a liquid leveldrop in the downcomer because the pump operationpressurised the cold leg and upper part of the downcomerrelative to the upper plenum. The downcomer liquidlevel also decreased due to the manometer effect betweenthe column of liquid in the downcomer and the column ofless dense coolant in the core and upper plenum". Afterthe pumps were tripped the consequent increase in thecore void fraction accounts for the observed rising inlevel. This late rise in level was not observed in thecalculation due to the small inventory of waterremaining in the system which did not allow the coreswell level to reach the nozzles.
The calculated tendency in the cold leg (Fig 37) wasquite similar to that of the hot leg, reproducing thephenomena observed in the hot leg. Note, though,that after the pumps were tripped an increase in thecold leg density was observed. This is due to thegrowth of the layer of water coming from the HPIS whichat this time is no. longer dragged to the vessel by thesteam previously pumped from the pumps. At the sametime the density in the loop seal increased as the waterwas running down to the bottom of the loop seal from thecold leg. The experimental trend is markedly differentfrom that of the hot leg. First of all there was nodensity gradient across the pipe until - 1200 seconds,due to the mechanical mixing provided by the pumps. .As
soon as the forced flow ceased, around - 1500 seconds,the fluid stratified. It is thought that after - 1200seconds of transient the transport of liquid in theupside of the U-tubes of the steam generator greatlyworsened due to the low velocity of the steam and to theonset of clear stratification conditions througout thehot leg. This produced a gradual depletion of the coldleg with respect to the hot leg, and as a result thelevel above the bottom of the pipe was considerablylower than that of the hot leg. After the pumps trip ajump in the cold leg density was observed. This was dueto the level increase in the downcomer that reached thecold leg level allowing its flooding. Once the levelwas enough to pass over the pumps outlet lip (- 10 cmheight) part of the liquid ran down to the loop seal.
AEEW - R 2202 13

In the nodalisation used this lip was not modelled,therefore the flow to the cold leg was greatlyfavoured.
The break flow density (Fig 38) was systematicallyoverpredicted until the hot leg pipe emptied. From thenon the density was correctly calculated.
5.1.3.4 Fluid Velocities
The liquid and vapour velocities in the downcomer (Fig39) followed a quite different trend with one another.To start with there is an initial slip induced by thesteam buoyancy. The liquid velocity shows an increasingtrend as the void fraction increases, as a result of theliquid flow area reduction. At around 2000 seconds thevoid fraction starts to decrease, reducing the liquidvelocity until it stagnates. The steam follows theopposite trend, and after a further decrease in the pumpAp at - 1200 seconds and the depletion of the brokenloop, it changes direction, and instead of flowingtowards the core through the lower plenum it rises,going to the broken loop cold leg nozzle, towards thebroken loop hot leg via RABV.
The trend observed in the measurement from theexperiment is markedly different. The decrease invelocity is sharper and at around 600 seconds thevelocity is extremely low. Meanwhile the velocity inthe core inlet, Figure 40, does not reproduce thisresult, having at that time a high velocity. Thispoints to an asymmetrical distribution of the flow inthe downcomer, in which most of the flow is falling in afairly narrow section, centred on the cold leg nozzle.This could be supported by the fact that the measurementlocation in the downcomer is situated at - 1600 from thecold leg nozzle. This suggests that the use of a three-dimensional model of the vessel in a SBLOCA simulationcould be beneficial.
In the calculated core inlet velocities there is aninitial slip due to the positive effect of the buoyancyof the steam bubbles. The liquid velocity reduces at alower rate than the experiment although the pumps Ap(Fig 41) is well reproduced; at - 1200 seconds thefurther decrease in the pumps pressure rise is followedby a sharp reduction in the liquid and steam velocities.Finally there is a residual liquid flow up to - 2000seconds when the flow definitely stagnates.
The velocities in the core outlet (Fig 42) practicallyfollow the core inlet velocities. The evolution of theliquid and steam velocities after the pumps trip reflectthe level drop in the core followed by the minor coreuncovery.
AEEW - R 2202 14

The hot leg velocities (Fig 43) are following the sametrend as the core velocities. Just after the sharp dropin velocities after - 1200 seconds the code detectsstratified flow conditions, according to the TaitelDukler's criterion built into the code flow regime map.From then on the liquid and steam velocity are lessstrongly coupled and as a result the slip ratioincreases markedly. No cessation of the liquid flow iscalculated, stabilising at a velocity of around 1 m/swhen the bottom of the pipe fluid velocity detectorindicates stagnation. Along the top of the pipe thesteam is flowing toward the break and the steamgenerator. Once the pumps are tripped a sharp decreasein the velocities is detected and a residual steam flowis maintained feeding the break. The liquid in theupside of the steam generator is observed to begin todrain towards the inlet plenum at around - 2000 secswhere it stagnates until the pumps are tripped. Thenthe liquid is drained back to the hot leg.
The experimental and calculated cold leg velocities,are very similar to those of the hot leg. The codedetected stratified conditions at about the same timeas in the hot leg independently of the strong mixingproduced by the pumps.
An important feature observed in'the calculation is theasymmetrical further pump degradation observed at around1200 secs. A sudden instability develops in which thepump number 2 is delivering all the fluid, while throughpump 1 some fluid is being recirculated. As a resultthe system velocities drop quite substantially. Asomewhat similar behaviour is reported in Reference 4developing at the moment of the pumps degradation in theexperiment (582 secs).
The break line velocities (Fig 45) are well predictedbefore the break uncovers - 1200 secs, at that time thecalculated density in the break line is much bigger thanin the experiment. At around - 2000 secs the codedetects the break uncovery and then the velocities areagain well predicted.
As a result of the reasonable representation of thevelocities and densities in the pipework the hot legmass flow rate (Fig 46) was in good agreement with theexperimental results up to - 1500 seconds.
5.1.3.5 Transient Mass Inventory
The permanent overestimation of the break mass flow rate(Fig 47) produced a greater mass loss than in theexperiment. At around - 2000 secs the calculated rateof mass loss equalised the inlet water from HPIS andpumps cooling injection. In the experiment this time is
AEEW - R 2202 15

subject to a large uncertainty. A possible time atwhich the LOCA was effectively terminated is - 2200secs. The minimum inventory calculated was about 1100Kg while in the experiment it was around 1800 Kg (Figure48).
5.1.4 Conclusions Derived From Run A
a * TRAC PFI-MODl (12.7) provides a reasonably goodaccount of the evolution of the SB-2 transient.
b 0 The main discrepancy between the experiment andcalculation is the overprediction of mass lossfrom the primary system.
c 0 The TRAC built-in flow regime map performs wellin identifying fully stratified conditions.
d 0 To improve the predictive capability of TRAC fortransients where phase separation upstream ofthe break affects the break density, requires amodel relating quality in a branch to thethermal hydraulic condition of the fluid in themain pipe as well as considering the geometriccharacteristics of the break line junction tothe main line.
e Prediction of the correct break flow shouldreduce or remove discrepancies between theexperimental and calculated:-
- Primary Pressure
- Hot Leg Density
- Cold Leg Density
- Primary Mass
- Vessel Inventory and Subsequent Heat Up
f The use of a one-dimensional vessel did nbtallow reproduction of an asymmetrical flowdistribution in the cross section of thedowncomer annulus and its influence in thetransient flow distribution through'thebypasses, especially the RABV bypass.
g 0 SETS allow timesteps - 0.5 seconds to be usedfor large parts of the calculation, and resultsin relatively economical computing times.
5.2 Run B
In order to test the validity of Conclusion e derived from
AEEW - R 2202 16

Run A a second run was made. The main modifications withrespect to the input deck of Case A where:-
- Set up, using the TRAC control logic and twoofftakes, of a system which effectively could controlthe quality in the break line as a function of thevoid fraction in the hot leg.
- Modification of pump head multipliers to force asharp degradation at an inlet void fraction of - 0.35and further modification of Pump No 1 headmultipliers in order to try to reproduce theasymmetrical pump behaviour after degradation.
- Addition of a factor /% missing in the determinationof the critical gas velocity in the stratified model(agreed from Los Alamos Reference 16).
The steady state conditions and chronology of events can be
seen in Tables 5 and 6 respectively.
5.2.1 Results Review
The control on the quality in the break line allowed thereproduction of the experimental density with adequateaccuracy during all the transient (Fig 49). At themoment at which the pumps were tripped the level in thehot leg increased, allowing the discharge of a moredense mixture. This transition was slightly accentuatedin the calculation although the final density at 3000secs is correct.
The break mass flow rate (Fig 50) shows as expected amuch better agreement with the experiment than in Run A.It is observed that the region from subcooled blowdownto very low quality two phase shows a tendency tounderpredict the mass flow, and that at higher quantitythere is a tendency to overprediction.
The primary system mass inventory (Fig 51) agrees wellwith the experiment, the minimum inventory is reached ataround - 1865 secs with a mass of about - 2060 Kg. Inthe experiment the minimum inventory is reached after -2200 secs with a minimum mass of about - 1800 Kg thatagrees well with the calculation [considering theinitial offset of - 250 kg]. The slight underpredictionof the break flow in the very high quality regionx ) 0.99 implies a faster mass inventory recovery thanin the experiment. The correct description of the breakflow as well as the appropriate heat losses results inan excellent description of the primary pressure(Fig 52). The change in the depressurisation rate afterbreak uncovery is properly calculated. The secondaryside pressure (Fig 53) has improved as well, althoughsome discrepancies in the trend of depressurisation
AEEW - R 2202 17

appear after 1200 secs. Corresponding to the goodprimary pressure calculated, the fluid temperatures arevery well reproduced. The liquid hot leg temperature isshown in Figure 54. Similarly the cladding temperature,Figure 55, in the core was correctly calculated; theincrease in temperature after the pumps trip was due tothe increase in pressure following the decrease involumetric flux through the break after the growth ofthe hot leg liquid level.
The smaller amount of mass lost through the breakimplied in general a higher density of the fluidthroughout the transient than in Run A. In Figure 56the hot leg density is shown. The value obtained up to- 1400 secs is reasonable while the evolution of thedensity after that time, as no cessation of forced flowwas obtained, differs significantly from that of theexperiment and a constant value for the density,corresponding to a normalized collapsed level above thebottom of the pipe of - 0.3 was obtained. After thepumps were tripped an increase in the hot leg densitywas obtained due to the draining of water from theupside of the steam generator, and the increase in theswell level of the vessel which overrides the decreasein the collapsed level in the core. The computed coldleg density (Fig 57) shows a similar behaviour 1:o thatof the hot leg before the pumps degrade. After thesubsequent sharp decrease in velocity a build up ofliquid with respect to the hot leg is calculated. Thefailure of the code to predict the end of the forcedflow in the system prevents the pumps from emptying theloop seal and cold leg, therefore the density calculatedfrom - 1400 secs on is considerably higher than that ofthe experiment. Once the pumps are tripped the fluid inthe cold leg drains partly to the vessel and partly tothe loop seal producing a considerable reduction in thecold leg density.
The transient fluid velocities in the system weresignificantly affected by the modifications to the pumpsas well as by the higher densities calculated in Run B,compared to Run A. The downcomer liquid velocity (Fig58) is no longer steadily increasing as in Run A. At -1200 secs the broken loop empties, establishing a newflow distribution in which the steam content in thedowncomer rises and is diverted to the upper plenum viathe RABV (vapour velocity negative in Fig 58) whilepractically only liquid is flowing to the core. Thisstrongly affected the density distribution in the core,Figure 59, inducing a voidage decrease and a slight dropin the swell level. The general trend of the core inletvelocities is reasonably reproduced (Fig 60), althoughthe rate in decrease of the velocity is alwaysunderestimated. At around 1300 secs the liquid andsteam velocities became stable and no cessation of the
AEEW - R 2202 18
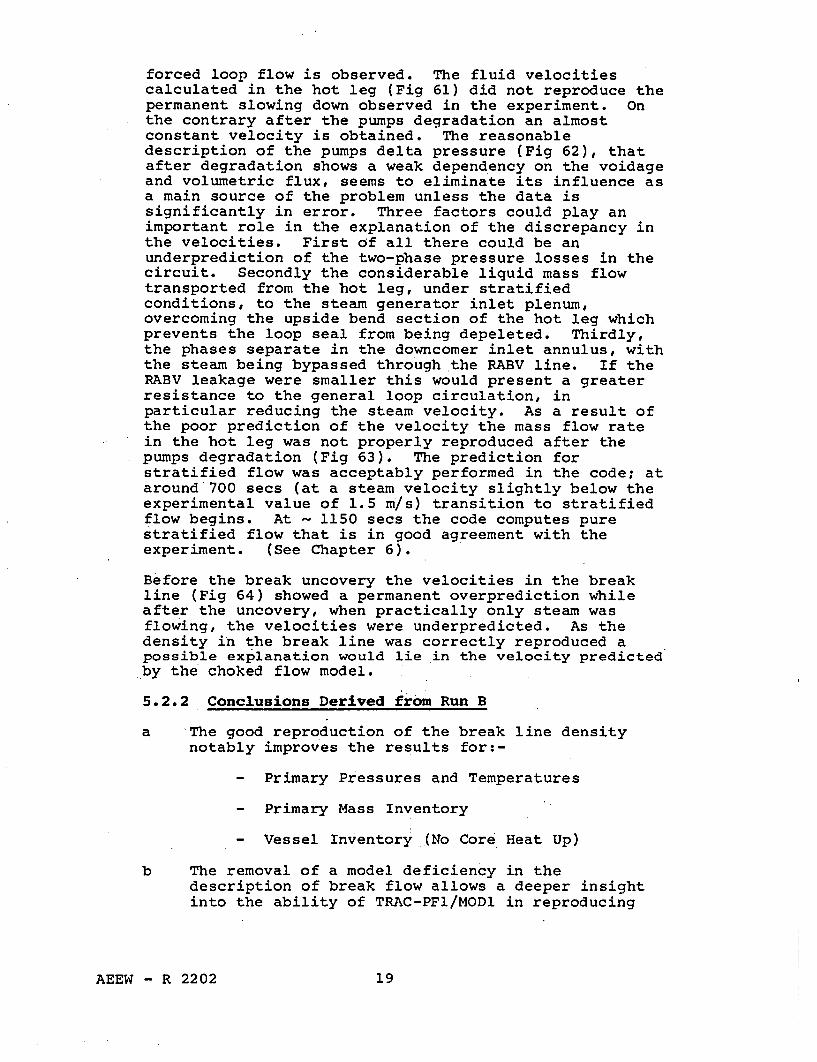
forced loop flow is observed. The fluid velocitiescalculated in the hot leg (Fig 61) did not reproduce thepermanent slowing down observed in the experiment. Onthe contrary after the pumps degradation an almostconstant velocity is obtained. The reasonabledescription of the pumps delta pressure (Fig 62), thatafter degradation shows a weak dependency on the voidageand volumetric flux, seems to eliminate its influence asa main source of the problem unless the data issignificantly in error. Three factors could play animportant role in the explanation of the discrepancy inthe velocities. First of all there could be anunderprediction of the two-phase pressure losses in thecircuit. Secondly the considerable liquid mass flowtransported from the hot leg, under stratifiedconditions, to the steam generator inlet plenum,overcoming the upside bend section of the hot leg whichprevents the loop seal from being depeleted. Thirdly,the phases separate in the downcomer inlet annulus, withthe steam being bypassed through the RABV line. If theRABV leakage were smaller this would present a greaterresistance to the general loop circulation, inparticular reducing the steam velocity. As a result ofthe poor prediction of the velocity the mass flow ratein the hot leg was not properly reproduced after thepumps degradation (Fig 63). The prediction forstratified flow was acceptably performed in the code; ataround 700 secs (at a steam velocity slightly below theexperimental value of 1.5 m/s) transition to stratifiedflow begins. At - 1150 secs the code computes purestratified flow that is in good agreement with theexperiment. (See Chapter 6).
Before the break uncovery the velocities in the breakline (Fig 64) showed a permanent overprediction whileafter the uncovery, when practically only steam wasflowing, the velocities were underpredicted. As thedensity in the break line was correctly reproduced apossible explanation would lie in the velocity predictedby the choked flow model.
5.2.2 Conclusions Derived from Run B
a The good reproduction of the break line densitynotably improves the results for:-
- Primary Pressures and Temperatures
Primary Mass Inventory
Vessel Inventory (No Core Heat Up)
b The removal of a model deficiency in thedescription of break flow allows a deeper insightinto the ability of TRAC-PFl/MODI in reproducing
AEEW - R 2202 19

phenomena which otherwise would have been masked,eg loop flow velocities.
c Taitel and Dukler's criterion built into the codeperforms well in determining fully stratifiedconditions. The interpolating criteria used byTRAC properly identifies the transition tostratified flow, although at a lower steam velocitythan in the experiment.
d The pumps behaviour in LP-SB-2 experiment isconsidered to have been only partially reproducedand considerable uncertainties remain about thetrue pump characteristics for the LOFTconfiguration.
e The loop fluid velocities never dropped to almoststagnation conditions in contrast to indicationsfrom the experiment. It is possible that a betterprediction of two-phase pressure losses and liquidtransport from horizontal stratified conditions inthe hot leg toward the inlet plenum of the steamgenerator, together with an accurate RABV bypassflow may help to remove the discrepancies.
6 SELECTED ITEMS
6A LP-SB-2 Pumps Modelling
The experiment LP-SB-2 was characterised by the importantrole played by the primary coolant pumps. They were a mainfactor in explaining many of the features observed in theexperiment: density distribution, RABV and vessel flows, andflow regimes.
The uncertainty involved in the description of the two-phaseperformance of the pumps has been regarded as a limitingfactor in the capability to reproduce the experiment (Ref 9).The intact 1 oop of the facility contains two similar pumpsworking in parallel. The strong coupling between both pumpsconstitutes a potential source of instability as soon asasymmetrical perturbations in the flow conditions affect thepumps inlet.
The assumption of similar behaviour of both pumps could notbe sustained as the actual trend observed .in the experimentpointed to a clearly asymmetrical one (Ref 4). Thus in orderto create an adequate set of head multipliers it would havebeen desirable to know the individual fluid conditions andperformance for each pump; unfortunately that was not thesituation and the available data only provides an averagedescription.
In experiment LP-SB-2 the density measurement in the verticalsection connecting the steam generator with the bottom of the
AEEW - R 2202 20

loop seal (DE-PC-003B) was questioned in Reference 4 asunreliable, thus an adjusted density was used to derive thepump head versus pump void fraction. (Figures Al, A2 and A3taken from Reference 4). With the adjustment it was foundthat the SB2 pump head closely matched that of L3-6experiment. Under this assumption a set of two phase headmultipliers was derived from Reference 11, and they are shownin Table Al; to be consistent with the procedure to obtainthe head multipliers, the TRAC LOFT pump data for the firstquadrant of the fully degraded characteristic curve was setequal to zero.
The head versus pump void fraction calculated in Run A forboth pumps is plotted in Figure A4. It is observed thatalthough the head multipliers derived from L3-6 have beenused, the results for a void fraction below 0.4, lay betweenthe unadjusted head for SB-2 and the L3-6 head (Fig A2).This discrepancy could be partly related to the uncertaintyof the data used to derive the head multipliers for lowvoidage and possibly to the mass flow dependence of the headmultipliers, which is not included in the TRAC model for thePUMP component. On the other hand the coincidence, betweenthe calculated and measured density in the loop seal (Fig A5)up to 500 seconds points to a questioning of the trend forthe adjusted density at low voidage, which would suggest thatthe unadjusted head could be correct at least up to a voidageof - 0.4.
A better description of the degradation could be obtainedwith-the available data used to derive the general set ofhead multipliers.
At the moment of the degradation - 580 secs a perturbationrelated to the individual behaviour of both pumps wasobserved in the calculation (Fig A6); after a few seconds thebehaviour stabilised again until at around 900 secs(a - 0.55) the behaviour of both pumps started to differ andvery quickly the direction of the flow within the pumps loopwas such that all the mixture was pumped by Pump 2, FigureA7. In Pump 1 the situation was very different; the voidfraction at its inlet rose to practically 1 and a flow ofabout 5 Kg/sec was recirculated from Pump 2.
The mechanism driving this behaviour was found to be relatedto the slight asymmetry of the pumps layout which impliedthat the fluid velocities through both pumps were slightlydifferent. This in turn implied that the void fraction atthe inlet of both pumps were not the same and as aconsequence the heads through the pumps were not equal. Thismode of degradation was found to be strongly sensitive tovariation in the pumps characteristic curves and multipliers;by varying them the time of divergence could be drasticallychanged, or the behaviour could be completely suppressed.
AEEW - R 2202 21

The consequences of this asymmetrical degradation wereimportant as the fall in the pressure increase provided bythe pumps implied a sudden drop in the loop velocities (Fig43) and the. onset of counter-current flow in the downcomer ofthe vessel (Fig 39). A somewhat.similar asymmetrical.degradation was reported in Reference 4 to happen in the SB-2experiment at the moment of the pumps two-phase performancedegradation. In order to try to reproduce this experimentaltrend in RUN B the pump head multipliers were modified asshown in Table A2; it is observed that the head multipliersdiffer from one pump to the other after degradation, this infact constitutes a coarse approximation but allows us toinduce the asymmetrical behaviour to happen at the moment ofthe degradation as it actually happened in the experiment.An indication of the ability to reproduce these results maybe compared in Figures A8 and A9 (no possible quantitativecomparison is available as the motor and pump efficienciesare not known for SB-2). At the moment of the degradationPump 2 takes over the delivery of the fluid mixture, thusincreasing the hydraulic torque while through Pump 1 somefluid is being recirculated from Pump 2. The mass flow foreach pump are shown in Figure A10, where the sudden reductionin the loop mass flow is evident; this in fact happens to betoo large at this stage if we compare with the experimentalresult, Figure 63, which suggests that the degradation hasnot been accurately reproduced and therefore a better set ofhead multipliers would be desirable.
6B Break Flow Density in Experiment SB-2
The ability to reproduce the flow through the break line in asmall break LOCA scenario constitutes an important, if notthe main, factor in performing a satisfactory best estimatecalculation.
The problem of predicting the correct break flow can bedivided into two parts, first obtaining the corrrect mixturedensity of the fluid convected from the main pipe to thebreak line and secondly predicting the liquid and steamvelocities at the break nozzle under choked flow conditions.This section deals with the first of these two elements.
In experiment SB-2 the observed density in the break linestrongly differed from the average of the density in the hotýleg; being biased towards the density at the top of the hot,leg pipe (Fig Bi). The pressure drop from the hot leg to thebreak line was not large enough to explain the observeddifference between the average density in the hot leg and thebreak line in terms of flashing so it should be related tothe phenomenon of vapour pull-through.
To reproduce this behaviour has been a common problem fordifferent organisations and codes including TRAC-PFl-MODI(see Fig 38) trying to reproduce the LP-SB-2 experiment, eg
AEEW - R 2202 22

References 9, 10, 12, and at the present time it remains asan open problem.
No information has been found covering the characteristics ofthe experiment SB-2, that is: liquid and steam velocities inthe main pipe up to 8m/sec and flow conditions from bubblywith high density gradient in the cross section to stratifiedflow with steam at the top of the pipe and nonhomogenoustwo-phase in the bottom of the pipe. The availableinformation covered purely stratified flow with stagnant orvery small velocities in the liquid, eg References 13 and14.
From Reference 13 a correlation of the type:-
XBNCH = EXP x
h = collapsed liquid height in hot leg
was attempted, where the height for the onset of entrainedfluid hA is obtained from:-
/__.20.2I I C gP Branchpg0)
D g2 D (PI -
and analogously the height for the onset of vapour pullthrough hg :-
h. 1 C 1' 2 \.2+ 1mBranchn. +D g (PI,- Pg)
where Cx, CA and C were constants to be obtained, 1 and mxare the gas and liquid mass flux respectively, D is &he mainpipe diameter. The results obtained were unsatisfactory dueto the uncertainty in determining the mentioned constants andthe inability to find a single correlation applicable to allthe transient, in particular it was difficult to reproducethe transition between the steady drop in density up to 1100seconds and the quite sharp decrease as the break uncovers(1100 - 1300 secs).
An alternative approach was finally adopted and the qualityin the break line was correlated to the void fraction in thehot leg in the form of a table of pairs (a, x), see Table B1,being used in conjunction with the Winfrith offtake model(Ref 15). This of course implied that it would be onlyapplicable to the SB-2 experiment thus losing the generalityof a proper correlation. The values for the void fraction in
AEEW - R 2202 23
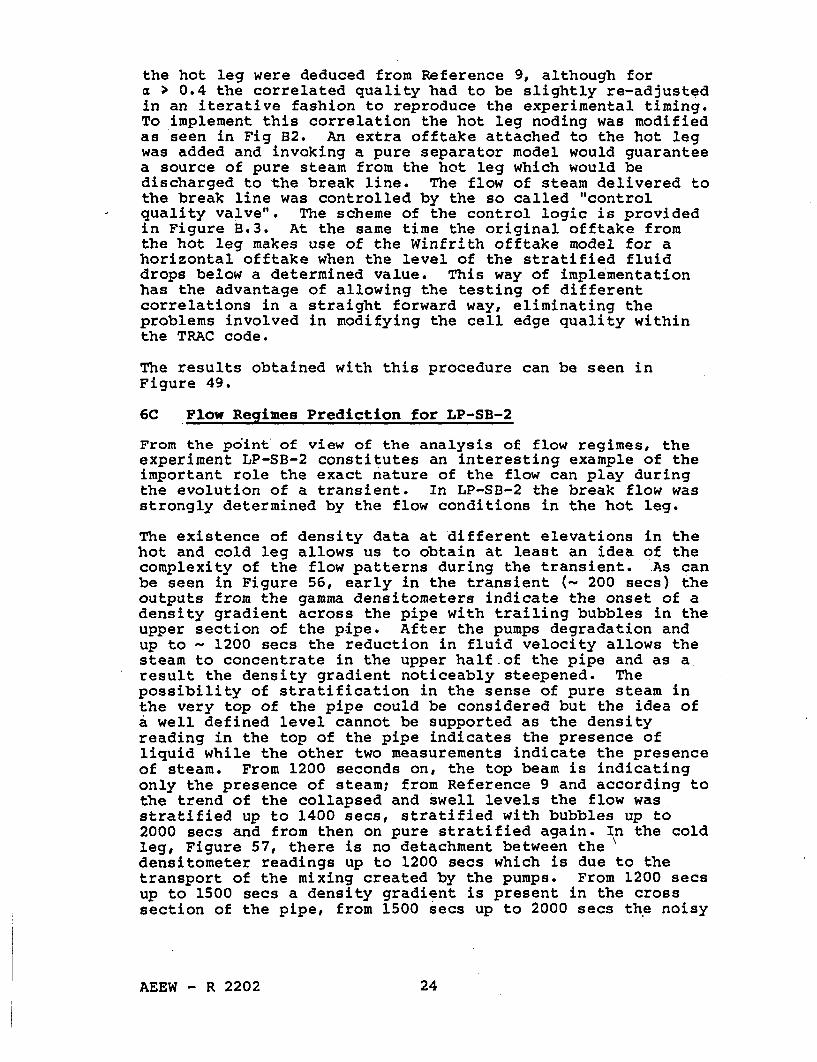
the hot leg were deduced from Reference 9, although fora > 0.4 the correlated quality had to be slightly re-adjustedin an iterative fashion to reproduce the experimental timing.To implement this correlation the hot leg noding was modifiedas seen in Fig B2. An extra offtake attached to the hot legwas added and invoking a pure separator model would guaranteea source of pure steam from the hot leg which would bedischarged to the break line. The flow of steam delivered tothe break line was controlled by the so called "controlquality valve". The scheme of the control logic is providedin Figure B.3. At the same time the original offtake fromthe hot leg makes use of the Winfrith offtake model for ahorizontal offtake when the level of the stratified fluiddrops below a determined value. This way of implementationhas the advantage of allowing the testing of differentcorrelations in a straight forward way, eliminating theproblems involved in modifying the cell edge quality withinthe TRAC code.
The results obtained with this procedure can be seen inFigure 49.
6C Flow Regimes Prediction for LP-SB-2
From the point of view of the analysis of flow regimes, theexperiment LP-SB-2 constitutes an interesting example of theimportant role the exact nature of the flow can play duringthe evolution of a transient. In LP-SB-2 the break flow wasstrongly determined by the flow conditions in the hot leg.
The existence of density data at different elevations in thehot and cold leg allows us to obtain at least an idea of thecomplexity of the flow patterns during the transient. As canbe seen in Figure 56, early in the transient (- 200 secs) theoutputs from the gamma densitometers indicate the onset of adensity gradient across the pipe with trailing bubbles in theupper section of the pipe. After the pumps degradation andup to - 1200 secs the reduction in fluid velocity allows thesteam to concentrate in the upper half .of the pipe and as aresult the density gradient noticeably steepened. Thepossibility of stratification in the sense of pure steam inthe very top of the pipe could be considered but the idea ofa well defined level cannot be supported as the densityreading in the top of the pipe indicates the presence ofliquid while the other two measurements indicate the presenceof steam. From 1200 seconds on, the top beam is indicatingonly the presence of steam; from Reference 9 and according tothe trend of the collapsed and swell levels the flow wasstratified up to 1400 secs, stratified with bubbles up to2000 secs and from then on pure stratified again. In the coldleg, Figure 57, there is no detachment between thedensitometer readings up to 1200 secs which is due to thetransport of the mixing created by the pumps. From 1200 secsup to 1500 secs a density gradient is present in the crosssection of the pipe, from 1500 secs up to 2000 secs the noisy
AEEW - R 2202 24

reading from the densitometers could indicate the presence oferratic waves probably caused by fluctuations in the flowdelivered from the pumps as the loop seal is being depleted.Despite this the flow regime may be considered as stratifiedthroughout the rest of the transient.
The recognition by TRAC of some of the flow patterns involvedin the transient is difficult especially when they involvenon fully developed regimes, ie partially stratified flow inwhich the separation of the liquid and steam phases is farfrom complete. The TRAC flow regime map from Reference 5 isshown in Figure Cl plotted as log (FROUDE) vs vapour voidfraction. Included on the map is the TRAC implementation ofTaitel-Dukler stratified flow criterion and the limit forinterpolation for transitions into stratified flow.
The prediction for Run B can be considered satisfactory asthe code is able to predict the trend of the experimentfairly well. Up to - 500 secs, see Figure C2, only bubblyflow is predicted. From 500 secs up to - 700 secs someweighting with slug is made. At 700 seconds theinterpolating criterion for stratified flow is reached.Finally at around 1150 secs pure stratified flow ispredicted, this being the flow regime for the rest of thetransient. For the cold leg the results obtained indicatedtransition to fully stratified conditions at about the same
'time as that in the hot leg, that is - 1100 secs; this is notthe trend of the experimental measurement which by that timeindicated the onset of a vertical density gradient. Thisdiscrepancy is mainly dependent on the high degree ofmechanical mixing in the fluid induced by the rotating pumpsbeing transported along the cold leg. This effect should betaken into account as the flow through a break in the coldleg would be dependent on the fluid characteristics in themain pipe and in particular the void profile at the breakline offtake location. It should also be noted that for RunB a missing factor. /x in the determination of gas criticalvelocity in the Taitel Dukler Test was implemented as agreedfrom Los Alamos, Reference 16.
7 SUMMARY AND FINAL CONCLUSIONS
0 Two calculations of LOFT test LP-SB-2 were carriedout with TRAC PFl/MODl (approximately Version 12.7).
0 A one-dimensional description of the vessel wasimplemented in the input deck. Due to the relativeimportance of the different core bypasses, especiallythe RABV, it would be desirable to use a 3-Drepresentation of the vessel in order to assess thedegree the prediction of the transient evolution isaffected. It would also help to evaluate thepossibility of asymmetrical flow distribution in thedowncomer annulus.
AEEW - R 2202 25

" The representation of the vessel, whether one- orthree- dimensional, has the limitation of the poordescription for heat structures. No double sidedheat structure is available and thus the radial heatflux across all the vessel structures is onlypartially reproduced. At the present time it is animportant limitation in the TRAC PFl/MODl modellingof the vessel and a better description would bedesirable.
" The Code (CPU/Problem) time for Run A was consideredgood, having a value - 1.95. In Run B this ratioincreased to - 2.3.
" The use of large timesteps was found as a possiblesource of running problems as the code sometimesfailed when trying to reduce the timestep from bigtimestep values. This meant that the maximum timestep had to be reduced in Run B during parts of thetransient.
* The set of initial conditions obtained for the steadystate in Run A and B were reasonably good. Nospecial problem was found in obtaining these steadystates.
• The chronology of events for Run A and B matched theexperiment in some degree. Not surprisingly, whenthe break flow is well reproduced (Run B) the codeoverall reproduces of the experiment results better.
* Vapour pull through and liquid entrainment wereobserved to occur at the offtake of the break line.TRAC PFl/MODl was unable to recognise this phenomenonas no relevant model is actually implemented relatingquality in a branch to the thermal hydraulicconditions of the fluid in the main pipe, as well asconsidering the geometric characteristics of thebreak line junction to the main line.
" The TRAC built-in flow regime map performs well inidentifying fully stratified &onditions in the hotleg. The introduction of a missing factor Vu(modification agreed by LANL) in the determination ofthe gas critical velocity (performed in Run B) helpsto improve the results and the code is able topredict the initiation of the transition tostratified flow at about the correct time, althoughthe steam velocity at that time is underestimated.
" The calculated flow transitions predicted for thecold leg closely match in time those of the hot leg.The experiment shows that the high mixing provoked bythe pumps maintains bubbly conditions for a longperiod. This generation of mechanical mixing, its
AEEW - R 2202 26

transport and then its influence on the flow regimemap should be considered for small breaks located inthe cold leg. The break flow will still-be afunction of the void profile in the cold leg, butthis is likely to be quite different from that in afully developed flow.
* The reproduction of the pumps behaviour in LP-SB-2constitutes an important problem and no satisfactorysolution has been found yet. The pump model couldnot be appropriately validated as the set of headmultipliers was not completely reliable, because itwas deduced under the assumptions of pumps averagebehaviour and similitude to L3-6 experiment. Furtheruncertainties were involved in the reproduction ofthe asymmetrical pumps degradation, ie pumps inletflow condition.
It seems likely that in order to reproduce theobserved behaviour a priori, more sophisticatedmodels of the pumps themselves, and of the effect ofthe pump inlet branching geometry on inletconditions, would be needed than TRAC currentlyprovides. Better data from the test, however, wouldprobably allow an improved (a posteriori) fit withinthe scope of the existing models.
* The velocities predicted by the code after the pumpsdegradation were not entirely satisfactory and thesteady fall in velocity observed in the experimentwas not reproduced. Finally no liquid flow cessationwas calculated. Three possible causes may bementioned: underprediction of two-phase pressurelosses, handling of the liquid convected from the hotleg towards the steam generator inlet plenum understratified conditions, and influence of the flowthrough the RABV.
* The choked flow model predicted the results withreasonable accuracy and the subcooled and two-phasemultipliers used for all the calculations were 1.0.Small discrepancies in the velocities were observedwhen the break line density was correct (RUNB).
* The mass loss predicted for Run A was large enough toprovoke a mild uncovery of the top of the core afterthe pumps trip, contrary to experiment. In Run Bthe break flow was adequately predicted and the massloss closely matched the experimental result. Nocore uncovery was predicted.
AEEW - R 2202 27

REFERENCES
AEEW - R 2202 28

REFERENCES
1 READER, D L. "LOFT System and Test Description."NUREG/CR-0247, Tree-1208.
2 ALLEN, E J. Internal Document.
3 BIRCHLEY, J. Private Communication.
4 MODRO, S M et al. "Experiment Analysis and SummaryReport on OECD LOFT Nuclear Experiments LP-SB-l andLP-SB-2. OECD-LOFT-T-3205, May 1984.
5 LILES, R et al. "TRAC PF1/MOD1 and AdvancedBest-Estimate Computer Program for Pressurised WaterReactor Thermal-Hydraulics Analysis". NUREG CR/3858,July 1986.
6 PELAYO, F. Internal Document
7 McPHERSON, G D. "Decay Heat Data for OECD LOFTExperiments". USDOE, October 1985.
8 ALEMBERTI, PROTO. "Experiment Analysis and SummaryReport on OECD LOFT Nuclear Experiment LP-SB-3."December 1985, Draft (T-20000-XX-140-020).
9 ANODA, Y. "OECD LOFT Experiment LP-SB-l and LP-SB-2Calculation Comparison Report." July 1986, Draft.Japan Atomic Energy Research Institute.
10 POINTER, W. "Post-Test Calculation of the OECD LOFTExperiment LP-SB-2 with DRUFAN-02." OECD-LOFT-T-3307,December 1984.
11 TIEN-HU CHEN, SLAVOMIR, M MODRO. "Transient Two-PhasePerformance of LOFT Reactor Coolant Pumps". ASME WinterAnnual Meeting, 13-18 November, 1983. EGG-Nl-21982,
12 WESTACOTT, J L, PETERSON, G E & CHEXAL, U K. "Retran 03Analysis of LOFT Experiments LP-SB-1 and LP-SB-2." EPRINP-4799 P Project 2420 Final Report, September 1986.
13 ANDERSON, J L & BENEDETTI, R L. "Critical Flow ThroughSmall Pipe Breaks." EPRI NP-4532, Project 2299-2 FinalReport, May 1986.
AEEW - R 2202 29

14 SCHROCK, V E. "Critical Flow Through a Small Pipe Breakon a Large Pipe with Stratified Flow." Presented at the13th Water Reactor Safety Meeting, Gaitersburg, October1985.
15 RICHARDS, C. Internal Document.
16 Letter from Los Alamos, R Jenks to C G Richards,14 January 1987.
AEEW - R 2202 30

FIGURES
AEEW - R 2202 32


Intact IOOD Broken loopIntact loonBrenlo
14 BL- Quick openingexperimental valve (2)measurement
~~PC-2 (0 experimental
o measurementstation
Steamgenerator Isolation
valve (2)
Prssrie BL-2experimental
measurement•• station
densitometer-ECC cold leg.. o
*" "--'. Injection location-PC-1
experimentalDrag disc measurementand turbine
Break plane veseReactor -"
• Suppression
vessel Downcomer-
Core-CV-P139-57 /Lower plenunr
CV-P139-58 To BST
INEL.LP.SB.11LP.SB.2 1509
Axonometrlc projection of the LOFT system configuration forExperiments'LP-SB-1. and LP-SB-2. From Reference 4
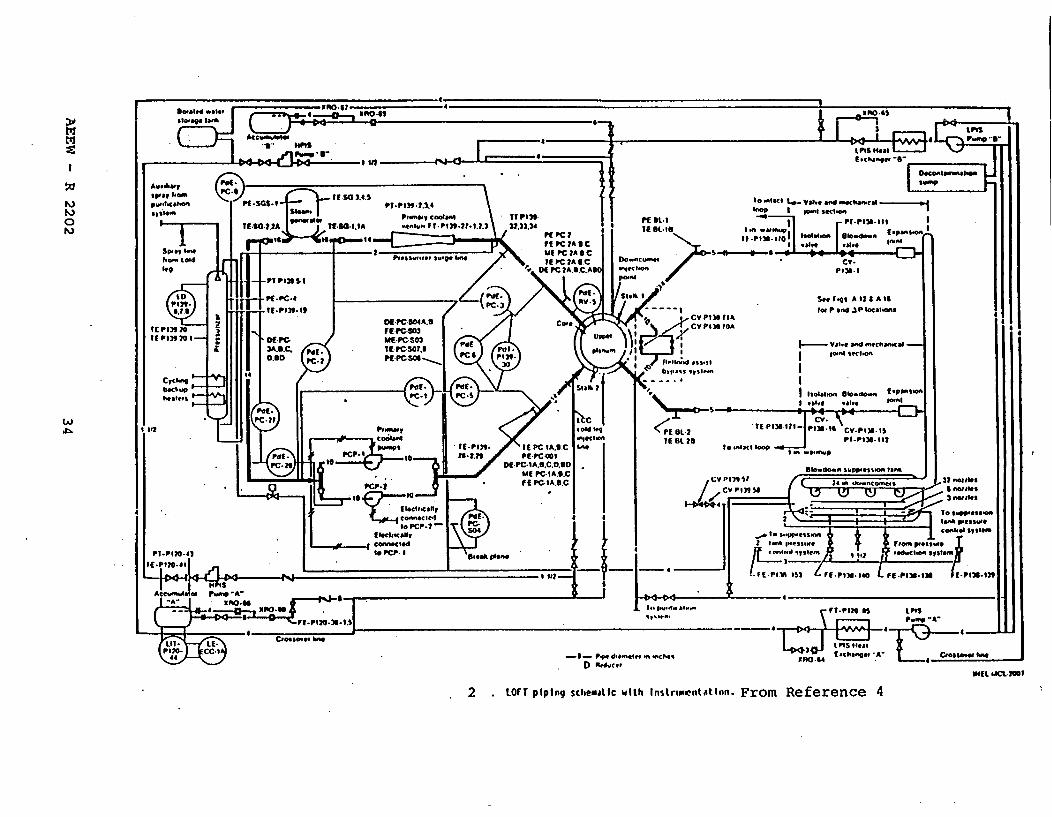
Swessed .010. - -U-st 11"o-&I I ~
tRi
N)NJ0N)
.110J-is -1'sotP., ism I
Aw..bow. so
door h Posw-y COOIm' TI P139. PI L1PfP3.1TE601,ATE-3O-1.IA *mow.. I I.P1394?. 1.2.3 32.33.34 T-1.1
141 0 14 #"&twoto I @ot4.w U.do.a
3 is.& 1w,14 P1o PC WE4I
10".S9Co.1 PC- Pow.O.Sp.f o~lo odPloacn
3A.S.C. WhoCamIAmSrC.an9a
Plot~ ~ ~~~~ - e-OlPs ol.1M1seti1DAD~~ PC.?Plses"
30 eleeclM14 bypass syss..
3PC -4
4w~ .fP" Ite PC... IA.... to Wattz looP T. PP'M3 - I t 114.s-C
I
L. J111 C~o.os .es loe. tF15 $##at
3104 f.chae.e -A- Closo.".. lot.-I- Poe da.8el.ft on elect..D Re4octe
IreL t UCL-200M
2 LOFT piping schematic with Instrwoputation. From Reference 4

tzj Z.3
93..
to S/l/
3.
3 LOFT FACILITY NODING DIAGRAM

Key
4 CORE BYPASS FLOW PATHS
AEEW - R 2202 36

0 C.O ~hoUsAI Nes.0 Pet. .CS
C.MFON~CNT Iq
(avIcPYNT S
cctmpciJ0Vr at*
5~bt~i. ~
LL~r PW~n~ (~c~r~ccrrQr)
~Aj~por *~iQA&h~~v% (C.a~it.)
P~QJ~LLa~ C~pa~ ~I¶Qr)
~jpc~.S 'Po*)'~. V
~ Cc~po~ ~)
con .poh wr Im L Lb(,.A% 0 c c t-
C.Cnm WI CRo
5 ONE-DIMENSIONAL VESSEL REPRESENTATION
AEEW - R 2202 37

6 STEAM GENERATOR NODING
AEEW - R 2202 38

THE FOLLOVING'ARE PLOTTED AGAINST REACTOR TIMETOTAL TIME STEPS
Winfr Ithl
ti
KEYSYR NAME UNITSBOt
- TOTAL TIME STEPS ,
LOCw o/ o/ I Hltr-STPT NF 3,I ITRAC
0 500 1000
REACTOR TIME
1500 2000SECONDS
2500 3000
7 TOTAL TIME STEPSLP-5B-2 - TRAC PF1-MOOI AND EXPERIMENT COMPARISON

tI~
1'.)t~J
.0'U
0
TH1E FOLLOWING ARE PLOTTED AGAINST REACTOR TIME
TIME STEP SIZEWiInfr' I thl
KEYSYt NAME UNITS.BOL
- Ti7E SIEP SIZE " SECONOSLOC= 0/ 0/ 1 INEtMzSEP IWf=l
TRAC
(n03z0u-waEn
REACTOR TIMSE , SECONDS
8 TIME-STEP SIZELP-SB-2 - IRAC PF1-MOD1 AND EXPERIMENT COMPARISON

NN
I~s,0
I-.
THE FOLLOVING ARE PLOTTED AGAINST REACTOR TIMlE
SIGNAL VAR. NO. 2,PE-PC-002WIlnfr Ithl
KEYsYt NAME UNITSBOL
SIGNAL VAR. NO. 2,LOC= 0/ 0/ 1 i1HEHl=S 2 INF-I
- - PE-PC-002 fH*LOC. 77/ 0/ 0 I1NEHl-PRES INF-2
0. 20E
0. 18E
TRAC
0. 16E
EXPT
0. 14E
0. 12E
0. 1OE
0. 8OE
0. 60E
0. 40E
0. 20E
0. OOE
20
18
16
14
12
10
8
6
4
2
0
(3.
0 100 200 300 400 500 600
REACTOR TIME , SECONDS
9 INTACT LOOP HOT LEG PRESSURELP-SB-2 - TRAC PFI-MOOI AND EXPERIMENT COMPARISON
700 800

I lIE rIj.1LOVING ARE PLO1 £l AIAIIH;I IN At.1110 It 111
VAPOR FRACTIroN1WInfrith
0
t,
KEYSYII NAMIE UNIISDO.
1.0
- VAPOR FRACI IONLtJC= 81/ 0/ 1 flNMflV0ID tVI
-N=ITRAC 0.8--- VAPOR FRACTION 8
LOC- 84/ 0/ I 14NEI-VOID INE=I I
Vessel upperplenum
Box before hotleg nozzles
0.6
0.4
0.2
0.0
It
REACTOR 1I11E , SECONDS
!
D
t
10 VOID FRACTION IN THE UPPER PLENUM AND BOX
LP-SB-2 - TRAC PFl-MODlBEFORE HOT LEG NOZZLES

THE FOLLOWING ARE PLOTTED AG61NST REACTOR TIME
toJ0
MASS FLOW RATE ,FR-PC-S031WInfri th
KEYSYM NAME UNITS80L
- MASS FLOV RATE ,KG/SECL0•: 98/ 0/ 1 MNEM:FLOV INF=l
- - FR-PC-S03 ,KG/SECLOC- 23/ 0/ 0 MNEM-FLOV INW-2
14
TRAC
EXPT
UIlz
Ci]w_vr
0 100 200 300 400 500 600 700 *800
REACTOR TIME , SECONDS
11 BREAK MA'SS FLOWI RATELP-SB-2 - TRAC PF1-MOOI AND EXPERIMENT COMPARISON

:to
K)
J.s~
[liE FOLLOWING ARE PLOTTED AGAINST REACTOR TIME
PUMP DELTA-P *PDE-PC-O01WInfri ,h
cAAnn•JLJ~JI.JUU r -r-
KEYsYti NAME UNITS 450000BOL- PUtl OELTA-P ,Nlnf..2 TRAC
LOC= 4/ 0/ 1 hiNEfDELP rWNI 400000
-- POE-PC-O01 ,KPA EXPTLOC- 65/ 0/ 0 IINEM.PO INF.2 350000
300000
250000
200000r
z 150000
100000
50000
A
W g I S I I
VAlz,ý
\AVIII'it
500
450
400
350
300
250
200
150
100
5O
0
-50
-100
0Lv<
v I I IJ
-50000
_Ii n nný -- uJ
0 100 200 300
REACTOR TIME
400 500 600
, SECONDS
700 800
12 PRESSURE DIFFERENCE OVER TH-E MAIN COOLANT PUMPS.LP-SB-2 - TRAC PF1-MODI AND EXPERIMENT COMPARISON

THE FOLLOWING ARE PLOTTED AGAINST REACTOR TIME
t~)
0
ul
SIGNAL VAR. NO. 6, PT-P004-01 AJWInfrithJh
KEYSYMi NAME UNITSBOL
- SIGNAL VAR. NO. 6,LOC= 0/ 0/ 1 iNEM=S 6 INF=I
7000000
00RAC6500000
7.0I I I I I . I ~ I I
I -5-
--- PT-PO04-OIOA ,IPA EXPTLOC- 86/ 0/ 0 tKNEMPRES INF.2.
6000000
5500000
6.5
6.0
5.50<
50000001-
4500000
5.0
4.5
4.0, nr.r.r.rar.
13 SECONDARY
SIDE PRESSURE.
LP-SB-2 - TRAC
PFI-HODI AND EXPERIMENT
COMPARISON0 '100 200 300 400 500 600 700 800
REACTOR TIME , SECONDS
13 SECONDARY SIDE PRESSURE.LP-SB-2 - TRAC PFI-MOO1 AND EXPERIMENT COMPARISON

T14E FOLLOVING ARE PLOTTED AGAINST REACTOR TIMlE
LIOUID TEtMPERATURE ,TE-PC-002BlWinfr-I R
MI
0N,
KEYSYi NAIME UNITSBOL
- LIUI0 TOIiPERATURE *OEG.KL0C= 99/ 0/ 2 IiNEtl=IEIL ITIW=
- - TE-PC-002B D 0EG. KLOC. 130/ 0/ 0 IINEM-IIICL INf-2
rRI~c
EXPT
ILi
0 100 200 300 400 500 600 700 800%!li
!
!
REACTOR TIME SECONDS
14 LIO TEMPERATURE IN THE HOT. LEG OF THE INTACT LOOPLP-SB-2 - TRAC PFI-MOO1 AND EXPERIMENT COMPARISON

THE FOLLOWING ARE'PLOTTED AGAINST REACTOR TIME
LIOUID TEMPERATURE ,TE-PC-0018I In fr It hF
0
-J
I KEYI n NAIE UNlITS
-LIUJIO TEMPERATURE ,DEG.KSLICu 7/ 0/ 4 IIUEMMEIL INF-t
600J |
PA~C
E XPT
5801-
-- 7E-PC-001B , DEG.-LIC- 121/ 0/ 0 WJKfl.7fCL flF.2
560 . r . --- -- -- ------- o• ....
5401-
ti0
5201.
5004-
4801
460 I
I I I I I S I I
0 100 200 300 400 500 600 700 800
REACTOR TIME , SECONDS
15 LIO TEMPERATURE IN THE COLD LEG OF THE INTACT LOOPLP-S5-2 - TRAC PFI-MOOI AND EXPER9MENT COMPARISON

THE FOLLOVING ARE PLOTTED AGAINST REACTOR TIMESIGNAL VAR. NO.. 2,SIGNAL VAR. NO. 6
WUJin fr Ith
*N)N)0N)
KEY5Yt NAME UNITSBOL
SIGNAL VAR. NO. 2,
LOC. O/ 0/ 1 iINEM=S 2 IIF=I
--- SIGNAL VAR. NO. 6,LOC. 0/ 0/ 1 WINEII-S 6 1NFWI
0. 20E
0. 18E I
TRAC
0. 16E
XPT
0. 14E
0. 12E
0. IOE
o. 8OE
0. 60E
0. 40E
0. 20E
0. ODE0 100 200 300 400 500 600
REACTOR TIME * SECONDS
16 PRIMARY AND SECONDARY PRESSURES IN TRACLP-SB-2 - TRAC PFI-MOOI AND EXPERIMENT COMPARISON
700 800

THE FOLLOVING ARE PLOTTED AGAINST REACTOR TIME UJInfrIth
01~i
MIXTURE DENSITYDE-PC-O02C
,OE-PC-002A ,DE-PC-002B
KEYSTh NAME UNIITSBOL
- MIiXTRtE DENSITY ,KG/tl**3LOC:: 991 0/ 2 tlNEfl=DENM INF..I
- - DE-PC-0O2Ak MlG/M**.3
LDC- 8/ 0/ 0 flNEM-.!ENM INF-2
---DE-PC-0028 M IG/M*#.3LIJC. V/ 0/ 0 ttflEfl=ONMINFL.2
- DE-PC-002C II1G/ti*#SLOC= ID/ 0/ 0 tiNEM1DflNt INFs2
TRAC
EXPTBOTTOM
MIDDLE
TOP
1.0
0.8
0.6
N')
0.4 V
r
0.2
0.0
-0.2
REACTOR TIME
17 DENSITY IN THE HOT LEG INTACT LOOPLP-SB-2 - TRAC PFI-MODI AND EXPERIMENT
, SECONDS
COMPARISON

TIHE FOLLOVING ARE PLOTTED AGAINST REACTOR TIME 1WI n fr I t h1
N,N)0N,
U'0
MIXTURE DENSITYDE-PC-O01C
,DE-PC-OOIA ,DE-PC-.OOIB
KEYSYti NAMIE UNITS001
- flIXTZ*RE DENS17Y ,KGIHl.3LOC= 7/ 0/ 4 IiNEMIDENM l Iaf
1000
800
I I I I . I I
rRAC
- - BE-PC-00IA ,IG/tU__3 rXPTLOC- 5/ 0/ 0 flNEMl=ENH IWV.2 IBOTTOM
--- B-PC-00IB tlG/l.P* iMIDDLELOC- 61 0/ 0 flNHE~.DENfl hV=2
- BE-PC-OCC JI I*6 TOPLOCa 7/ 0/ 0 MIINMlENfl 1W.2j
'- ""
600-.-A. AI
IvT.IY-, TIV.-'a, I wl -
. 11
.400V I' ~'I
1.0
0.8
0.6
0.4
2::
0.2
0.0
-0.2
200 -
0 I i i .I a i i I
I I I I I I I•JI ||| = I I i, I I• .. .. • • •-ICU !0 00 200 300 400 500 600 700 800
REACTOR TIME , SECONDS
18 DENSITY IN THE COLD LEG OF THE INTACT LOOPLP-SB-2 - TRAC PFI-MODI AND EXPERIMENT COMPARISON

'C' Detector~'cm
'B'
Source
34.:I cm
Drag discturbine meter
C' Detec-.or
urbine blade
'7Drag disc
Drag disc
turbine meter C
S-'' Detector
28.4 cm ID
'D' Detector-.'-"J'A' Detector
(b) Cold leg (DE.PC-1) INELA 0039
19 Relation of source and detectors to pipe for LOFT gammadensitometers and flowmeters in intact loop hot and coldlegs.From Reference 4
AEEW - R 2202 ... .................... 51

'111' I'(.L0VIIHi ARE PLOTTED AGAINST REACTOR TI'E
VAPM FRACTIONJWinfrithq
KEYsTH
NAMIE UNITS5-VAMO FRACTION
L(JC= 2/ 0/ 7 HWMIUVOIO INFxlTRAC
U.'
0 " 100 200 300 400 500 600 700 800
REACTOR TIME , SECONDS
20 VOID FRACTION AT TOP OF U TUBESLP-SB-2 - TRAC Pnl-.moO

THE FOLLOWING ARE PLOTTED AGAINST REACTOR TIME. 1Winfr';thl
0lw~
MIXTURE DENSITY ,DE-PC-0038
KE Y5Th NAME UNITS
- IIXTIJRt DENSITY* KG/M*.*3LOC= 3/ 0/ 5 flNEfl=DEN"1 lf=I
- - DE-PC-0038 MIG/ll**3LOC- Il/ 0/ 0 lINElI.OENI INF.2
rRAC
EXPT
1.0
0.8
0.6
0.4 *
0.2
0.0
-0.20 100 200 300 400 500 600 700 800
REACTOR TIME 0 SECONDS
21 LOOP SEAL DENSITYLP-SB-2 - TRAC PFI-MODI AND EXPERIMENT COMPARISON

TIHE FOLLOWING ARE PLOTTED AGAINST REACTOR TIME
g~J.
0ts)
lWin Er itMIXTURE DENSITY ,OE-PC-SO40
KEY
NAME UNITS.
- MIXIURE DENSITY aKG/h**3LDC= 99/ 0/ 0 IDIlfll=IDENfl IWf=I
1000
--DE-PC-SO'40 IIG/tt**3LOC- Vif_0/ 0 IINEM-OENf IWf.2
TRAC
9XPT
N,CI
1.0
0.8
0.6
0.4 *
0.2O.O
0. 0
-0. 2
U'.
L REACTOR TIME , SECONDS
22 DENSITY IN THE BREAK LINELP-SB-2 - TRAC PFI-tlOJIl AND EXPERIMENT COMPARISON

TIE FOLLOVING ARE PLOTTED AGAINST REACTOR TIMt jWI nfr t I
I
'3.
LIOUID VELOCITY ,VAPOR VELOCITY ,FE-PC-O01C
KEY
SM NAMIE LlNITS801q LII3JID VELOJCITY M1/SECICC- 7/ C/ 4 tINEtI=VLIU [Wft
--- VAPOR VELOCITY .11/SECLOC. 7/ 0/ 4 1MXEI-WAP IW.I
- - FE-PC-OCo CM1/SECLOCC I5/ 0/ 0 lltEtlJE 1FF.?
TRAC
EXPT
In
I. 1
0 100 200 300 400 500 600 700 800
REACTOR TIME , SECONDS
23 LIO AND VAP.VELOCITY IN THE COLD LEGLP-SB-2 - TRAC PF1-MOOI AND EXPERIMENT COMPARISON

0
TIlE FOLLOVING ARE PLOTTED AGAINST REACTOR TIME
LIOUIDVELOCITY aVAPOR VELOCITY ,FE-PC-002AFE-PC-002C
jWlnfrithý
KEYSN NAIIE WNITSIam1
-LIOUID VELOCITY *ItSECLOC= 99/ 0/ 2 flNEMtaVLIO Ilf'z
-- VAPOR VELOCITY *It/SECLOC- 991 0/ 2 IlNEtI-VVAP [Wf-I
TRAC
-FE-PC-002A MI/SECLOC. 16/ 0/ 0 IINEti-FE IWf.2 I/
E. - -W: x LAM
.-- FE-PC-002C, /ELOC= 17/ 0/ 0 flNEIUMF ItF2
U),U)
REACTOR TIME , 5ECONDS
24 LID AND VAP VELOCITY IN THE HOT LEGLP-SB-2 - TRAC PFI-MODI AND EXPERIMENT COMPARISON

THE FOLLOVING ARE PLOTTED AGAINST REACIOR TIME 1WInfrith1
-j
LIOUID VELOCITY ,VAPOR VELOCITY OFE-IST-001
KEYSYH NAME UNI TSBOL
LIOUID VELOC17Y SM/ISEC
LOC= 86/ O/ 8 MNIIE=VLIGI IN=I
-- VAPOR VELOCITY ,M/SECLOC- 86/ 0/ 8 MMEM-VAP IWF1
--- FE-IST-O01 ,M/SECLOC. 18/ 0/ 0 11NEMI.FE [F=2
TRAC
EXPT
uw~
REACTOR TIME , SECONDS
25 LID AND VAP VELOCITY IN THE OOWNCOMER OF THE REACTOR VESSELLP-SB-2 - TRAC PFI-MOO AND EXPERIMENT COMPARISON

m~J0
THE FOLLOVING ARE PLOTTED AGAINST REACTOR TIMEFUNCTION ,FE-SLP-O01
WIJnfrlthh
KEY801 NAME UNITS
- FUNCTION VLIO'•m•nr-i ----------- 4
- -FUNCTION VVAP..
-- FE-SLP-001 H1/SEICLOC- 20/ 0/. 0 lINEfi-fE INF.2 EXPT
10
I0
8
(.ANir2:in
co
-20 100 200 300
REACTOR TIME
400 500 600
, 5ECOND5
700 800
26 LIO ANDLP-SB-2
VAP VELOCITY AT CORE INLET- TRAC PFI-MODI'AND EXPERIMENT COMPARISON

THE FOLLOWING ARE PLOTTED AGAINST REACTOR TIME WInfrithJ
to)
FUNCTION ,FE-SUP-O01
KEYsyM NAHE UNITSBOL
FUNCTION VLIOI
-- FUNCTION VVAPV1HAU
EXPT-- FE-SUP-001 . M/SECLOCC 22/ 0/ 0 liNEn-FE 1FF-?
10
8
.6
4u
2:
0
-20 100 200 300 400 500 600 700 800
REACTOR TIME ,5ECONDS
27 LIO ANDLP-SB-2
VAP VELOCITY AT CORE OUTLET- TRAC PFI-MOO! AND EXPERIMENT COMPARISON

TIHE FOLLOWING ARE PLOTTED AGAINST REACTOR TIME
hihi0hi
o~h0
IWiJnfrl thLIOUID VELOCITY ,VAPOR VELOCITY ,FE-PC-503
KEYsyM NAME UNITSBOL
- LI1IO VELOCITY *ti/SECLOC= 99/ 0/ 0 MNEM=VLIO 11=f
*1--- VAPOR VELOCITY .1M/SECLOC- 99/ 0/ 8 IIHEM-WAP IF-.I
- - FE-PC-S03 ,"l/SECLOC. 14/ 0/ 0 IINEM.FE IWF.2
r*(KAC
ZXPT
L)LoU~)N,
0 100 200 300 400 500 600 700 800
REACTOR TIME
28 LID AND VAP VELOCITY IN THE BREAK LINELP-SB-2 - TRAC PFI-MODI AND EXPERIMENT
, SECONDS
COMPARISON

• $
THE FOLLOVING ARE PLOTTED AGAINST REACTOR TIME WInfr'ith i
I~J0#'3
0~iI-.
CONTROL OLK 10 -81oFUNCTION
KEYsyM NAME UNITSBOL- CONTROL OLK I1 -81,LOC= 0/ 0/ 1 1NE?1=C-8l IFlI
-- FUNCTION
TRAc
EXPT
0 100 200 300 400 500 600 700 800
REACTOR TIME , SECONDS
29 TRANSIENT MASS INVENTORY4-&PLUS5÷+ PLOTTING UTILITY SYSTEM AEEV

0
.III FOLLOVING ARE PLOTTED AGAINST REACTOR TIME WI nfr ithSIGNAL VAR. NO. 6, PT-PO04-OIOA
KEYSBl801 NAME UNITS
i
- SIGNAL VAR. NO. 6,LOC= 0/ 0/ 1 HNEflS 6 INF=I
- - PI-PO04.-OIOA M1VALOC- 86/ 0/ 0 IHNEK-PRES IlW-2
7000000
TRAC6500000
EXPT
6000000
5500000
5000000
4500000
K
"S
5'
5'
5'
5'.5.5'5'
'S.5'.
5'5'
5'5'5'5'
'5
5'5'5'
'5
N5'
5'5'N
-'S
7.0
6.5
6.0
5.5t2E.
5.0
4.5
I
S.
LluJuJujJu, 4.0000 500 1000 1500 2000 2500 3t
REACTOR TIME , SECONDS
30 SECONDARY SIDE PRESSURELP-SB-2 - TRAC PFI-MODI AND EXPERIMENT COMPARISON

'IIII. FOI.LLIIlNG ARE PLOTTED AGAINST REACTOR TIME
SIGNAL VAR. NO. 2,SIGNAL VAR. NO. 6lwin fr it Ii
tljtil
0
0~CA)
KEY5sy NAME ULNITSBOL
- SIGNAL VAR. NO. 2,LOC= .0/ 0/ I HHEH=S 2 INF=I
--- SIGNAL VAR. NO. 6,LOC- 0/ 0/ 1 HNEtM.S 6 INF-I
0. 20E
0. I8ETRAC
0. 16E
0. 14E
•0. 12E
0. IOE
0. 80E
0. 60E
0. 40E
0. 20E
0. OOESl00 1000 1500 2000
PFAr:'Tni TIIE , 5ECONIS
SI Al I."Y I 'I"ESURES IN TRAC.11 1.11f)11 AND EXPERIMENT COMPARISON
31. PRIM1ARY AND '11

0t'j
TIHE FOLLOWING.ARE PLOTTED AGAINST REACTOR TIME
SIGNAL VAR. NO. 2,PE-PC-0021Winfrithl
KEYSYM NAME UNITSBOL
i-- SIGNAL VAR. NO. 2,LOC= O/ "0/ 1 HINEIIS 2 I[WI
- - PE-PC-002 , IvALOC- 771 D/ 0 tlNEfl.PRES JIU-2
0. 20E
0. 1BETRAC
0. 16EEXPT
0. 14E
0. 12E
0. iOE
0. 80E
0. 60E
0. 40E
0. 20E
0. OOE
20
18
16
14
12
10
8
6
4
2
0
0.
0 500 1000 1500 2000
REACTOR TIME , SECONDS
32 INTACT LOOP HOT LEG PRESSURELP-SB-2 - TRAC PF-l-MOOl AND EXPERIMENT COMPARISON

THE FOLLOVING ARE PLOTTED AGAINST REACTOR TIME
LIOUID TEMPERATURE ,TE-PC-0028WUlnfr ithI
t~j0
KEY
SN NAME UN4ITS
- LWtJID TEMP'ERATUR~E DOEG.KLOC- 99/ o/ 2 IINEtWTEL Ilfsl
TRAC
- - 7E-pc-0028 DOEG.KZLOC- 130/ 0/ 0 MNEII-TtICL INW.2 EXPT
--IJ0
0 500 1000 1500 2000 2500
REACTOR.TIME , SECONDS
3000
33 LIO TEMPERATURE IN THE HOT LEG OF THE INTACT LOOP.LP-SB-2 - TRAC PFI-Mt01 AND EXPERIMENT. COMPARISON

I.
0t0
TIII FOLLOIH1G ARE PLOTTEO AGAINST REACTOR TIME
FUNCION
KEY180 ---
w W w • w I I l
S" NAME UNITS8(m.
4I- FUNCTION.1601
-2-. FCTlON
-3-. FUNCTION
TRAC
140I
120[-
1Winfrithh
at HPIS location
1.75 m after HPIS
I001l
80[
4I
601
40
20
1.52 m before HPIS
0 200 400 600 80010001200140016001800200022002400260020003000
REACTOR TIMlE •, SECONDS
34 COLD LEG,-+PI.US++
TEM SAT - TEM LIOPLOII ING UTILITY SYSTEM AEEW

TIHE FOLLOWING ARE PLOTTED AGAINST REACTOR TI1E
CLADDING TEMP7 -FINE,TE-5HO7-050Winfrith-
t~JCt,3
KEYSYi. NAME UNITSBOL
C- LADOING TEMP -FINE,OEG.KLOC. 88/ I 6 MNEM=I'MCL IWF=I
-- TE-51107-058 , DEG. KLIE- 272/ 0/ 0 IiNEM-7MCL DINF2
TRAC
lEXPT
uJ0
500 1000 •1500 2000 2500 3000
REACTOR TIME SECONDS
35 CLADDING TEMPERATURE NEAR TOP OF THE CORELP-SB-2 - TRAC PFI-MOOI AND EXPERIMENT COMPARISON
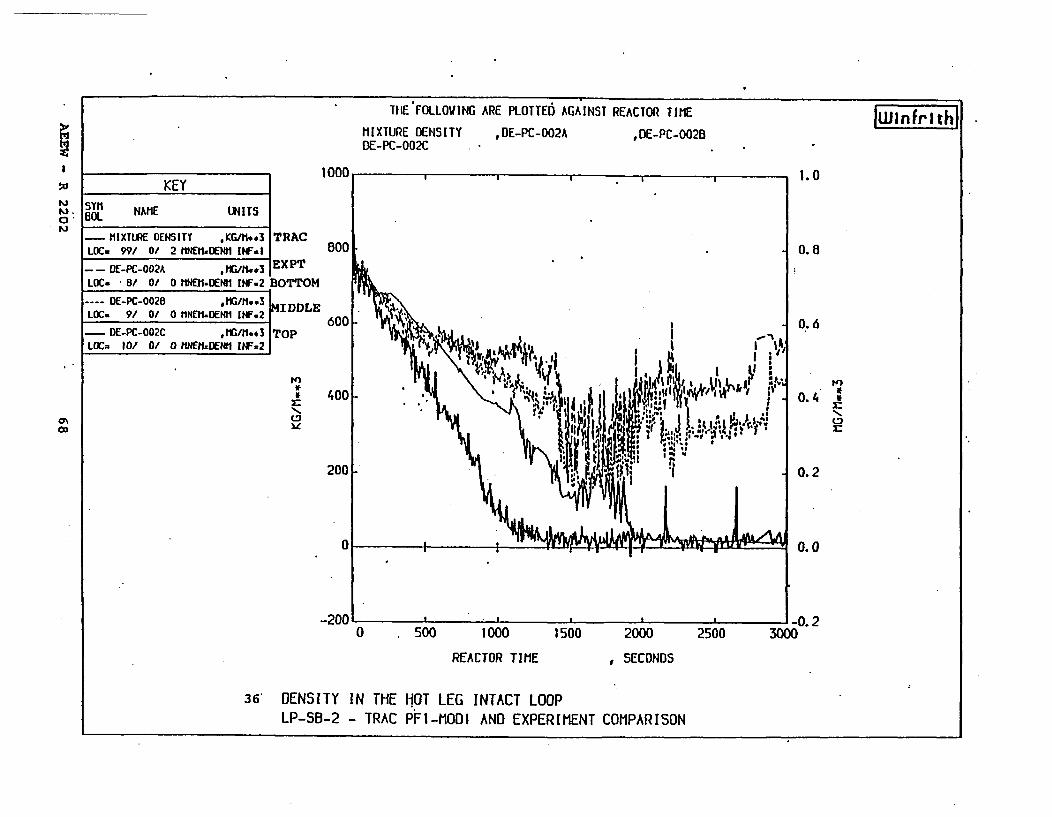
THIE 'FOLLOVING ARE PLOTTED AGAINST REACTOR TIME WInfrith
"3
0*"3
MIXTURE DENSITYDE-PC-002C
,DE-PC-002A ,DE-PC-0028
KEYBt0 NAME UNITS
- MIXTURE DENSITY ,KG/H**,3LOC- 99/ 0/ 2 MNEtl.DEN4 INsI
TRAC
I-..--- - DE-pc-002A , IL'11**3 1 i!KPL
LOC- -8/ 0/ 0 lINEM-OENfl INF=2 BOTTOM
--- E-PC-002B MfG/M-P*3 MIDLLOC. 91 0/ 0 IINEfl.ENMIINrFzrIDL
- DE-PC-002C , HG/11* s3 ITOPLOC= 10/ 0/ 0 flNEMlDENi1 UF=2
1.0
0.8
0..6
0.42::N,
0.2
0.0
0%
1-0.23000
REACTOR TIME , SECONDS
36' DENSITY IN THE HOT LEG INTACT LOOPLP-SB-2 - TRAC PFI-MODI AND EXPERIMENT COMPARISON

THE FOLLOVING ARE PLOTTED AGAINST REACTOR TIME
ti'
t'j
0
~0
MIXTURE DENSITYDE-PC-O0IC
,DE-PC-OO1A ,DE-PC-OOIBlWInfrlth'
IKEY
STh NAME UNITS
- MIXTURE DENSITY KGAio.3LOC= 7/ O/ 4 flNEM=O=ENt IRFzI
TRAC
4.-- BE-PC-OO IA 'mm*M/1i3LOC- 5/ 0/ 0 IINEM.OENM INF-2
---DE-PC-0018 MG/Mp341LOC- 6/ 0/ 0 t1NEM-OENMINFlf2
- DE-PC-OCIC MIG/I1ossLOC. 7/ Of 0 tiNEM=D4ENfl If.?
BOTTOM
MIDDLE
TOP
toV
tE)VV
2ZNC,r
REACTOR TIME , SECONDS
37 DENSITYLP-SB-2
IN THE- TRAC
COLD LEG OF THE INTACT LOOP.PFI-MOO AND EXPERIMENT COMPARISON

:0'Ui
-.4
lIIE FOLLOVING ARE PLOTTED AGAINST REACTOR TIME
MIXTURE DENSITY ,DE-PC-SO48fI
WInfr Ithl
KEYI
syi NAME UN4ITS80L
-MIXTURE DENSITY KiG/tt**3LOC.= 99/ 0/ 0 IINEH=)ENN INF:I
TRAC
ýXPT- - DE-PC-SO483 tlG/ti**3LOC- V/ 0/ 0 MNEM.0ENM1 IWf.2
1.0
0. 8
0.6
0.•4
(:3
0.2
0.0
-3
1-0.230000 .500 1000 1500 2000 2500
REACTOR TIME . SECONDS
38 DENSITY IN TIlELP-SB-2 -'TRAC
BREAK LINEPFI-MODI AND EXPERIMENT COMPARISON

:totu, THE FOLLOVING ARE PLOTTED AGAINST REACTOR TIME WInfritthl
gLOUI VELOCITY ,VAPOR VELOCITY ,FE-IST-O01
KEY5Th NAME UN ITS
- LIOUID VELOCIIT ,M/5ECLOC= B6/ Of 8 MINEMi=VLIO IlHFl
TRAC
--- VAPOR VELOCITY "/SECLOC- 86/ O/ 8 IttEH-WAP IF-I
-- FE-IST-O01LOC- 18/ o/ 0 lINE•-FE 1W.2-? EXPT
UILJ(nl
0 500 1000 1500 2000 2500 3000
REACTOR TIME , SECONDS
39 LID ANDLP-SB-2
VAP VELOCITY IN THE OOWNCOMER OF THE REACTOR VESSEL- TRAC PFI-MOOl AND EXPERIMENT COMPARISON

THE FOLLOVING ARE PLOTTED AGAINST REACIOR TIME
It')0
FUNCTION ,FE-SLP-001JUJ In fr th
10KEY
SY" NAME UNITSBOL
- FUNCTION VLIO [~n - ntI IflAL
--- FUNCTION VVAP
- - FE-SLP-001 *tt/SECLOC. 20/ 0/ 0 IINEtI.E INF.? EXPT
a
6
4 u
2
0
-J
I-230000 500 1000 1500 2000 2500
REACTOR TIME , SECONDS
40 LIO ANDLP-SB-2
VAP VELOCITY AT- TOAC PFI-MODI
CORE INLETAND EXPERIMENT COMPARISON

0
TllE FOLLOVING ARE PLOTTED AGAINST REACTOR TItlEPUJMP DEI.TA-P ,PDE-PC-001
lWinfr'ithil
KEYjuutuu
syi NAME U4IS 450000)
- PUMP DELTA-P NIH/,**2 TRACLO[= 4/ 0/ 1 INE'=0ELP WH=I 400000
--- POE-PC-O01 ,KPA 1EXP,'LOC. 65/ 0/ 0 HINEti.PO INF'2 350000
300000
250000
e 20W00)
z 150000
100000
50000
n
It-
S -- i
- 500
450
400
350
300
250
200
150
100
50
0
-50
--1005000
n~
-50000
-I06000
0 500 1000 1500 2000
REACTOR TIME , SECONDS
41 PRESSURE DIFFERENCE OVER THE MAIN COOLANT PUMPSLP-SB-2 - 1rPlM: PFI--MOlI AND EXPERIMENT COMPARISON
2500

ETHIE FOLLOWING ARE PLOTTED AGAINST REACTOR TIME1WInfr'ith
I~J0
sI~J
-a
FUNCTION ,FE-5UP-0O01
KEYSYtl NAME UNITSBOL
- FUNCTION VL.IO _
-- FUNCTION VVAP
-- FE-SUP-O01 I1/SECLOC- 22/ 0/ 0 KNEM-FE INF-2
rRAC
ýXPT
10
8
6
40in
2:
0
FI -230000 500 1000 1500 2000 2500
REACTOR TIME
42 LID ANDLP-SB-2
VAP VELOCITY AT CORE OUTLET- TRAC PFI-MOOD AND EXPERIMENT
, SECONDS
COMPARISON

0It,)
THE FOLLOVING ARE PLOTTED AGAINST REACTOR TIME
LIOUIO VELOCITYFE-PC-O02C
,VAPOR VELOCITY ,FE-PC-002A
KEY5TYi NAME UNITSBOL
1111110O VELOCITY , H/SEC1rv nnfI n, I~ j muCIf %n i u
""= 2' .. . ........ 'ITRAC--- VAPOR VELOCITY ti/SECLOC- 99/ 0/ 2 NNEI-VVAP NF-I
- - FE-PC-002A ,IM/SECLOC. 16/ 0/ 0 fiNEt.FE 1NF=2
FE-PC-002C MH/SECLOC= 1?/ 0/ 0 IIHEt=FE INF=21
-4Lu
U)
w:
0 500 1000 1500 2000 2500 3000
REACTOR TIME , SECONDS
43 LIO AND VAP VELOCITY I.N THE HOT LEGLP-SB-2 - TRAC PFI-MODI AND EXPERIMENT COMPARISON

THE FOLLOWING ARE PLOTTED AGAINST REACTOR TIME
LIOUID VELOCITY 1VAPOR VELOCITY ,FE-PC-OOICWinfri th]
M3 KEY
i• NAME UNITSaOL- LIOVID VELOCITY tI/S.CLOC= .7/ 0/ 4 MNEM=VLIO I1•=1
I
J I V• UL•f-r"nrv--- VAPOR VELOCITY ,tl/5EC
LOIC 71 0/ 4 IINEH-VVAP (W-I
A &I%
EXPT
I
I- -FE-PC-OOIC ,ti/SECLOC- 15/ 0/ 0 tlNfllFE IHF-2
ULucn1:)
--J
0 500 1000
REACTOR TIME
1500 2000
SECONDS
2500 3000
44 LID AND VAP VELOCITY IN THE COLD LEGLP-SB-2 - TRAC PFI-MODI AND EXPERIMENT COMPARISON

IIIDIH I IVEJOITLllIQUI VELOC!ITY
ARE PLOTTED AGAINST REACTOR TIME
,VAPOR VELOCITY ,FE-PC-S03
Iii
N)N)0N)
KEYSYM NAME UNITSBOL
-- LIUID VELOCITY ai/SECLOC= 99/ 0/ 8 MNEM=VLIU IF=I
I
I IDI R II•P"n ^A flfl1ý--- VAPOR VELOCITY ,MfISECLOC. 99/ O/ 8 tHEfWVVAP LtW.1
FE-PC-S03 *Il/sEC 1ILOC- I4/ 0/ 0 IINEti.FE IWf.2 JEXPT
uILJ
.'}
-,..
0 500 1000 1500 2000 2500 3000
REACTOR TIME , SECONDS
45 LID ANDIP--SB-2
VAP VELOCITY IN- TRAC PFI-lioni
THE BREAK LINEAND EXPERIMENT COMPARISON

o
I
Ii$t
*TiIL FOI.LOVINr ARE PLLOTTED AGAIN5T REACTOR TIME
M1ASS Fl.flJI RATE FT-PI39-27-I ,FT-P139-27-2UJI nfri th
!
0tj
KEYSYM NAMIE UNITS5BoL
- MASS FLOY PAlE KtG/SECLOC= 1/ 0/ 3 t1NEM=FLOV hMflF
- - FT-P139-27-1 KGISECLOC- 30/ O/ 0 fiNEM1FLOV INF-2
TRAC
EXPT--.FT-PI39-27-2 KG/6SEc
LOC- 31/ 0/ 0 MNEfl=FLOI 1WI.2
tCl
L3U1)
0,
2000
SECONDSREACTOR TIME
46 HOT LEGLP-SB-2
MA•S FLI.IOW •AII- AT VENTIJRI LOCATION- "RAC PFI-MODI. AND EXPERIMENT COMPARISON
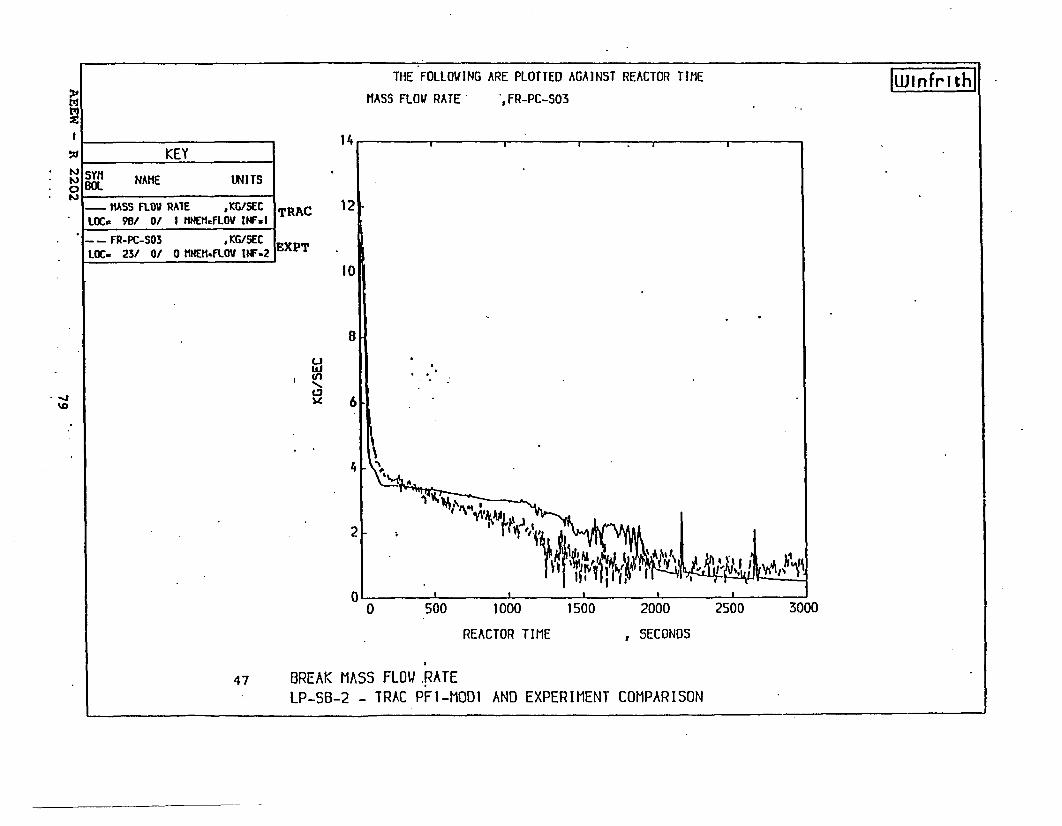
THE FOLLOVING ARE PLOTTED AGAINST REACTOR TIME IWInfrithlh
:0
MASS FLOV RATE ',FR-PC-S03
1KEY
fuM NAME U.N ITSU•,'.
I'l- BASS FLOV RAIE *KG/SECLOCs. 98/ 0/ 1 IINEI.FLOV IFFuI
- - FR-PC-S03 * KG/SECLOC. 23/ 0/ 0 tINEtI4FLOV HF-2
TRA'C
EXPT
1
10
uinL2',,.
0 500 1000 1500 2000 2500 3000
REACTOR TIME , SECONDS
47 BREAK MASS FLOW.RATELP-SB-2 - TRAC PFI-MODI AND EXPERIMENT COMPARISON

0
'S
THE FOLLOWING ARE PLOTTED AGAINST REACTOR TIME
RtOL BLK ID -81,FUNCTION1WInfrith
CONT
KEYSYM NAME UNITSBOL
- CONTROL BLK 10 -81,LOC= 0/ 0/ 1 I1NEIM=C-81 INFzt TRAC
-- FUNCTION k6XPT
0 500 1000 1500 2000 2500 3000
REACTOR TIME , SECONDS
48 TRANSIENT++PLUS++
MASS INVENTORYPLOTTING UTILITY SYSTEM AEEV I

THE FOLLOVING ARE PLOTTED AGAINST REACTOR TIME lWinfri thýMIXTURE DENSITY ,OE-PC-SO4B
1-4
KEYsyli NAME UNITSBOL
- I1IXML~ OENSITY IKG/fl..3 PRAcLOC- 95/ 0/ 4 IINEtI=DENII I[f.I
- - DE-PC-S0O8 gtlG/11*3 IXPLOC- 4/ 0/ 0 flREl-DERtI IWIf2 XP
1.0
0.8
0.6
0.4 *
0.2
0.0
-0.0230000 500 1000 1500 2000 2500
REACTOR TIME ., SECONDS
49 DENSITYLP-SB-2
IN THE BREAK LINE- TRAC.PFI-MODI AND EXPERIMENT COMPARISON

NNCN
THE FOLLOWING AR
MASS FLOW RATE
E PLOTTED AGAINST REACTOR TIhE Winfrith,FR-PC-S03
KEYI
syi NAME UN ITS001
-HtASS FLOV RAIE *KG/SECLOC= 98/ 0/ 1 tlNEti=FLOV IWnI
ITRAC
- - FR-PC-S03 , KG/SEC EXL:LOC- 23/ 0/ 0 ttl-FLOV INF-2
I
U
cn03
0 500 1000 1500 2000 2500 3000
REACTOR TIME , SECONDS
s0 BREAK MASS FLOW RATELP-SB-2 -TRAC PFI-MOOI AND EXPERIMENT COMPARISON

THE FOLLOVING ARE PLOTTED AGAINST REACTOR TIMECONTROL BLK I1 -81,FUNCTION
lWinfr Ith
I ,I
co)
KEY5Th NAME UN1TSBOt
-CONTROL OLIK 1D -81,LOC= 0/ 0/ 1 tiNEI1C-OI INF=I
[- - FUNCTION
TRAC
EXPT
6000
5500
5000
4500
4000
3500
3000
2500
2000
1500
1000
500
NN
NN
NN
N
I I I I I
ftI i -
0 500 1000
REACTOR TIME
1500 2000
, SECONDS
2500 3000
51 TRANSIENT MASS++PLUS++
INVENTORYPLOTTING UTILITY SYSTEM AEEW

0.
THt FOLLOVING ARE PLOTTED AGAINST REACTOR TIME
SIGNAL VAR. NO. 2,PE-PC-002Winfrith
KEY
5Th NAIIE LIN1801- SIGNAL VAR. NO3. 2,LOC= 0/ 0/ 1 HKNEHS 2I
-- PE-PC-002 HPA
LOC- 771 0/ 0 1INEM-PRES I1
0.20E
TS 0. 18E
w TRAC0.16E
W-2
0. 14E
0. 12E
0. 1OE
0. 80E
0. 60E
0. 40E
0. 20E
0. DOE
20
18
16
14
12
10
8
6
2
0
4:0.r
0 500 1000 1500
REACTOR TIME
52 INTACT LOOP HOT LEG PRESSURELP-SB-2 -" TRAC PFI-MOOl AND EXPERIMENT
2000
SECONDS
COMPARISON

1HE FOLLOWING ARE PLOTTED AGAINST REACTOR TIME lWI nfrithSIGNAL VAR. NO.
I~3g~30
0,Lfl
6, PE-SGS-001
KEYNAME UNITS
- SIGNAL VAR. NO. 6,LOC. 0/ 0/ 1 KlNEti=S 6 IWFuI
-- PE-SGS-001 tvILOC= 81/ 0/ 0 IlElH-PRES 1NF-2
7.0
6.5
6.0
5.50.
5.0
4.5
4.00 500 1000 1500 2000 2500 3000
REACTOR TIME SECONDS
COMPARISON53 SECONDARY SIDE
LP-SB-2 - TRACPRESSUREPF1-MOD1 AND EXPERIMENT

N)N)0~N)
THE FOLLOVING ARE PLOTTED AGAINST REACTOR TIME
LIOUID TEMPERATURE ,TE-PC-0028JWI n fr7lth
KEY
Sy" NAMIE UNITS
- iWoIn TWIERATLIRE *DEG.t:LOC. 99/ 0/ 2 tflN-EflTI IWf.I
- - 7E-PC-0020 cEo. KLOC- 130/ 0/ 0 IINEH.ThCL Iif-2
TRAC
EXPT
U
REACTOR TIME , SECONOS
54 LIO TEMPERATURE IN THE HOT LEG OF THE INTACT LOOPLP-SB-2 - TRAC PFI-MODI AND EXPERIMENT COMPARISON

THE FOLLOVING ARE PLOTTED AGAINST REACTOR TIME
CLADDING TEMP -FINE, TE-5H07-058Winfrith
0
co
K~EY
5yti NAM1E UNITSBOL
-CLAWJING TEM1P -FINE*OEG.KLJCs SO/ 1/ 5 IINEI=TCL Ilfal
- - TE-SHO?-058 *DEG. KLOC- 272/ 0/ 0 WEIMHf.hL 1WF.2
rRAC
EXPT
REACTOR TIME , SECONDS
55 CLADDING TEMPERATURE NEAR TOP OF THE CORELP-SB-2 - TRAC PFI-MODI AND EXPERIMENT COMPARISON
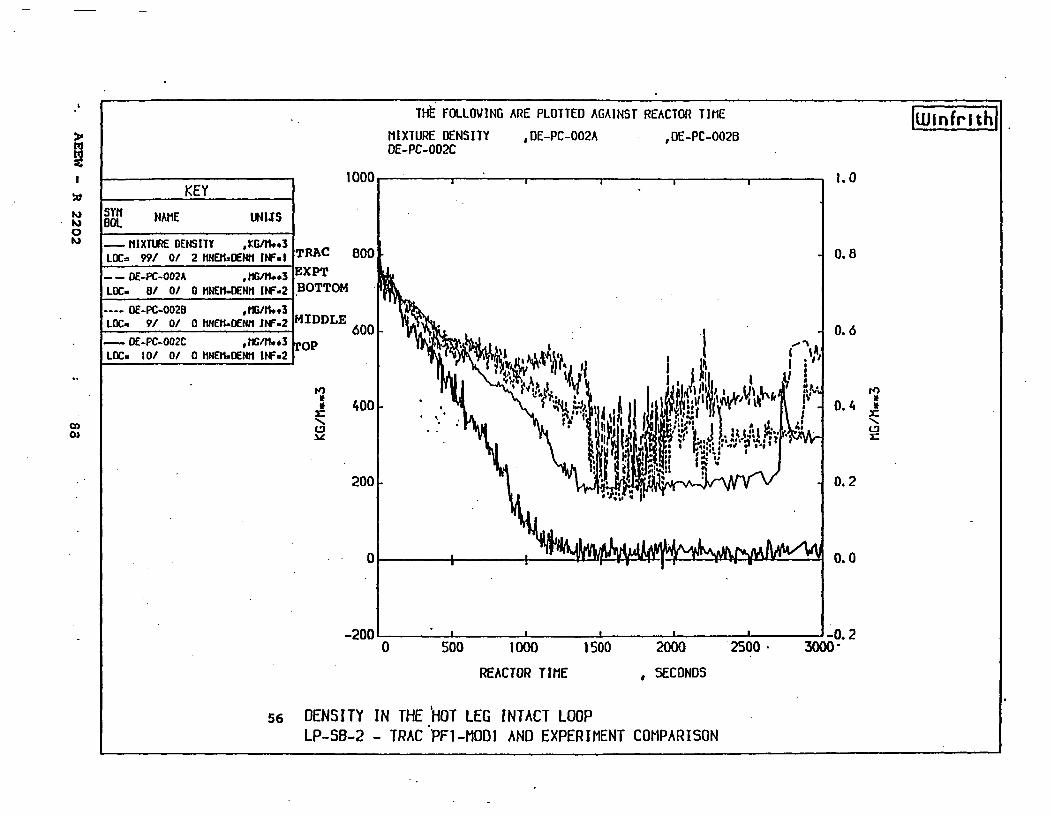
1HE FOLLOWING ARE PLOTTED AGAINST REACTOR TIME lWinfrith
tJ
0g~J
MIXTURE DENSITYDE-PC-002C
,DE-PC-002A ,DE-PC-OO2B
KEYSylh NAME UNIJS
-MIXTURE DENSITY *KG/H**3
LDC= 99/ 0/ 2 MNOfLsJERNf lIN~u
- - DE-PC-002A *11G/fl.3LOC- B/ 0/ 0 IINEM-DENM INF-2
DE-PC-0028 8 MG/M1..3LOC- 91 0/ 0 MHEtI-DENtII UF.2
- DE-PC-002C GM3LOCu 10/ 0/ 0 IINEM=DENM IIV.=2
TRAC
KXPTBOTTOM
4IDDLE
"Op
(3
1.0
0.8
0.6
t-0.4
A-N,
0.2
0.0
-0.2
CDol
REACTOR TIME , SECONDS
56 DENSITY IN THEI 'HOT LEG INTACT LOOPLP-SB-2 - TRAC PFI-MODI AND EXPERIMENT COMPARISON
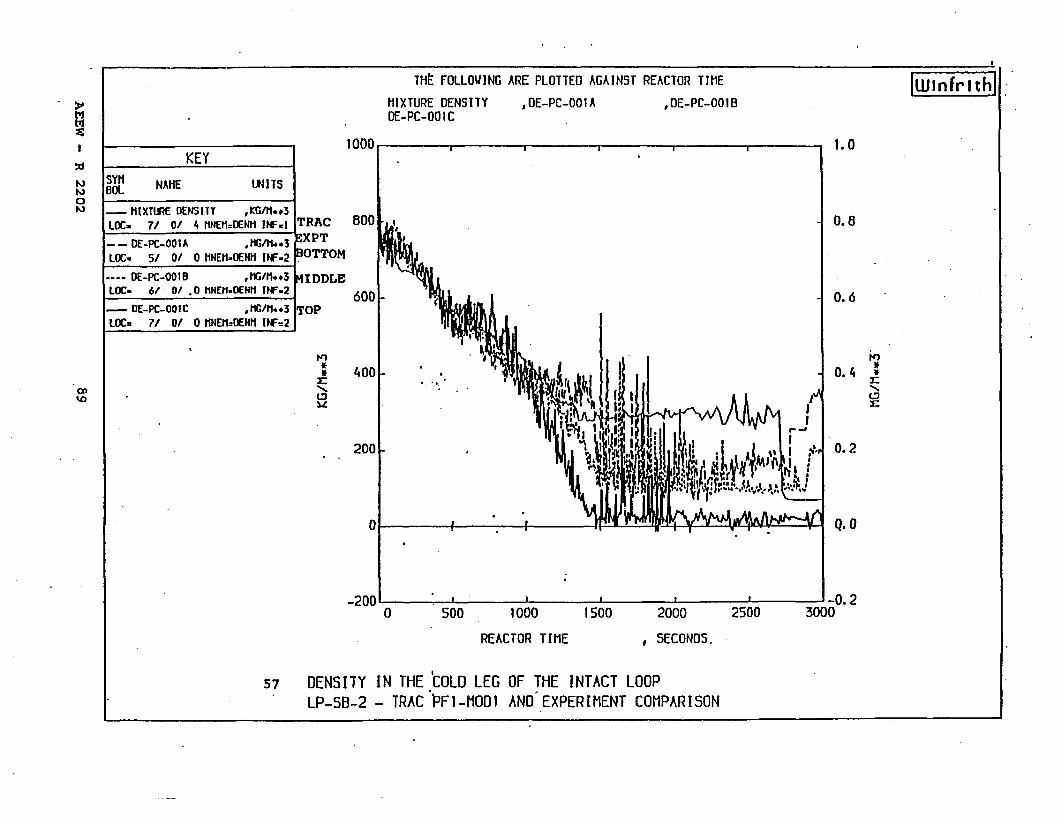
THt FOLLOWING ARE PLOTTED AGAINST REACTOR TIME WiInfr I th
tD
MIXTURE DENSITYDE-PC-O01C
,OE-PC-001A ,DE-PC-OO1B
KEYSYll NAME UNITS
- MIXTURE DENSITY ,KG/M**3LOC= 7/ 0/ 4 MNEM=OENI INFOI
I
TRAC
- - DE-PC-00IA tiIG/M**.3LOC- 5/ 0/ 0 tHNEfl-ENHI IF-2
---DE-PC-0I01 MlG/fl*#3LOC. 6/ 0/ .0 tiNEH.DENMII W-2
-DE-PC-0OIC tiIG/M*#3LOC- 7/ 0/ 0 IINEM-ENtI INF=2
Er AFTBOTTOM
MIDDLE
TOP
r-N,(39lz
1.0
0.8
0.6
0.4
0.2
Q. 0
1-0.230000 500 1000 1500 2000 2500
REACTOR TIME , SECONDS.
57 DENSITY IN THELP-SB-2 - TRAC
.COLD LEG OF THE INTACT LOOPPFI-MODI AND EXPERIMENT COMPARISON

rT-E FOLLOVING ARE PLOTTED AGAINST REACTOR TIME WI nf, I:,th
1%)0
LIQUID VELOCITY ,VAPOR VELOCITY ,FE-IST-O01
KEY
syl NAME UNITS
-LIOJID VELOCITY Mf/SEC10Cm 86/ Of 8 flNffVLIO IWat
10
am•L --- n.-
- - VAPOR VELOCITY tV1SECLOC- 86/ Of a im~ti-VVAP Iw-I- -FE-IST-00t I tt/SECLOCms I8/ Of 0 MMFIIE IPV.2
EXPT6
LuU)cn
4
%00i
2
0
Vi•.•
-20 500 1000 1500 2000 2500 3000
REACTOR TIME S SECONDS
58 LID AND VAP VELOCITY IN THE DOONCOMER OF THE REACTOR VESSELLP-SB-2 - TRAC PFI-MOOI AND EXPERIMENT COMPARISON

THE FOLLOVING ARE PLOTTED AGAINST REACTOR TIIE
VAPOR FRACTIONWunfr'I th
hihi0hi
~0
KEYSY" NAME UNITS
V- APOR FRACTIONLOC= B8/ 0/ 5 WHNEIVOIO ItFI TRAC
0 500 1000 15001 ")5"..00 3000.REACTOR TIME
59 VOID FRACTION TOP FUEL RZEGIONLP-SB-2 - IRAC PFI .J101J11
:-;1 I.I IIIIl"•

TiHt FOLLOWING ARE PLOTTED AGAINST REACTOR TIME 1WInfrith0
'0
FUNCT[ON ,FE-SLP-00I
KEYSYlI NAME tNITSBOL
- FUNCTION VLTO a
--- FUNCTION VVAP-------- I
--- FE-5LP-O01 M/SECLOC- 20/ 0/ 0 MNEM-FE INF-2
TRAC
EXPT
6
4uIii
2
.0
-20 500 1000 1500 2000 2500 3000
REACTOR TIME , SECONDS
60 LID ANDLP-SB-2
YAP VELOCITY AT CORE INLET- TRACPFI-MODI AND EXPERIMENT COMPARISON

TA-• FOLLOVING ARE PLOTTED AGAINST REACTOR TIME iU~nfrith
t.Jt~j0g~J
w
LIOUID VELOCITYFE-PC-002C
,VAPOR VELOCITY ,FE-PC-002A
KEYsyf NAME UNITSBOL
- LIOUIO VELOCITY "M/SECLOC- 99/ 0/ 2 liNEI'IVLIO IlFuI
I
I-- VAPOR VELOCITY #"l/SEC
LOC- 99/ O/ 2 HNE,,Wl.AP IE-I
TRAC
- - FE.-PC-002A ,ti/SECOCC. 16/ 0/ 0 fiNEII-FE INF.2
I..z•,v z,,z m
---FE.4'C-002C . ,fl/5ECLOCC 17/ 0/ 0 tINEII=FE IW.2
EArT
tLi
-210 500 1000 1500 2000 2500 3000
REACTOR TIME , SECONDS
61 LIO AND VAP VELOCITY INLP-SB-2 - TRAC'PFI-MODI
THE HOT LEGAND EXPERIMENT COMPARISON

I~Jt~)0
~0
THE FOLLOVING ARE PLOTTED AGAINST
PUMiP DELTA-P ,POE-PC-00i
REACTOR TIME- lwlnfr'i th
K~EYSml NAME UNITS801
- P"ti OELTA..P *NAIII.2LOCse 4/ 0/ 1 IIMWJEWLP IN~at
-POE4)C-00 I *KPAICC- 65/ 0/ 0 tINJ-PO [Wf.2
500000
450000
TRA'C4 J0 0O
EXPT350000
300000
250000
200000
z 150000
100000
50000
10
-50000
-100000
"I
I I I 500
450
400
350
300
250
200
150
100
E•on_
0.
.- -~ -- a. - -
a a II
I I 3
] -50~)000 500 1000
REACTOR TItlE
1500 2000
SECONDS
2500 3C
62 PRESSURE DIFFERENCE OVER THE MAIN COOLANT PUMPSLP-SB-2 - TRAC PFI-MOOI AND EXPERIMENT COMPARISON

THIE FOLLOVING ARE PLOTTED AGAINST REACTOR TIME WI nfr' ihR
t~J0
'aLfl
MASS FLOV RATE ,FT-P 139-27-1 FT-P139-27-2
KEYSYt NAME UNITSBOL
- MASS FLOV RATE K~G/5ECLLOC= I/ Of 3 tlNEtlFLOV I t rRAc
- - FT-PI39-27-1 .KG/SEC
LOC. 30/ 0/ 0 ItWEI1fLOV hr-? IXP- FT-PI39-27-2 KG6/SEC
LOC. 31/ 0f 0 ?iNE"MJLDV [W-2
0 500 1000 1500 2000 2500 3000
VRFACTOR TIME , SECONDS
63 HOT LEGLP-SB-2
MASS FLOW RAT1- AT VENTURI LOCATION- TRAC PFI-MOf)I AND EXPERIMENT COMPARISON

Tit FOLLOVING ARE PLOTTED AGAINST REACTOR TIME tWinfrithl
M
0
LIOUID VELOCITY ,VAPOR VELOCITY ,FE-PC-S03
IKEY
SYti NMlE UNIITS801.
-LIQUID VELOC ITY Hf/SECLOC- 95/ 0/ 4 JINEHaVL10 IWf=I
9"Ru
- - VAPO VELOCITY Mf/SECLOC- 9S1 0/ 4 tNEH-WAP INF.I
- - FE-PC-S03 tV1SECLOC- I'4/ 0/ 0 IlNfl-?E ItE.2
RXPT
U)
0 500 1000 1500 2000 2500 3000
REACTOR TIME , SECONDS
64 LIG AND VAP VECOCITY IN THE BREAK LINELP-SB-2 - TRAC'PFl-MOD1 AND-EXPERIMENT COMPARISON

EXPER I MENT LP-SB-2
.11
on
30 Z
10
0 Tooo 2000 3000Time (s•)
Al Measured and adjusted cold leg densities at the steamqenerator 6utlet. From Reference 4
AEFW- R 2202 97

80
80
40
20
a 0 0 0 L3-841% x LP-88-2I
6~
x
00.0 0.2. 0.4 0.8 0.8 1.0
Void fracion
A2 Pump head as a function of void fraction for ExperimentsLP-SB-2 and L3-6. From Reference 4
AEEW - R 2202 .-98

13L3-O
80 I..- U. ..3 :
2D~0.0 0.2 0.4 0.8 0.8 to
Void fraction
A3 Pump head as a function of void fraction obtained using theadjusted density at the steam generator outlet for ExperimnentLP-SB-2. From Reference 4
AEEW - . 2202 .99

THE FOLLOWING ARE PLOTTED AGAINST PUMP VOID FRACTION
FUNCTIONIWinfrrithl
N
1')I~.)0
00*
KEYSYn NAME UNIITSOPL, FUNCTION PUMP 2,
a I I
100
TRAC
80
A AAhAA
A
A
Af
A]
A FUNCTION PUMP 1 ,
60
40
6 A
A~~
A~ AA~ 0
AA
t
20
A' II | Iz It In
I ! II !
-20 -
1.00.0 0.2 0.4 0.6 0.
PUMP VOID FRACTION
A4 PUMP HEAD VS VOID FRACTION IN RUN A
+ PLOTTING UTILITY SYSTEM
8
++PLUS+• AEEW

THE FOLLOWING ARE PLOTTED AGAINST REACTOR TIME WInfrithlMIXTURE DENSITY ,DE-PC-0038
:toKEY
SYM NAME UNITSBOL
4- MIXTURE DENSITY ,KG/M,**3LOC- 3/ 0/ 7 INE=-OENHM IWF--
1.0
TRAC
--2-- DE-PC-003B *IE/t1..3 6XPTLOC- Il1/ 0/ 0 MNE?1.DENf INF-2
0.8
0.6
Fo,
:1
ro0.4
0.2
0.0
-0. 2
REACTOR TIME , SECONDS
A5 LOOP SEAL DENSITY IN RUN A
++PLUS++ PLOTTING UTILITY SYSTEM AEEW++PLUS+-i -PLOTTING UTILITY SYSTEM AEE~I
I

I .
! .:to'Si
0
"H.
THE FOLLOWING ARE PLOTTED AGAINST VOLUMETRIC FLOW RATE
PUMP DELTA-PWinfr-Ith-
KEYSYM NAME UNITSBOL0 PUMIP DELTA-P ,N/1**.2
LOC= 4/ 0/ 1 ItNEI---ELP IfW=l
A PUMP DELTA-P ,N/t1*.*2 Ti
LOC- 5/ 0/ 1 INtI..OELP IFW-I
500000
450000
A C0 0 0 0 0
350000
300000
250000N °
E- 200000z
150000
100000
50000
0-
-50000-0. I0
A6 p
++PLUS++
D I
&
£
A.
£
A# 500 sec
ý6
A AAtAI
90 0 se
" "" ."PUMP".
PUMP
A
1C
IA
4
-i p ;-t p p
I S
-0.05 0;00 0.05 0.10 0.15 0.20 0.25 0.30.
, VOLUMETRIC FLOW RATE , M**3/5EC
UMPS PRESSURE INCREASE VS VOLUMETRIC FLOW
PLOTTING UTILITY SYSTEM
0.35 0.40
RATE IN RUN A
AEEW

to
0
e
tTHE FOLLOVING ARE PLOTTED AGAINST REACTOR TIME
MASS FLOW RATEWllnfr'ith
I)t/.KEY
I
5YI NAME UNITSBOL
--- MASS FLOV RATE *KG/SECLOC= 4/ 0/ 1 tKM--FLOV NFaI
--- MASS FLOV RATE *KG/SECLOC- 5/ 0/ 1 HNEI-FLOV IW-I
eI 200 .
180
1601-
i
140-
ui 120
N )
" 10010w.
80
60
* K I\j*I I,UMPUMP 2
' ,
. .. t! .. . !pump 1 ',ii l
I 'I
40
20
IIII
1)1----44,j ,,1% I5~ I* - I I I ". Vy 1 -- I I I I I-
-20 1 1 1 1 , , , 1 - 1 1 1 1 10 200 400 600 80010001200140016001800200022002400260028003000
REACTOR TIME , SECONDS
A7 PUMPS MASS FLOW RATE IN RUN A
++PLUS++ PLOTTING UTILITY. SYSTEIM AEEW
+--PLUS++ PLOTTING UTILITY. SYSTEM AEE1~

EXPER I MENT LP-SB-233o
B" 250
200
150
100500 1000 1500
Time (s)
A8 Primary coolant pump power.From Reference 4
2000
AEEW - R 2202 104

THE FOLLOVING ARE PLOTTED AGAINST REACTOR TIME
PLUiP TORQUEIwinfrlth
iI~3I~30
I-.OiIn
KEYSYII NAMIE UNITSBOL
--- PU"P TOROUIE KG* V**;LOC= V1 0/ 1 MNEH=TORO IWF=I
"|" 14F Aft ", npkký
- - PUMIP TOROUE *KG* V..;LOC. 5/ 0/ 1 WIEII-JORO IFW-I
c'J
1000 1500 2000
REACTOR TIME , SECONDS
A9 PUMPS TORQUES IN RUN B
++PLUS++ PLOTTING UTILITY SYSTEM AEEW
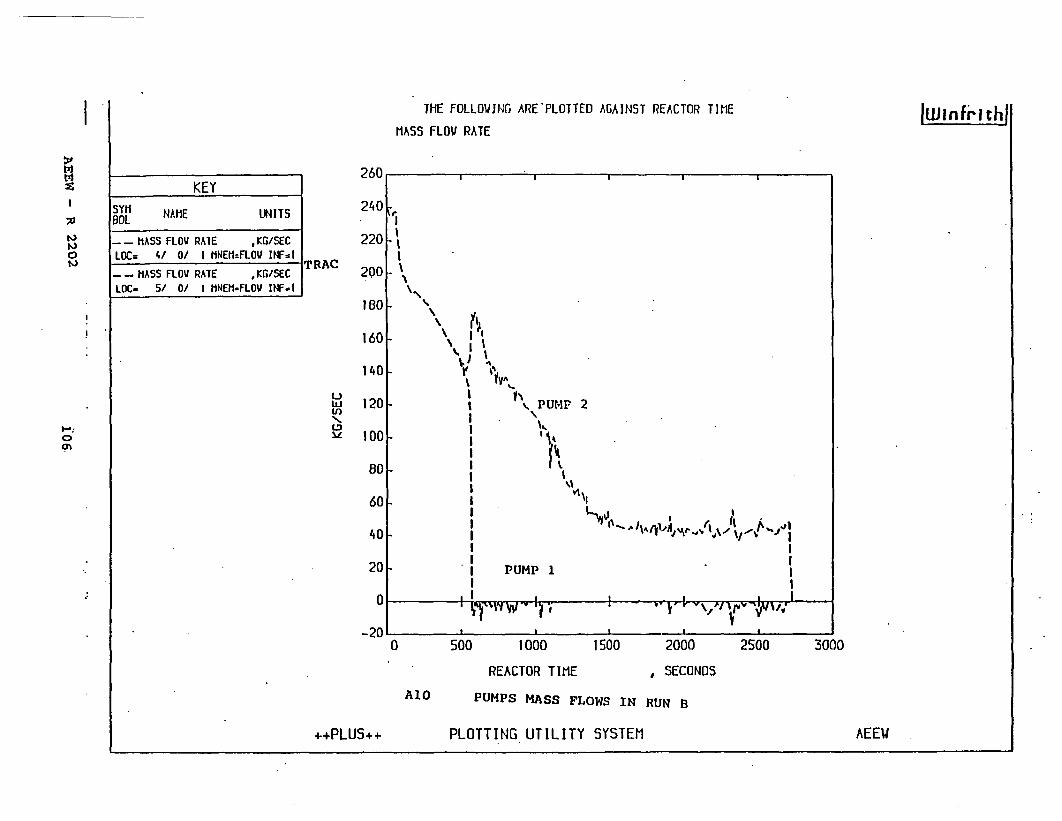
I THE FOLLOW1NG ARE'PLOTTED AGAIN5T REACTOR TIME
MASS FLOV RATEiWin fri thl
0,.
0,.
KEY
MAS- LO RATE K~G/SEC1LOC= 4/ 0/ MNEfl=FLOV W
rrl IQP A Ir•
- - MASS FLOV RATE ,KG/SECLOC- 5/ 0/ 1 MNEM-FLOV IW-I
260
240
220
200
180
160
140
120
100
80
60
40
20
1%
I
~E.
'I
I
uLJwD(n
'I,
', PUMP 2
*l PUMP I
I \
-I --
-201rrW -7 - \x• 'i-I " *t
, I I m i I I
0 500 1000 1500
REACTOR TIME
AlO PUMPS MASS FLOWS IN
PLOTTING UTILITY SYSTEM
2000
, SECONDS
RUN B
2500 3000
++PLUS++ kEEW&++PLUS+-i -AEEII

:tot%)
0
THE FOLLOVING ARE PLOTTED AGAINST TIMlE
DE-PC-OO2A ,DE-PC-002B rir ic..f(lfpcDE-PC-S04B
WInfrithi
KEY
8OL NAME UNITS1-.--
- - DE-PC-0O2A ,'MG/M.,3 rýA-"iLC'=. 8/ 0/ 0 HNEM=IDEM INF=2 BOTTOM 0. 8
---- DE-FPC - 002B MG/M o*3 -I D D L ELOC= 9/ 0/ 0 MINEM-JENM If.F2 I--- DE-PC-002C ,fIG/M.3 .yOpLOC- W/ 0/ 0 0.EM6DENM INF2 1
DE-PC-SO4B ... .. t' I Ij " '. * . .4 $ F . .. , 6
LOC= 4/ O/ 0 HNEm=DE0N"I INF=2
t".* 0.4
0.2
0.0
-0.2-5
Bi
++PLUS++
0 0 500 1000 1500 2000 2500 3000
TIMlE , SECONDS
EXPERIMENTAL HOT LEG DENSITY AND BREAK LINE
PLOTTING UTILITY SYSTEM
4000
!
!
DENSITY
AEEV

jiHil*3 2 -i
ORIGINAL CONFIGURATION RUN A
cvi
Special iEin 92zonly junction A
( FR IC I.E 2 0) .I
Quality ControlValve
Quality Monitoredhere
Special Winfrithstratified offtakemode-l-at this junction
QUALITY CONTROLLINGCONFIGURATION RUN B
B2 NODING MODIFICATIONS IN THE BREAK LINE
AEEW - R 2202 io8

,ruAL.
x PrT
vdtJ Pottiou STEM
B3 OUALITY CONTROL VALVE CONTROL LOGIC
AEEW - R 2202 109

THE FOLLOVING ARE PLOTTED AGAINST VAPOR FRACTION
FUNCTION!
...
i
tp,
t~)
0
KEYSYl0Ol NAME UNITS
" FUNCTION
" FUNCTION
A FUNCTION
TRAC
1WInfrith
Transitional Regiorto fully stratifiecflow
0.9
O-
VAPOR FRACTION
cl TRAC FLOW REGIME MAP FOR LOFT LP-SB-2 HOT LEG CONDITIONS RUN 1

'.31%)0NJ
I-.I-.
"IIIE FOIIJING ARE PLOTTED AGAINST VAPOR FRACTIONREACTOR TIME
lWinfrith
KEYSYt NAME UNITSBOL
-4- REACTOR TIME ,SECONOSLUCx 99/ 0/ 2 HlNEtH=TIlKE INFzt TRAC
cn03z03
C-)'II(I)
0.9
VAPOR FRACTION
C2 TIME VS HOT LEG VOID FRACTION IN RUN B

TABLES
AEEW - R 2202 112

TABLE 1
INITIAL CONDITION'FOR EXPERIMENT LP.-SB-2 - RUN A
Parameter
Core AT
Hot leg press
Cold leg temp
Mass flow rate
Power level
TRAC
19.1
15.11
558.2
480.0
49.1
Plant
18.6 + 1.7 OK
14.95 + 0.11 MPa
557.2 + 1.5 *K
480.0 + 3.2 kg/sec
49.1 + 1.2 Mw
3.13 + 0.01 m
5.60 + 0.09 MPa
26.7 + 0.8 Kg
Steam Generator Secondary Side
Liquid level 3.13
Pressure 5.60
Steam mass flow 25.8
Pressurizer
Liquid volume
Water temp
Pressure
0.6462
615.3
15.09
0.6462 + 0.002 m3
615.8 + 8.2 *K
15.08 + 0.16 MPa
AEEW - R 2202 113
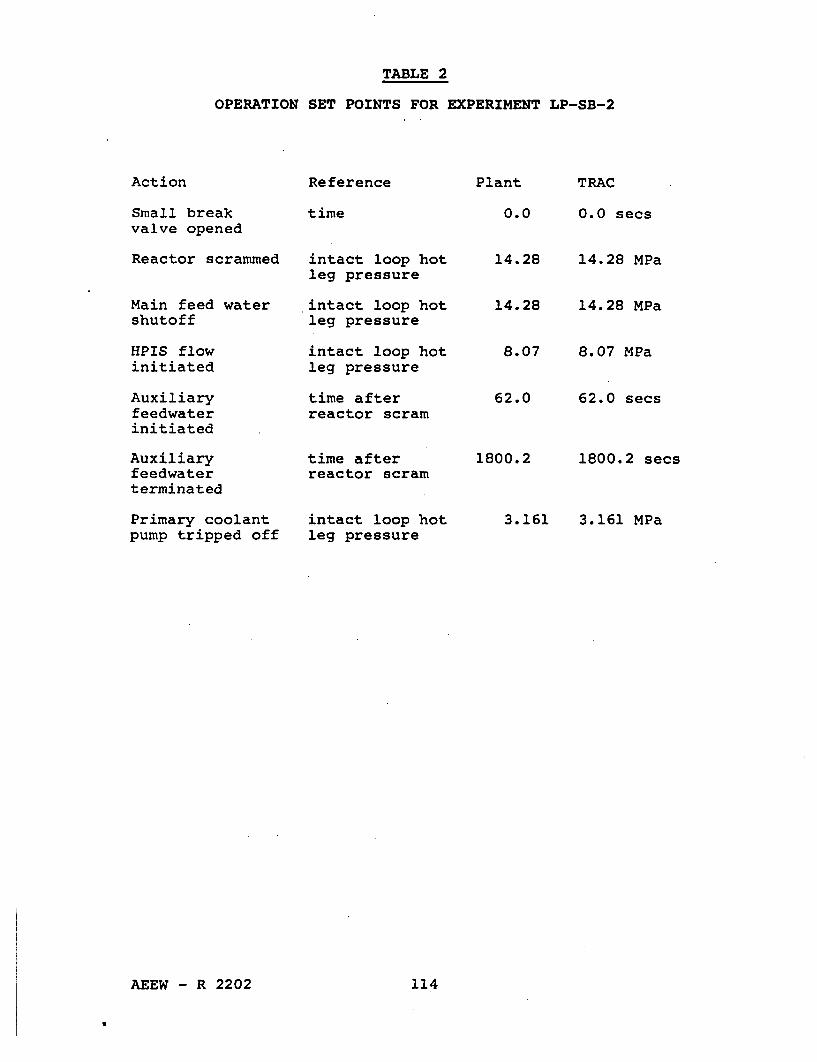
TABLE 2
OPERATION SET POINTS FOR EXPERIMENT LP-SB-2
Action Reference Plant TRAC
Small breakvalve opened
time 0.0 0.0 secs
Reactor scrammed
Main feed watershutoff
HPIS flowinitiated
Auxiliaryfeedwaterinitiated
Auxiliaryfeedwaterterminated
Primary coolantpump tripped off
intact loop hotleg pressure
intact loop hotleg pressure
intact loop hotleg pressure
time afterreactor scram
time afterreactor scram
intact loop hotleg pressure
14.28 14.28 MPa
14.28
8.07
62.0
1800.2
14.28 MPa
8.07 MPa
62.0 secs
1800.2 secs
3.161 3.161 MPa
AEEW - R 2202 114

TABLE 3
CERONOLOGY OF EVENTS FOR EXPERIMENT LP-SB-2 - RUN A
time after initiation
PLANTEVENT
Small break valve openedReactor scrammedMain feedwater shutoffMain steam control valvestarted to close.Main feedwater isolatedMain steam control valvefully closedHPIS initiatedSubcooled blowdown endedAuxiliary feedwaterinitiatedPump two phase degradationIndications of stratified flowin the hot leg.Collapsed level reaches breaklevelBreak started to uncoverPrimary system pressurebecame less than secondarysystem pressureAuxiliary feedwater shutoffInlet flow exceeded outlet flowPrimary coolant pumps tripped(3.16 MPa in primary system)
0.01.8 ± 0.051.8 ± 0.22.8 ± 0.2
4.30 ± 0.0514.8 ± 0.2
42.4 t 0.250.2 ± 163.8
582.2 ± 0.2- 600.
- 1000. Wd)
1192.5 ± 2.5
1290.0 ± 45
1864.0 ± 0.22284.0 ± 200.2852.8 ± 0.2
(seconds)
TRAC
0.02.312.313.4
4.1480. (a)
41.353.3 (b)64.3
590.0 (c)1200.0
804.0
- 1920.
1307.
1864.2059.2635.
a) In the TRAC input deck the main steam control valve assumed thefunction of the steam bypass control valve. Thus it kept onmoving up to 80 seconds when it was latched closed.
b) That value is such that 100 TSAT - = 0.1
TSAT
c) A smooth rather than'a sharp degradation was obtained
d) From Reference 9
AEEW - R 2202 115
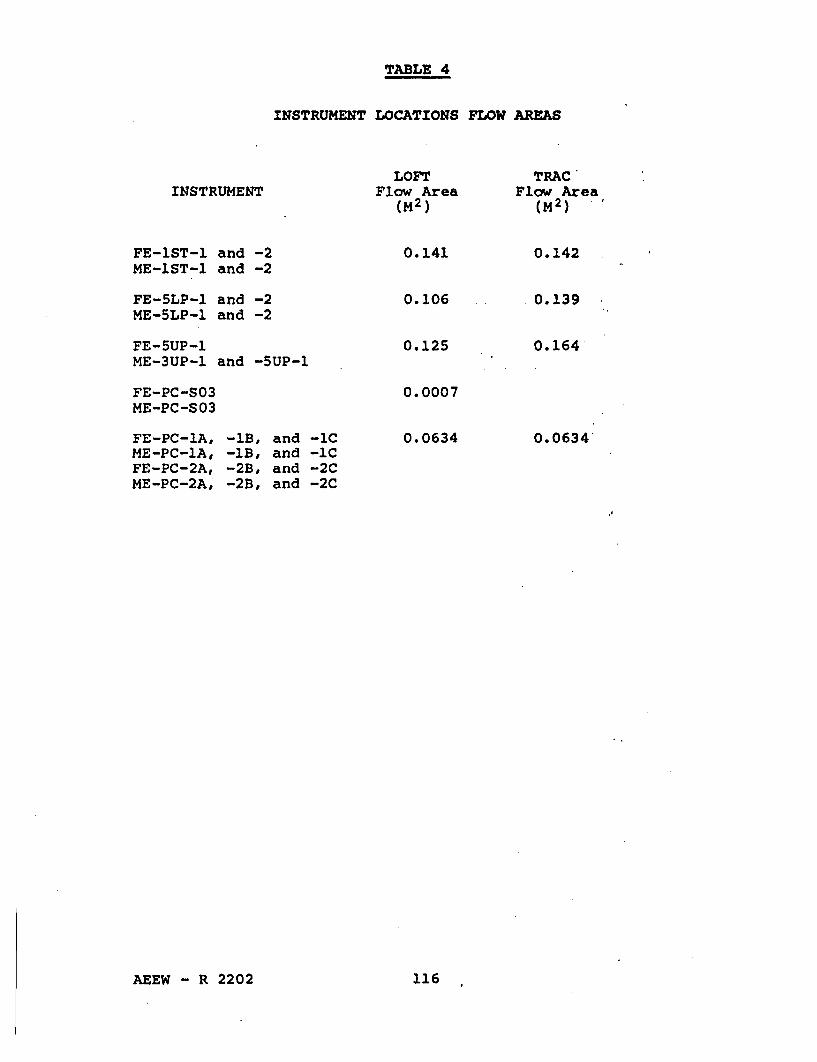
TABLE 4
INSTRUMENT LOCATIONS FLOW AREAS
INSTRUMENTLOFT
Flow Area(M2 )
TRAC'Flow Area
(M2 )
FE-lST-l and -2ME-lST-l and -2
FE-5LP-1 and -2ME-5LP-1 and -2
FE-5UP-iME-3UP-1 and -5UP-1
FE-PC-S03ME-PC-S03
FE-PC-lA, -1B, and -ICME-PC-IA, -1B, and -ICFE-PC-2A, -2B, and -2CME-PC-2A, -2B, and -2C
0.141
0.106
0.125
0.0007
0.0634
0.142
0.139
0.164
0.0634
AEEW - R 2202 116

TABLE 5
INITIAL CONDITIONS FOR EXPERIMENT LP-SB-2 RUN B
PARAMETER
Core AT
Hot"Leg Pressure
Cold Leg Temperature
Mass Flow Rate
Power Level
TRAC
19.1
15.11
558.1
480.0
49.1
PLANT
18.6 ± 1.70K
14.95 + 0.11 MPa
557.2 ± 1.5"K
480.0 ± 3.2 kg/s
49.1 Mw
3.13 ± 0.01 m
5.60 ± 0.05 MPa
26.7 ± 0.8 kg/s
Steam Generator Secondary Side
Liquid Level 3.13
Pressure 5.60
Steam-Mass Flow 25.8
Pressurizer
Liquid Volume
Water Temperature
Pressure
0.6462
615.3
15.09
0.6462 ± 0.0002 m3
615.8 ± 8.2*K
15.08 ± 0.16 MPa
AEEW - R 2202 117

TABLE 6
CHRONOLOGY OF EVENTS FOR EXPERIMENT LP-SB-2 RUN B
EVENT PLANT TRAC
Small Break Valve openedReactor scrammedMain Feedwater shutoffMain Steam control valve
started to closeMain feedwater isolatedMain steam control valve
fully closedHPIS initiatedSubcooled blowdown endedAuxiliary feedwater
initiatedPumps two-phase
degradationIndicators of
stratified flow in hotleg
Stratified flow fullydeveloped
Break started to uncoverPrimary system pressure
became less thansecondary system pressure
Auxiliary feedwater shutoffInlet flow exceeded outlet
flowPrimary coolant pumps
tripped (3.16 MPain primary system)
0.01.8 ± 0.051.8 ± 0.22.8 ± 0.2
4.3 ± 0.0514.8 ± 0.2
42.4 ± 0.250.2 ± 163.8
582.2 ± 0.2
- 600
- 1200
1192.5 ± 2.51290.0 ± 4.5
1864.0 ± 0.2
2284 ± 200
2852.8 ± 0.2
0.01.931.932.92
3.780 (a)
54.5170 (b)69.3
522
- 700
- 1150
1175 (c)1175
1864
1783
2706
(a) In the TRAC input deck the main steam control valveassumed the function of the steam bypass control valve.Thus it kept on moving up to 80 seconds when it waslatched closed.
(b) That value isTSAT - T1
such that 100 = 0.1TSAT
(c) Sudden change in depressurisation rate.
AEEW - R 2202 118

TABLE A.1
PUMP HEAD MULTIPLIERS RUN A
a
0.00.150.21250.30.330.40.51250.58250.7120.81250.91250.96251.0
M( a)
0.00.140.2020.3460.5190.7120.7020.7690.7690.7310.5580.250.0
The characteristic curves were those implemented in TRAC forLOFT with the exception of the first quadrant of the fullydegraded curve that was made equal to zero.
AEEW - R 2202 119

TABLE A.2
PUMP HEAD MULTIPLIERS RUN B
PUMP 1
a
0.00.150.21250.30.340.350.51250.58250.7120.81250.91250.96251.0
M(a)
0.00.140.2020.3460.5190.90.90.90.90.90.5580.250.0
PUMP 2
.a
0.00.150.21250.30.340.350.51250.58750.7120.81250.91250.96251.0
M(a)
.0.00.140.2020.3460.5190.7120.7390.7690.7690. 7310.5580.250.0
The characteristic curves were those implemented in TRAC forLOFT with the exception of the first quadrant of the fullydegraded curve that was made equal to zero.
AEEW - R 2202 120

TABLE B.1
DESIRED BRANCH QUALITY VS VOID FRACTIONIN THE HOT LEG
a x
0.0 0.00.0115 0.00480.0676 0.01130.1221 0.01940.1943 0.02750.2654 0.03780.2799 0.05080.3084 0.06380.3524 0.06390.4 0.06800.43 0.07500.45 0.080.47 0.090.48 0.10400.666 0.150.75 0.9
AEEW - R 2202 121

t.
S.M.A.R.T. SYSTEM MIMIC FOR ANALYSIS OF REACTOR TRANSIENTS
TITLE OF FRAME,- LOFT SB-2 (RUN B) CORRELATED BREAK LINE QUALITY Ti 0.0yLo[a -- 4( 10.00)
VVAP -4
( 10.00)
K3
0j
C)d
VOID FRACrWN
0..... . ..
I II
I

t9S.M.A.R.T. SYSTEM MIMIC FOR ANALYSIS OF REACTOR TRANSIENTS
TITLE OF FRAMEo- LOFT SB-2 (RUN 8) CORRELATED BREAK LINE QUALITY Ti 52.3
( 10.00)
VVAP
1 10.00)t~30
N)CAJ
VOIO FRACTION
I II U-
I

S.M.A.R.T. SYSTEM MIMIC FOR ANALYSIS OF REACTOR TRANSIENTS
TITLE OF FRAME,- LOFT SB-2 (RUN B) CORRELATED BREAK LiNE QUAL[TY
I
Ti 150. 7V.Io a--t( 10.00)
0VAP 0-+
(10. 00)t'3c.3
VOlO FRACTION
I II
I

t21ti'
"a0"a
"3Lfl
S., 1.A.R.T. SYSTEM MIMIC FOR ANALYSIS OF REACTOR TRANSIENTS
TITLE OF FRAMEs- LOFT SB-2 (RUN B) CORRELATED BREAK LINE QUALITY Ti 250.7VLIO -- +( 10.00)
VVAP--+
(10.00)
VOID FRACTION
0.889
a. 7? . S•,i•!.•
I 1 11 1U

S.M.A.R.T. SYSTEMlMIMIC FOR ANALYSIS OF REACTOR TRANSIENTS
TITLE OF FRAMEs- LOFT SB-2 (RUN B) CORRELATED BREAK LINE QUALITY
I
T i 350. 7VLIO ----4( 10.00)
vvip LN)0N)
I-.N)a.'
VOID fRActl0N
a. 889,
I I rI II

t.3
toJ
S.M.A.R.T. SYSTEM MIMIC FOR ANALYSIS OF REACTOR TRANSIENTS
TITLE OF FRAME,- LOFT SB-2 (RUN 0) CORRELATED BREAK LINE OUALITY Ti 451.0viLIO -4( 10.00)
VVAP -
( 10.00)
vOIo FRACTION
0 .. 889.
• . 0,... 667.

S.M.A.R.T. SYSTEM MIMIC FOR ANALYSIS OF REACTOR TRANSIENTS
TITLE OF FRAMEs- LOFT SB-2 (RUN B) CORRELATED BREAK LINE QUALITY
I0
0
Ti 551.7V1.. 10 ---
1 10.00)
VVAP-
( 10.00)
voto FRACTrON
.00.889.
.c 0.667

t.J
S.M.A.R.T. SYSTEM MIMIC FOR ANALYSIS OF REACTOR TRANSIENTS
TITLE OF FRAMEr- LOFT SB-2 (RUN B) CORRELATED BREAK LINE QUALITY T i 652. 1VLIOa -4ý( 10.00)
VWAP .-
(10.00)
VOID FRACTION
. u 0... 8. . .
..... ..

S.M.A.R.T. SYSTEM MIMIC FOR ANALYSIS OF REACTOR TRANSIENTS
TITLE OF FRAME,- LOFT SB-2 (RUN B) CORRELATED BREAK LINE QUALITY
t~)I~'J0
I-'~AJ
0
Ti 752. 8VLI -- 4
10.00)
'VAP
(10.001
VOID FRACTION
~~0. 889-
~. O..... ..

0
I-.L.JI-.
S.M.A.R.T. SYSTEM MIMIC FOR ANALYSIS OF REACTOR TRANSIENTS
TITLE OF FRAME,- LOFT SB-2 (RUN B) CORRELATED BREAK LINE QUALITY TI 860.8VL I -- +( 10.00)
VVAP --
10.00)
VOID FRACTION
0. 088...
€=.. oa?67
:< " . 667.• .. +:

S.M.A.R.T. SYSTEM M[IIC FOR ANALYSIS OF REACTOR TRANSIENTStT~j : * TITLE OF FRAME.- LOFT SB-2 (RUN B) CORRELATED BREAK LINE QUALITY
I'.
0
(Ai
Ti 961.7VLI a -fý
1 10.00)
YAP -- +
( 10.001
VOID FRACTION
• m 0.889..
0. 6..
ml~

tzj
IC%)
W-
WA
S.M.A.R.T. SYSTEM MIMIC FOR ANALYSIS OF REACTOR TRANSIENTS
TITLE OF FRAME,- LOFT SB-2 (RUN B)'CORRELATED BREAK LINE QUALITY Ti 1063.2VLO -I -( 10.00)
( 10.00)
vOID FRArION
0<o O. 889.':'.ii. 0 i 778:.
i a 0 66"7'.

tJh
S.M.A.R.T. SYSTEM MIMIC FOR ANALYSIS OF REACTOR TRANSIENTS
TITLE OF FRAMEs- LOFT SB-2 (RUN B) CORRELATED BREAK LINE QUALITY Ti 1164.4V Io -- +
I0. 00)
VVAPI 0
( 10.00)
voiD rR~crio
.. 0. 8.. -
:.::.. ..•.; :.. :...
W A.' •0

S.M.A.R.T. SYSTEM MIMIC FOR ANALYSIS OF REACTOR TRANSIENTS
TITLE OF FRAMEt- LOFT SB-2 (RUN B) CORRELATED BREAK LINE QUALITY
I')0t'3
UJ(I,
Ti 1265.3VLI[a --( 10.00)
VVAP, --1 10.00)
VOID FRACTION
..... .. . . ...• ,,.a -•!
,• 66... t.
H
U-4maLu

tb3K0
C:)
S.M.A.R.T. SYSTEM MIMIC FOR ANALYSIS OF REACTOR TRANSIENTS
TITLE OF FRAMEs- LOFT SB-2 (RUN B) CORRELATED BREAK LINE QUALITY T I 1.366. 6VLIOa .- 4)( 10.00)
VVAP --10.001
VOID FRACTION
"-.0, 889..
<.= 0:" "778-
i.!.{i-. 0 ::.66?•

S.M.A.R.T. SYSTEM MIMIC FOR ANALYSIS OF REACTOR TRANSIENTS
TITLE OF FRAME,- LOFT SB-2 (RUN B) CORRELATED BREAK LINE QUALITY
t.J0
I-,CAJ-J
Ti 1467.8vLt Q ---( 10.00)
VVAP -4
( 10.00)
VOID FRACTION
0., o889
S0. 778'

0>K)3
co-
S.M.A.R.T. SYSTEM MIMIC FOR ANALYSIS OF REACTOR TRANSIENTS
TITLE OF FRAME,- LOFT SB-2 (RUN B) CORRELATED BREAK LINE QUALITY Ti 1562.2VLIO -
(10.00)
VVAP -
10.00)
votD FRAcrio
<. 0..889.
.0. 778

t~1
I-
PC.
S.M.A.R.T. SYSTEM MIMIC FOR ANALYSIS OF REACTOR TRANSIENTS
TITLE OF FRAME#- LOFT SB-2 (RUN B) CORRELATED BREAK LINE QUALITY Ti 1662.3VL 10
C10.,00)
VVAP
( I0• 00)
0. 0889
(a 0 'O556.

S.M.A.R.T. SYSTEM MIMIC FOR ANALYSIS OF REACTOR TRANSIENTS
TITLE OF FRAMEt- LOFT SB-2 (RUN B) CORRELATED BREAK LINE QUALITY
0
r0.
Ti 1863.9VLI -- 4( 10.00)
VVAP -f1 10.00) -
VOID RA~CrzON
'.0. 889
.0779.
IU.-

S.11. A. R.T. SYSTEM MIMIC FOR ANALYSIS OF REACTOR TRANSIENTS
TITLE OF FRAMEIe- LOFT SO-2 (RUN 8) CORRELATEO BREAK LINE QUALITY
tJ0t'3
I-.
I.-.
Ti 2060.4
VLI -bi+( 10.00
(10. 001
VOIO fwDL•om
I 77

S.M.A.R.T. SYSTEM MIMIC FOR ANALYSIS OF REACTOR TRANSIENTS
TITLE OF FRAMEs- LOFT SB-2 (RUN B) CORRELATED BREAK LINE OUALITY
0
Ti 2261.4VL I a -
( 10.00)
VYAP
(10.00)
VOID FRACTION
.4,
I
i+

S. M.A.R. T- SYSTEM MIMIC FOR ANALYSIS OF REACTOR TRANSIENTS
TITLE OF FRAMEs- LOFT SB-2 (RUN B) CORRELATED BREAK LINE QUALITY
:z1NN0N
Ti 2462.7VLIO -- +(10.00)
WAP-+( 10.001
veoI FNDWTION

S.M.A.R.T. SYSTEM MIMIC FOR ANALYSIS OF REACTOR TRANSIENTS
TITLE OF FRAMEs- LOFT SB-2 (RUN B) CORRELATED BREAK LINE QUALITY
I~J0z~J
'-a
.i~.
T i 2663. 7
( 10.00)VWAP
10.00)
VOID FRlACtIO
HI

S.M.A.R.T. SYSTEM MIMIC FOR ANALYSIS OF REACTOR TRANSIENTS
I" TITLE OF FRAME,- LOFT SB-2 (RUN B) CORRELATED BREAK LINE QUALITY
I-
bi
T i 2764. 2.VLII --
10.00)
VIAP 0-+
( 10.00)
VOID FRACTION

I:Ptri
to)C.)
K3I
01t
S.M.A.R.T. SYSTEM MIMIC FOR ANALYSIS OF REACTOR TRANSIENTS
TITLE OF FRAME,- LOFT SB-2 (RUN B) CORRELATED BREAK LINE QUALITY Ti 2864. 5
(1 0.00)
VVAP
(1 0.00)
VOID r~Acrrw~
~. 0.889
~c- 0.718
1'
'a &66T

t:I
S.M.A.R.T. SYSTEM MIMIC FOR ANALYSIS OF REACTOR TRANSIENTS
TITLE OF FRAMEs- LOFT SB-2 (RUN 8) CORRELATED BREAK L[NE QUAL[TY T i 3085. 3
( 10.00)
VVAP
1 I0.00)
"3"30."3
I-.
-J
VOID FRACTION

APPENDIX A
RUN B SNAPSHOTS AT SELECTED TIMES
A set of 26 snapshots describing the evolution of liquid andsteam velocites, fluid density and stratified flow conditionsfor Run B is shown.
The nodalization can be compared with that used for Run A(Fig 3). In the breakline the quality control valve has beenattached. Components 79 and 83 (vessel) are not included inthe snapshots frame.
AEEW - R 2202 148

APPENDIX B
MODIFICATIONS IMPLEMENTED IN TRAC-PFl/MODl WINFRITHVERSIONS BO2A AND BO2C
IDE B001
Identify Version. Change this ident for each change in aversion.
IDE B002
Correct core treatment in vessel.
Insert return in bits suite of subroutines.
IDE B003 B02C only
Reset limit on stratified flow to 30 degrees(ie ARCSIN(0.5))
COM WINF
This com deck contains the new Winfrith namelist variabletriggers
COM WINC
This com deck contains the stratified volume flag andvariables for the condensation heat transfer mod
IDE W003
Option to bypass interface sharpener routines while leavingthe fine mesh switched on. See also W007 for changes tonamelist option.
AEEW - R 2202 149

IDE W004
Plug weighting in interphase condensation heat transfer nolonger applied in stratified flow.
IDE W005
Allow wall condensation heat transfer in horizontal pipes
IDE W006
Allows negative friction factors.
IDE W007
Namelist extensions for W003 mods and printing diagnostictriggers.
IDE WOO8
Add stratified flow regime indicators for graphics. Addsimple stratified offtake model option for tee components.*Add pointers for condensation heat transfer mod (W009).
* (Option not selected for calculation A).
IDE W009
Make liquid velocity used in interface condensation heattransfer continuous with changing void fraction.(Option rot'selected for these calculations).
IDE W010
Alternative form of void'fraction for flow regime selection.(Option not selected for these calculations).
IDE W011
Mod to cure convergence problems in CHF use of secantmethod.
AEEW - R 2202 150

IDE W012
Correct error in evaluation of Forslund and Rohsenow liquidheat transfer coefficient.
IDE W013
Correction to stratified flow head term.
IDE W014
Correction to upper guess in subroutine CHF.
IDE W016
Corrects error for inflow from break when IVDV=O.
IDE W017
Correct unset value of joining cell flag in steam gen comp.
IDE W018
Attempt to make SS restart with pressurizer more smooth.
IDE W019 B02C only
Insert missing square root of pi in Taitel-Dukler stratifiedflow test in subroutine FEMON.
AEEW - R 2202 151


NRC FORM 335 U.S. NUCLEAR REGULATORY COMMISSION 1. REPORT NUMBER(2-89) (Assigned by NRC. Add Vol., Supp., Rev.,NRCM 1102, and Addendum Numbers, If any.)3201.3202 BIBLIOGRAPHIC DATA SHEET
(See instrctions on the reverse) NUREG/IA- 00192. TITLE AND SUBTITLE AEEW-R-2202
TRAC-PF1/MOD1 Post-Test Calculations of the OECD 3 DATE REPORT PUBLISHED
Loft Experiment LP-SB-2 - MONTH j YEAR
December 19904. FIN OR GRANT NUMBER
5. AUTHOR(S) 6. TYPE OF REPORT
F. Pelayo Technical7. PERIOD COVERED (Inclusive Dates)
U. rDnrJnEI•I RImI. %J 'afl.anI T Ttfl fl I I•flP, F,qC KIIirl-~:( ~~....LU~L Q I .I :ae5J sf..e.s•- fl. : ...c U, t- flrnun V ... *- snu --aneg ,arr .. .umm---ss,o.. ...gum sigaues , .. c....r..... ... r... ..
o. • runvblW un~ll•i i~w--i•J• l~ •u n~o it 1YR. provide Division, 0 fice or Regin, U.S. Nuclear Regulatroy Commission, andmailingaddress,*ifcontractorprovide,name and mailing address.)
United Kingdom Atomic Energy AuthorityAtomic Energy Establishment, WinfrithDorchester Dorset DT2 BDHUnited Kingdom
9. SPO NSO R ING OR GAN IZAT ION - N AM E A ND A DD R ESS (if NR, type "Sam as above"., if contractor Provide NRC Divison Office or Regon U.S Nuclear Regulatory Commisin.and mailing addrest)
Office of Nuclear Regulatory ResearchU. S. Nuclear Regulatory CommissionWashington, DC 20555
10. SUPPLEMENTARY NOTES
11. ABSTRACT (200 words or less)
An analysis of the OECD-LOFT-LP-SB-2 experiment making use of TRAC-PF1/MOD1 isdescribed in the report. LP-SB2 experiment studies the effect of a delayed pumptrip in a small break LOCA scenario with a 3 inches equivalent diameter breakin the hot leg of a commercial PWR operating at full power. The experimentwas performed on 14 July 1983 in the LOFT facility at the Idaho NationalEngineering Laboratory under the auspices of the Organisation for EconomicCo-operation and Development (OECD). This analysis presents an evaluationof the code capability in reproducing the complex phenomena which determinedthe LP-SB-2 transient evolution. The analysis comprises the results obtainedfrom two different runs. The first run is described in detail analysing themain variables over two time spans: short and longer term. Several conclusionsare drawn and then a second run testing some of these conclusions is shown.
12. KEY WORDS/DESCR:PTORS (List words or phrases that will assist researchers In locating the report.) 13. AVAILABILITY STATEMENT
UnlimitedTRAC-PFI, OECD LOFT, Small break 14. SECURITY CLASSIFICATION
(This Page)
Uncl assified(This Report)
Uncl assi fied15. NUMBER OF PAGES
16. PRICE
NRC FORM 335 (289)


THIS DOCUMENT WAS PRINTED USING RECYCLED PAPER.


UNITED STATESNUCLEAR REGULATORY COMMISSION
WASHINGTON, D.C. 20555
OFFICIAL BUSINESSPENALTY FOR PRIVATE USE, $300
SPECIAL FOURTH-CLASS RATEPOSTAGE Er FEES PAIDU USNRC I
PERMIT No. G-67
Gene Rhee (4)NLN-337