nursito 1 and yulianto hadi 2 faculty of post graduate...
TRANSCRIPT

FACTORS THAT INFLUENCE FINANCIAL PERFORMANCE
(Empirical Study In the Livestock Feed Industry Sub-Sector Listed on BEI Period 2006-
2015)
Nursito
1 and Yulianto Hadi
2
Faculty of Post Graduate, Universitas Budi Luhur [email protected], [email protected]
Abstract This study aims to test empirically the factors that affect financial performance: current ratio,
debt ratio, debt to equity ratio, total asset turnover, working capital turnover and net profit margin
on return on investment in sub sector of livestock feed industry listed in Indonesia Stock Exchange
during the period 2006-2015.
Sampling technique used purposive sampling obtained 4 company samples and analyzed by
using multiple linear regression.
Based on the result of hypothesis test, it is found that (1) the current ratio does not affect the return
on investment, (2) the debt ratio has an effect on the return on investment, (3) the ratio of debt to
equity affect the return on investment, (4) (7) current ratio, debt ratio, debt to equity ratio, total asset
turnover, working capital turnover, and (5) the working capital turnover has no effect on return on
investment, And net profit margins together affect the return on investment.
Keywords: Financial Performance 1. Background
The ability of a company to be able to compete very much determined by the company itself.
In general, a company's performance is shown in the published financial statements. Condition
company performance can be known based on the analysis of financial statements. The results of the
analysis of financial statements that show the company's performance as a basis for policy makers for
owners, managers and investors. Analysis and interpretation of financial statements in essence is to
conduct an assessment of the financial condition and potential or progress of a company through the
financial statements, financial statements can be analyzed based on financial ratios.
Financial ratios consideration describes a relationship between a certain amount and number
of others. Size commonly used in financial statement analysis is by using financial ratio analysis.
Financial ratio analysis is an analysis that is often used because it is the most appropriate method to be
applied in the assessment of the performance of the company. Financial ratios used to measure the
financial performance (Priyanka.P and DeivanaiKathiresan 2017)of companies studied by
researchers is the return on investment. As for some of the factors affecting the financial performance
is the current ratio, debt ratio, debt to equity ratio, total asset turnover, working capital turnover, net
profit margin and return on investment.
Conduct analysis of the factors affecting financial performance to determine the extent to
which the effectiveness of the company's operations in achieving its objectives and assessing the
performance of the company can use ratio analysis, which began with a search for relationships of
various items in the financial statements, using financial statements are compared, including data
about changes that occur in the amount of rupiah, percentage, and trends. That ratio would describe a
relationship or consideration (mathematical relationship) between a certain amount by the number of
others, ratio analysis can also explain or give an idea of the good or the bad financial condition of a
company, especially if the ratio is comparable with the ratio comparator used as standard. Ratio
analysis as well as analysis tools that others are "future oriented." Therefore, the analyzer must be
able to adjust the factors that exist in this time period or by factors in the future, which could affect
the financial position or results of operations of the company concerned. In order for the uses and
benefits of a number ratio depends entirely on the ability or expertise in interpreting the data analyzer
concerned (Munawir, 2007, 64).
In determining the Return on Investment (ROI) to consider a variety of factors the company's
financial performance through financial ratios. In this study using Curren ratio, Debt Ratio, Debt
International Journal of Pure and Applied MathematicsVolume 117 No. 15 2017, 845-857ISSN: 1311-8080 (printed version); ISSN: 1314-3395 (on-line version)url: http://www.ijpam.euSpecial Issue ijpam.eu
845

ToEquity Ratio, total assets turnover, working capital turnover, net profit margin. These ratios are
thought to have a great influence in determining the Return on Investment (ROI) of a company.
Factors that affect the financial performance of the animal feed industry in Indonesia. Some
problems can be theauthor of identification are: (1) Is there any indication that the alleged financial
performance is affected by the low current ratio? (2) Does high debt ratio affect the financial
performance? (3) Does high debt to equity ratio effect on financial performance? (4) Does the low
total assets turnover affect the financial performance? (5) Is the lack of working capital turnover
affect the financial performance? (6) Do The low net profit margin affect the financial performance?
The population of this research are animal feed company. Industrial livestock sector is one
industry that is relatively undeveloped and is active in the Indonesian Stock Exchange (BEI). Noor
Antung research results Asiya (2011) found evidence of Textile Industry where current ratio (CR) is
the dominant variable affecting ROI. Hidayat et al (2014) found evidence Property and Real Estate
Company where Debt Ratio (DR) effect on Return on Investment (ROI). Rahmawati (2009) found
evidence of food and beverage companies in which the Debt to Equity Ratio (DER) effect on Return
on Investment. Sjahruddin (2010), found evidence where a Pharmaceutical Company where Total
Assets Turnover (TATO) and Net Profit Margin (NPM) effect on Return on Investment
(ROI).DifkyMashady et al (2013) found evidence which the Working Capital Pharmaceutical
Company Turnover (WCT) effect on Return on Investment (ROI).
Companies themselves have the potential to develop products more quickly by performing a
variety of innovative and tend to have more market expansion.
2. LITERATURE REVIEW
Agency Theory
Jensen and Meckling (1976) suggests the agency theory explains that the interests of management
and investors or shareholders often there is a conflict, which could be a conflict between the two.
Agency theory to explain within the company there are many parties namely managers, company
owners and creditors which are contradictory and basically have different interests, the manager is
obliged to consider the welfare of the shareholders, but the management also has an interest in
developing himself. The investors also demanded that more attention to their welfare management by
sharing profits / gains to them. ROI is the relative value of equity in net income compared with the
total investment by the company. ROI value describes the growth of assets or wealth of the company
in the form of net profit growth during the period.
Signaling Theory
The theory that explains the importance of performance measurement is signaling theory. This
theory explains that the financial statements are either a signal or a sign that the company has been
operating well. A good signal will be responded too well by the other party.
The financial statements are published as information in providing a signal to investors in making
investment decisions. Annual report examples of information published in this theory is the financial
statement (Rustiarini, 2010).
Current Ratio with Return On Investment
Current Ratio one common ratio used to measure liquidity or the company's ability to meet short-
term obligations without facing any difficulty. The higher the current ratio, the greater the opportunity
for the company to repay short-term debt includes payments of cash dividends payable (Brigham and
Houston, 2012). This liquidity has close links with the ROI, liquidity Diman shows the level of
availability of working capital needed for daily operational activities. The higher the liquidity, the
smaller the ROI and conversely the lower the liquidity, the greater the ROI. Research Asiya et al
(2011) to produce empirical evidence that the current ratio affects return on investment in Textile
Industry Listed In Indonesia Stock Exchange. Based on these reasons, a hypothesis that can be
developed are:
H1: Current Ratio significant effect on return on investment in the industry sub sector fodder go
public in BEI.
Debt Ratio with Return On Investment
International Journal of Pure and Applied Mathematics Special Issue
846
Debt Ratio draw total amount of debt that can be secured by the total assets. The higher the debt
ratio shows the financial risks that companies face greater consequences for debt interest expense
remains. Debt Ratio is the ratio between total liabilities and total assets. Research Marjam et al (2015)
to produce empirical evidence that Debt Ratio affect the return on investment on the Cigarette
Industry Listed In Indonesia Stock Exchange. Based on these reasons, a hypothesis that can be
developed are:
H2: Debt Ratio significant effect on return on investment in the industry sub sector fodder go public
in BEI.
Debt To Equity Ratio with Return On Investment
Total debt or total liabilities (both short-term debt and long-term); while total shareholders' equity
is total own capital (total capital paid shares and retained earnings) of the company. This ratio
illustrates the composition of total debt to total equity. Increasingly beasr DER shows the composition
of total debt higher than the total own capital, so the greater the burden on companies to outsiders
(creditors) (Ang, 1997). Research Rahmawati (2015) to produce empirical evidence that the Debt
Equity Ratio affects the return on investment in food and Beverage companies listed on the
Indonesian stock exchange. Based on these reasons, a hypothesis that can be developed are:
H3: Debt Equity Ratio significant effect on return on investment in the industry subsector fodder go
public in BEI.
Total Assets Turn Over the Return On Investment
Total Asset Turnover (TATO) is the ratio of the activity that is used to measure the extent a
company's effectiveness in using its resources in the form of assets. The more efficient use of assets
and the sooner the refund in the form of cash (Halim, 2007). Research Rahmah et al (2016) to produce
empirical evidence that Total Asset Turnover (TATO) affect the return on investment in
manufacturing companies listed on the Indonesian stock exchange. Based on these reasons, a
hypothesis that can be developed are:
H4: Total Asset Turnover significant effect on return on investment in the industry sub sector fodder
go public in BEI.
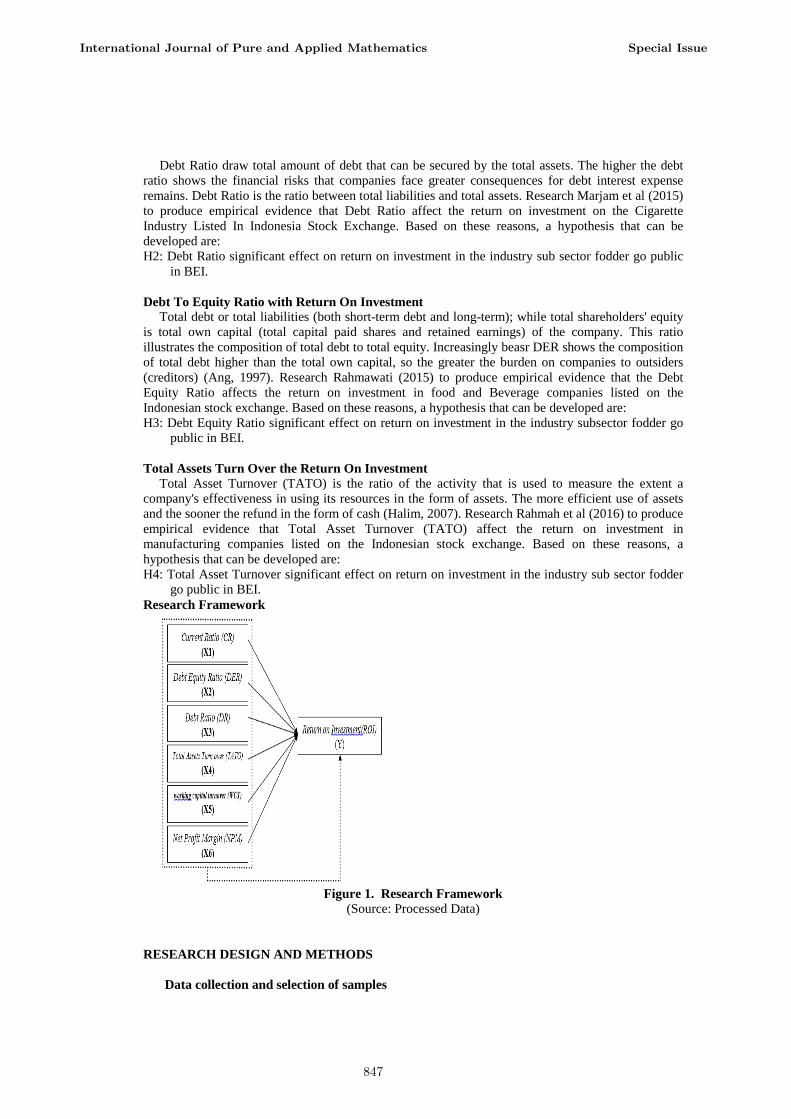
Research Framework
Figure 1. Research Framework
(Source: Processed Data)
RESEARCH DESIGN AND METHODS
Data collection and selection of samples
International Journal of Pure and Applied Mathematics Special Issue
847

The scope of the research includes the financial statement data of manufacturing companies listed
in Indonesia Stock Exchange (BEI) in the period 2006 to 2015. The data used are the financial
statements that have been published to the public and can be accessed from the official website of the
Stock Exchange that www.idx.co.id. Sample selection technique used in this research is purposive purposivesampling . It gained as much
as 4 samples of 4 sub sector company listed on the Stock Exchange in the period 2006-2015.
TABLE. 1. SAMPLE DATA ANIMAL FEED INDUSTRY
No Data Input
1 PT. Charoen Pokphand Indonesia Tbk,
2 PT. JapfaComfeed Indonesia Tbk,
3 PT. MalindoFeedmillTbk,
4 PT. Sierad Produce Tbk
1.
Operationalization of Research Variables The variables of independently in this study using four variables, the Current Ratio (X1), Debt
Ratio (X2), Debt To Equity Ratio (X3), Total Asset Turnover (X4), Working Capital Turnover (X5),
Net Profit Margin (X6) , while the dependent variable is the return on investment (Y).
Data analysis technique Data were analyzed using multiple regression analysis
Table 2. Operational variables
Variable Indicator Scale Source
Return on
Investment
(ROI)
(Y)
Munawir
(2007: 89)
Ratio Balance
sheets and
Financial
Statements
Current
ratio (CR)
(X1)
Brigham
dan
Houston
(2010)
Ratio
Balance
sheets
Debt Ratio
(DR)
(X2)
Langko
(2010)
Ratio
Balance
sheets
International Journal of Pure and Applied Mathematics Special Issue
848

Debt to
Equity
Ratio
(DER)
(X3)
Brigham
dan
Houston
(2012)
Ratio
Balance
sheets
Total Assets
Turn Over
(X4)
Prastowo
(2011)
Ratio Balance
sheets and
Financial
Statements
Working
Capital
Turnover
(X5)
Sawir
(2012)
Ratio
Balance
sheets and
Financial
Statements
Net Profit
Margin
(X6)
Hery
(2015)
Ratio
Financial
Statements
Use of Model:
Y= a + ß1X1 + ß2 X2 + ß3 X3+ ß4 X4+ ß5 X5 +ß6 X6+ e
Notes:
Y = ROI
X1 = CR
X2 = DER
X3 = DR
X4 = TATO
X5 = WCT
X6 = NPM
a = konstanta
ß 1,2,3,4,5,6 = coefficient regression
e = (error)
International Journal of Pure and Applied Mathematics Special Issue
849
RESULTS AND DISCUSSION
Classic assumption test
a. Test Multicolinearity
Multicolinearity test regression model used to test whether there is a correlation between
independent variables (independent). namely by looking at VIF (Varian Inflation Factor) and
Tolerance in the process of regression, if both close to 1 or scale VIF is less than 10 then the model is
not affected by Multicolinearity (Ghozali, 2006).
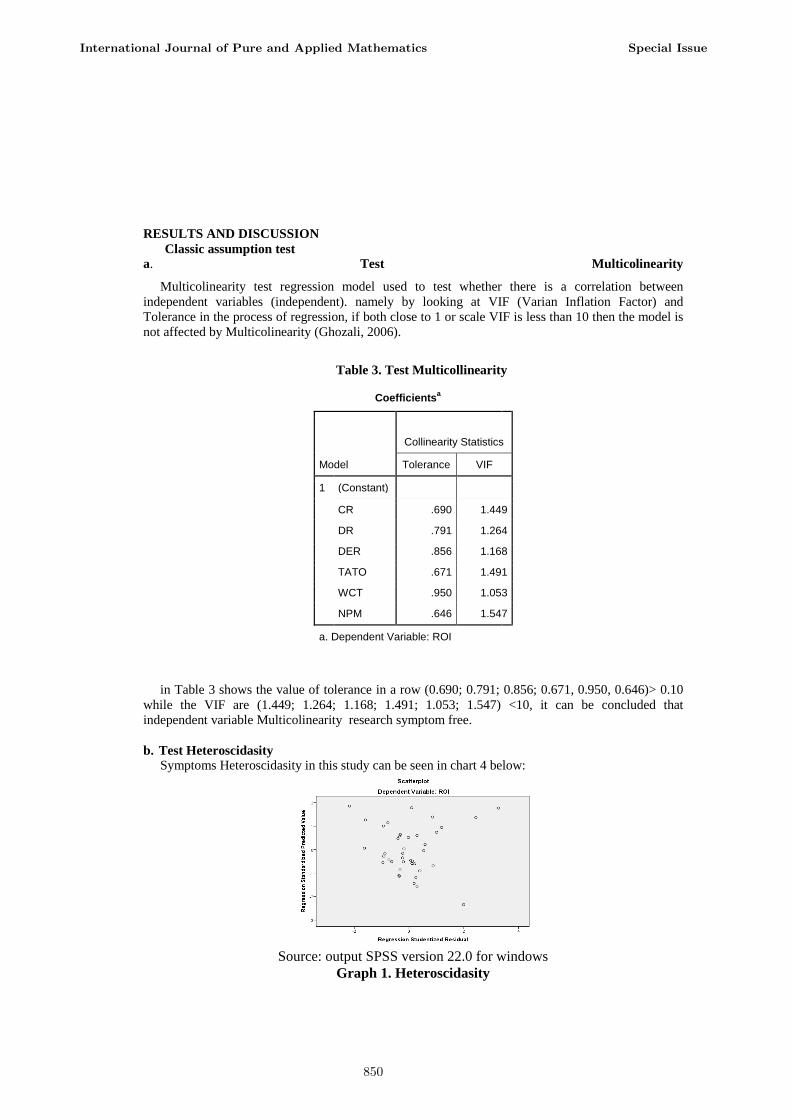
Table 3. Test Multicollinearity
Coefficientsa
Model
Collinearity Statistics
Tolerance VIF
1 (Constant)
CR .690 1.449
DR .791 1.264
DER .856 1.168
TATO .671 1.491
WCT .950 1.053
NPM .646 1.547
a. Dependent Variable: ROI
in Table 3 shows the value of tolerance in a row (0.690; 0.791; 0.856; 0.671, 0.950, 0.646)> 0.10
while the VIF are (1.449; 1.264; 1.168; 1.491; 1.053; 1.547) <10, it can be concluded that
independent variable Multicolinearity research symptom free.
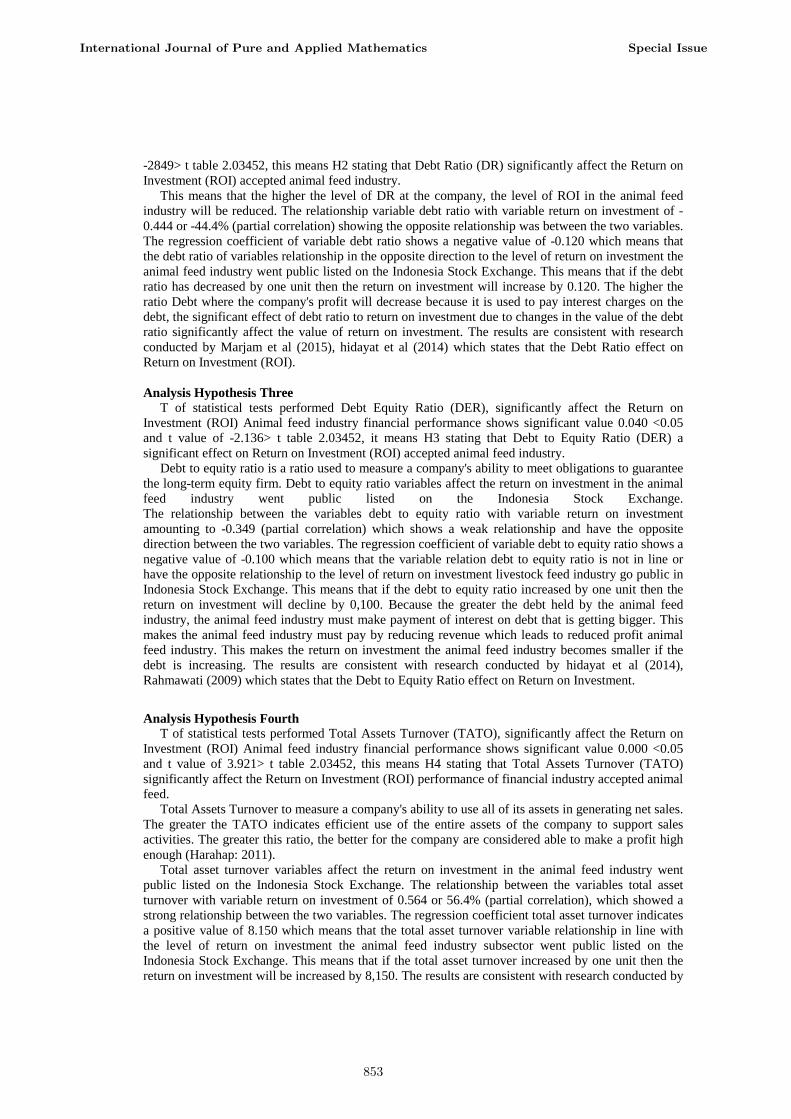
b. Test Heteroscidasity
Symptoms Heteroscidasity in this study can be seen in chart 4 below:
Source: output SPSS version 22.0 for windows
Graph 1. Heteroscidasity
International Journal of Pure and Applied Mathematics Special Issue
850

Based on the graph scatterplot can be concluded that the research does not happen Heteroscidasity,
because the residue dispersed and does not form a specific pattern, so the regression model proper to
be used to predict the financial performance of fodder (return on investment) based on the influence
of independent variables (current ratio, debt ratio, debt to-equity ratio, total asset turnover, working
capital turnover, and net profit margin).
c. Test Autocorrelation Autocorrelation in this study can be seen in Table 4 below.
Table 4. Test Autocorrelation
Model Summaryb
Model R R
Square
Adjusted R
Square
Std. Error of
the Estimate
Durbin-Watson
1 .816
a .665 .605 3.79390 1.243
a. Predictors: (Constant), CR, DR, DER, TATO, WCT, NPM
b. Dependent Variable: ROI
With the number of sample data 40 (n = 40) and the independent variables as much as 6 variables (k =
6), to determine their autocorrelation test was used Durbin-Watson, the criteria of Table 4, the
Durbin-Watson looks DW value of 1.243 for the presence autocorrelation Durbin-Watson test was
used, the criteria according to santoso (2012: 219).
By looking at the magnitude of the Durbin-Watson as follows:
a. Figures D-W below -2, there is positive autocorrelation.
b. Figures D-W between -2 to +2, no autocorrelation.
c. Figures D-W above +2, there is a negative autocorrelation.
Auto correlation test results above show the value of Durbin-Watson (D-W) of 1.243. where in, DW
values in the range -2 and smaller than 2 (-2 <1.243 <2) then this model has no symptoms
autocoleration both positive and negative. The less deviation in the model, the regression results
produced the better.
From the classic assumption test results concluded regression model used in this study has met the
model estimates Best linear Unbiased Estimator (BLUE) and worth doing regression analysis.
d. Normality test According Ghozali (2011: 28), a variable is not necessarily needed in the analysis of the test for
normality, but it would be better if the normality test all variables are normally distributed.
The statistical test used in this study was to examine the residual normality is a non-parametric
statistical tests Smirnov (K-S). K-S test is done by making hypotheses:
Ho: The data were normally distributed residuals when significant value> 5% (0:05)
Ha: residual data is not normal when significant value <0.050
Normality of the data in this study can be known throughthe table 5 below:
Table 5. Normality Test
International Journal of Pure and Applied Mathematics Special Issue
851

According to the table showing the ROI Asymp.Sig 0.91> 0.05, CR Asymp.Sig 0.179> 0.05, DR
Asymp.Sig 0.200> 0.05, DER Asymp.Sig 0.200> 0.05, TATO Asymp.Sig 0.200> 0.05, WCT
Asymp.Sig 0.147> 0.05, NPM Asymp. Sig 0.200> 0.05, the results in this study are eligible test for
normality. Data fit for use, to predict financial performance industrial fodder (return on investment)
based on the input of independent variables (current ratio, debt to equity ratio, debt ratio, total asset
turnover, working capital turnover, and net profit margin) for fulfilling assumption test normality.
Hypothesis testing est the hypothesis in this study using multiple regression analysis
First Hypothesis Analysis From the statistical test t done Current Ratio (CR), did not significantly affect the Return on
Investment (ROI) Animal feed industry financial performance shows significant value of 0.299> 0.05
and t value of 1.054 <t table 2.03452, it H1 means that states that the Current Ratio (CR) significantly
affect the Return on Investment (ROI) animal feed industry declined.
Current ratio is a ratio to measure a company's ability to meet its obligations to the debtor with the
liquid assets owned by a company. Variable current ratio does not affect the return on investment in
the animal feed industry went public listed on the Indonesia Stock Exchange. The relationship
between the variable current ratio with a variable return on investment amounted to 0.181 or 18.1%
(partial correlation) which showed a less strong between the two variables. The current ratio variable
regression coefficient indicates a positive value of 0.013 which means that the current ratio variable
relationship in line with the level of return on investment the animal feed industry went public listed
on the Indonesia Stock Exchange. This means that if the current ratio increased by one unit then the
return on investment will be increased by 0,013.
No significant effect of the current ratio of the return on investment due to changes in current
assets continues to increase is also accompanied by the increase in current liabilities animal feed
industry, which certainly does not cause changes to the animal feed industry profits. Thus, the
changes experienced by the variable current ratio does not significantly affect the change in value
return on investment. The results are consistent with research conducted by Sjahruddin et al (2010)
which states that the Current Ratio (CR) had no significant effect on Return on Investment (ROI).
Analysis Hypothesis Two T of statistical tests performed Debt Ratio (DR), significantly affect the Return on Investment
(ROI) Animal feed industry financial performance shows significant value 0.007 <0.05 and t value of
International Journal of Pure and Applied Mathematics Special Issue
852
-2849> t table 2.03452, this means H2 stating that Debt Ratio (DR) significantly affect the Return on
Investment (ROI) accepted animal feed industry.
This means that the higher the level of DR at the company, the level of ROI in the animal feed
industry will be reduced. The relationship variable debt ratio with variable return on investment of -
0.444 or -44.4% (partial correlation) showing the opposite relationship was between the two variables.
The regression coefficient of variable debt ratio shows a negative value of -0.120 which means that
the debt ratio of variables relationship in the opposite direction to the level of return on investment the
animal feed industry went public listed on the Indonesia Stock Exchange. This means that if the debt
ratio has decreased by one unit then the return on investment will increase by 0.120. The higher the
ratio Debt where the company's profit will decrease because it is used to pay interest charges on the
debt, the significant effect of debt ratio to return on investment due to changes in the value of the debt
ratio significantly affect the value of return on investment. The results are consistent with research
conducted by Marjam et al (2015), hidayat et al (2014) which states that the Debt Ratio effect on
Return on Investment (ROI).
Analysis Hypothesis Three T of statistical tests performed Debt Equity Ratio (DER), significantly affect the Return on
Investment (ROI) Animal feed industry financial performance shows significant value 0.040 <0.05
and t value of -2.136> t table 2.03452, it means H3 stating that Debt to Equity Ratio (DER) a
significant effect on Return on Investment (ROI) accepted animal feed industry.
Debt to equity ratio is a ratio used to measure a company's ability to meet obligations to guarantee
the long-term equity firm. Debt to equity ratio variables affect the return on investment in the animal
feed industry went public listed on the Indonesia Stock Exchange. The relationship between the variables debt to equity ratio with variable return on investment
amounting to -0.349 (partial correlation) which shows a weak relationship and have the opposite
direction between the two variables. The regression coefficient of variable debt to equity ratio shows a
negative value of -0.100 which means that the variable relation debt to equity ratio is not in line or
have the opposite relationship to the level of return on investment livestock feed industry go public in
Indonesia Stock Exchange. This means that if the debt to equity ratio increased by one unit then the
return on investment will decline by 0,100. Because the greater the debt held by the animal feed
industry, the animal feed industry must make payment of interest on debt that is getting bigger. This
makes the animal feed industry must pay by reducing revenue which leads to reduced profit animal
feed industry. This makes the return on investment the animal feed industry becomes smaller if the
debt is increasing. The results are consistent with research conducted by hidayat et al (2014),
Rahmawati (2009) which states that the Debt to Equity Ratio effect on Return on Investment.
Analysis Hypothesis Fourth T of statistical tests performed Total Assets Turnover (TATO), significantly affect the Return on
Investment (ROI) Animal feed industry financial performance shows significant value 0.000 <0.05
and t value of 3.921> t table 2.03452, this means H4 stating that Total Assets Turnover (TATO)
significantly affect the Return on Investment (ROI) performance of financial industry accepted animal
feed.
Total Assets Turnover to measure a company's ability to use all of its assets in generating net sales.
The greater the TATO indicates efficient use of the entire assets of the company to support sales
activities. The greater this ratio, the better for the company are considered able to make a profit high
enough (Harahap: 2011).
Total asset turnover variables affect the return on investment in the animal feed industry went
public listed on the Indonesia Stock Exchange. The relationship between the variables total asset
turnover with variable return on investment of 0.564 or 56.4% (partial correlation), which showed a
strong relationship between the two variables. The regression coefficient total asset turnover indicates
a positive value of 8.150 which means that the total asset turnover variable relationship in line with
the level of return on investment the animal feed industry subsector went public listed on the
Indonesia Stock Exchange. This means that if the total asset turnover increased by one unit then the
return on investment will be increased by 8,150. The results are consistent with research conducted by
International Journal of Pure and Applied Mathematics Special Issue
853

Sjahruddin (2010), rahmah et al (2016) which states that the Total Assets Turnover (TATO) effect on
Return on Investment (ROI).
Analysis Hypothesis Fifth T of statistical tests performed Working Capital Turnover (WCT), did not significantly affect the
Return on Investment (ROI) Animal feed industry financial performance shows significant value
0.431> 0.05 and t value of 0.797 <t table 2.03452, it means H5 stating that the Working Capital
Turnover (WCT) significantly affect the Return on Investment (ROI) animal feed industry's financial
performance declined.
Working capital turnover, the ratio used to measure the company's ability to obtain the number of
sales (in rupiah) obtained by the company for each rupiah working capital. Variable working capital
turnover did not affect the return on investment in the animal feed industry went public listed on the
Indonesia Stock Exchange. The relationship between the variables working capital turnover with
variable return on investment amounted to 0,137, or 13.7% (partial correlation) which showed a weak
correlation between the two variables. The regression coefficient of variable working capital turnover
shows a positive value of 3.091 which means that the variable relationship in line with the working
capital turnover rate of return on investment the animal feed industry went public listed on the
Indonesia Stock Exchange. This means that if the working capital turnover increased by one unit then
the return on investment will increase by 3.091. Not the strong relationship between the two variables
have occurred due to changes in current liabilities greater than current assets, working capital so that
some animal feed industry suffered from a lack of capital. In addition the revenue generated by the
animal feed industry did not experience a significant increase compared to the increase in current
liabilities which are uncertain, which automatically affects the working capital issued by the animal
feed industry. This is according to research conducted by yuliani et al (2015) which states that the
Working Capital Turnover (WCT) has no effect on Return on Investment (ROI).
Analysis Hypothesis sixth T of statistical tests conducted Net Profit Margin (NPM) significantly affect the Return on
Investment (ROI) Animal feed industry financial performance, demonstrated significant value 0.024
<0.05 and t value of 2.372> t table 2.03452, this means H6 which states that the Net Profit Margin
(NPM) significantly affect the Return on Investment (ROI) performance of financial industry
accepted animal feed.
Net profit margin is a ratio used to measure the ability of the company in order to provide returns
to shareholders. Variable net profit margin positive effect on return on investment in the animal feed
industry subsector went public listed on the Indonesia Stock Exchange.
The relationship between the variables of net profit margin with a variable return on investment
amounted to 0.382 or 38.2% (partial correlation) which showed a weak correlation between the two
variables. The regression coefficient of net profit margin shows a positive value of 1.013 which
means that the variable relationship of net profit margin in line with the level of return on investment
the animal feed industry went public listed on the Indonesia Stock Exchange. This means that if the
net profit margin increased by one unit then the return on investment will be increased by 1,013. This is in line with research conducted by Sjahruddin et al (2010) which states that the Net Profit
Margin (NPM) effect on Return on Investment.
Analysis Hypothesis seventh Regression analysis in addition to measuring the strength of the relationship between two or more
variables, also shows the direction of the relationship between the dependent and independent
variables. The results of multiple regression analysis as a whole shows the R square of 0.665. F sig. =
0.000 with a significant probability <0.05, which means there is significant influence between independent variables (current ratio, debt
ratio, debt to equity ratio, total asset turnover, working capital turnover, and net profit margin) on the
dependent variable (return on investment). The results of multiple regression or a significant
probability of <0.05 are shown in Table 5.
International Journal of Pure and Applied Mathematics Special Issue
854

Based Test Statistic F is test the overall model significance. H7 will be accepted if the value of
ROI. (F-statistic)> α = 0.05. in Table 5 above shows the ROI. (F statistic) = 0.000 <0.05 and 10.935 F
count> F table 2,39 then H7 accepted, meaning that with a 95% confidence level variable Current
Ratio (CR), Debt Ratio (DR), Debt to Equity Ratio (DER) , Total Assets Turnover (TATO), Working
Capital Turnover (WCT). and the Net Profit Margin (NPM) jointly significant effect on Return on
Investment (ROI). Sixth independent variables can explain the changes to the financial performance in the animal feed
industry listed in Indonesia Stock Exchange amounted to 81.6%.
Conclusion From the results of the t test, variable debt ratio, debt to equity ratio, total asset turnover, net profit
margin effect on the financial performance (return on investment) in the animal feed industry listed on
the Stock Exchange. And only the current ratio, working capital turnover that did not affect the
financial performance (return on investment) in the animal feed industry listed in Bursa Securities
Indonesia. Simultaneously, current ratio, debt ratio, debt to equity ratio, total asset turnover, working capital
turnover, and net profit margin together have an influence on financial performance (return on
investment) in the animal feed industry listed in Busa Securities Indonesia ,
References
Arikunto S, 2011. ProsedurPenelitianSuatuPendekatanPraktik, Ed Revisi VI,
Penerbit PT RinekaCipta, Jakarta.
Brigham dan Houston. 2012. Dasar-DasarManajemenKeuangan. Jakarta: SalembaEmpat.
BambangRiyanto. 2010. Dasar-DasarPembelanjaan Perusahaan. Yogyakarta: BPFE UGM.
Fahmi, Irham. 2011. AnalisisKinerjaKeuangan: PanduanbagiAkademisi, Manajer, danInvestor
untukMenilaidanMenganalisisBisnisdariAspekKeuangan. Bandung: Alfabeta
Ghozali, Imam, 2011, AplikasiAnalisis Multivariate dengan program SPSS, BadanPenerbit UNDIP,
Semarang.
Helfert, Erich A. 1996. TeknikAnalisisKeuangan. Jakarta: Erlangga.
Hery. 2015. AnalisisLaporanKeuangan. Penerbit CAPS (Center for Academy Publishing Service).
Yogyakarta
Priyanka.P and DeivanaiKathiresan, “A Machine Learning Approach To Mainframe
Analysis”, International Journal of Innovations in Scientific andEngineering Research
(IJISER), ISSN: 2347-971X (online), ISSN: 2347-9728(print), Vol.4, no1, pp.18-
24,2017, http://www.ijiser.com/.
IkatanAkuntansi Indonesia.2016.StandartAkuntansiKeuangan. IAI. Jakarta: SalembaEmpat.
Kasmir. 2010. PengantarManajemenKeuangan. Jakarta: Prenadamedia
Munawir, S.2007. “ AnalisisLaporanKeuangan”. Liberty:Yogyakarta.
Mulyono.2010. Pengaruh Leverage KeuanganTerhadapProfitabilitas. Universitas Riau
NurIndiantorodanBambangSupomo,
2002.MetodologiPenelitianBisnisuntukAkuntansidanManajemen, EdisiPertama, BPFE,
Yogyakarta. Pasaribu, 2013 Pasaribu, Rowland Bismark Fernando. HubunganValutaAsingdanHargaSaham:
PendekatanKausalitasdanKointegrasi. Gunadarma Media, Jakarta, 2013. Prastowo, Dwi. 2011. AnalisisLaporanKeuangan. Yogyakarta: Unit
PenerbitdanPercetakanSekolahTinggiIlmuManajemen YKPN. Raharjaputra, Hendra S. 2009. ManajemenKeuangandanAkuntansi. Jakarta: SalembaEmpat.
Santoso, Singgih. 2012. Latihan SPSS StatistikParametik . Jakarta: Elex Media Computindo.
International Journal of Pure and Applied Mathematics Special Issue
855

Sartono, 2010 Sartono, Agus. ManajemenKeuanganTeoridanAplikasi. Yogyakarta: BPEF-
YOGYAKART
Syamsuddin, Lukman. 2011. ManajemenKeuangan Perusahaan. Jakarta: PT. RajaGrafindoPersada.
Sawir, Agnes. 2012. AnalisisKinerjaKeuangandanPerencanaanKeuangan Perusahaan. Jakarta: PT
GramediaPustakaUtama.
Sutrisno. 2009. ManajemenKeuanganTeori, KonsepdanAplikasi. Yogyakarta: Ekonisia.
Subramayam, K.R, and Wild, John J. (2013).Financial Statement Analisys. McGraw Hill: Singapore
Van Horne dan Wachowicz.2009.“Fundamentals of Financial Management Prinsip-
prinsipManajemenKeuangan”.Edisi 12. Jakarta: SalembaEmpat.
www.idx.co.id
Ahmadi, Mosadkk. 2012. Studying the Relationship between Working Capital
Management and Profitability.Abhar, Iran: Islamic Azad University.
Bhunia, Amalendudkk. 2012. The Impact of Liquidity on Profitability. West Bengal: University of
Kalyani.
Bhattaracharya, 1979 Bhattaracharya, M.N. Effectiveness of Seat Belt Legislation on Quessland Road
Toll – An Australian Case Study in InterventiorAnaysis. Journal of American Statistics
Association.74, pp.367.
Lanko, MuhamadYunus. 2010. AnalisisFaktor Operating Leverage
danPengaruhnyaTerhadapProfitabilitas. Journal Economic Resources.
Kusumajaya, DewaKadek Oka. 2011. PengaruhStruktur Modal danPertumbuhan Perusahaan
terhadapProfitabilitasdanNilai Perusahaan pada Perusahaan Manufaktur di Bursa Efek
Indonesia.Tesis.Denpasar: UniversitasUdayana.
Rustiarini, 2010 Rustiarini, Ni Wayan.“PengaruhCorporate GovernancepadaHubunganCorporate
Social ResponsibilitydanNilai
Perusahaan”.MakalahDisampaikandalamSimposiumNasionalAkuntansi
XIII.Purwokerto.AUDI.Vol. 4.No. 1. H. 1-10
Padachi, Kesseven. 2006. Trends in Working Capital Management and Its Impact
on Firm’s Performance: An Analysis of Mauritian Small Manufacturing
Firms.PengaruhnyaTerhadapProfitabilitas.Jurnal Economic Resources. Rajesh, M., and J. M. Gnanasekar. "Annoyed Realm Outlook Taxonomy Using Twin Transfer
Learning." International Journal of Pure and Applied Mathematics 116 (2017): 547-558.
Rajesh, M. & Gnanasekar, J.M. Wireless Pers Commun (2017),https://doi.org/10.1007/s11277-017-
4565-9
Rajesh, M., and J. M. Gnanasekar. "GCCover Heterogeneous Wireless Adhoc Networks." Journal of
Chemical and Pharmaceutical Sciences (2015): 195-200.
Rajesh, M., and J. M. Gnanasekar. "CONGESTION CONTROL IN HETEROGENEOUS WANET
USING FRCC." Journal of Chemical and Pharmaceutical Sciences ISSN 974: 2115.
Rajesh, M., and J. M. Gnanasekar. "GCCover Heterogeneous Wireless Ad hoc Networks." Journal of
Chemical and Pharmaceutical Sciences (2015): 195-200.
Rajesh, M., and J. M. Gnanasekar. "CONGESTION CONTROL USING AODV PROTOCOL
SCHEME FOR WIRELESS AD-HOC NETWORK." Advances in Computer Science and
Engineering 16.1/2 (2016): 19.
RAJESH, M. "TRADITIONAL COURSES INTO ONLINE MOVING STRATEGY." The Online
Journal of Distance Education and e-Learning 4.4 (2016).
Rajesh, M. "Object-Oriented Programming and Parallelism."
Rajesh, M., K. Balasubramaniaswamy, and S. Aravindh. "MEBCK from Web using NLP
Techniques." Computer Engineering and Intelligent Systems 6.8: 24-26.
International Journal of Pure and Applied Mathematics Special Issue
856

857

858