nutritional differentials in two demographically …
TRANSCRIPT
NUTRITIONAL DIFFERENTIALS IN TWO DEMOGRAPHICALLY
DISTINCT TATES IN INDIA
Introduction
Health of the people is the most important indicator of development of a nation, and nutrition is an
important determinant of health. India has the highest incidence of childhood malnutrition in the world.
Almost 30 babies in India are born with low birth weight and are doomed to adverse consequences,
including degenerative diseases in later life. UNICEF and the World Food Programme (WFP) work
together to strengthen and sustain the ability of households to meet their basic needs for food, care of
children and women, health services, and water and sanitation. Proper nutrition is a powerful good: people
who are well nourished are more likely to be healthy, productive and able to learn. Good nutrition benefits
families, their communities and the world as a whole. Malnutrition is, by the same logic, devastating. It
plays a part in more than a third of all child deaths in developing countries. It blunts the intellect, saps the
productivity of everyone it touches and perpetuates poverty.
Widespread poverty resulting in chronic and persistent hunger is the biggest problem of the developing
countries today. Poverty in turn, is closely linked to overall standard of living and whether the population
can meet its basic needs such as access to food, housing, health care and education. The social and
environmental context in which a child is raised affects his or her health and in turn the survival chances
(Sastry, 1996) this inter – sectoral and inter – related cause of under nutrition operates at many levels from
community at large to the household and children within the household. Under nutrition is often sighted as
an important factor contributing to high morbidity and mortality among children in developing countries.
Under nutrition during childhood can also affect growth potential and risk of morbidity & mortality in
later years of life. Many studies have shown that severely malnourished children are at a greater risk of
dying than healthy children. Between 20 and 75 percent of child deaths can be attributed directly to
malnutrition in the less developing countries. If not death, chronic malnourishment leads to blindness,
deformities and brain damage. Factors like maternal age, literacy status and work outside home delay the
introduction of supplementary food even to later than 12 months of age. Therefore, nutrition education is
essential for creating an awareness of desirable weaning practices among mothers to enhance the health
status of children (Subbulaxmi et.al, 1990). Health environment contributes to around 20 percent
reduction in child malnourishment in developing countries (Smith et. al, 2000). The determinants of
infections in children with mild to moderate malnutrition are more closely related to the quality of
environment than to the nutritional status of children. However, once the child becomes infected, the
severity and duration of the episode will depend on the nutritional status (Martorell and Ho, 1984).
Several recent studies have considered the relationship between community characteristics and child
health measured most commonly by Anthropometrical indicators. Barrera (1990) found that in
Philippines, environment cleanliness, water connections, toilet facilities and access to health care facilities
were all significantly related to child health. The community level variables like community education and
community hygiene also play an important role in reducing the risk of child deaths under 5 years of age.
The incidence of child mortality was found to be directly related to having no modern toilet facility in
Northeast India (Ladusingh and Singh, 2006). The household environment measured by factors such as
source of drinking water and toilet facilities, is important determinant for survival of older children as well
(Merrick 1985, Esrey & Habicht, 1986 and Woldemicael, 2000). These factors are important not only for
their direct impact on child survival but they may also indicate the overall resource level of the child’s
family. Children from households with better economic conditions have better nutritional status in West
Bengal. Also the different ethnic groups show variation with respect to nutritional status in Assam. (Som,
Pal et.al, 2005).
Underlying Causes of Malnutrition
The main underlying preconditions that determine adequate nutrition are food, some times it's depend
upon the source of cooking, health and care: the degree of an individual’s or a household’s access to these
preconditions affect how well they are nourished. Food security exists when, at all times, everyone has
access to and control over sufficient quantities and quality of food needed for an active and healthy life.
For a household this means the ability to secure adequate food to meet the dietary requirements of all its
members, either through their own production or through food purchases. but whenever you are cooking
then you have to very careful about the source of cooking, Food production depends on a wide range of
factors, including access to fertile land, availability of labour, appropriate seeds and tools and climatic
conditions. Factors affecting food purchases include household income and assets as well as food
availability and price in local markets. (Reference: Measuring and interpreting Malnutrition and Mortality
(manual); WFP and CDC; 2005).
On an immediate level, malnutrition results from an imbalance between the required amount of nutrients
by the body and the actual amount of nutrients introduced or absorbed by the body.
Health and Sanitation Environment
Access to good quality health services including affordability, safe water supplies, adequate sanitation and
good housing are preconditions for adequate nutrition. Inadequate sanitation and hygiene is a major
contributing factor for anaemia due to the link with intestinal worm infection. Health and nutrition are
closely linked in a “malnutrition-infection cycle” in which diseases contribute to malnutrition, and
malnutrition makes an individual more susceptible to disease. Malnutrition is the result of inadequate
dietary intake, disease or both. Disease contributes through loss of appetite, malabsorption of nutrients,
and loss of nutrients through diarrhea or vomiting. If the body's metabolism is altered the greater the risk
is of malnutrition.
Social and Care Environment
The social and care environment within the household and local community also can directly influence
malnutrition. Appropriate childcare, which includes infant and young child feeding practices, is an
essential element of good nutrition and health. Cultural factors and resources such as Household structure
(Nuclear and Joint families), income, time and knowledge also influence caring practices as well as
attitudes to modern health services, source of water supplies and sanitation.
Need For the Study
One study has found to identify variables in the family and child subsystem which determine child health
status in two selected rural areas of Karnataka, India. The multivariate approach stresses the importance of
controlling for age as 0-12 and 13-36 months. The results show that some of the variables which explain
the differences in weight for age are the direct influence of socioeconomic status and operate indirectly
through morbidity and per capita expenditure on food (Ramprasad V; Kulkarni PM, 1985).
It is now widely recognized that while income poverty reduction is relatively easy, elimination of multiple
deprivation is more difficult to achieve (Radhakrishna and Ray, 2005). NFHS-II reveals that 71 per cent of
rural household do not have any toilet facility; 19 per cent villages do not have any health facility, and 51
per cent of villages do not have any drainage facility-either underground or open. The National Council of
Applied Economic Research (NCAER) survey of human development in India has also revealed the same
picture - 50 per cent of the rural population suffer from ‘capability-poverty’; 43 per cent of rural
household have domestic lighting, only 25 per cent have access to tap water and mere 33 per cent can
utilize public distribution facility (Shariff, 1999).
Under-nutrition is a major problem in every part of India but it is most prevalent in states of Bihar, Uttar
Pradesh, Madhya Pradesh and Rajasthan, where more than half of the children are underweight and
stunted. In addition to these four states, about half of children are underweight in Orissa, Maharashtra and
West Bengal. Similarly, about half of children are stunted in Assam and Haryana. States with the lowest
percentages of underweight and stunted children are Goa, Kerala, and all the small northeastern states
except Tripura and Meghalaya (Arnold, Nangia and Kapila, 2004).
Uttar Pradesh is the fifth largest state of India in terms of area (238,566 km2) and largest in terms of
population (166,052,859). But the point of grief is its poor performance on all economic indicators. The
NFHS II (1998-99) data indicates very high prevalence of malnutrition in the state. Therefore, for policy
implications, it is essential to see the nutritional level of children and to understand the background
variables which would explain high undernourishment of children.
Different rounds of NFHS and RCH (Reproductive and Child Health Survey) data sets provide
information on the household’s wealth status and malnutrition status of children. There have been various
studies conducted by International Institute for Population Sciences (IIPS, Mumbai) on issues related to
child nutrition and structure of households. They provide an opportunity for analyzing in structure of
households and child and women malnutrition and check the strength of relationship between the two
variables. This paper tries to address these issues.
Objective of the Study: To examine the differentials of nutritional level of children and women in
reproductive age-group15-49 years by their household structure in both the state of India.
Data Methodology
The data used in this analysis are drawn from the nationally representative 2005-06 National Family
Health Survey (NFHS-III) of 124385 ever-married women aged 15-49 years, 12,183 and 3566 women
aged 15-49 in Orissa and Kerala and 5684 and 1017 child aged 0-60 months in Uttar Pradesh and Kerala
for whom complete information is available with regards to health and households characteristics. We
restrict our analysis to only those households that had children born in the 5 years prior to survey.
We measured child nutrition using two anthropometric measures: a child’s height-for-age, and weight-for-
height, both are expressed in standard deviations (Z-scores) from the median of the reference population,
this being the commonly used US National Center for Health Statistics (NCHS) standard as recommended
for use by the World Health Organization (WHO). The height-for-age Z-score measures the child’s height
according to age, this being an indicator that reflects the cumulative effects of growth deficiency and so is
designed to measure long-term nutrition. The weight-for-height Z-score measures the child’s weight
according to height, where this indicator has been used to monitor the growth of children and is typically
regarded as a measure of short term rather than long term health status. Both anthropometric measures are
influenced by a number of factors including chronic insufficient women’s Health, women’s education,
household facilities, and low socio-economic family status. However, these anthropometric measures are
widely regarded by nutritionists as a reliable indicator of malnutrition. For women nutrition using body
mass index (BMI), information on the height and weight of women age. The same scales and measuring
boards used to measure children were used for women. Women’s height can be used to identify women at
risk of having a difficult delivery, since small stature is often related to small pelvic size. The cutoff point
height, below which women can be identified as nutritionally at risk, varies among populations, but it is
usually considered to be in the range of 140-150 cm. BMI is defined as weight in kilograms divided by
height in metres squared (kg/m2).This index excludes women who were pregnant at the time of the survey
and women who gave birth during the two months preceding the survey. A cutoff point of 18.5 is used to
define thinness or acute under nutrition and a BMI of 25 or above indicators overweight or obesity.
Utilizing NFHS-III, information on background, socio-economic and health characteristics, such as
religion, source of drinking water, source of cooking, residence, caste, the dependent variables are
Nutritional status of women and children. Of the several variables used in this study, besides cross
tabulations, a regression analysis is also done to understand the factors influencing nutritional status of
women and children in Kerala and Uttar Pradesh.
Percentage of children under five years classified by nutritional status and selected background
characteristics for India, 2005-06
Table 1 Shows that the nutritional status of children by selected background characteristics. In India,
about 18 percent children are severely malnourished whereas 55 percent children are normal are belong to
25- 36 months. 67 percent children are normal whereas 10 percent children are underweight in urban area
and 18 percent children are underweight in rural areas. Religion wise distribution are showing that less
number of children are severe malnourished in Sikh as compared to Hindu and Muslim religion. In the
caste distribution, 11 percent children are underweight and 66 percent children are normal in others
category which are less number of underweight children. According to source of drinking water, those
children are using piped as source of drinking water number of normal children is 69 percent and 10
percent children are under weight and those are using tube well as a source of drinking water, highest
number of children are underweight. Biogas and LPG are available their number of normal children is
higher than other source of cooking. Those children are belonging to non-nuclear household structure,
they are 60 percent normal children and 14 percent children are severe malnourished whereas 18 percent
children are underweight are belonging to nuclear household structure.
Percentage of children under five years classified by nutritional status and selected background
characteristics for Uttar Pradesh, 2005-06
Table 2 Shows that the nutritional status of children by selected background characteristics. In UP, about
14 percent children are severely malnourished belong to 0-12 age group whereas 66 percent children are
having normal status of nutrition. Highest percent of severe malnourished children are belonging to age-
group 49-59. 13 percent children are severe malnourished is lowest in urban areas as compared to rural
areas. Religion wise distribution is showing that highest percent of children are having underweight in
Muslim as compared to other religions whereas highest percent of children are having normal status of

nutrition in Sikh religion than other. In caste, highest percent of children are having normal status of
nutrition in others as compared to other categories and lowest numbers of children are belonging to OBC.
Those children having source of drinking water such as piped, they are 68 percent normal children and 12
percent children are severe malnourished. Electricity and LPG, are available their highest number of
children are normal status of nutrition in UP. 19 percent children are underweight those are belonging to
nuclear household structure which are higher number as compared to Non-nuclear household structure.
Percentage of children under five years classified by nutritional status and selected background
characteristics for Kerala, 2005-06
Table 3 shows that the nutritional status of children by selected background characteristics. In Kerala,
about 5 percent children are severely malnourished belong to 13-24 age group whereas 88 percent children
are normal are belong to 0-12 age group. 84 percent children are normal and 2 percent children are
underweight in urban areas and 73 percent children are normal whereas 6 percent children are severe
malnourished in rural areas. Religion wise distribution is showing that highest number of normal children
and lowest numbers of underweight children are belonging to Christian religion. In caste, highest number
of normal children in OBC as compared to other categories and lowest number of children are also
belonging to OBC. those children having source of drinking water such as piped, they are 79 percent
normal children and 4 percent children are severe malnourished. Electricity, Biogas and kerosene are
available their highest number of children are normal in kerala. 3 percent children are underweight those
are belonging to nuclear household structure which are lower number as compared to Non-nuclear
household structure.
Relative risks ratios from multinomial logistic regression for weight-for-age (underweight) by selected
background characteristics in India, 2005-06.
Table 4 reveals that children who belong to age–group 25-29 months are significantly 15 times more
likely to severe malnourished as compared to children in 15-19 months in India. As compared to Hindu,
Severe and Moderate malnourished are less likely to have underweight children in others category.
Similarly, caste wise distribution shows that compared to SC, Severe and Moderate malnourished are less
likely to have underweight children in other category. In according to water facilities, as compared to
piped severe and malnourished are more likely to have underweight children in different source of water.
Similarly, facilities of cooking, as compared to stove severe and moderate malnourished are less likely to
have underweight children by chullah and open fire. According to household structure, non-nuclear
households severe and moderate are less likely to have underweight children as compared to nuclear

structure.
Relative risks ratios from multinomial logistic regression for weight-for-age (underweight) by
selected background characteristics in Uttar Pradesh, 2005-06
Table 5 reveals that children who belong to age–group 20-24 months are significantly 5 times more likely
to severe and moderate malnourished as compared to children in 15-19 months in India. In rural areas are
showing that more likely to severe and less likely to moderate malnourished to have underweight
children as compared to urban areas. As compared to Hindu, Severe malnourished are more likely to have
underweight children in Muslim. Similarly, caste wise distribution shows that as compared to SC,
significantly 6 times severe malnourished are less likely to have underweight children in others category.
Sources of drinking water are showing that as compared to piped, well are more likely to severe
malnourished to have underweight children. in this way we can say that sources of cooking are revealing
that other are more likely to moderate and severe malnourished to have underweight children and those
children are belonging from non-nuclear household structure they are significantly less likely to severe
and moderate malnourished as compared to nuclear household structure.
Relative risks ratios from multinomial logistic regression for weight-for-age (underweight) by
selected background characteristics in Kerala, 2005-06
Table 6 reveals that children who belong to age–group 35-39 months are significantly 1 time more likely
to severe malnourished and significantly 3 times like to moderate malnourished as compared to children in
15-19 months in India. In rural areas are showing that significantly 2 times more likely to severe and
moderate malnourished to have underweight children as compared to urban areas. As compared to Hindu,
Severe and Moderate malnourished are less likely to have underweight children in Christian religion.
Similarly, caste wise distribution shows that compared to SC, Severe and Moderate malnourished are less
likely to have underweight children in OBC and others category. Sources of drinking water are showing
that as compared to piped less like to moderate malnourished to have underweight children. in this way we
can say that sources of cooking are revealing that other are significantly 26 times more likely to moderare
and significantly 14 times more likely to severe malnourished to have underweight children and those
children are belonging from non-nuclear household structure they are less likely to severe and moderate
malnourished as compared to nuclear household structure.
Table –7 India (Re-Women) reveals that women who belong to age–group 40-44 years are significantly
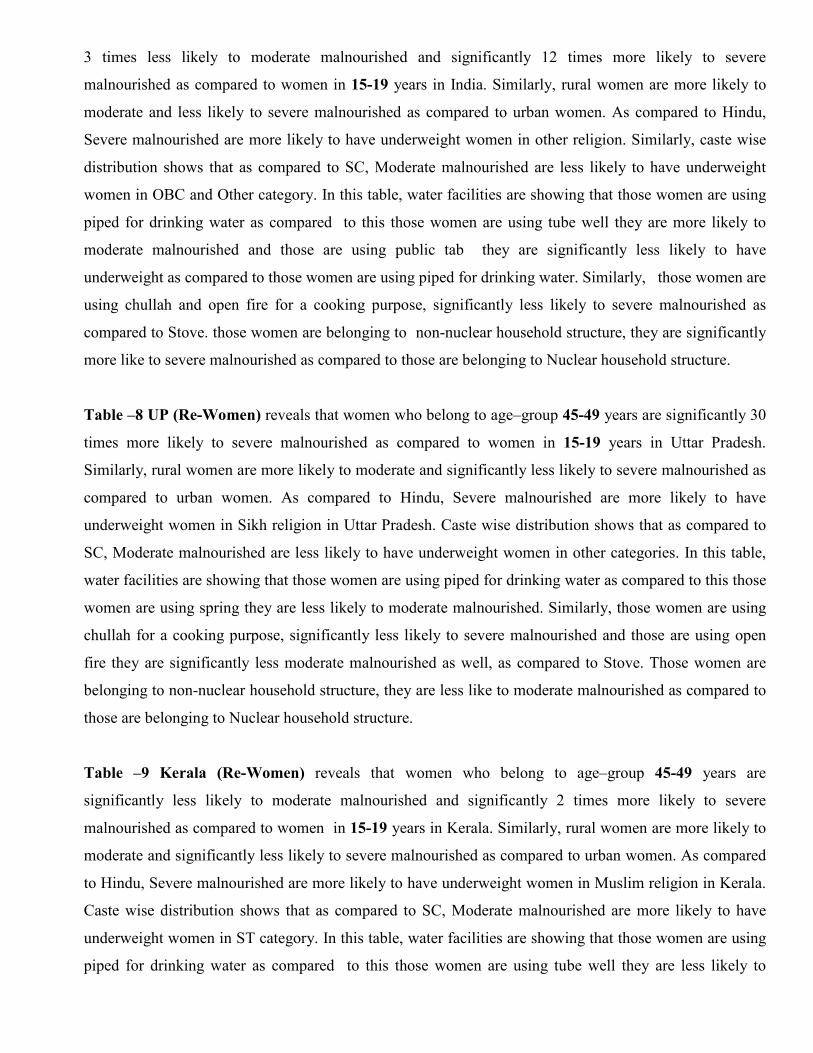
3 times less likely to moderate malnourished and significantly 12 times more likely to severe
malnourished as compared to women in 15-19 years in India. Similarly, rural women are more likely to
moderate and less likely to severe malnourished as compared to urban women. As compared to Hindu,
Severe malnourished are more likely to have underweight women in other religion. Similarly, caste wise
distribution shows that as compared to SC, Moderate malnourished are less likely to have underweight
women in OBC and Other category. In this table, water facilities are showing that those women are using
piped for drinking water as compared to this those women are using tube well they are more likely to
moderate malnourished and those are using public tab they are significantly less likely to have
underweight as compared to those women are using piped for drinking water. Similarly, those women are
using chullah and open fire for a cooking purpose, significantly less likely to severe malnourished as
compared to Stove. those women are belonging to non-nuclear household structure, they are significantly
more like to severe malnourished as compared to those are belonging to Nuclear household structure.
Table –8 UP (Re-Women) reveals that women who belong to age–group 45-49 years are significantly 30
times more likely to severe malnourished as compared to women in 15-19 years in Uttar Pradesh.
Similarly, rural women are more likely to moderate and significantly less likely to severe malnourished as
compared to urban women. As compared to Hindu, Severe malnourished are more likely to have
underweight women in Sikh religion in Uttar Pradesh. Caste wise distribution shows that as compared to
SC, Moderate malnourished are less likely to have underweight women in other categories. In this table,
water facilities are showing that those women are using piped for drinking water as compared to this those
women are using spring they are less likely to moderate malnourished. Similarly, those women are using
chullah for a cooking purpose, significantly less likely to severe malnourished and those are using open
fire they are significantly less moderate malnourished as well, as compared to Stove. Those women are
belonging to non-nuclear household structure, they are less like to moderate malnourished as compared to
those are belonging to Nuclear household structure.
Table –9 Kerala (Re-Women) reveals that women who belong to age–group 45-49 years are
significantly less likely to moderate malnourished and significantly 2 times more likely to severe
malnourished as compared to women in 15-19 years in Kerala. Similarly, rural women are more likely to
moderate and significantly less likely to severe malnourished as compared to urban women. As compared
to Hindu, Severe malnourished are more likely to have underweight women in Muslim religion in Kerala.
Caste wise distribution shows that as compared to SC, Moderate malnourished are more likely to have
underweight women in ST category. In this table, water facilities are showing that those women are using
piped for drinking water as compared to this those women are using tube well they are less likely to
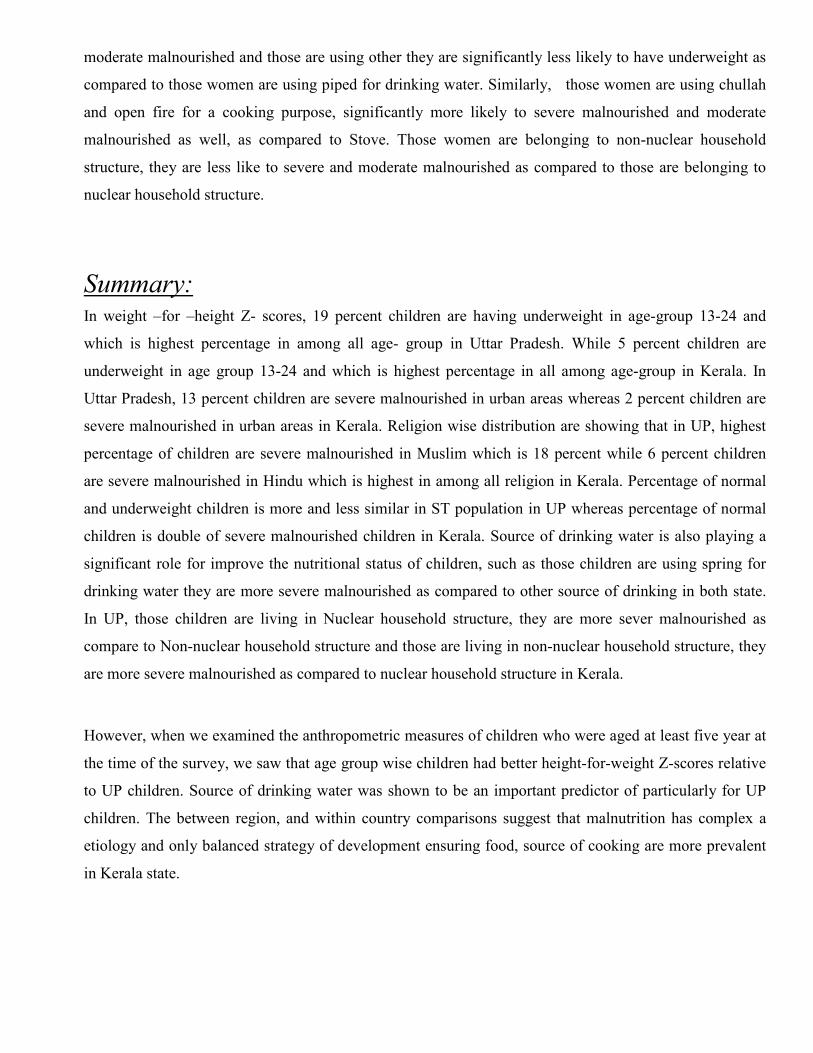
moderate malnourished and those are using other they are significantly less likely to have underweight as
compared to those women are using piped for drinking water. Similarly, those women are using chullah
and open fire for a cooking purpose, significantly more likely to severe malnourished and moderate
malnourished as well, as compared to Stove. Those women are belonging to non-nuclear household
structure, they are less like to severe and moderate malnourished as compared to those are belonging to
nuclear household structure.
Summary: In weight –for –height Z- scores, 19 percent children are having underweight in age-group 13-24 and
which is highest percentage in among all age- group in Uttar Pradesh. While 5 percent children are
underweight in age group 13-24 and which is highest percentage in all among age-group in Kerala. In
Uttar Pradesh, 13 percent children are severe malnourished in urban areas whereas 2 percent children are
severe malnourished in urban areas in Kerala. Religion wise distribution are showing that in UP, highest
percentage of children are severe malnourished in Muslim which is 18 percent while 6 percent children
are severe malnourished in Hindu which is highest in among all religion in Kerala. Percentage of normal
and underweight children is more and less similar in ST population in UP whereas percentage of normal
children is double of severe malnourished children in Kerala. Source of drinking water is also playing a
significant role for improve the nutritional status of children, such as those children are using spring for
drinking water they are more severe malnourished as compared to other source of drinking in both state.
In UP, those children are living in Nuclear household structure, they are more sever malnourished as
compare to Non-nuclear household structure and those are living in non-nuclear household structure, they
are more severe malnourished as compared to nuclear household structure in Kerala.
However, when we examined the anthropometric measures of children who were aged at least five year at
the time of the survey, we saw that age group wise children had better height-for-weight Z-scores relative
to UP children. Source of drinking water was shown to be an important predictor of particularly for UP
children. The between region, and within country comparisons suggest that malnutrition has complex a
etiology and only balanced strategy of development ensuring food, source of cooking are more prevalent
in Kerala state.

Table 1: Percentage of children under five years classified by nutritional status and
selected background characteristics for India, 2005-06.
India- Child
Age 5-year groups Normal Moderate Severe
0-12 66.50 20.90 12.70
13-24 56.00 26.80 17.20
25-36 54.50 27.50 18.00
37-48 54.00 29.00 17.00
49-59 55.20 29.80 15.00
Type of place of
residence
Urban 67.00 22.20 10.80
Rural 54.00 28.30 17.70
Religion Hindu 56.40 27.30 16.30
Muslim 57.80 26.40 15.90
Christian 69.60 21.10 9.30
Sikh 78.30 14.00 7.70
others 54.70 24.90 20.40
Caste SC 51.70 29.60 18.70
ST 45.10 29.80 25.10
OBC 56.40 27.50 16.10
OTHERS 66.20 22.60 11.20
Drinking Water
Piped 69.20 21.00 9.80
Public
Tab 59.40 26.70 13.90
Tubewell 53.00 28.70 18.30
Well 54.80 27.50 17.70
Spring 54.00 27.40 18.70
OTHERS 63.80 23.70 12.60
Food_Cooked Electicity 65.20 22.00 12.80
LPG 75.60 17.60 6.80
Biogas 77.70 18.50 3.80
Kerosene 60.60 26.70 12.70
wood n
Ag Crop 53.00 28.80 18.20
Household structure
Nuclear 54.20 27.90 18.00
Non-
nuclear 59.80 25.90 14.30
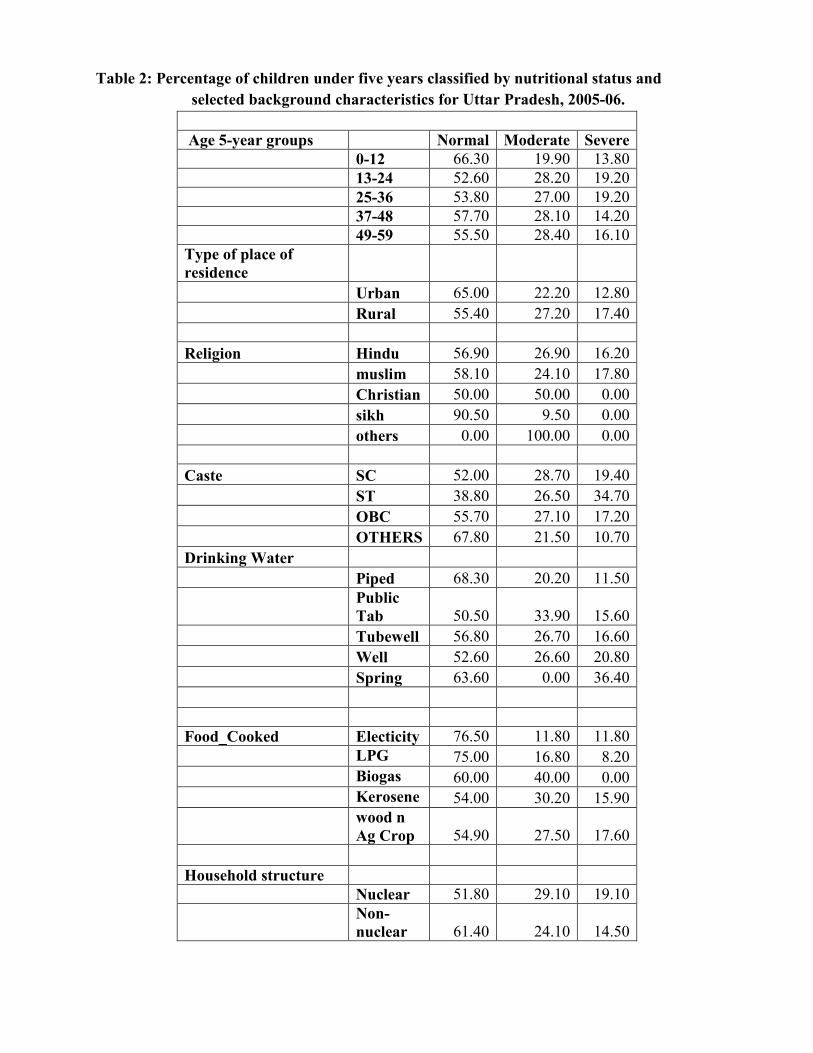
Table 2: Percentage of children under five years classified by nutritional status and
selected background characteristics for Uttar Pradesh, 2005-06.
Age 5-year groups Normal Moderate Severe
0-12 66.30 19.90 13.80
13-24 52.60 28.20 19.20
25-36 53.80 27.00 19.20
37-48 57.70 28.10 14.20
49-59 55.50 28.40 16.10
Type of place of
residence
Urban 65.00 22.20 12.80
Rural 55.40 27.20 17.40
Religion Hindu 56.90 26.90 16.20
muslim 58.10 24.10 17.80
Christian 50.00 50.00 0.00
sikh 90.50 9.50 0.00
others 0.00 100.00 0.00
Caste SC 52.00 28.70 19.40
ST 38.80 26.50 34.70
OBC 55.70 27.10 17.20
OTHERS 67.80 21.50 10.70
Drinking Water
Piped 68.30 20.20 11.50
Public
Tab 50.50 33.90 15.60
Tubewell 56.80 26.70 16.60
Well 52.60 26.60 20.80
Spring 63.60 0.00 36.40
Food_Cooked Electicity 76.50 11.80 11.80
LPG 75.00 16.80 8.20
Biogas 60.00 40.00 0.00
Kerosene 54.00 30.20 15.90
wood n
Ag Crop 54.90 27.50 17.60
Household structure
Nuclear 51.80 29.10 19.10
Non-
nuclear 61.40 24.10 14.50

Table 3: Percentage of children under five years classified by nutritional status and
selected background characteristics for Kerala, 2005-06.
Age 5-year groups Normal Moderate Severe
0-12 87.80 9.30 2.90
13-24 73.80 20.80 5.40
25-36 76.30 19.10 4.60
37-48 77.00 18.20 4.80
49-59 70.20 24.90 5.00
Type of place of residence
Urban 84.40 13.20 2.40
Rural 73.30 21.10 5.60
Religion Hindu 74.60 19.60 5.80
Muslim 76.60 18.90 4.50
Christian 85.60 13.60 0.80
Sikh 0.00 100.00 0.00
others
Caste SC 65.70 27.30 7.10
ST 43.50 39.10 17.40
OBC 80.50 15.50 4.00
OTHERS 77.30 18.00 4.70
Drinking Water
Piped 78.90 17.30 3.80
Public Tab 76.80 18.20 5.10
Tubewell 80.00 16.70 3.30
Well 76.80 18.50 4.70
Spring 57.90 36.80 5.30
Food_Cooked Electicity 100.00 0.00 0.00
LPG 84.00 11.80 4.20
Biogas 100.00 0.00 0.00
Kerosene 100.00 0.00 0.00
wood n Ag
Crop 73.80 21.30 4.80
Household structure
Nuclear 73.70 23.00 3.30
Non-nuclear 78.00 16.80 5.10
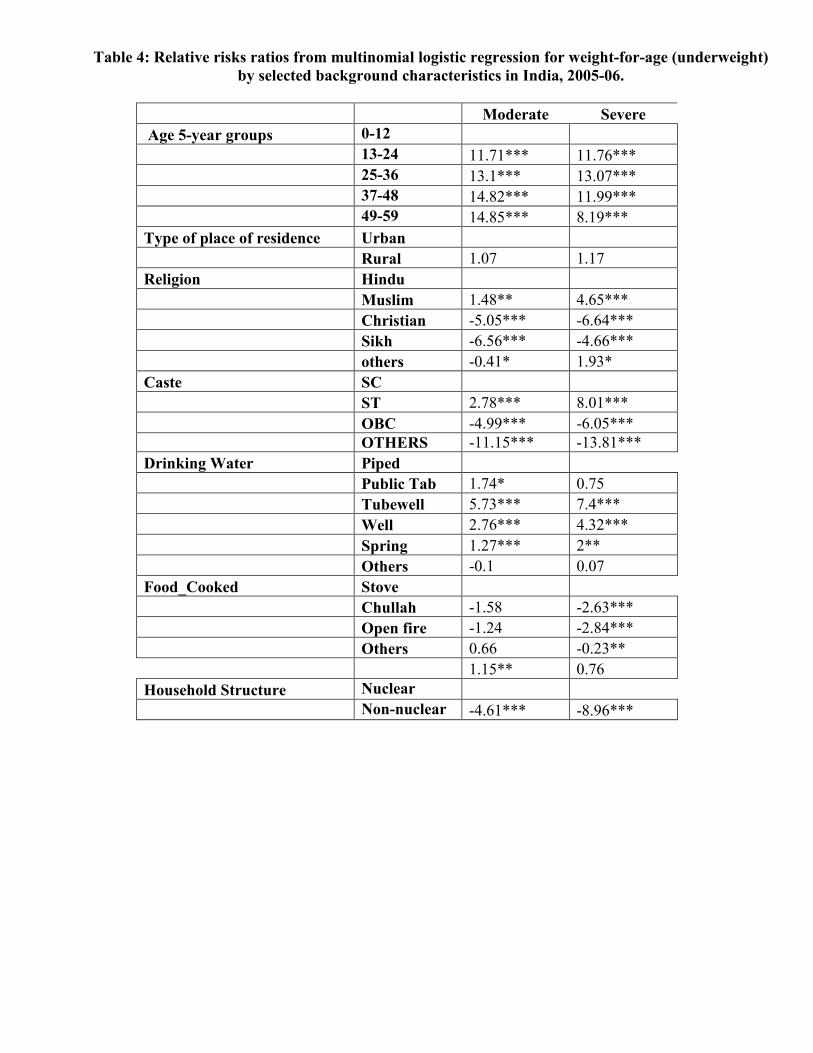
Table 4: Relative risks ratios from multinomial logistic regression for weight-for-age (underweight)
by selected background characteristics in India, 2005-06.
Moderate Severe
Age 5-year groups 0-12
13-24 11.71*** 11.76***
25-36 13.1*** 13.07***
37-48 14.82*** 11.99***
49-59 14.85*** 8.19***
Type of place of residence Urban
Rural 1.07 1.17
Religion Hindu
Muslim 1.48** 4.65***
Christian -5.05*** -6.64***
Sikh -6.56*** -4.66***
others -0.41* 1.93*
Caste SC
ST 2.78*** 8.01***
OBC -4.99*** -6.05***
OTHERS -11.15*** -13.81***
Drinking Water Piped
Public Tab 1.74* 0.75
Tubewell 5.73*** 7.4***
Well 2.76*** 4.32***
Spring 1.27*** 2**
Others -0.1 0.07
Food_Cooked Stove
Chullah -1.58 -2.63***
Open fire -1.24 -2.84***
Others 0.66 -0.23**
1.15** 0.76
Household Structure Nuclear
Non-nuclear -4.61*** -8.96***
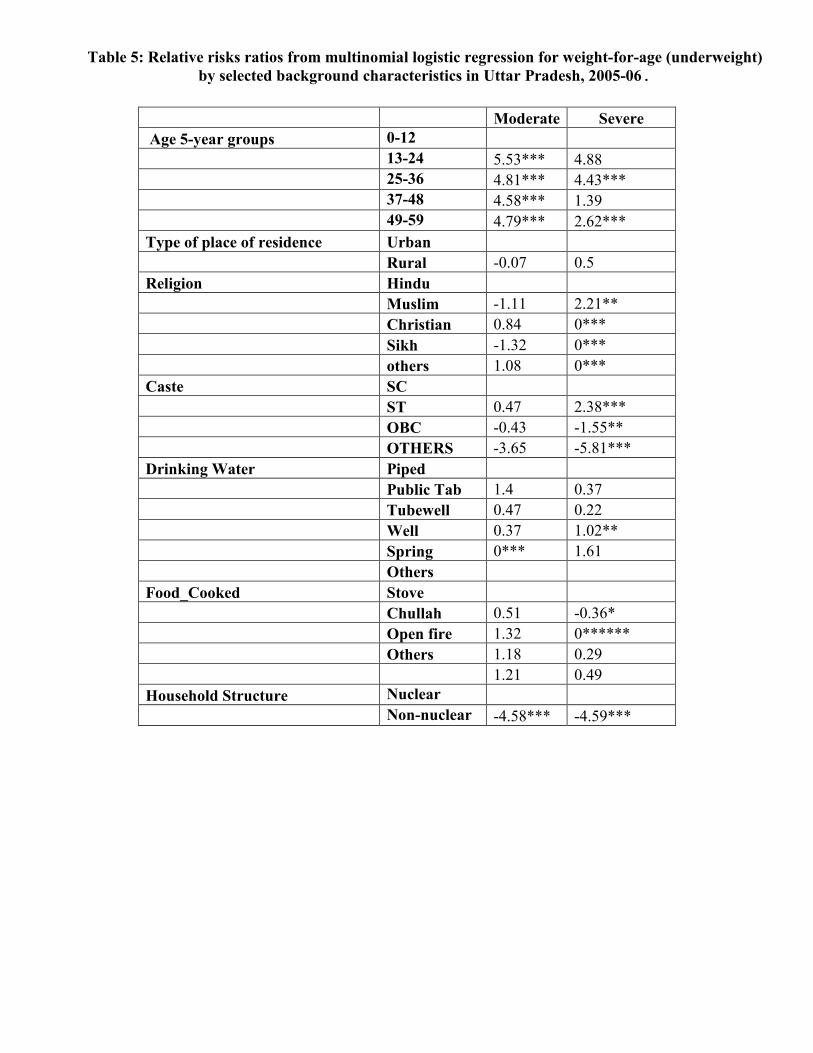
Table 5: Relative risks ratios from multinomial logistic regression for weight-for-age (underweight)
by selected background characteristics in Uttar Pradesh, 2005-06.
Moderate Severe
Age 5-year groups 0-12
13-24 5.53*** 4.88
25-36 4.81*** 4.43***
37-48 4.58*** 1.39
49-59 4.79*** 2.62***
Type of place of residence Urban
Rural -0.07 0.5
Religion Hindu
Muslim -1.11 2.21**
Christian 0.84 0***
Sikh -1.32 0***
others 1.08 0***
Caste SC
ST 0.47 2.38***
OBC -0.43 -1.55**
OTHERS -3.65 -5.81***
Drinking Water Piped
Public Tab 1.4 0.37
Tubewell 0.47 0.22
Well 0.37 1.02**
Spring 0*** 1.61
Others
Food_Cooked Stove
Chullah 0.51 -0.36*
Open fire 1.32 0******
Others 1.18 0.29
1.21 0.49
Household Structure Nuclear
Non-nuclear -4.58*** -4.59***

Table 6: Relative risks ratios from multinomial logistic regression for weight-for-age (underweight)
by selected background characteristics in Kerala, 2005-06.
Moderate Severe
Age 5-year groups 0-12
13-24 2.47*** 1.34
25-36 2.78*** 1.05
37-48 1.85* 0.97**
49-59 3.13*** 1.05
Type of place of residence Urban
Rural 1.97** 2.24**
Religion Hindu
Muslim 0.09 0.28
Christian -0.41* -1.2**
Sikh . 0***
others
Caste SC
ST 1.43 2.25***
OBC -2.16** -1.31
OTHERS -1.42 -0.89
Drinking Water Piped
Public Tab -0.7 0.66
Tubewell -0.26 0.11
Well -0.88 0.47
Spring -0.26 0.15
Others
Food_Cooked Stove 25.2*** 15.14***
Chullah 0*** 0***
Open fire 0*** 0***
Others 26.77*** 14.7***
Household Structure Nuclear
Non-nuclear -2.08** 0.99**
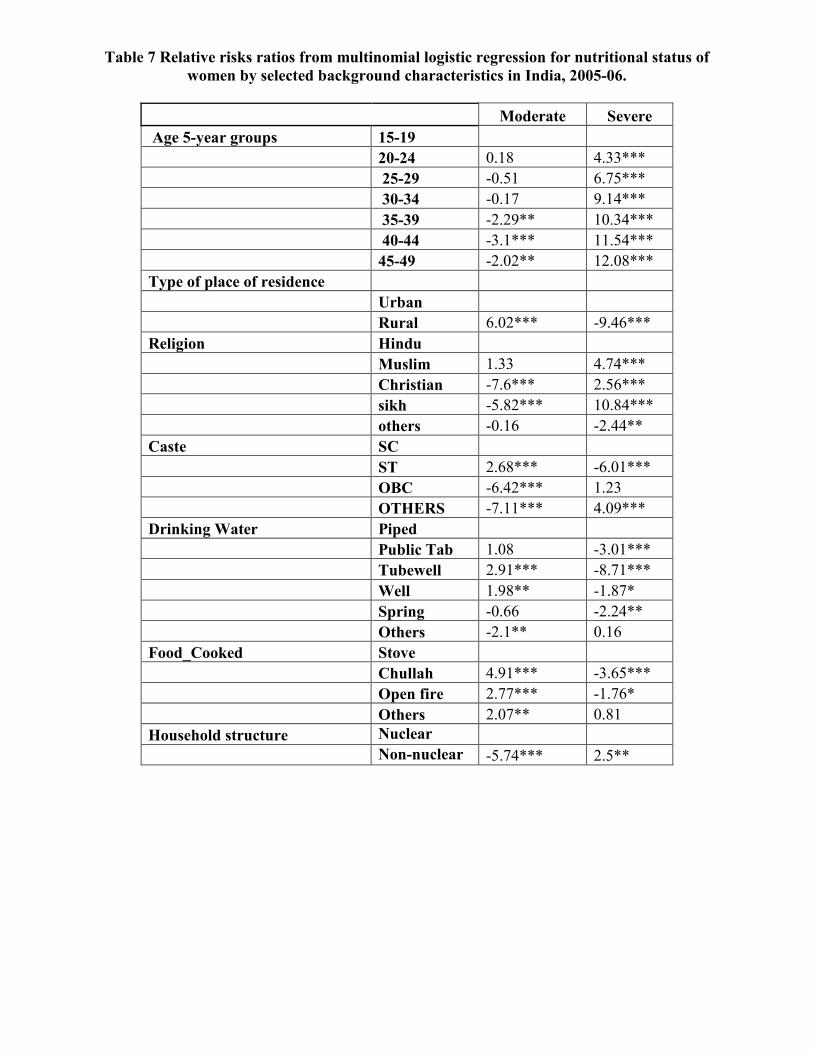
Table 7 Relative risks ratios from multinomial logistic regression for nutritional status of
women by selected background characteristics in India, 2005-06.
Moderate Severe
Age 5-year groups 15-19
20-24 0.18 4.33***
25-29 -0.51 6.75***
30-34 -0.17 9.14***
35-39 -2.29** 10.34***
40-44 -3.1*** 11.54***
45-49 -2.02** 12.08***
Type of place of residence
Urban
Rural 6.02*** -9.46***
Religion Hindu
Muslim 1.33 4.74***
Christian -7.6*** 2.56***
sikh -5.82*** 10.84***
others -0.16 -2.44**
Caste SC
ST 2.68*** -6.01***
OBC -6.42*** 1.23
OTHERS -7.11*** 4.09***
Drinking Water Piped
Public Tab 1.08 -3.01***
Tubewell 2.91*** -8.71***
Well 1.98** -1.87*
Spring -0.66 -2.24**
Others -2.1** 0.16
Food_Cooked Stove
Chullah 4.91*** -3.65***
Open fire 2.77*** -1.76*
Others 2.07** 0.81
Household structure Nuclear
Non-nuclear -5.74*** 2.5**

Table 8 Relative risks ratios from multinomial logistic regression for nutritional status of
women by selected background characteristics in Uttar Pradesh, 2005-06.
Moderate Severe
Age 5-year groups 15-19
20-24 -1.33 23.13***
25-29 -0.83 28.31***
30-34 -0.14 29.9***
35-39 -0.23 30.06***
40-44 -0.23 30.94***
45-49 -0.48 30.44***
Type of place of residence Urban
Rural 0.24 -3.38***
Religion Hindu
Muslim -0.76 -0.99
Christian 0 0
Sikh 0.02 0.63*
others
Caste SC
ST -0.02 1.19
OBC -1.77 2.08**
OTHERS -2.47 3.5***
Drinking Water Piped
Public Tab 0.78 0***
Tubewell 0.68 -0.9
Well 1.14 0.03
Spring -0.56 0***
Others
Food_Cooked Stove
Chullah 0.25 -2.15**
Open fire -0.57* 0***
Others 0.58 0***
Household structure Nuclear
Non-nuclear -4.34*** 0.66
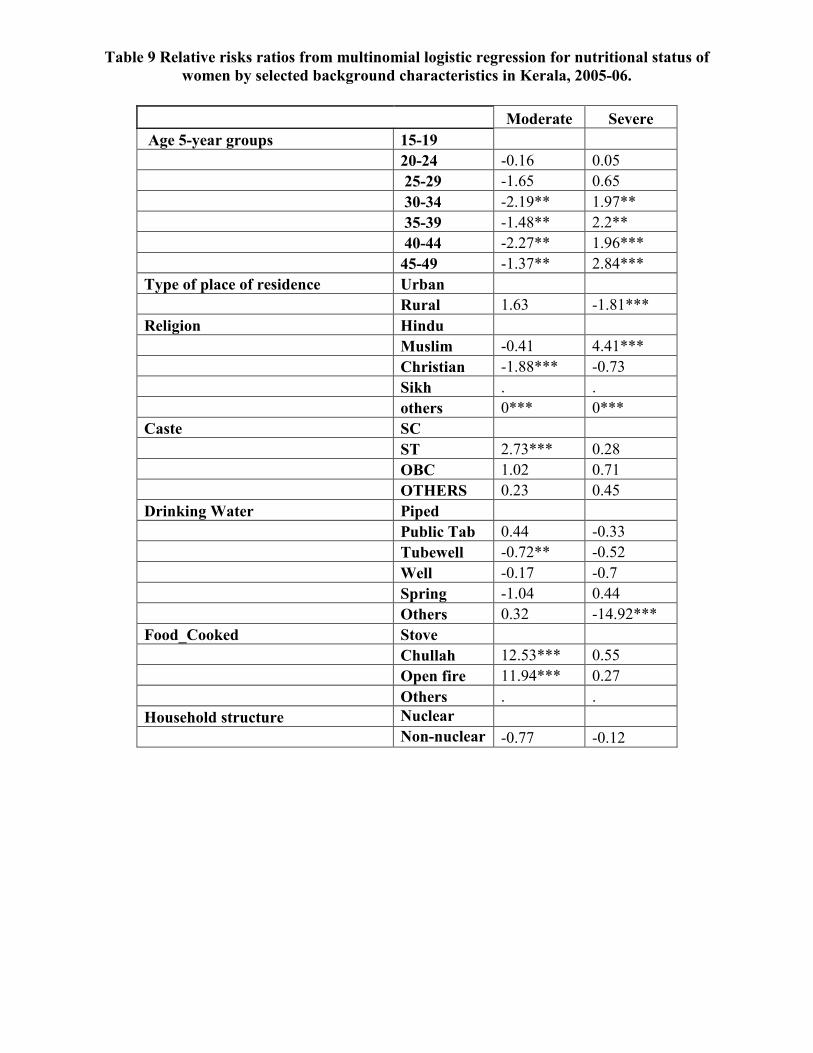
Table 9 Relative risks ratios from multinomial logistic regression for nutritional status of
women by selected background characteristics in Kerala, 2005-06.
Moderate Severe
Age 5-year groups 15-19
20-24 -0.16 0.05
25-29 -1.65 0.65
30-34 -2.19** 1.97**
35-39 -1.48** 2.2**
40-44 -2.27** 1.96***
45-49 -1.37** 2.84***
Type of place of residence Urban
Rural 1.63 -1.81***
Religion Hindu
Muslim -0.41 4.41***
Christian -1.88*** -0.73
Sikh . .
others 0*** 0***
Caste SC
ST 2.73*** 0.28
OBC 1.02 0.71
OTHERS 0.23 0.45
Drinking Water Piped
Public Tab 0.44 -0.33
Tubewell -0.72** -0.52
Well -0.17 -0.7
Spring -1.04 0.44
Others 0.32 -14.92***
Food_Cooked Stove
Chullah 12.53*** 0.55
Open fire 11.94*** 0.27
Others . .
Household structure Nuclear
Non-nuclear -0.77 -0.12
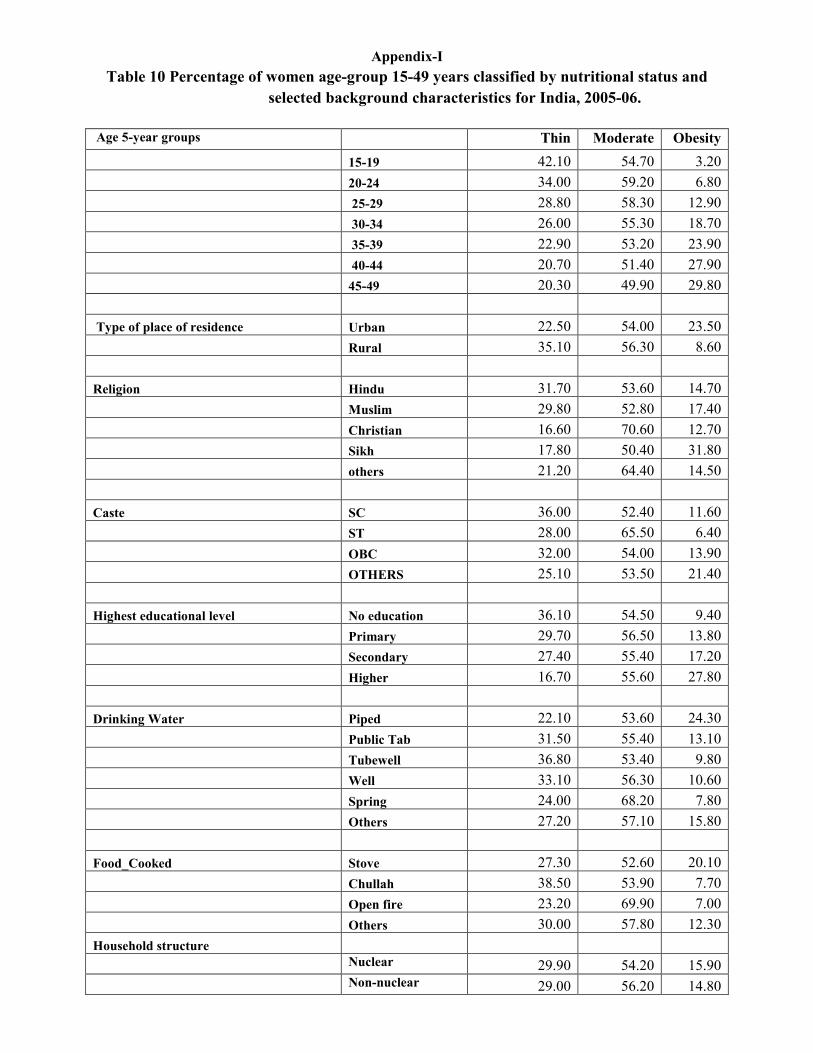
Appendix-I
Table 10 Percentage of women age-group 15-49 years classified by nutritional status and
selected background characteristics for India, 2005-06.
Age 5-year groups Thin Moderate Obesity
15-19 42.10 54.70 3.20
20-24 34.00 59.20 6.80
25-29 28.80 58.30 12.90
30-34 26.00 55.30 18.70
35-39 22.90 53.20 23.90
40-44 20.70 51.40 27.90
45-49 20.30 49.90 29.80
Type of place of residence Urban 22.50 54.00 23.50
Rural 35.10 56.30 8.60
Religion Hindu 31.70 53.60 14.70
Muslim 29.80 52.80 17.40
Christian 16.60 70.60 12.70
Sikh 17.80 50.40 31.80
others 21.20 64.40 14.50
Caste SC 36.00 52.40 11.60
ST 28.00 65.50 6.40
OBC 32.00 54.00 13.90
OTHERS 25.10 53.50 21.40
Highest educational level No education 36.10 54.50 9.40
Primary 29.70 56.50 13.80
Secondary 27.40 55.40 17.20
Higher 16.70 55.60 27.80
Drinking Water Piped 22.10 53.60 24.30
Public Tab 31.50 55.40 13.10
Tubewell 36.80 53.40 9.80
Well 33.10 56.30 10.60
Spring 24.00 68.20 7.80
Others 27.20 57.10 15.80
Food_Cooked Stove 27.30 52.60 20.10
Chullah 38.50 53.90 7.70
Open fire 23.20 69.90 7.00
Others 30.00 57.80 12.30
Household structure
Nuclear 29.90 54.20 15.90
Non-nuclear 29.00 56.20 14.80

Appendix-II
Table 11 Percentage of women age-group 15-49 years classified by nutritional status and
selected background characteristics for Uttar Pradesh, 2005-06.
Thin Moderate Obesity
Age 5-year groups 15-19 41.00 56.90 2.10
20-24 33.30 60.20 6.50
25-29 28.60 57.90 13.50
30-34 31.30 52.50 16.20
35-39 26.80 50.60 22.60
40-44 25.80 48.50 25.80
45-49 24.30 45.30 30.40
Type of place of residence
Urban 23.50 52.20 24.30
Rural 37.80 56.30 5.90
Religion Hindu 32.30 54.70 13.00
Muslim 30.80 55.00 14.20
Christian 45.50 54.50 0.00
Sikh 15.60 51.60 32.80
others 20.80 37.70 41.50
Caste SC 38.60 53.90 7.50
ST 42.50 53.80 3.80
OBC 33.40 56.20 10.40
OTHERS 24.60 52.70 22.60
Highest educational level No education 36.40 54.90 8.70
Primary 30.50 57.10 12.30
Secondary 30.40 54.90 14.70
Higher 16.70 49.20 34.00
Drinking Water
Piped 20.60 49.90 29.50
Public Tab 40.90 48.40 10.80
Tubewell 34.40 55.40 10.20
Well 41.30 53.50 5.30
Spring 20.00 60.00 20.00
Others 29.10 62.10 8.70
Food_Cooked Stove 29.20 52.30 18.50
Chullah 37.60 55.40 7.00
Open fire 60.00 40.00 0.00
Others 29.20 62.40 8.50
Household structure
Nuclear 34.50 51.80 13.80
Non-nuclear 29.80 56.40 13.80

Appendix-III
Table 11 Percentage of women age-group 15-49 years classified by nutritional status and
selected background characteristics for Kerala, 2005-06.
Kerala
Thin Moderate Obesity
Age 5-year groups 15-19 36.20 57.50 6.20
20-24 28.20 56.50 15.30
25-29 16.70 57.40 25.90
30-34 11.90 52.60 35.50
35-39 12.90 51.40 35.70
40-44 9.60 51.00 39.40
45-49 9.40 47.40 43.20
Type of place of residence
Urban 15.10 51.70 33.20
Rural 19.50 54.60 25.90
Religion Hindu 19.90 55.00 25.10
Muslim 15.60 51.30 33.10
Christian 14.30 52.90 32.90
others 66.70 16.70 16.70
Caste SC 22.10 58.60 19.30
ST 42.30 42.30 15.40
OBC 17.40 53.00 29.60
OTHERS 17.60 53.20 29.20
Highest educational level No education 17.40 56.10 26.50
Primary 17.40 56.10 26.50
Secondary 18.80 52.90 28.30
Higher 15.60 54.60 29.80
Drinking Water
Piped 13.50 53.60 32.90
Public Tab 23.60 51.70 24.60
Tubewell 19.10 48.90 31.90
Well 17.40 54.40 28.20
Spring 31.80 51.50 16.70
Others 15.50 51.80 32.60
Food Cooked Stove 14.30 57.10 28.60
Chullah 21.30 53.40 25.20
Open fire 18.10 58.50 23.40
Others 15.10 51.90 33.00
Household structure
Nuclear 19.20 52.20 28.60
Non-nuclear 17.10 55.10 27.80
