ny-13-0173 retail and consumer aspects - pwc.com · global retail and consumer team has gone one...
TRANSCRIPT

PwC’s Cities of Opportunity: Through a retail and consumer lens
December 2012
Moscow’s AFIMALL City


Dear R&C Colleagues:
The fifth edition of PwC’s annual Cities of Opportunity report was published in October 2012 and tracks the perfor-mance of 27 of the world’s key urban centers. Working with the project economists of Oxford Economics, our global retail and consumer team has gone one step further by analyzing the Cities data from a retail and consumer goods perspective.
This retail-and consumer-focused version of the Cities paper forecasts the levels of future potential urban consumer spend in each of the 27 locations, showing not only startling levels of potential growth but also areas of consid-erable risk. Most of all, it quantifies the ongoing importance of the retail and consumer sector to successful economic development.
Thanks for reading, and I hope you’ll take the opportunity to share these findings with your clients.
Best regards,
John Maxwell Global R&C Leader

PwC2 PwC2
The importance of the retail and consumer goods sector to the 27 key urban locations included in PwC’s 2012 Cities of Opportunity report is clear, as both a wealth creator and a key employer. Specifically, the 2012 Cities of Opportunity data reveals four key trends.
A shifting balance in urban spending
Despite the problems facing the global economy, particularly in mature cities, retail sales across the 27 Cities of Opportunity locations reached record levels in 2012, passing the $US1,100- billion mark. Mature markets still dominate in terms of spending levels, reflecting the higher prices and higher average incomes in those markets. For example, in value terms, the highest levels of total urban consumer spending are currently found in Tokyo, New York, and London, all of which each recorded retail sales greater than $US100 billion
in 2012. The growth of the emerging Cities of Opportunity, however, is shifting the balance toward greater spend in emerging markets. Of the 27 urban centers, emerging cities now account for 38% of total retail sales in 2012 compared with 34% in 2000.
There’s no doubt about it: the wealth and demographic profiles of the Cities of Opportunity are changing, reflecting patterns across the globe. One of the key drivers of change in the future retail and consumer goods market will be the accelerating growth in middle- and high-income emerging-market house-holds. That trend sets the foundation for
our favorable retail sales projections, and, long term, will bring newfound consumer purchasing power to urban centers previously unable to support significant “high-end” demand. In the short term, however, the Great Recession and its aftermath have altered the sector markedly, arresting the transition toward luxury spending in many locations temporarily.
Looking ahead across the 27 Cities of Opportunity locations, a staggering $US19.3 trillion of cumulative retail sales is projected by 2025. It equates to an average of $US1,500 billion of retail sales every year and reflects an annual
Executive summaryExecutive summary
Istanbul

3 PwC’s Cities of Opportunity: Through a retail and consumer lens
PwC’s 2012 Cities of Opportunity study covers 27 key global centers:
Abu Dhabi Beijing BerlinBuenos Aires Chicago Hong KongIstanbul Johannesburg Kuala LumpurLondon Los Angeles MadridMexico City Milan MoscowMumbai New York ParisSan Francisco São Paulo SeoulShanghai Singapore StockholmSydney Tokyo Toronto
Across the 27 key global centers in 2012:
• The population is 175 million;
• 88 million people are employed in all sectors combined; and
• $US5,700 billion of GVA is created.
Over the next 13 years, until 2025:
• The population is forecast to increase by 19 million;
• 14 million net additional jobs will be created across all sectors; and
• The total level of GVA created will reach close to $US9,000 billion by 2025.
growth rate of 3.9%. By 2025, in value terms, the largest levels of spend are still forecast to remain in the mature cities of Tokyo, New York, and London. In terms of average annual growth rates in retail sales over the forecast period, however, each of the top nine performers is predicted to be an emerging-city economy, with Beijing and Shanghai—the most populated of the 27 cities—leading the way. As a result, emerging cities are forecast to account for close to half of all urban spending across the Cities of Opportunity by 2025.
Continued growth in retail and consumer employment
Front-end employment in wholesale and retail currently amounts to 14.6 million people, producing $US715
billion of gross value added (GVA)1 in 2012 alone. Despite the challenges facing the sector as a whole, ranging from dampened levels of consumer spending in the short term to the impact that technology could have on retail jobs in the longer term, the number of people employed in the sector globally continues to rise. The retail and consumer sector is, in fact, the second-largest employer among the 27 cities studied. While trailing business services, it employs more individuals
1 GVA is a measure of the value of goods and services produced in an area, industry, or sector of an economy, and it measures output minus intermediate consumption. Total GVA is less than total GDP because it excludes value-added tax (VAT) and other product taxes, as well as subsidies. See the Key definitions section at the back of this report for a full glossary of definitions used.
than construction, manufacturing, or public administration.
The sector is an even larger employer in emerging cities. Of the 27 cities included in this study, only one mature city (Hong Kong) ranks among the top 8 in terms of proportion of total employ-ment in the retail and consumer sector.
Growth of 1.6 million net additional jobs is projected in the front-end wholesale and retail element over our forecast period of 2012–2025. The overall retail job forecasts are much stronger for emerging rather than mature markets, given their combination of demographics, escalating wealth, and strong local demand. In fact, fully 94% of net job growth in the sector from 2012 to 2025 will be driven by those Cities of Opportunity in emerging markets. Together, Beijing, Istanbul, Mumbai, and Shanghai are estimated to provide close to 90% of total retail and consumer job creation across the 27 global centers. Given the high levels of informal employment in emerging econ-omies, a significant proportion of the job creation in emerging cities like Mumbai would be in informal retail segments such as street stalls, as opposed to high-productivity, formal jobs at large retailers or consumer goods firms.
As far as the types of jobs created, the sector offers opportunities to a broad range of workers of varying skill levels, ages, statuses (full- or part-time), and gender, making it one of the most diverse and flexible sectors in terms of employment. The retail sector offers considerable opportunities for lower-skilled employment and in many cases, can offer a route to higher-skilled

PwC4
A note about our methodologyPwC’s Cities of Opportunity report, as well as this companion piece on the retail and consumer sector in the Cities of Opportunity, is based on publicly available data using three broad groups of sources: global multilateral development organizations such as the World Bank, national statistics organizations such as UK National Statistics, and commercial data providers. In the few instances in which verifiable city data are not available, country-level data are used as proxies.
For the retail and consumer urban spending measurements and forecasts in this particular report, Oxford Economics calculated location-based retail sales values, which accounts for all the money spent in a given location not only by residents but also by tourists, commuters, and busi-ness visitors.2 The level of overall consumer expenditure (consumption) cannot be used, as that accounts for spending on non–consumer goods like utilities, insurance, and health care. Moreover, it only accounts for the spending of residents and fails to capture spending by tourists, business visitors, commuters or residents outside the city boundaries.
opportunities either within the sector itself or beyond, such is the diversity of roles required. That key role in ensuring inclusive and cohesive labor markets and, by extension, cities is an often-overlooked strength of the retail and consumer goods sector.
An aging urban populationThe aging urban population across the globe will have a profound effect on retail patterns in the future. With people living longer, this poses challenges for governments but opportunities for the retail and consumer goods sector. By 2020, for the first time in human history, people aged 65 years and over will outnumber children under the age of 5.
This will undoubtedly change the distribution of consumer spending and retail sales across urban centers, but how that spending will change could greatly vary depending on the city. The income profile of the elderly varies across economies. Typically, the elderly in emerging economies are less rich and require financial support from their families, which acts as a drag on overall national consumer spending growth. In contrast, baby boomers in mature econo-mies are generally well-off financially and represent a major consumer growth opportunity.
The rise of technology as both an opportunity and a threatThe possibility of a technological and behavioral restructuring in retailing
2 The estimates relate to the PwC Cities of Opportunity boundaries and correspond with the bespoke forecast model designed by Oxford Economics and summarized in the PwC annual Cities of Opportunity report.
is a key risk and is worth exploring to measure its potential economic conse-quences. While online retailing can be a boon to global retailers trying to reach new markets, maintaining the high street experience within city centers will remain vital in upholding the vibrancy of the urban core as a tourism offering and in doing so, ensuring the longevity of the retail and consumer goods sector as a leading urban employer.
PwC’s 2012 survey of global consumers gives a good indication of some of the opportunities related to digital tech-nology. In China, for example, more than 70% of our survey respondents told us they shopped online at least once a week. Three out of five global online shoppers follow brands or retailers on social media, and fully 49% of our survey participants said they use social media every day. All of this visibility is helping companies connect with consumers. In China, for example, non-Chinese retailers/brands numbered 4 out of the top 10 favorites in our 2012 survey.
But the threat posed by the increased use of online and mobile device shopping across the globe on employment levels
in urban centers is very real. As the chief executive of online retailer Gilt Groupe told The Economist: “Overall, retail sales in America are pretty flat, so the double-digit growth of online sellers is coming at the expense of physical shops… Last year online sales in America reached $US188 billion, about 8% of total retail sales. They are forecast to reach $US270 billion by 2015.”3 Across Europe, the same trend is prevalent. A report by shopping-comparison website Kelkoo found that “Online retail sales (in the UK) increased by 14% last year to more than £50 billion, with predictions that the growth will continue to hit high streets. . . Inevitably, this will have an ongoing negative impact on the high street, an issue that is forcing retailers to bring the two channels much closer together.” E-commerce reduces the need for workers on the shop floor within city locations, with employees instead being employed in offices or call centers in out-of-town bases beyond Cities of Opportunity boundaries.
3 http://www.economist.com/node/21548236.
5 PwC’s Cities of Opportunity: Through a retail and consumer lens
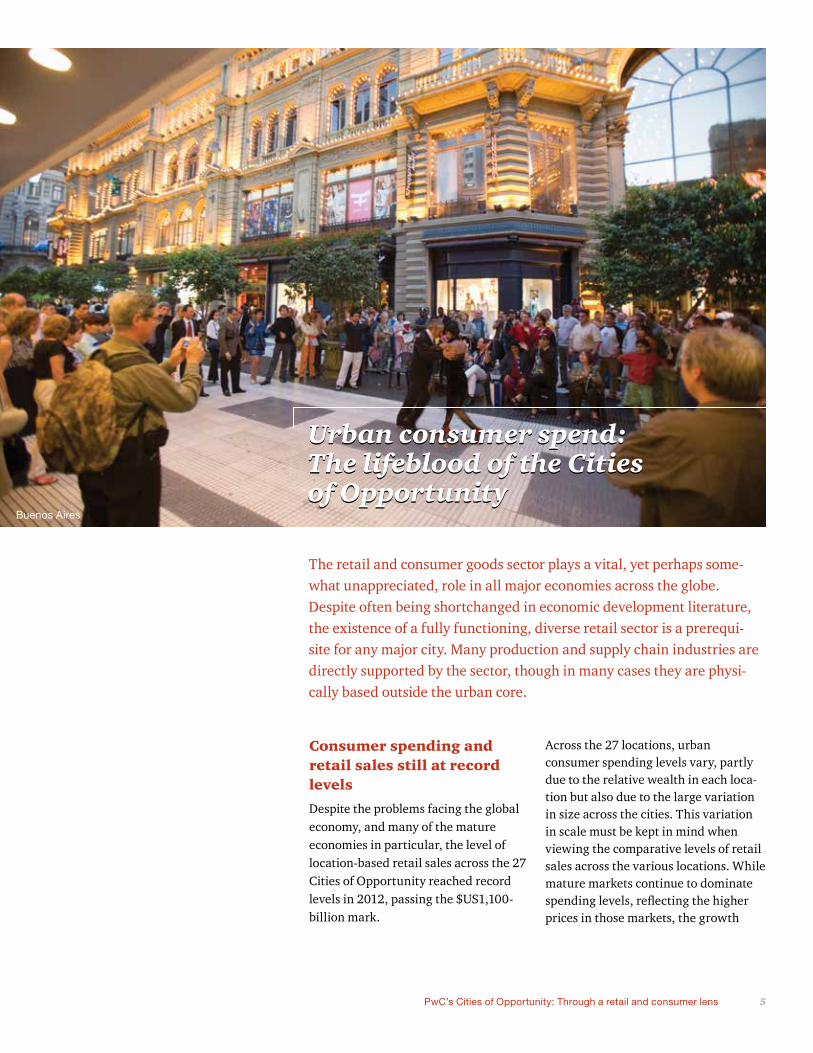
Urban consumer spend: The lifeblood of the Cities of Opportunity
The retail and consumer goods sector plays a vital, yet perhaps some-what unappreciated, role in all major economies across the globe. Despite often being shortchanged in economic development literature, the existence of a fully functioning, diverse retail sector is a prerequi-site for any major city. Many production and supply chain industries are directly supported by the sector, though in many cases they are physi-cally based outside the urban core.
Consumer spending and retail sales still at record levels
Despite the problems facing the global economy, and many of the mature economies in particular, the level of location-based retail sales across the 27 Cities of Opportunity reached record levels in 2012, passing the $US1,100-billion mark.
Across the 27 locations, urban consumer spending levels vary, partly due to the relative wealth in each loca-tion but also due to the large variation in size across the cities. This variation in scale must be kept in mind when viewing the comparative levels of retail sales across the various locations. While mature markets continue to dominate spending levels, reflecting the higher prices in those markets, the growth
Urban consumer spend: The lifeblood of the Cities of Opportunity
Buenos Aires

PwC6
Abu Dhabi
Beijing
Berlin
Buenos Aires
Chicago
Hong Kong
Istanbul
Johannesburg
Kuala Lumpur
London
Los Angeles
Madrid
Mexico City
Milan
Moscow
Mumbai
New York
Paris
San Francisco
São Paulo
Seoul
Shanghai
Singapore
Stockholm
Sydney
Tokyo
Toronto
2.3
41.8
14.5
23.9
25.3
57.7
44.7
11.5
8.4
103.6
50.7
14.9
47.5
16.9
66.5
21.2
106.6
34.3
10.8
32.7
77.7
47.2
30.7
10.0
51.3
155.1
24.5
0.8
16.8
3.5
3.0
2.6
7.2
13.2
4.4
1.7
8.0
3.8
3.3
8.9
1.3
10.7
12.5
8.4
2.3
0.8
11.4
9.9
14.3
5.2
0.9
4.5
13.0
2.8
Location-based retail sales ($US billion, 2012 constant prices and exchange rates)
City of Opportunity
Total population (millions)
Sources: Oxford Economics; PwC, Cities of OpportunityNote: Columns for both variables are conditionally formatted so that maroonrepresents the Cities with the highest figures, pink represents the Cities with the lowest figures and orange represents the Cities with the median figures.
Figure 1. Tokyo, New York, and London lead the way
Location-based retail sales and total population, Cities of Opportunity, 2012
of emerging markets is shifting the balance toward greater spend and sales in the emerging cities. The pace of retail sales growth in Shanghai and Beijing and the size of Moscow’s and Seoul’s retail and consumer goods sectors, in particular, are having a profound impact on the overall pattern of urban spend across the Cities of Opportunity as a whole. Emerging markets now account for approximately 38% of total retail sales compared with 34% in 2000.
In value terms, the largest levels of urban consumer spending are currently found in mature cities—Tokyo, New York and London—which each recorded retail sales greater than $US100 billion in 2012. This is partly due to the sheer sizes of those city centers and the populations who shop in them (Tokyo is the fourth most populated of the Cities of Opportunity). On a per-person basis, mature markets again lead, with the biggest spenders found to be Paris, Los Angeles, San Francisco and London.
Calculating retail sales across our sampleThere is limited data available on location-based retail sales at the urban level. Although there is consumer expenditure data for selected loca-tions, it is usually based on expenditures by residents and fails to capture spending by tourists, business visitors, or commuters. For emerging econo-mies in particular, the data is very sparse. To combat those data problems, we developed a unique model of location-based retail sales. The model is based on a combination of economic data from the Cities of Opportunity forecast, published retail sales data at an urban city level, and national retail sales data.
7 PwC’s Cities of Opportunity: Through a retail and consumer lens
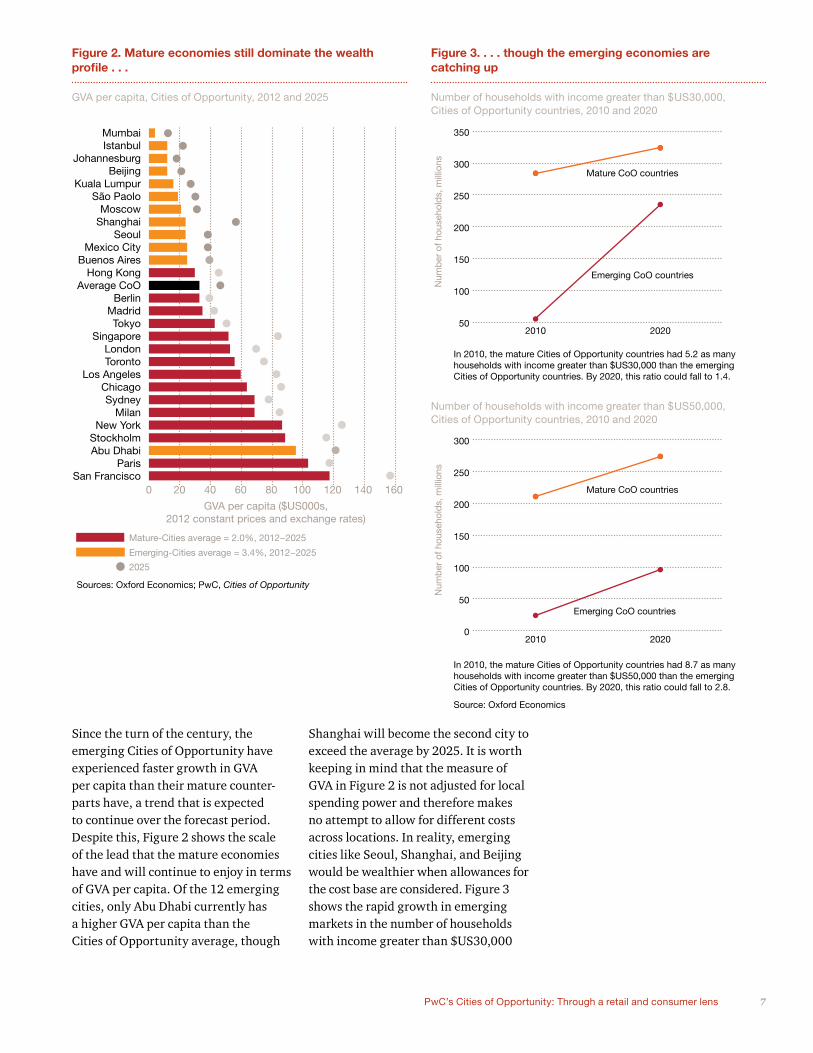
Figure 2. Mature economies still dominate the wealth profile . . .
GVA per capita, Cities of Opportunity, 2012 and 2025
Figure 3. . . . though the emerging economies are catching up
Number of households with income greater than $US30,000, Cities of Opportunity countries, 2010 and 2020
0 20 40 60 80 100 120 140 160
IstanbulJohannesburg
BeijingKuala Lumpur
São PaoloMoscow
ShanghaiSeoul
Mexico CityBuenos Aires
Hong KongAverage CoO
BerlinMadridTokyo
SingaporeLondonToronto
Los AngelesChicagoSydney
MilanNew York
StockholmAbu Dhabi
ParisSan Francisco
Mumbai
GVA per capita ($US000s, 2012 constant prices and exchange rates)
Sources: Oxford Economics; PwC, Cities of Opportunity
Emerging-Cities average = 3.4%, 2012−2025
Mature-Cities average = 2.0%, 2012−2025
2025
Since the turn of the century, the emerging Cities of Opportunity have experienced faster growth in GVA per capita than their mature counter-parts have, a trend that is expected to continue over the forecast period. Despite this, Figure 2 shows the scale of the lead that the mature economies have and will continue to enjoy in terms of GVA per capita. Of the 12 emerging cities, only Abu Dhabi currently has a higher GVA per capita than the Cities of Opportunity average, though
50
100
150
200
250
300
350
20202010
Num
ber
of h
ouse
hold
s, m
illio
ns
Mature CoO countries
Emerging CoO countries
0
50
100
150
200
250
300
20202010
Num
ber
of h
ouse
hold
s, m
illio
ns
Mature CoO countries
Emerging CoO countries
In 2010, the mature Cities of Opportunity countries had 5.2 as many households with income greater than $US30,000 than the emerging Cities of Opportunity countries. By 2020, this ratio could fall to 1.4.
In 2010, the mature Cities of Opportunity countries had 8.7 as many households with income greater than $US50,000 than the emerging Cities of Opportunity countries. By 2020, this ratio could fall to 2.8.
Source: Oxford Economics
Shanghai will become the second city to exceed the average by 2025. It is worth keeping in mind that the measure of GVA in Figure 2 is not adjusted for local spending power and therefore makes no attempt to allow for different costs across locations. In reality, emerging cities like Seoul, Shanghai, and Beijing would be wealthier when allowances for the cost base are considered. Figure 3 shows the rapid growth in emerging markets in the number of households with income greater than $US30,000
Number of households with income greater than $US50,000, Cities of Opportunity countries, 2010 and 2020

PwC8
Figure 4. Necessities spending dominates at low incomes Figure 5. Across countries, incomes still a crucial factor
Proportion of total household expenditure by spending category across income bands, UK, 2010
Category of spending
% of total expenditure, 2010
Lowest decile
Highest decile
Food & non-alcoholic drinks 15% > 8%
Alcoholic drinks, tobacco & narcotics 4% > 2%
Clothing & footwear 4% < 5%
Housing (net), fuel & power 22% > 8%
Household goods & services 8% = 8%
Health 1% = 1%
Transport 9% < 15%
Communication 4% > 2%
Recreation & culture 10% < 13%
Education 0% < 4%
Restaurants & hotels 6% < 10%
Miscellaneous goods & services 7% < 8%
Other expenditure items 10% < 16%
Source: ONS Family SpendingNote: Yellow arrows refer to when lowest income decile has lower % of spending in a particular category; orange arrows refer to when lowest-income decile has greater % of spending in a particular category; maroon equal signs refer to when lowest-income decile has same % of spending in a particular category.
Proportion of total household expenditure by spending category across income bands, Turkey, 2010
Category of spending
% of total expenditure, 2010
Lowest decile
Highest decile
Food & non-alcoholic drinks 33% > 16%
Alcoholic drinks, tobacco & narcotics 5% > 3%
Clothing & footwear 3% < 6%
Housing (net), fuel & power 37% > 21%
Household goods & services 4% < 7%
Health 2% = 2%
Transport 6% < 23%
Communication 3% < 4%
Recreation & culture 1% < 4%
Education 0% < 3%
Restaurants & hotels 4% < 6%
Miscellaneous goods & services 2% < 5%
Source: Turkstat Household Budget SurveysNote: Yellow arrows refer to when lowest income decile has lower % of spending in a particular category; orange arrows refer to when lowest-income decile has greater % of spending in a particular category; maroon equal signs refer to when lowest-income decile has same % of spending in a particular category.
and $50,000, narrowing the gap with mature cities in both cases.
The increasing wealth in emerging cities will change the spending patterns mark-edly, and the comparison is striking. Figure 4 shows category spend by households in the lowest and highest income bands in the UK.
As income rises, consumer trends move in the direction of increased spend in clothing & footwear, transport, recreation & culture, education, and restaurants & hotels (all of which the highest-income band spends a greater proportion of its total income on than does the lowest-income band). The question is, can we extrapolate from the UK example to our emerging cities? We believe so, given the similar analysis we performed for an emerging economy— namely Turkey, whose breakdown between spend in the highest- and lowest-income bands is very similar to that of the UK (Figure 5).
A striking difference between Figures 4 and 5 is the fact that Turkey’s least-wealthy households spend 70% of their total income on food & non-alcoholic drinks and housing, fuel & power compared with 37% in the UK, illus-trating how spending patterns vary widely across economies of different wealth profiles, in addition to the varia-tion by household income level. The decreasing share of spending on “neces-sities,” however, doesn’t translate to falling spending levels on those goods. For example, in wealthier economies, the food and household goods sub-sectors have become more diverse, offering high-end brands, environ-mentally-conscious options, and a far greater choice—presenting significant growth potential for consumer goods companies and retailers. In other words, spending on consumer goods will become more diverse, and high-end products will become increasingly in demand.

9 PwC’s Cities of Opportunity: Through a retail and consumer lens
Figure 6. Proportion of total consumption by spending category over time, UK, selected years
Proportion of total consumption by spending category over time, UK, selected years
Category of spending
% of total expenditure
2000 2008 2012 2020
Food & non-alcoholic drinks 9.7% 9.0% 9.2% 8.9%
Alcoholic drinks, tobacco & narcotics 4.0% 3.5% 3.7% 3.3%
Clothing & footwear 5.6% 5.7% 6.0% 6.1%
Housing (net), fuel & power 17.9% 21.8% 25.0% 27.2%
Household goods & services 6.0% 5.3% 5.0% 4.7%
Health 1.5% 1.7% 1.8% 1.9%
Transport 15.3% 14.6% 13.9% 13.7%
Communication 2.2% 2.0% 2.4% 2.6%
Recreation & culture 11.6% 11.5% 10.4% 10.3%
Education 1.7% 1.5% 1.5% 1.8%
Restaurants & hotels 10.8% 10.1% 10.0% 9.7%
Miscellaneous goods & services 13.7% 13.2% 11.1% 9.7%
Sources: ONS Family Spending; Eurostat; Oxford EconomicsNote: Yellow shading refers to categories that have faced a fall in proportional spending during the recession; orange shading refers to categories that have faced a rise in proportional spending during the recession; maroon shading refers to categories that have maintained a stable proportional spend during the recession.
Spending patterns also depend on government provision. For example, when education and health services are provided free of charge and are of high quality, as is the case in many European countries, private spending on them will be low. In comparison, in advanced economies whose educa-tion and health services are delivered more via the private sector, such as in the US, a greater share of personal spending will be dedicated to education and health. Over time, we expect that spending trends in emerging economies will increasingly converge to meet those of mature economies. As they continue their buoyant growth, households in emerging economies will spend more on education, transport, recreation & culture, and restaurants & hotels.
Our spending data shows how the global slowdown of the past few years has affected consumer spending in different categories. By looking at UK spending by category over time in
Figure 6, it is evident that much more of household spending has been recently dedicated to necessities such as fuel, clothing and food at the expense of perceived luxury products such as home furnishings, recreation & culture, and hospitality. Trends in spending will continue to evolve over the longer term, affected by the global economy and other local factors.
Demographic change will also impact the pattern of urban consumer spending. Nearly all of the Cities of Opportunity have higher proportions of 20- to 34-year-olds compared with their respective national averages—18 out of 21 cities for which data is available.4 In some of our 27 cities, more than a quarter of the total population fall
4 While we have data for 23 cities, Hong Kong and Singapore Cities of Opportunity definitions represent the whole country—meaning the breakdowns will be the same.

PwC10
into the 20–34 age bracket, generally made up of young professionals with a concentration of disposable income.
The aging urban population across the globe is a factor that will have a profound effect on retail patterns in the future. Notably, the share of spending on food & non-alcoholic drinks, health, and recreation & culture typically increases with age.
The key urban centers will have to adapt to cope with the changing demands of aging populations, though
Figure 7. Youthful look to urban locations
Proportion of young people, Cities of Opportunity, compared with their respective countries, 2012
Berlin
Buenos Aires
Chicago
Hong Kong
Istanbul
Johannesburg
Kuala Lumpur
London
Los Angeles
Madrid
Mexico City
Milan
Moscow
New York
Paris
San Francisco
São Paulo
Seoul
Singapore
Stockholm
Sydney
Tokyo
Toronto
City average
21.1%
24.0%
21.2%
22.2%
27.7%
26.2%
31.2%
31.7%
23.3%
17.6%
24.8%
15.8%
23.8%
21.3%
21.7%
22.1%
25.8%
23.8%
20.8%
21.4%
22.2%
19.2%
21.8%
17.7%
23.2%
20.6%
22.2%
25.0%
26.7%
24.6%
20.0%
20.6%
17.1%
23.9%
16.4%
22.6%
20.6%
18.1%
20.6%
24.6%
20.6%
20.8%
19.8%
21.7%
15.7%
24.3%
% population aged 20–34 years, 2012City of Opportunity CountryCity
Source: Oxford EconomicsNote: Yellow arrows refer to when City of Opportunity has lower proportion of population in respective age-group than its country does; orange arrows refer to when City of Opportunity has greater proportion of population in respective age-group than its country does; maroon equal signs refer to when City of Opportunity has same proportion of population in respective age-group than its country does.
>
>
>
=
>
<
>
>
>
>
>
<
>
>
>
>
>
>
=
>
>
>
<
21.8% 24.3%>
this again depends on whether people choose to retire within the urban loca-tions or elsewhere. Regardless, the urban centers will always attract the young to middle-aged with the wealth of job opportunities present. This category has already been shown to have a considerably different spending profile from the category of retire-ment age. As well as the availability of jobs, younger people locating in cities look to a wide range of factors before deciding where to settle. The Cities of Opportunity will need to ensure that they have the facilities to compete on a

11 PwC’s Cities of Opportunity: Through a retail and consumer lens
Figure 8. Spending throughout the ages
Proportion of total household expenditure by spending category across age bands, UK, 2010
% of total expenditure
Category of spending Under 30 30–49 50–64 65–74 75+
Food & non-alcoholic drinks 9% 10% 11% 14% 16%
Alcoholic drinks, tobacco & narcotics 2% 2% 3% 3% 2%
Clothing & footwear 5% 5% 5% 4% 3%
Housing (net), fuel & power 20% 12% 10% 13% 19%
Household goods & services 5% 6% 8% 7% 8%
Health 0% 1% 1% 2% 2%
Transport 13% 14% 14% 13% 8%
Communication 3% 3% 3% 3% 3%
Recreation & culture 9% 11% 14% 15% 11%
Education 6% 2% 2% 0% 0%
Restaurants & hotels 9% 9% 9% 7% 6%
Miscellaneous goods & services 7% 8% 7% 8% 9%
Other expenditure items 12% 17% 13% 11% 13%
Source: ONS Family Spending Note: Red shading refers to categories where older people spend proportionately more than younger people do; yellow shading refers to categories where younger people spend proportionately more than older people do.
global scale—a wide-ranging provision of consumer goods stores can only help in this respect.
Consumer headwinds
Short- to medium-term consumer pres-sures, translating to squeezed house-hold disposable incomes and dampened spending levels, remains a prevalent issue across all age cohorts. Persistent inflation across most world economies has driven up the prices of many goods, including the prices of commodities such as foodstuffs, metals, and crops (wheat, corn, and soybeans).
Global oil prices continue to escalate on the back of consistently rising demand, though the future is uncertain. On one hand, spiraling demand and a dwin-dling supply may continue to exert upward pressure on oil prices, though the advent of shale oil technology may help mitigate against further price rises by providing an alternative
and competitive energy source. Nonetheless, supply chains will change as inflation and, subsequently, income levels fluctuate across locations.
When combined, these trends are increasingly likely to reshape spending patterns, impacting marketing patterns in the retail and consumer goods sector. On the other hand, as people age and become wealthier, the global customer base rises as prod-ucts start to become within the grasp of more and more people. Hence the overall customer base of the sector will increase, which may more than compensate for the greater income pressures facing consumers.
PwC12
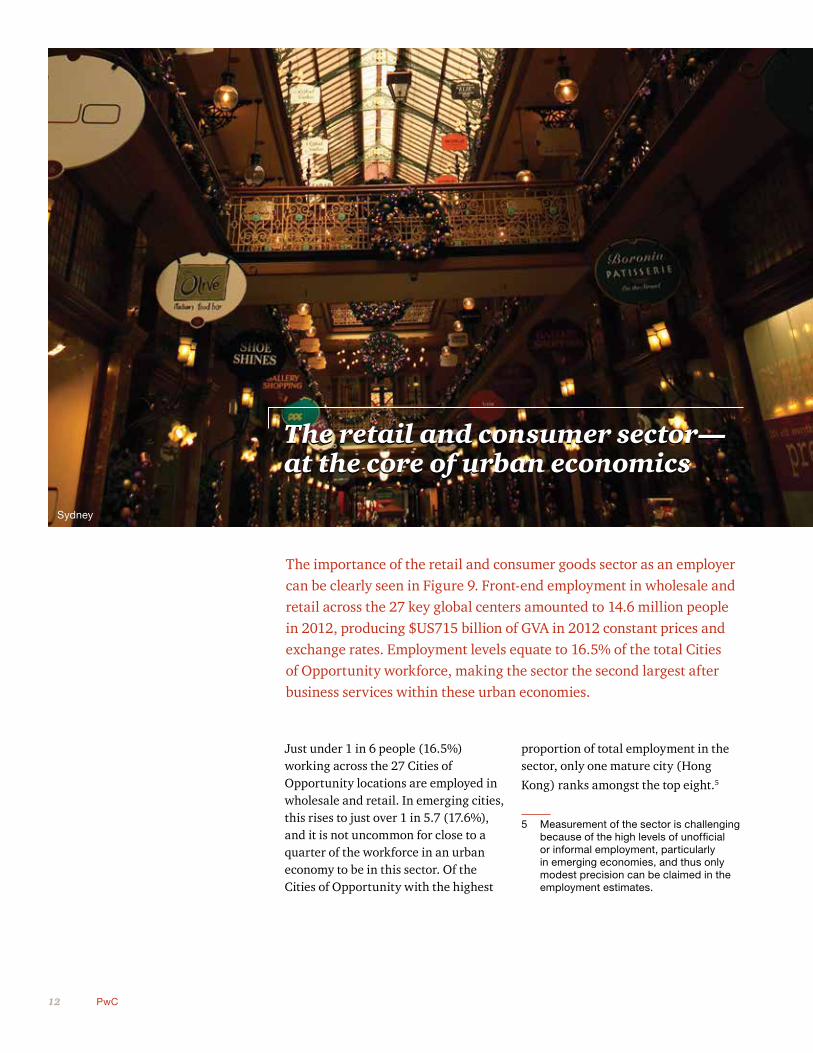
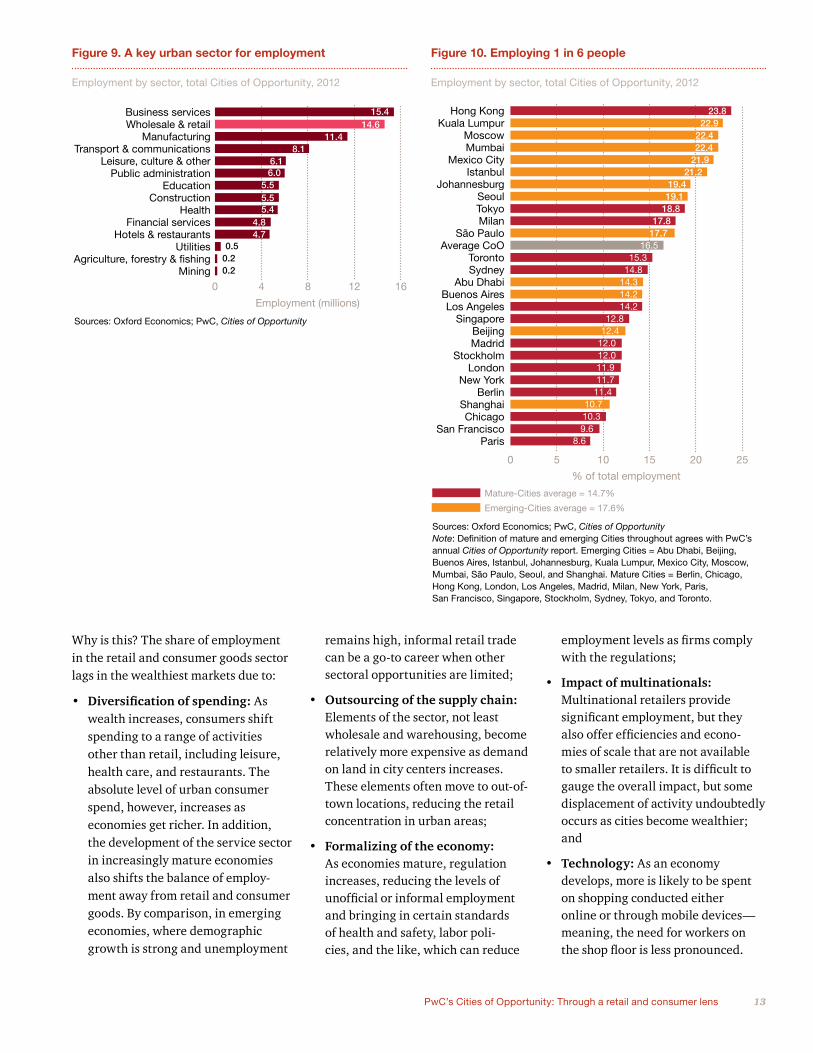
The importance of the retail and consumer goods sector as an employer can be clearly seen in Figure 9. Front-end employment in wholesale and retail across the 27 key global centers amounted to 14.6 million people in 2012, producing $US715 billion of GVA in 2012 constant prices and exchange rates. Employment levels equate to 16.5% of the total Cities of Opportunity workforce, making the sector the second largest after business services within these urban economies.
Just under 1 in 6 people (16.5%) working across the 27 Cities of Opportunity locations are employed in wholesale and retail. In emerging cities, this rises to just over 1 in 5.7 (17.6%), and it is not uncommon for close to a quarter of the workforce in an urban economy to be in this sector. Of the Cities of Opportunity with the highest
The retail and consumer sector—at the core of urban economicsThe retail and consumer sector—at the core of urban economics
proportion of total employment in the sector, only one mature city (Hong
Kong) ranks amongst the top eight.5
5 Measurement of the sector is challenging because of the high levels of unofficial or informal employment, particularly in emerging economies, and thus only modest precision can be claimed in the employment estimates.
Sydney
13 PwC’s Cities of Opportunity: Through a retail and consumer lens
Why is this? The share of employment in the retail and consumer goods sector lags in the wealthiest markets due to:
• Diversificationofspending:As wealth increases, consumers shift spending to a range of activities other than retail, including leisure, health care, and restaurants. The absolute level of urban consumer spend, however, increases as economies get richer. In addition, the development of the service sector in increasingly mature economies also shifts the balance of employ-ment away from retail and consumer goods. By comparison, in emerging economies, where demographic growth is strong and unemployment
0 4 8 12 16Mining
Agriculture, forestry & fishingUtilities
Hotels & restaurantsFinancial services
HealthConstruction
EducationPublic administration
Leisure, culture & otherTransport & communications
ManufacturingWholesale & retailBusiness services
Employment (millions)
Sources: Oxford Economics; PwC, Cities of Opportunity
15.414.6
11.48.1
6.16.0
5.55.55.4
4.84.7
0.50.20.2
Figure 9. A key urban sector for employment
Employment by sector, total Cities of Opportunity, 2012
remains high, informal retail trade can be a go-to career when other sectoral opportunities are limited;
• Outsourcing of the supply chain: Elements of the sector, not least wholesale and warehousing, become relatively more expensive as demand on land in city centers increases. These elements often move to out-of-town locations, reducing the retail concentration in urban areas;
• Formalizing of the economy: As economies mature, regulation increases, reducing the levels of unofficial or informal employment and bringing in certain standards of health and safety, labor poli-cies, and the like, which can reduce
employment levels as firms comply with the regulations;
• Impact of multinationals: Multinational retailers provide significant employment, but they also offer efficiencies and econo-mies of scale that are not available to smaller retailers. It is difficult to gauge the overall impact, but some displacement of activity undoubtedly occurs as cities become wealthier; and
• Technology: As an economy develops, more is likely to be spent on shopping conducted either online or through mobile devices—meaning, the need for workers on the shop floor is less pronounced.
Figure 10. Employing 1 in 6 people
Employment by sector, total Cities of Opportunity, 2012
0 5 10 15 20 25
ParisSan Francisco
ChicagoShanghai
BerlinNew York
LondonStockholm
MadridBeijing
SingaporeLos Angeles
Buenos AiresAbu Dhabi
SydneyToronto
Average CoOSão Paulo
MilanTokyoSeoul
JohannesburgIstanbul
Mexico CityMumbaiMoscow
Kuala LumpurHong Kong
Sources: Oxford Economics; PwC, Cities of OpportunityNote: Definition of mature and emerging Cities throughout agrees with PwC’s annual Cities of Opportunity report. Emerging Cities = Abu Dhabi, Beijing, Buenos Aires, Istanbul, Johannesburg, Kuala Lumpur, Mexico City, Moscow, Mumbai, São Paulo, Seoul, and Shanghai. Mature Cities = Berlin, Chicago, Hong Kong, London, Los Angeles, Madrid, Milan, New York, Paris, San Francisco, Singapore, Stockholm, Sydney, Tokyo, and Toronto.
23.822.9
22.422.4
21.921.2
19.419.1
18.817.8
17.716.5
15.314.8
14.314.214.2
12.812.4
12.012.011.911.7
11.410.710.39.6
8.6
% of total employment
Emerging-Cities average = 17.6%
Mature-Cities average = 14.7%

PwC14
An inclusive workforce
The retail and consumer goods sector is not only a major contributor to total employment, it is also a very diverse sector across a wide range of metrics. Whether it is the prevalence of part-time workers, proportion of females employed, proportion of females in management positions, or percentage of the workforce made up of non-nationals, the retail sector scores very highly across the 8 sectors it is bench-marked against in this report. The sector is in the top 3 industries in each metric and has the highest proportion of part-time workers of any of the featured
sectors. These metrics have been calcu-lated at a national level and, in reality, the sector would stand out even more if the analysis was presented within an urban context.
As shown in Figure 12, there are considerable variations in diversity metrics across the Cities of Opportunity national economies, with the highest levels of diversity (i.e. the countries that top the rankings below) generally found in the more mature economies. This comparison indicates that as economies become increasingly wealthy and successful, the retail and consumer
Figure 11. An inclusive workforce
Ranking of diversity metrics by sector, Cities of Opportunity countries, 2012
Total manufacturing
IT services
Energy & chemicals
Professional & business services
Insurance
Banking
Pharmaceuticals
Wholesale & retail
Female
45% 20% 13% 32% 17% 3% 3%
41% 7% 13% 31% 7% 1% 1%
48% 11% 11% 34% 9% 1% 2%
50% 12% 11% 36% 9% 1% 2%
41% 13%15% 31% 8% 4% 2%
22% 5% 11%
17% 7% 1% 2%
27% 9% 13% 24% 9% 1% 2%
29% 7% 14% 22% 10% 2% 1%
Part-time Non-nationals Female managers
Aged under 24 Aged 65+ Managers aged under 24
Sources: Oxford Economics
goods sector will become an increas-ingly important provider of diverse employment opportunities. Offering flexible working hours and high levels of female participation across a broad range of age categories, the sector is capable of contributing significantly to an inclusive workforce and reduction in poverty.
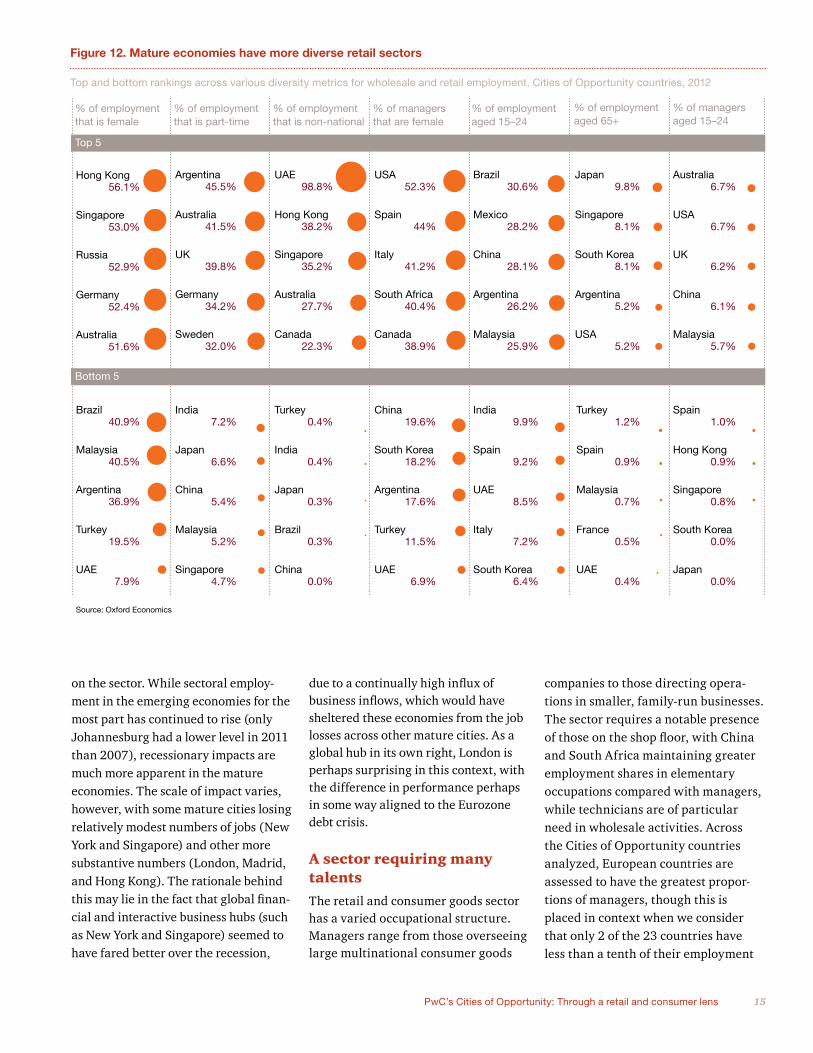
The global slowdown has taken its toll on employment
The longer-term trend in retail and consumer employment has been posi-tive, but across many urban centers the global recession has taken its toll
15 PwC’s Cities of Opportunity: Through a retail and consumer lens
on the sector. While sectoral employ-ment in the emerging economies for the most part has continued to rise (only Johannesburg had a lower level in 2011 than 2007), recessionary impacts are much more apparent in the mature economies. The scale of impact varies, however, with some mature cities losing relatively modest numbers of jobs (New York and Singapore) and other more substantive numbers (London, Madrid, and Hong Kong). The rationale behind this may lie in the fact that global finan-cial and interactive business hubs (such as New York and Singapore) seemed to have fared better over the recession,
due to a continually high influx of business inflows, which would have sheltered these economies from the job losses across other mature cities. As a global hub in its own right, London is perhaps surprising in this context, with the difference in performance perhaps in some way aligned to the Eurozone debt crisis.
A sector requiring many talents
The retail and consumer goods sector has a varied occupational structure. Managers range from those overseeing large multinational consumer goods
Figure 12. Mature economies have more diverse retail sectors
Top and bottom rankings across various diversity metrics for wholesale and retail employment, Cities of Opportunity countries, 2012
% of employment that is female
% of employment that is part-time
% of employment that is non-national
% of managers that are female
% of employment aged 15–24
% of employment aged 65+
% of managers aged 15–24
Top 5
Bottom 5
Hong Kong56.1%
Singapore53.0%
Russia52.9%
Germany52.4%
Australia51.6%
Argentina45.5%
Australia41.5%
UK39.8%
Germany34.2%
Sweden32.0%
UAE98.8%
Hong Kong38.2%
Singapore35.2%
Australia27.7%
Canada22.3%
USA52.3%
Spain44%
Italy41.2%
South Africa40.4%
Canada38.9%
Brazil30.6%
Mexico28.2%
China28.1%
Argentina26.2%
Malaysia25.9%
Japan9.8%
Singapore8.1%
South Korea8.1%
Argentina5.2%
USA5.2%
Australia6.7%
USA6.7%
UK6.2%
China6.1%
Malaysia5.7%
Brazil40.9%
Malaysia40.5%
Argentina36.9%
Turkey19.5%
UAE7.9%
India7.2%
Japan6.6%
China5.4%
Malaysia5.2%
Singapore4.7%
Turkey0.4%
India0.4%
Japan0.3%
Brazil0.3%
China0.0%
China19.6%
South Korea18.2%
Argentina17.6%
Turkey11.5%
UAE6.9%
India9.9%
Spain9.2%
UAE8.5%
Italy7.2%
South Korea6.4%
Turkey1.2%
Spain0.9%
Malaysia0.7%
France0.5%
UAE0.4%
Spain1.0%
Hong Kong0.9%
Singapore0.8%
South Korea0.0%
Japan0.0%
Source: Oxford Economics
companies to those directing opera-tions in smaller, family-run businesses. The sector requires a notable presence of those on the shop floor, with China and South Africa maintaining greater employment shares in elementary occupations compared with managers, while technicians are of particular need in wholesale activities. Across the Cities of Opportunity countries analyzed, European countries are assessed to have the greatest propor-tions of managers, though this is placed in context when we consider that only 2 of the 23 countries have less than a tenth of their employment
PwC16
share as managers (China and South Korea). In general, emerging countries have a larger proportion of people employed in a service capacity within the sector.
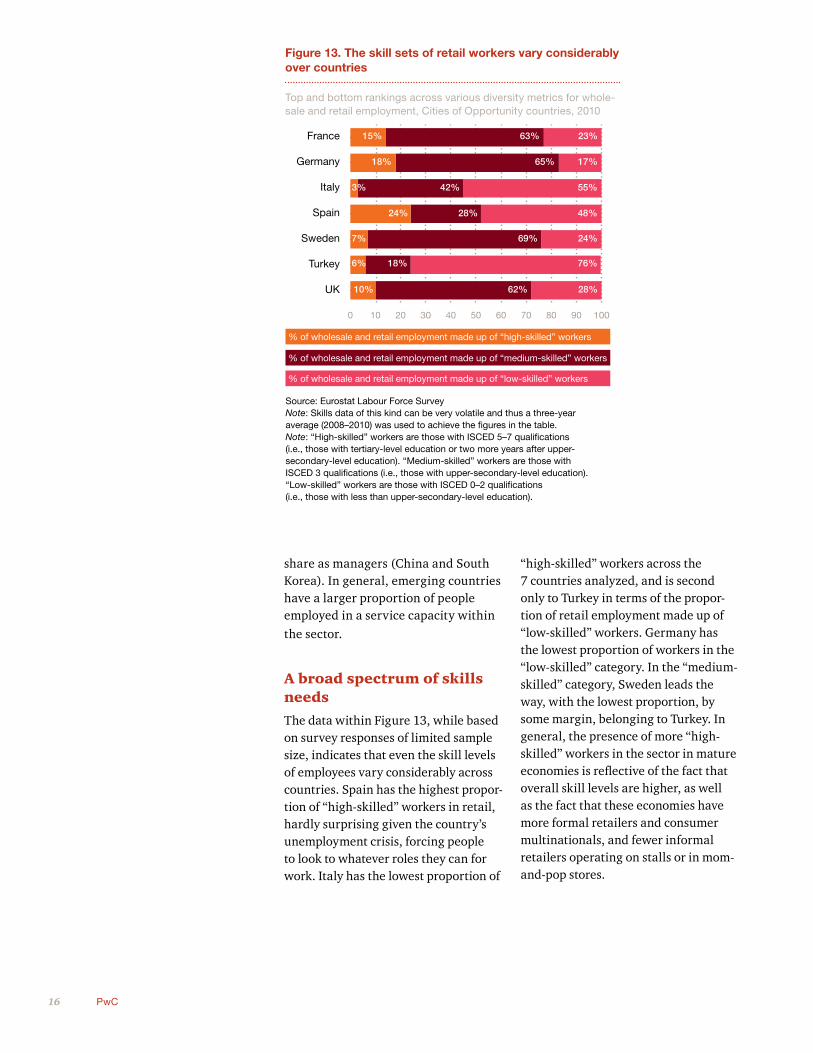
A broad spectrum of skills needs
The data within Figure 13, while based on survey responses of limited sample size, indicates that even the skill levels of employees vary considerably across countries. Spain has the highest propor-tion of “high-skilled” workers in retail, hardly surprising given the country’s unemployment crisis, forcing people to look to whatever roles they can for work. Italy has the lowest proportion of
“high-skilled” workers across the 7 countries analyzed, and is second only to Turkey in terms of the propor-tion of retail employment made up of “low-skilled” workers. Germany has the lowest proportion of workers in the “low-skilled” category. In the “medium-skilled” category, Sweden leads the way, with the lowest proportion, by some margin, belonging to Turkey. In general, the presence of more “high-skilled” workers in the sector in mature economies is reflective of the fact that overall skill levels are higher, as well as the fact that these economies have more formal retailers and consumer multinationals, and fewer informal retailers operating on stalls or in mom-and-pop stores.
Figure 13. The skill sets of retail workers vary considerably over countries
Top and bottom rankings across various diversity metrics for whole-sale and retail employment, Cities of Opportunity countries, 2010
Source: Eurostat Labour Force SurveyNote: Skills data of this kind can be very volatile and thus a three-year average (2008–2010) was used to achieve the figures in the table.Note: “High-skilled” workers are those with ISCED 5–7 qualifications (i.e., those with tertiary-level education or two more years after upper-secondary-level education). “Medium-skilled” workers are those with ISCED 3 qualifications (i.e., those with upper-secondary-level education). “Low-skilled” workers are those with ISCED 0–2 qualifications (i.e., those with less than upper-secondary-level education).
0 10 20 30 40 50 60 70 80 90 100
% of wholesale and retail employment made up of “high-skilled” workers
% of wholesale and retail employment made up of “medium-skilled” workers
% of wholesale and retail employment made up of “low-skilled” workers
France
Germany
Italy
Spain
Sweden
Turkey
UK
15%
18%
3%
24%
7%
6%
10%
63%
65%
23%
17%
42%
28%
55%
48%
69% 24%
18%
62%
76%
28%

17 PwC’s Cities of Opportunity: Through a retail and consumer lens
Despite the challenges, a positive outlookDespite the challenges, a positive outlook
The forecast for the retail and consumer goods sector remains broadly positive across the Cities of Opportunity in terms of both wealth creation and employment. Growth of 1.6 million net additional jobs in wholesale and retail is projected, with GVA reaching almost $US1,130 billion, by 2025 (Figure 14). This makes the sector the second-largest job creator over the 2012–2025 forecast period, after business services. In GVA terms, a similar pattern is observed, although the financial services sector pushes retail down to the third most important sector in terms of contribution to wealth creation.
London

PwC18
Figure 14. An important jobs and wealth creator
0 1-1 2 3 4 5
0 100 200 300 400 500 600 700 800 900
4.91.6
1.51.11.1
1.00.90.90.90.9
0-0.1-0.1
-0.9
803718
413411
351135979080
7070
3551
Employment change (millions), 2012−2025
GVA change ($US billion, 2012constant prices and exchange rates)
2012−2025
ManufacturingUtilities
Agriculture, forestry & fishingMining
Hotels & restaurantsPublic administration
ConstructionLeisure, culture & other
EducationFinancial services
HealthTransport & communications
Wholesale and retailBusiness services
Agriculture, forestry & fishingMiningUtilities
Public administrationHotels & restaurants
EducationHealth
Leisure, culture & otherConstruction
ManufacturingTransport & communications
Wholesale and retailFinancial servicesBusiness services
Sources: Oxford Economics; PwC, Cities of Opportunity
GVA change by sector, total Cities of Opportunity, 2012–2025
Employment change by sector, total Cities of Opportunity, 2012–2025
Over $US19 trillion of cumulative retail sales over the forecast period
Across the 27 Cities of Opportunity locations, which are just a sample of global urban locations, a staggering $US19.3 trillion of cumulative retail sales is projected by 2025. This equates to an average of $US1,500 billion of retail sales every year and reflects an annual growth rate of 3.9%.
This level of urban consumer spending will present new opportunities for incumbent retailers and will attract new investors into each of the markets. Retail sales are growing notably faster in the emerging cities, so that by 2025,
emerging markets are set to account for 47% of total retail sales across the 27 centers and to provide 60% of the overall growth over the forecast period.
The general makeup of retail sales across the Cities of Opportunity is not predicted to change much over the forecast period, though the gap that currently exists between Tokyo and New York and London should narrow considerably. Nonetheless, these three mature markets are expected to remain as the largest contributors to the urban total and in that order. Shanghai and Beijing, the most-populated Cities of Opportunity, are forecast to experi-ence the fastest growth in spending, allowing them to move up to 4th and
Figure 15. Spend, spend, spend
Location-based retail sales, total Cities of Opportunity, 2012, 2025, and contribution to growth, 2012–2025
Sources: Oxford Economics; PwC, Cities of OpportunityNote: Retail sales levels above percentages in labels are in $US billion, 2012 constant prices and exchange rates.
Contribution to growth, 2012–2025
2012
2025
40% 60%99253%
70762%
42638%
86247%
Emerging cities
Mature cities

19 PwC’s Cities of Opportunity: Through a retail and consumer lens
5th places in the rankings, respectively, by 2025, from 10th and 12th currently. Over the course of the next 13 years, Hong Kong, Moscow and Seoul are forecast to join the five aforementioned cities in providing over $US1,000 billion of cumulative retail sales. The 12 emerging markets should provide 60% of the overall retail sales growth over the forecast period.
While in value terms, mature markets will continue to lead the way in terms of overall contribution to spending, rates of expenditure growth are forecast to be fastest in the emerging markets. Indeed, Figure 16’s analysis of the average annual growth rates in retail sales over the forecast period indicates
that each of the top nine performers are emerging economies. It illustrates that, while many economists are predicting slowing Chinese economic growth over the next few years, growth in urban consumer spend in Beijing and Shanghai will outstrip other Cities of Opportunity.
With such large levels of urban consumer spending and retail sales across just these 27 locations, the future growth potential for urban retailing is evident. The continued attraction of city centers for major investors as they seek the connectivity, skills, and networking benefits will drive increased levels of urban wealth. In addition, global tourist flows are expected to rise steadily
Figure 17. Emerging cities will account for almost all job creation
Employment in wholesale and retail, total Cities of Opportunity, 2012, 2025, and contribution to growth, 2012–2025
Sources: Oxford Economics; PwC, Cities of OpportunityNote: Employment levels above percentages in labels are in millions.
Contribution to growth, 2012–2025
2012
2025
94%
532%
1168%
965%
535%
6%
Emerging cities
Mature cities
Figure 16. Retail sales growth rates positive across all cities
Retail sales growth per annum, Cities of Opportunity, 2012–2025
0 2 4 6 8 10
MilanBerlin
San FranciscoTokyo
SydneyMadrid
ParisStockholm
TorontoSingapore
Mexico CityChicagoMoscowLondon
Los AngelesSeoul
New YorkHong KongAbu Dhabi
JohannesburgIstanbul
Buenos AiresKuala Lumpur
Sáo PauloMumbai
ShanghaiBeijing
Sources: Oxford Economics; PwC, Cities of Opportunity
9.98.9
7.75.6
5.45.25.2
4.94.7
4.54.0
3.13.03.03.02.9
2.82.62.5
2.11.71.7
1.51.51.40.7
0.58.6
Retail sales ($US billion, 2012 constant prices and exchange rates), growth per annum (%)
Emerging-Cities average = 2.6% per annum
Mature-Cities average = 5.6% per annum

PwC20
and—despite the ever-improving level of electronic communications—face-to-face meetings are still likely to be core elements of doing business, especially in an ever-more globalized and inter-connected world.
The challenges facing the retail and consumer goods sector, particularly over the next few years in mature economies, are inherently related to still-slow global growth. They include subdued wage growth, squeezed household disposable incomes, house-hold de-leveraging and ongoing frail consumer confidence. All of these factors have already impacted consumer spending levels and thus retail sales and will continue to do so over the short term.
Emerging markets lead future jobs growth
As shown previously, emerging markets have been less affected by the economic downturn than mature economies have, and they are better positioned to lead jobs growth in the sector over the 2012–2025 period. A combination of demographics, escalating wealth, and strong local demand means that in employment terms, future growth will be dominated by emerging markets, which will account for 94% of net job creation in the wholesale and retail sector from 2012 to 2025 (Figure 17).
Beijing, Istanbul, Mumbai, and Shanghai alone are estimated to provide close to 90% of total job creation in the wholesale and retail sector across the 27 global centers. This
Figure 18. Beijing, Istanbul, Mumbai, and Shanghai combine to create close to 1.5 million retail jobs
Employment change in wholesale and retail, Cities of Opportunity, 2012-2025
Source: Oxford Economics; PwC, Cities of Opportunity
Moscow
Toronto
New York
Mexico City
Sao Paulo
Buenos Aires
Negative growth 0–1000,000 jobs 100,000–200,000 jobs 200,000+ jobs
Johannesburg Sydney
Singapore
Hong KongAbu Dhabi
TokyoIstanbul
Berlin
MilanParis
London
Stockholm
MadridChicagoSeoul
Shanghai
BeijingSan Francisco
Los Angeles
Kuala Lumpur
Mumbai
is partly related to the overall scale and strong population growth of these Cities of Opportunity but also because of the high levels of informal, low productivity employment in emerging economies.
A third of the cities in our study are actually forecast to experience net job losses in the sector over the next 13 years, with Moscow in particular suffering notable job contraction, reflecting its projected fall in popula-tion. Six of these cities are mature, showing the inherent structural and demographic differences in mature versus emerging economies. Job losses are partly functions of the challenging consumer conditions in many of the mature economies, but they also, most importantly, reflect the impacts of productivity change in the sector.

21 PwC’s Cities of Opportunity: Through a retail and consumer lens
Conclusions—no end to spendConclusions—no end to spend
• The retail and consumer goods sector has been and will continue to be a key employer and wealth creator across all urban locations. It argu-ably deserves greater prominence in economic development circles than it is currently afforded;
• The wealth and demographic profiles of global cities are changing, which will have important connotations for how consumer spending in the key urban centers analyzed within this study is distributed;
This short paper has looked at the retail and consumer goods sector over the period 2012 to 2025 for the 27 Cities of Opportunity. A number of broad conclusions can be drawn from the study:
• There are risks to the sector going forward—both in the short term from global economic difficulties and from long-term changes within the sector—in terms of how technology is leveraged both by companies in the sector and by consumers;
• Despite these challenges, the outlook is broadly positive across the 27 locations covered in the analysis, with emerging markets dominating growth in jobs and GVA;
Shanghai
PwC22
• With $US19.3 trillion of cumula-tive retail sales projected in the 27 locations by 2025, equivalent to an average $US1,500 billion of retail sales per annum, there will be considerable opportunities for firms in the sector to capitalize on the vast amount of spend within these key centers, though competition will be considerable;
• As in jobs and GVA growth, emerging cities are forecast to grow fastest in terms of urban consumer spending, though mature cities such as Tokyo, New York, and London will continue to provide the greatest levels of retail spend throughout the forecast period; and
• The retail and consumer goods sector is a diverse and flex-ible employer, making it vital to the urban success of the overall economy, particularly in terms of delivering economic and social policy goals at a city level.
The potential for urban retailing in the 27 key global centers is evident, and further research may be useful to determine what the additional $US19.3 trillion of cumulative retail sales will be spent on and where. When do markets become sufficiently mature to shift the pattern of demand? Answering these questions will be key to maximizing the very significant market opportuni-ties presented by the leading key global centers—the Cities of Opportunity.

23 PwC’s Cities of Opportunity: Through a retail and consumer lens
Key definitions
• Consumer spending (also referred to as consumer expenditure or consumption)—Measures spend on all goods and services within an economy. It includes spending on such categories as utilities, insur-ance, and health care that are not covered by retail sales.
• Gross value added (GVA)—GVA is a measure of the value of goods and services produced in an area, industry, or sector of an economy. It measures output minus intermediate consumption. Total GVA is less than total GDP because it excludes value-added tax and other product taxes as well as subsidies.
• Household disposable income—Household disposable income is the sum of household final consumption expenditure and savings (minus the change in net equity of households in pension funds). It also corresponds to the sum of wages and salaries, mixed income, net property income, net current transfers, and social benefits other than social transfers in kind minus taxes on income and wealth and social security contribu-tions paid by employees, the self-employed, and the unemployed.
• Purchasing power parity (PPP)—Purchasing power parities are the rates of currency conversion that equalize the purchasing power of different currencies by eliminating the differences in price levels between countries. In their simplest forms, PPPs are simply price rela-tives that show the ratio of prices in national currencies of the same good or service in different countries.
• Retail and consumer (goods) sector (also referred to as whole-sale and retail sector or retail sector)—This report makes refer-ence to and analyzes trends in the retail and consumer goods sector. However, at times within the report, the analysis and narrative make reference to the wholesale and retail sector (what most data sources refer to it as) or simply the retail sector. All of them mean the same thing. The retail and consumer goods sector
includes all sub-sectors in NACE Rev. 2 code G (Divisions 45–47). It covers businesses across the spectrum—from those engaging in wholesale activities to small, mom-and-pop retailers operating in a single loca-tion, to large retailers, to consumer goods multinationals.
• Retail sales—Retail sales account for all the money spent in a given location, regardless of source, within the retail trade category.
Retail sales coverage
Definition Official measure of broad consumer spending patterns based on the retail sales of consumer durables (goods that usually last more than three years) and consumer nondurables (goods that usually last less than three years)*
Type of consumers
Residents, tourists (foreign and domestic), commuters, and business visi-tors (i.e., all categories that spend within the given location)
Sectoral coverage
The definition of retail sales is directly related to that of the SIC/NACE retail trade category (NACE Rev. 2 Division 47), encompassing:
• Retail sale in non-specialized stores
• Retail sale of food, beverages, and tobacco in specialized stores
• Retail sale of automotive fuel in specialized stores
• Retail sale of information and communication equipment in specialized stores
• Retail sale of other household equipment in specialized stores
• Retail sale of cultural and recreation goods in specialized stores
• Retail sale of other goods in specialized stores
• Retail sale via stalls and markets
• Retail trade not in stores, stalls, or markets
* Definition taken from Business Dictionary website (www.business dictionary.com).

© 2012 PwC. All rights reserved. PwC refers to the PwC network and/or one or more of its member firms, each of which is a separate legal entity. Please see http://www.pwc.com/structure for further details.
PwC firms help organisations and individuals create the value they’re looking for. We’re a network of firms in 158 countries with close to 169,000 people who are committed to delivering quality in assurance, tax and advisory services. Tell us what matters to you and find out more by visiting us at http://www.pwc.com/. This content is for general information purposes only, and should not be used as a substitute for consultation with professional advisors. NY-13-0173
www.pwc.com