o rganic f arming r esearch f oundation 4th national organic farmers’ survey: sustaining organic...
TRANSCRIPT

ORGANIC FARMING RESEARCH FOUNDATION
4th National Organic Farmers’ Survey:
Sustaining Organic Farms in a Changing Organic Marketplace
Erica Walz
Survey Coordinator

OFRF 4th National Organic Farmers' Survey Results
2
Methods
• Survey population developed by obtaining producer mailing lists from organic certification agencies.
• 22-page survey mailed in April 2002 to certified organic farmers throughout the U.S.
• 1,034 “completes” returned, a response rate of 16%

3

OFRF 4th National Organic Farmers' Survey Results
4
Respondent demographics
• 67% are full-time farmers
– up from 62% in 1997
• 51% transitioned from conventional farming
– up from 41% (1997) and 42% (1995)
• 36% have mixed operations
– up from 24% (1997) and 20% (1995)

OFRF 4th National Organic Farmers' Survey Results
5
Respondent demographics
• Acres farmed, average = 277 – up from 233 in 1997
• Acres farmed organically, average = 184 – up from 140 in 1997
• 22% of respondents are women– percentage holding steady for OFRF survey respondents since
1993

Organic Market Conditions, 2001
4th National Organic Farmers’ Survey: Sustaining Organic Farms in a Changing Organic Marketplace

OFRF 4th National Organic Farmers' Survey Results
7
Q. This year, did the market for your organic farm product(s) expand, contract or hold steady compared to recent years?
• 44% reported market expansion
• 19% reported expansion or 20% or more
• Market held steady for 33%
• Market contracted for 6%
Market expanded
20% or more19%
Market expanded 5% to 19%
25%
Market held steady
33%
Market was mixed, varied
among products9%
Market contracted5% to 19%
3%
Market contracted
20% or more3%
Figure 4.2--Rate of organic market expansion or contraction for organic farmers in 2001. 974 respondents.

OFRF 4th National Organic Farmers' Survey Results
8
Q. This past year, did average prices for your organic farm products go up, down or hold steady compared to recent years?
• 52% of respondents indicated that organic prices held steady in 2001
• 26% indicated that prices went up
• 15% said prices went downPrices held steady
52%
Prices went up 5% to 19%
23%
Prices went up 20%
or more3%
Prices were mixed4%
Prices went down 20% or more
4%
Prices went down
5% to 19%11%
Figure 4.3--Trends in average prices for organic farm products in 2001. 992 respondents.

OFRF 4th National Organic Farmers' Survey Results
9
Q.What volume percentage of your organically grown product(s) were you able to sell at an organic price premium in 2001? • 92% were able to
obtain organic price premiums
• 41% obtained organic premiums on 100% of their organic product
• Another 30% obtained premiums on at least half of their organic product
100% of organic product
sold41%
Don't know6%
None of organic product sold
8%1%-50% of
organic product sold
15%
51% to 99% oforganic product sold
30%
Figure 4.4--Percentage of organic product sold at organic price premiums in 2001. 996 respondents.

OFRF 4th National Organic Farmers' Survey Results
10
Q. How much, if any, of your organically grown product was sold into the conventional market in 2001?
• 55% of respondents sold no organic product into the conventional market
• 37% sold some portion of their organic product into the conventional market
None of product sold
55%
100% of product sold3%
Don't know8%
51% - 99% of product sold7%
1% to 50% of product sold
27%
Figure 4.5--Percentage of organically grown product sold into the conventional market in 2001. 981 respondents.

4th National Organic Farmers’ Survey: Sustaining Organic Farms in a Changing Organic Marketplace
GMOs and Organic

OFRF 4th National Organic Farmers' Survey Results
12
Q. Based on what you know today about the use of GMOs in agriculture, what do you believe is the risk of exposure and contamination of your organic farm product(s) by GMOs?
• 46% rated their risk of contamination as moderate or greater
• 30% characterized their contamination risk as high to very high
High to Very high risk30%
Moderate risk16%
Low to Very low risk46%
Don't know 8%
Figure 7.1--Perceived level of GMO contamination risk. 1,008 respondents.

OFRF 4th National Organic Farmers' Survey Results
13
Q. What sources, if any, do you feel present risks of GMO contamination to your organically grown products, and to what degree?
8%
23%
30%
42%
48%
Contaminated equipment (f=789)
Contamination at processor/inprocessing (f=791)
Contaminated farm inputs (f=823)
Genetic (pollen) drift in field (f=899)
Contaminated seed stock (f=870)
Percentage of organic farmers selecting moderate or high level of contamination risk
from this source.
Figure 7.2 --Perceived sources of GMO contamination risk
Possible GMO contamination source
• Respondents identified contaminated seed stock and pollen drift as presenting the highest level of GMO contamination risk
OFRF 4th National Organic Farmers' Survey Results
14
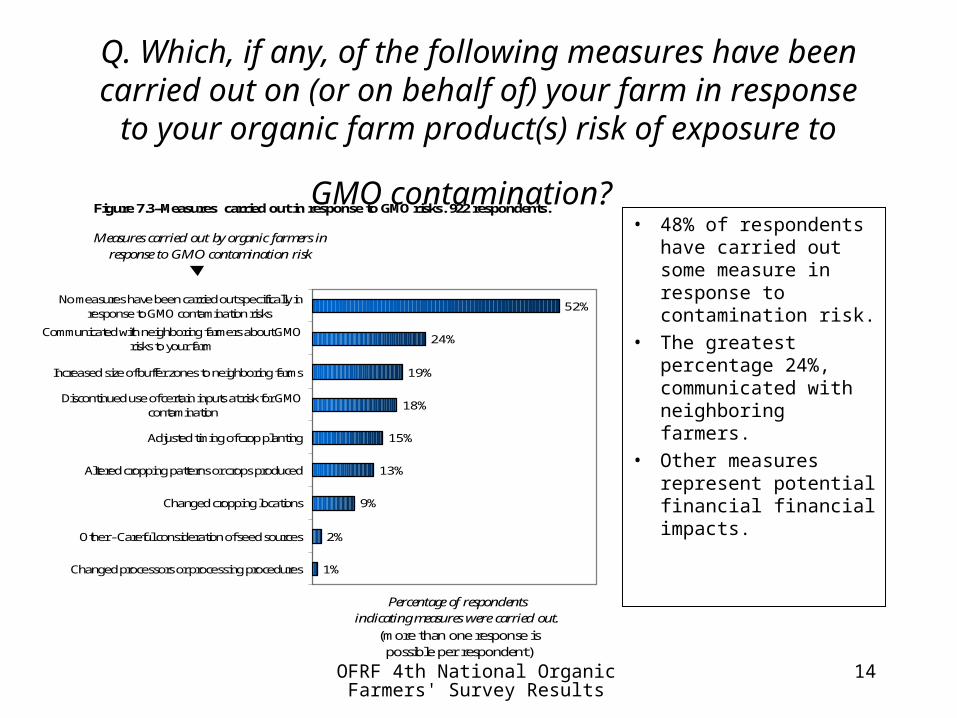
Q. Which, if any, of the following measures have been carried out on (or on behalf of) your farm in response to your
organic farm product(s) risk of exposure to GMO
contamination?
1%
2%
9%
13%
15%
18%
19%
24%
52%
Changed processors or processing procedures
Other - Careful consideration of seed sources
Changed cropping locations
Altered cropping patterns or crops produced
Adjusted timing of crop planting
Discontinued use of certain inputs at risk for GMOcontamination
Increased size of buffer zones to neighboring farms
Communicated with neighboring farmers about GMOrisks to your farm
No measures have been carried out specifically inresponse to GMO contamination risks
Percentage of respondents indicating measures were carried out.
(more than one response is possible per respondent)
Measures carried out by organic farmers in response to GMO contamination risk
Figure 7.3--Measures carried out in response to GMO risks. 922 respondents.
• 48% of respondents have carried out some measure in response to contamination risk.
• The greatest percentage 24%, communicated with neighboring farmers.
• Other measures represent potential financial financial impacts.

OFRF 4th National Organic Farmers' Survey Results
15
Q. What entities, if any, have requested or required that any
of your farm's seed, inputs or products be tested for GMOs?
73%
19%
13%
None
Organiccertifier
Product buyer
Percentage of respondents (multiple responses possible per respondent)
Entities requesting or requiring
GMO testing
Figure 7.4--Incidence of buyer or certifier requests for GMO testing. 969 respondents.
• 27% of respondents have had a GMO test either requested or required by an organic certifier or a buyer.

OFRF 4th National Organic Farmers' Survey Results
16
Q. Has any of your farm's seed, other inputs or organic farm
product been tested for GMOs?
17%
83%
Yes No
Have any organic farm inputs or products been tested for GMOs?
Perc
enta
ge o
f resp
onde
nts
Figure. 7.5--Incidence of GMO testing. 979 respondents.
• 17% of respondents have had GMO testing conducted.

OFRF 4th National Organic Farmers' Survey Results
17
Q. Did any of these seed, input, or organic products test positive for GMO contamination?
11%
89%
Yes No
GMO test results: Were any test results positive?
Perc
enta
ge o
f resp
onde
nts
Figure 7.6--Results of GMO testing. 233 respondents.
• 11% of those who have had GMO testing done received a positive test result.
• This represents 2% of the total respondent population.
OFRF 4th National Organic Farmers' Survey Results
18
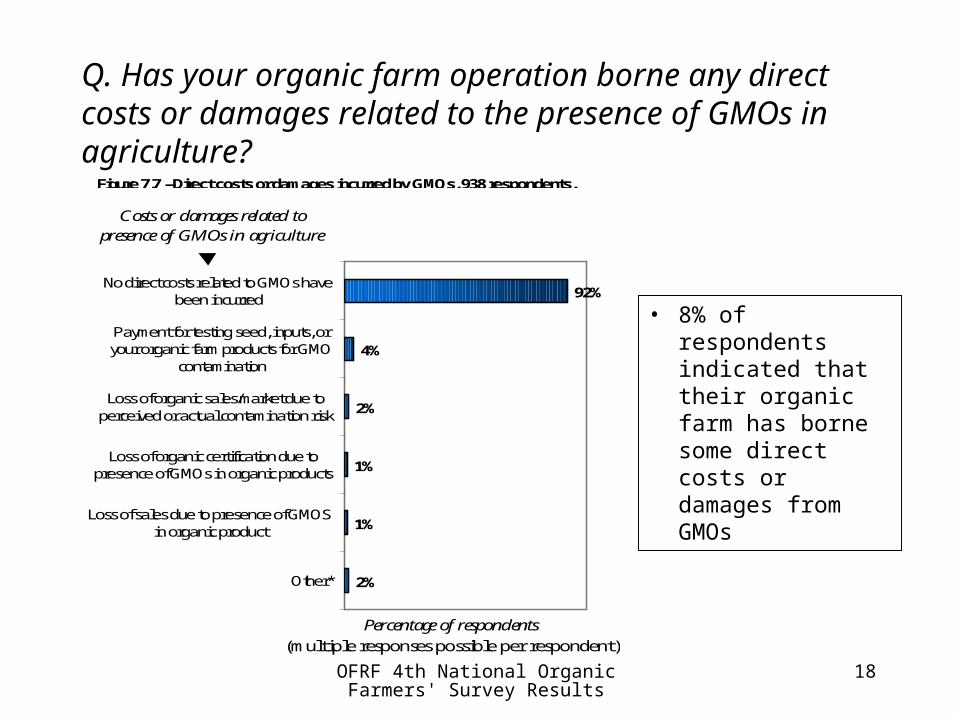
Q. Has your organic farm operation borne any direct costs or damages related to the presence of GMOs in agriculture?
2%
1%
1%
2%
4%
92%
Other*
Loss of sales due to presence of GMOSin organic product
Loss of organic certification due topresence of GMOs in organic products
Loss of organic sales/market due toperceived or actual contamination risk
Payment for testing seed, inputs, oryour organic farm products for GMO
contamination
No direct costs related to GMOs havebeen incurred
Percentage of respondents (multiple responses possible per respondent)
Costs or damages related to presence of GMOs in agriculture
Figure 7.7 --Direct costs or damages incurred by GMOs. 938 respondents.
• 8% of respondents indicated that their organic farm has borne some direct costs or damages from GMOs

OFRF 4th National Organic Farmers' Survey Results
19
Q. Do you feel that a regulatory framework is in place to adequately protect your organic farm product(s) from damages due to possible contamination by GMOs?
No55%
Yes10%
Don't know35%
Figure 7.8--Organic farmers opinions on whether there is sufficient regulagory protection from GMO contamination. 990 respondents.
• Only 10% of respondents feel that a sufficient regulatory framework is in place to protect their organic products from GMO contamination
OFRF 4th National Organic Farmers' Survey Results
20
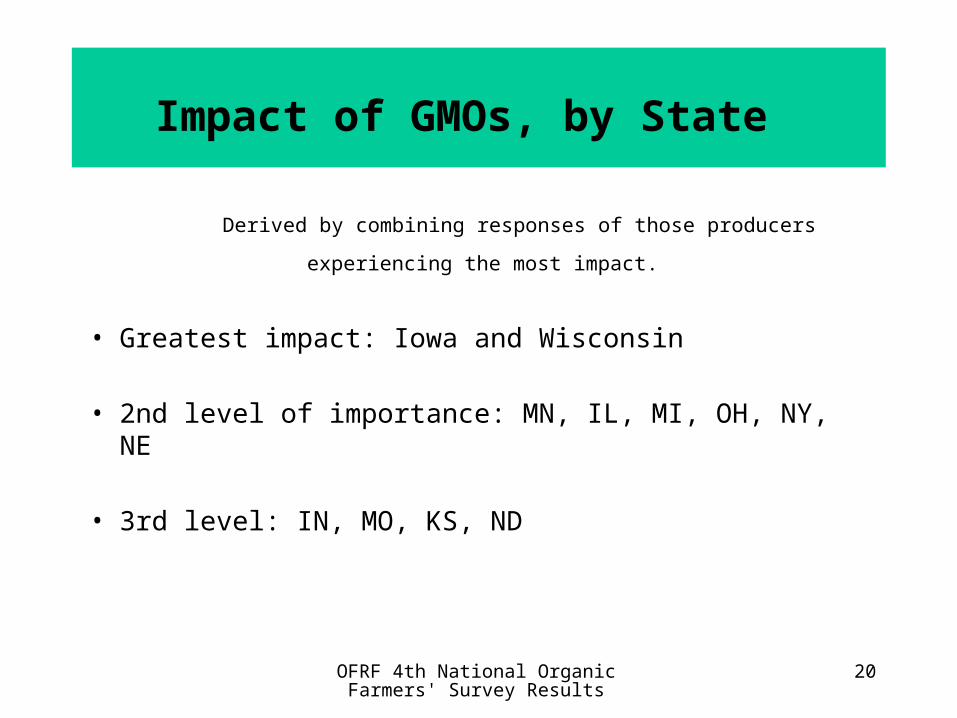
Impact of GMOs, by State
Derived by combining responses of those producers
experiencing the most impact.
• Greatest impact: Iowa and Wisconsin
• 2nd level of importance: MN, IL, MI, OH, NY, NE
• 3rd level: IN, MO, KS, ND