o shoring and skills demand
TRANSCRIPT

Offshoring and Skills Demand∗
Peter Kuhn1, Philip Luck2 and Hani Mansour2
1University of California Santa Barbara2University of Colorado Denver
March 16, 2018
Abstract
This paper studies how offshoring-related layoff events change the mix of skillsthat are demanded by trade-affected firms. Our analysis relies on a novel data setwhich combines the universe of Trade Adjustment Assistance (TAA) petitions filedby US firms during 2010-2015 with detailed information on online job vacancies.TAA petitions allow us to precisely identify the timing of layoff events, the numberof affected workers, and the type of offshoring resulting in the layoff (materials versusservice). Utilizing within firm variation in the timing of filing a TAA petition, wefind little evidence that TAA petitions lead to a change in the monthly number ofvacancies a firm posts online. In contrast, we find that both materials and serviceoffshoring events lead to an increase in the share of vacancies requiring soft skills(such as communication and teamwork). Service offshoring events are also associatedwith an increase in the demand for hard skills (such as math and problem solving).
JEL: F13, F14, J23, J24Keywords: offshoring, skills demand, service trade
∗This draft is preliminary and incomplete. Please to not cite or distribute without the authors priorapproval. We are grateful to seminar participants at the University of Colorado Boulder and PrincetonUniversity. We would like to thank Burning Glass Technologies for graciously providing us access totheir online vacancy database and Bledi Taska for answering our numerous questions about the data. Wewould also like to thank James Reeves for sterling research assistant work on this project. As always, allerrors are our own. Please direct question and comments the corresponding author, Philip Luck (email:[email protected].)
1

1 Introduction
The relocation of U.S. jobs to foreign countries over the past few decades continues to
reshape the U.S. labor market, with some measures suggesting that roughly 25% of U.S.
jobs are offshorable (Blinder and Krueger 2013).1 A large body of literature has focused
on identifying which jobs and what tasks are likely to be offshored and the implications of
such processes on the employment and wages of affected workers (Blinder 2006; Blinder
2009; Bhagwati and Blinder 2009). In particular, several studies have found that offshoring
is linked to the recent phenomenon of job polarization in which the demand for labor in
middle-skill routine tasks has declined (Autor, Levy and Murnane 2003; Autor, Katz and
Kearney 2006, 2008; Goos and Manning 2007; Autor and Dorn 2013; Goos et al. 2014).
It is far less clear, however, how firms reorganize their domestic operations following a
decision to offshore production and how that impacts the composition of their domestic
demand for labor and the demand for specific skills (Hummels et al. 2016). Under one
scenario, the firm simply offshores some tasks abroad, substituting part of its domestic
workers with foreign ones. Under a different scenario, the firm offshores some tasks abroad
while changing the type of tasks performed at home and, as a result, the type of skills it
demands. The main contribution of this paper is to show exactly which skills are made
redundant or scarce following an offshoring-related layoff event, and how trade-affected
firms reorganize their production and their broader demand for labor following a decision
to offshore the tasks performed in one of their establishments.
We utilize a newly constructed data set to study how firms adjust their demand for
domestic labor following a decision to layoff workers and offshore their jobs abroad. The
demand for labor at a given firm is measured by the number of vacancy postings they
advertise and by the change in the mix of skills and type of workers they desire to hire.
Importantly, we differentiate a firm’s labor demand adjustment by whether the layoff
1Following Grossman and Rossi-Hansberg (2008a, b), offshoring occurs when a firm sends part of itsproduction process to a different country, whether the production is kept “in-house” or outsourced to adifferent firm.
2

event was a result of material or service offshoring as they could have different effects on
domestic labor demand (Amiti and Wei 2006).
The novel data set we use for the analysis is constructed by linking two administrative
data sets. The first includes the universe of Trade Adjustment Assistance (TAA) petitions
for the period 2010-2015. It allows us to identify the exact timing a firm experienced
an offshoring-related layoff event, whether the layoff was related to material or service
offshoring, and the number of workers who require assistance. The second data set,
made available to us by Burning Glass Technologies (BGT), contains the near-universe
of online job postings by U.S. establishments for the same time period and is unique in
three important dimensions. First, information on the inflow of new vacancies allows
us to identify changes in the demand for new types of labor with high temporal detail,
eliminating sample selection issues associated with differential fill rates for vacancies.
Second, job vacancies can be identified at the establishment- and firm-levels, allowing us to
examine the spillover effects of offshoring at a single establishment across the entire firm.
Third, in addition to information on education and experience, the data include detailed
descriptions of other skills required in each vacancy such as cognitive, character, computer,
or social skills. In addition, the data include job titles which can provide more granular
and economically-relevant characterizations of skills than even six-digit ONET-SOC codes
(Marinescu and Wolthoff 2016).
Our empirical strategy relies on variation in the timing a firm files an ultimately
approved TAA petition to the government. The identifying assumption is that, controlling
for firm and calendar month fixed effects, the filing of a petition can be treated as if
randomly assigned. We provide support for this assumption using an event study approach
and show that pre-TAA vacancy postings and skill composition trends are unrelated to
the timing a petition was filed. Unlike previous studies which have primarily focused on
the effects of materials offshoring on labor market outcomes, we also examine how service
3

offshoring-related layoffs impact the type of domestic workers a firm hires after deciding
to offshore parts of its operations.
Following the work of Heckman and Kautz (2012), Borghans et al. (2014), Demming
(2017), and Deming and Kahn (Forthcoming) we classify skills into three main categories:
Hard skills (such as cognitive and critical thinking skills), soft skills (such as character
and workforce management skills), and specific skills (such as computer software skills).2
Focusing initially on the number of vacancy postings by skill category, we find no
evidence that layoff events, whether due to materials or service offshoring, are associated
with a change in the overall number of vacancies a firm posts online or the number of
vacancies requiring hard, soft, or specific skills. This is an important finding as it suggests
that, on average, relocating part of the production process abroad does not cause the firm
to downsize its overall domestic demand for labor. It also suggests that changes in the
share of vacancies requiring a given type of skill is the result of a change in the demand
for such skills.
We provide several novel findings on how offshoring-related layoff events impact the
composition of skills required by firms. First, we find evidence that the share of vacancies
requiring at least one hard skill increases in the period following a decision to offshore
some operations abroad. Interestingly, this effect is driven by firms who offshore service
operations and not by those who engage in materials offshoring. Second, we find that
both materials and service offshoring events are associated with an increase in the average
number of vacancies requiring soft skills . Importantly, the change in the share of soft
skills following a materials offshoring event is driven by an increase in the number of
required soft skills among vacancies requiring at least one soft skill (the intensive margin).
In contrast, service offshoring-layoff events are associated with an increase in the share
of vacancies requiring at least one soft skill (the extensive margin) and in the number of
required soft skills among vacancies requiring at least one soft skill. We also find some
2Details on the construction of these skills are provided in the data section.
4

evidence that service offshoring events lead to an increase in the share of vacancies which
require specific skills.
More broadly, the results are consistent with recent research suggesting that the returns
to social skills have increased substantially in the past decade (Demming 2017; Demming
and Kahn, Forthcoming) and highlights the contribution of offshoring to this change. Given
the rapid growth in offshoring of service jobs, these results are of paramount importance
to both U.S. workers who are deciding which skills to acquire, and to policy makers tasked
with designing training and compensation programs for displaced workers.
The paper proceeds as follows. Section 2 describes our data sources and the construction
of the analysis sample. Section 3 outlines the empirical strategy and we discuss the results
in section 4. We conclude in section 5.
2 Data
2.1 Trade Adjustment Assistance Petitions
Under the Trade Expansion Act of 1962 and defined further under the Trade Act of 1974,
U.S. workers are eligible for Trade Adjustment Assistance if a significant proportion of
workers in an establishment are partially or totally separated from their jobs or under
threat of separation. Importantly, the cause of the separation must be trade related.
Specifically, separation must be caused by i) an absolute decline in sales due to increased
imports, ii) outsourcing of production or services to foreign countries, iii) outsourcing of
production or services to foreign countries and a high likelihood of increased imports of
the outsourced good or service, and iv) lower output due to a loss of business as a supplier
of parts or finisher for a TAA certified firm. Failure to meet one of the criteria above
indicates that the firm did not experience a significant layoff event or that it was not
able to provide evidence that the layoff event is trade related. The TAA program is the
largest federal program designed to aid workers impacted by trade exposure (Monarch
5

et al. 2016). Workers who meet one of these criteria are eligible to receive benefits such
as job search and relocation assistance, subsidized health care insurance, and extended
unemployment benefits.3 Importantly, workers and not firms are those who receive the
benefits associated with the program.
Workers or any entity that represents them (company, union, or state) may file a
petition on the workers behalf with the Department of Labor. The petitions are filed at
the establishment level, and TAA certification applies to layoffs at that establishment.
Petitions must be filed within 60 days from when the injury occurred providing us with
information about when the specific shock occurred and variation in the timing of injury
across establishments and firms. For instance, in 2010, 1,281 unique firms experienced
trade exposure covered by TAA program and at those firms 2,718 petitions were certified
covering an estimated 280,873 workers for which over $975 million in federal funds were
allocated to states to provide benefits and services to impacted workers (Monarch et al.
2016).4 We have obtained every TAA petition filed from 1975-2015 through a Freedom
of Information Act request. This data includes the name and industry affiliation of the
firm, the address of the establishment, the number of affected workers, the reason for filing
(including material or service offshoring), the date of the filing, and whether the petition
was accepted or denied. Figure 1 plots the quarterly number of approved offshoring
petitions by type and the number of denied petitions for 2010-2015. According to the
2015 TAA fiscal report, approved petitions disproportionately affect lower skilled workers
whose jobs are threatened because of exposure to foreign competition.5
Although TAA petitions do not capture all forms of exposure to trade and outsourcing,
they provide a very precise and temporally detailed indicator of a layoff event related to
offshoring. Previous research has shown that petitions related to foreign import competition
3Generally, workers are required to enroll in job training programs to receive the unemployment benefits.Alternately, some workers 50 years and older can receive wage insurance for up to two years if they arereemployed in lower paying jobs.
4Historically, most petitions were led by labor unions, but more recently, companies have been themain source of petitions: between 1999 and 2015, just over half of all petitions were led by companies.
5https://www.doleta.gov/tradeact/docs/AnnualReport15.pdf
6

are associated with reductions in the wages of local economies (Kondo 2013) and that they
have heterogeneous effects depending on firm productivity (Uysal et al. 2015). TAA-related
material offshoring events have also been shown to have long run effects on employment,
skill intensity, and output (Monarch et al. 2016). No previous research, however, has
analyzed the impact of offshoring-related layoff events on the firm’s demand for specific
skills. Examining the impact of an offshoring decision on the demand for labor across
establishments and geography will shed light on how firms re-organize their operations
following a decision to relocate certain tasks or production processes abroad.
2.2 Burning Glass Technologies Database
The data set collected by BGT includes more than 60 million electronic job vacancies
in the U.S. for 2010-2015, which BGT obtains by examining over 40,000 job boards and
company websites, resulting in a data set which captures a near-universe of all online
job ads (Hershbein and Kahn 2016). The BGT provides vacancy-posting data covering
the vast majority of occupations, industries and geographic areas. During the period
2010-2015 we observe vacancy postings within 99 percent of all counties. For each vacancy,
BGT creates about 70 possible job characteristics such as the job posting date, job title,
detailed occupational classification, education and experience credentials, and other job
attributes and skill requirements (such as problem solving, knowledge of specific computer
programs, communication, and teamwork skills) which have been standardized from open
text in each job posting.
Detailed skills information, collected for the vast majority of all BGT vacancies, is
unique to this data set and of paramount importance to our research design. From these
requirements, we will construct harmonized measures of skill intensity of vacancies posted
by firms. We classify skills into three broad categories: hard, soft, ad specific skills. Each
category includes a number of related requirements as detailed in Table 1 and the source for
the classification. For example, hard skills include 9 different requirements such as research,
7

math, problem solving and writing. Soft skills include 25 different requirements such as
multi-tasking, teamwork, leadership, and mentoring. Specific skills include 35 different
requirements such as knowledge in excel, powerpoint, Java, inventory, and materials
management. Using similar skills and wage information from the BGT data set, Deming
and Kahn (2017) find a positive correlation between wages and required cognitive and
non-cognitive skills even after controlling for occupation, industry, and geographical fixed
effects. This finding suggests that these job skills can explain variation in wages beyond
what is available in other commonly-used labor market data.
A clear advantage of the BGT data is that they do not rely on information about
vacancies from a single job board such as Monster.com, thus providing a broader coverage
of the flow of vacancies in the U.S. while standardizing vacancy postings and removing
duplicate vacancies posted on more than one job board. Moreover, compared to the
sample of vacancies obtained from JOLTS, the BGT data allow us to track vacancies and
associated demand for different skills within a firm over time. Importantly, the BGT data
include vacancies for jobs in the service industry which enable us to study the effects of
offshoring on these occupations, whereas most previous studies focused on the impacts on
manufacturing jobs.
A disadvantage of the BGT data is that they only cover vacancies posted on the
Internet, and it is possible that the types of vacancies posted online are different from
job posts in more traditional outlets, such as newspapers. Hershbein and Kahn (2016)
conducted an extensive analysis describing the industry-occupation mix of job vacancies
in the BGT. They find that the industry composition of the BGT vacancies is relatively
similar to the industrial composition in JOLTS. In Figure 2 we demonstrate that the
comparability of the BGT and JOLTS also holds for our sample window of 2010-2015.
Moreover, the vacancy data does not measure hires, separations, or total employment.
8

2.3 TAA/BGT Matched Sample
Our analysis sample is constructed by combining the TAA petition dataset with the
BGT vacancy data. The match is based on the firm’s name and the address of the
establishment that filed a petition in any given year. During 2010-2015, the BGT database
contains information on about 60 million unique vacancies posted by about 6 million
unique establishments belonging to 349,805 firms. We exclude from this sample all public
administration vacancies (federal and local government jobs), vacancies without a firm
name, and vacancies at firms who post less than 10 vacancies within the entire sample
period.
During our sample there were 6,241 total petitions accepted for any type of trade
exposure. Of those, 3,453 were filed in zip codes and calendar months in which we
also observe vacancy posting data. Of those potential matches, using name and address
matching, we are able to match 1,011 establishments observed in both the TAA and BGT
database. 733 of those matches are perfect, meaning the firm name and location are
identical across both datasets. The remaining 278 were less than perfect matches and were
verified by visual inspection. We observe 316 materials offshoring events (i.e. relocation of
input production to abroad) and 416 service offshoring events (i.e. relocation of services to
abroad). We limit our analysis to the firms that only experience one offshoring event. We
define an offshoring event as a single type of offshoring petition (materials or service) filed
within a firm-month-year pair. It is possible that multiple establishments within the same
firm file an approved petition in the same month. In this case, we treat these multiple
petitions as one event at the firm level. As an example, in May 2014 Souther California
Edison offshored its information technology operations to two firms in India. As a result
approximately 4,000 employees were laid off across 29 different establishments. In our
TAA dataset, we observe 29 separate petitions, all of which were filed on May 2nd, 2014.
However, by collapsing information at the firm-level, we consider them to be one large
layoff event which the firm experienced. In addition, we exclude from the sample firms who
9

experienced an offshoring event in the five years prior to 2010. This is intended to ensure
that the vacancy postings we observe were not affected by a major offshoring-related layoff
event before the start of our sample period.
Our final sample contains 87,196 establishments belonging to 298 firms which had an
approved TAA petition. The median firm in the analysis sample has about 50 establish-
ments while the average number of establishments per firm is 303. While the unmatched
BGT is quite comparable to the distribution of vacancies as measured by JOLTS, our final
sample over represents industries that one might expect to be more impacted by trade.
In Figure 3 we plot the share of vacancies accounted for by each sector in our sample
relative to both the full BGT sample as well as JOLTS. As one might expect, industries
such as manufacturing, information and finance and insurance are over represented in our
sample, while industries like health care are under represented. Comparing our sample
to the full BGT sample across occupations in Figure 4, we find that our sample contains
more “Computer and Mathematical” vacancies and less “Health Practitioner” vacancies,
which seems consistent with our representation across industries.
Finally, Figure 5 depicts the distribution of affected workers by materials versus service
offshoring events. We are unable to calculate the share of workers affected by offshoring
relative to the number of workers the firm employs. Instead, we proxy for the pre-treatment
size of the firm by the average number of vacancies per month during the year before the
petition was filed. The distribution of affected workers per average number of vacancies
for materials and service offshoring events is depicted in Figure 6. As can be seen, the
number of affected workers as a share of monthly vacancies is similar between materials
and service offshoring evidence. Thus, differences between materials and service offshoring
events do not reflect difference in the magnitude of the layoffs.
10

2.4 Measuring Skills Demand Intensity
Having matched TAA petitions to vacancies at the establishment level we then utilize the
detailed vacancy information in the BGT to construct our primary outcomes of interest.
In addition to analyzing the relationship between an offshoring-related layoff event and the
number of vacancies posted by petitioning firms, we are also interested in how offshoring
might impact the skill and occupational composition of posted vacancies. We construct
three measures of skill composition. The first measure simply calculates the average
number of skill requirements as a share of vacancies posted by the firm:
Stotjt =
∑k(∑
l Skl )
vjt. (1)
where j represents a firm, t is a calendar month, v is total vacancies posted by a given
firm, k represents a job vacancy, and l represents one of three skill categories. Equation (1)
measures the unconditional average number of skills required by a firm, therefore variation
in this measure can come from either a change in the number of vacancies requiring any
such skills or a change in number of skills demanded per vacancy.
The second measure calculates the share of vacancies that require at least one hard,
soft, or specific skill as follows:
Sextjt =
∑k 1k(
∑l S
kl > 0)
vjt(2)
Thus, equation 2 identifies the extensive margin of skill demand, as it captures changes in
the number of vacancies requiring any particular skill but does not measure the intensity
of the demand (i.e. the number of hard soft or specific skills demanded).
The third measure is intended to capture the intensity of demand for those vacancies
that require skills. This measure is equal to the average number of skills required for each
vacancy, conditional on requiring at least one skill. For example, as reported in Table 1,
soft skills contain 25 different types of skills. As a result, conditional on requiring a soft
11

skill, a vacancy could require 1-25 soft skills. We define this measure more formally as
follows:
Sintjt =
∑k 1k(
∑l S
kl > 0) × (
∑l S
kl )
vjt(3)
Variation in this measure identify changes in the intensity of demand for hard, soft and
specific skills.
Having constructed our sample of firms filing TAA petitions and our measures of skills
demand based on detailed information from the BGT, we now describe our empirical
strategy for identifying the effect of offshoring related layoff events on the demand for
skills.
3 Empirical Strategy
3.1 Offshoring Petitions and Labor Demand
We begin by investigating the effect of offshoring-related layoff events on the total number
of vacancies a petitioning firm posts online, and the total number of vacancies requiring a
hard, soft, or specific skills. This is important as it will provide evidence on whether TAA
petitions lead to an absolute decline in the demand for any particular category of skills.
We limit our sample to firms who filed one approved petition and use within-firm variation
in job vacancies.6 The underlying assumption is that, conditional on firm and calendar
month fixed effects, the exact month in which a petition was filed can be thought of as
randomly assigned. This assumption would be violated if petitioning firms were already
in the process of downsizing by laying off workers before filing the petition. However, as
described in the results section, we conduct a series of event-studies which provide little
6This sample selection excludes 23 firms who filed more than one petition during the sample period.Including firms who filed more than one petition in the sample, and considering changes in the numberof vacancies in response to their first approved petition, does not change the results. Results with andwithout these firms can be found in tables A2 and A3 in the appendix.
12

evidence that such pre-trends are present at the affected establishment or the firm as a
whole. Formally, we estimate the following OLS equation:
Vjt = α + βpostjt + Xjt + δj + δt + εjt (4)
where Vjt is the number of online vacancies by skill category posted by firm j in calendar
month t. postjt is an indicator variable which takes the value of 1 starting the month
when the petition was filed through the remaining sample month and zero otherwise. Xjt
is the average time-varying local economic conditions within all counties in which firm j
operates.7 δj and δt are firm and calendar month fixed effects, respectively, and εjt is the
error term. We cluster the standard errors at the firm level.8
The specification in equation 4 estimates the effect of an approved petition on the
firm’s subsequent number of vacancies but does not allow the effect to vary by the number
of affected workers or the firm size. Because firms vary substantially by size, equation 4
could mask substantial heterogeneity in the effect of filing a petition on labor demand.
To address this concern, we estimate a version of equation 4 where we multiply the post
indicator by the number of affected workers as specified in the petition. Thus, post is
equal to the number of affected workers starting the month when the petition was filed
through the remaining sample month and zero otherwise.
3.2 Offshoring Petitions and Skill Composition
Having estimated the effect of offshoring petitions on the firm’s number of vacancy postings,
we proceed by examining whether offshoring-related layoff events lead to a a change in the
composition of skills demanded by the firm. As discussed earlier, we classify skills into
three broad categories: hard skills, soft skills, and specific skills. For each type of skill we
7The average time-varying local economic conditions is calculated as the average number of vacanciesposted by establishments in all counties in which firm i operates that are not owned by firm i. This ismeant to proxy for time-varying local labor demand.
8Appendix Table A1 reports results of estimating a Poisson model.
13

consider the effect of a TAA petition on the average number of required skills, the share
of vacancies requiring at least one skill (the extensive margin), and the average number of
skills conditioning on vacancies requiring at least one such skill (the intensive margin).
Specifically, we estimate the following OLS equation:
yjt = α + βpostjt + Xjt + δj + δt + εjt (5)
where yjt is a measure of skill composition of vacancies posted in calendar month t
by firm j. All other variables are defined as in equation 4. We weight equation 5 by the
number of vacancies posted by the firm in a given month. The coefficient of interest β is
interpreted as the effect of filing a TAA petition on the skill demand by petitioning firms.
Standard errors are clustered at the firm-level.
4 Empirical Results
4.1 Event-Study Approach
We start our empirical analysis by providing evidence in support of the underlying
identification assumption that the timing of filing a TAA petition can be thought of
as randomly assigned with respect to firms labor demand. Figure 7 depicts coefficient
estimates from a simple event-study design in which we estimate the relationship between
filing a petition and overall number of vacancies.9 We normalize the quarter prior to a
TAA petition being filed to equal zero and follow vacancy posting behavior in the 10
quarters prior and 10 quarters after filing a petition, controlling for calendar month and
establishment fixed effects.
9All event studies are estimated using a Poisson model since the dependent variable is the count ofnumber of vacancies. Because the distribution of vacancy postings has a long right tail we expect thata linear OLS model may not fit the data well. We test this hypothesis by performing a RESET test,which confirms that an OLS specification results in considerable remaining heteroskedasticity. See Silvaand Tenreyro (2011) for details regarding the RESET test and the bias generated by heteroskedasticity.Despite this potential source of bias our results are quite similar using an OLS model.
14

Panel A of Figure 7 depicts the number of vacancies posted by affected establishments
separately for materials and service offshoring events. It is important to notice that for
both materials and service offshoring events, there is little evidence to suggest that the
filing of a TAA petition was preceded by significant changes in vacancy postings. The
flat pre-trends suggest that the timing of filing a petition was not a result of a declining
trend in vacancy postings. Interestingly, a materials-related layoff event is associated
with a sharp decline in the number of vacancies an establishment posts. In contrast, an
establishment seem to not change or even increase the number of vacancies it posts after a
service-related layoff event.
Panel B of Figure 7 repeats the same exercise at the firm level. In these specifications,
quarter zero indicates the quarter in which the first TAA petition by an establishment
within the firm was filed. As for the results in Panel A, there is little evidence to suggest
that the timing of filing a petition was preceded by a decline in the activity of the firm–as
measured by vacancy postings. Moreover, at the firm level, we see no indication that the
filing of a TAA petition of either type led to changes in the number of job vacancies a firm
posts. Our sample implicitly conditions on establishments which continue to operate after
filing a petition. However, it is possible that filing a petition could have impacted the
survival of the affected establishment or other establishments within the firm. We explore
this possibility in Panel C of Figure 7 where we replace the dependent variable with the
number of active establishments per firm 10 quarters prior and 10 quarters after filing a
petition. The results provide little evidence that filing a TAA petition is associated with a
change in the composition of existing establishments within the firm.10
4.2 Effect of Offshoring on Labor Demand
Estimating the effect of offshoring-related layoff events on the total number of vacancies
by skill category is important to the interpretation of our results on skill composition.
10We conduct the same event-study style analysis for the composition of skills demand as well and findsimilarly little evidence of pre-trends. These results can be found in Figure A1.
15

For example, if firms reduce their demand for hard skills following a TAA-approved layoff
event, then the share of soft skills from all required skills will mechanically increase even if
the firm does change its demand for soft skills.
Panel A of Table 2 provide no evidence that filing a TAA petition leads to a change in the
number of vacancies posted by a firm (column 1). Importantly, TAA petitions also do not
change the total number of vacancies requiring any skill, or the total number of vacancies
requiring hard, soft, or specific skills. Panel B of Table 2 uses TAA petitions related to
materials offshoring layoff events. The results, although statistically insignificant, suggest
that materials offshoring is associated with a decrease in the number of job vacancies, and
that they are present for all skill categories. In Panel C of Table 2 we use TAA petitions
related to service offshoring layoff events and again find no evidence that TAA petitions
lead to a statistically significant change in the number of job vacancies across the different
types of skills. Table 3 presents results of estimating equation 4 where we replace the post
indicator by the number of workers who were laid off. The results suggest that laying off
an additional workers does not impact the firm’s number of job vacancies or the number
of skill-specific vacancies. Based on the results in Tables 2 and 3, we conclude that an
approved TAA petition does not change the firm’s overall number of job vacancies or the
number of skill-specific job vacancies.
4.3 Effect of Offshoring on Skill Composition
We present results of estimating equation 5 for the different measures of skill composition
in Tables 4-6. The results in Table 4 (Panel A, column 1) indicate that filing a TAA
petition is associated with a 10.5 percentage point increase in the average number of hard
skills required per vacancy, or about a 14.5 percent relative to the mean share of hard
skills vacancies. This effect is driven by an increase in the share of vacancies requiring at
least one hard skill (column 2) and not through an increase in the number of hard skills
among vacancies that require them. Although not statistically significant at conventional
16

levels, the results in Panels B and C of Table 4 suggest that service offshoring is driving
the effects of TAA petitions on the share of hard skills.
The results on the demand for soft skills presented in Table 5 indicate that TAA
petitions are associated with about a 29 percentage point increase in the average number
of soft skills required per vacancy, or about a 12 percent increase relative to a mean of
2.32. In contrast to the results on hard skills, this effect is driven by an increase in the
number of soft skills as a share of vacancies that required at least one such skill. This
is not surprising since, on average, 73 percent of vacancies require at least one soft skill.
Interestingly, this effect is present for both materials and service offshoring as is shown in
Panels B and C.
Table 6 presents the results for specific skills. Although the results in Panel A are
positive in columns 1 and 2, they are not statistically significant at conventional levels.
These positive coefficients are driven by the effects of service offshoring events (Panel C),
but also cannot be distinguished from zero. Based on the results in Tables 4-6, we conclude
that service offshoring events lead to a broader re-organization in the firm’s activities and
to an increase in its demand for hard and soft skills. Similarly, but to a lesser extent,
materials offshoring leads to an increase in the demand for soft skills.
4.4 Effect over Different Time Horizons
To explore how the effects of offshoring vary over time, we replace the post indicator in
equation 5 with 4 different indicators and estimate the effects of filing a TAA petition over
the period of 4 years. The first indicator is equal to 1 during the one year period following
the filing of a petition and zero otherwise, the second indicator is equal to 1 during the 2
year period following a petition and zero otherwise, the third indicator is equal to 1 during
the 3 year period following a petition and zero otherwise, and the fourth indicator takes
the value of 1 during the 4 year period following a petition and zero otherwise.
17

The results in Table 7 indicate that the share of vacancies requiring at least one hard
skill increases immediately in the year following a TAA petition and the coefficients remain
positive and significant throughout the 4 year period we observe (columns 5-8). The
increase in the share of vacancies requiring at least one hard skill is observed for both
material and service offshoring, although the results by type of offshoring are not precisely
estimated. The effects on the demand for soft skills presented in Table 8 also provides
evidence that filing a TAA petition leads to an increase in the share of vacancies requiring
soft skills that persists during the 4 year window we observe. Unlike the effects on hard
skills, the results suggest that the increase in the demand for soft skills is caused by an
increase in the number of soft skills required as a share of vacancies that require at least
one soft skill. Moreover, the results on soft skills are primarily driven by service offshoring.
There is also some evidence (Table 9, Panel C) that the demand for specific skills increases
in the medium- to long-run in response to service offshoring events.
Because petitions were filed at different points in time, the number of post-TAA months
used in the analysis vary by petition and calendar month. As a robustness check, we limit
our post-TAA period to 38 months which is the median number of post-TAA months in
the sample. Although the sample size decreases, the impact of filing a petition on the
number of vacancies (Table 10) and on the skill composition of vacancies (Tables 11-13)
remains unchanged.
5 Conclusion
This paper studies how offshoring-related layoff events change the mix of skills that are
demanded by trade-affected firms, as measured by highly detailed skill requirements in
online job posts. The analysis is based on a newly constructed data set which combines
information on Trade Adjustment Assistance (TAA) petitions with information on job
vacancies posted by the petitioning firm for the period 2010-2015. As a result, we are able
to examine the broader spillover effects of offshoring on the firm’s hiring practices across
18

many establishments. Importantly, the analysis is conducted separately for materials and
service offshoring events which are likely to have fundamentally different effects on the
mix of skills demanded by trade-affected firms (Amiti and Wei 2006).
The results suggest that offshoring-related layoff events do not impact the monthly
number of vacancies an affected firm posts online, and does not affect the number of
vacancies by skill category. However, we find strong evidence that service offshoring
events increases the share of vacancies requiring both hard and soft skills, while having a
smaller impact on the demand for specific skills. In contrast, materials offshoring layoff
events only increases the share of vacancies requiring soft skills. For example, following
a service-related offshoring event, the average number of vacancies requiring soft skills
increases by about 14 percent.
The results provide additional support for the rising importance of social skills in
the past decade (Demming 2017; Demming and Kahn, Forthcoming) and highlights the
contribution of offshoring to this change. Given the role offshoring has played in reshaping
the U.S. labor market, these results are of paramount importance to understand the
broader implications of offshoring on the allocation of tasks not only within affected
local labor markets but across other seemingly non-affected labor markets. The results
should also guide vulnerable workers who are deciding which skills to acquire in order to
mitigate the effects of offshoring, and to policy makers tasked with designing training and
compensation programs for displaced workers.
19

References
Abowd, John M., Francis Kramarz, and David N. Margolis, “High Wage Workersand High Wage Firms,” Econometrica, March 1999, 67 (2), 251–334.
Alexander, Katie Genadek Ronald Goeken Matthew B. Schroeder Steven Rug-gles Trent and Matthew Sobek, “Integrated Public Use Microdata Series: Version5.0 [Machine-readable database],” Technical Report, Minneapolis: University of Min-nesota 2010.
Amiti, Mary and Shang-Jin Wei, “Service Offshoring and Productivity: Evidencefrom the US,” World Economy, 2009, 32 (2), 203–220.
Arai, Mahmood, “Wages, Profits and Capital Intensity: Evidence from Matched Worker-Firm Data,” Research Papers in Economics 1999:3, Stockholm University, Departmentof Economics April 1999.
Autor, David H., Frank Levy, and Richard J. Murnane, “The skill content ofrecent technological change: an empirical exploration,” Proceedings, 2003, (Nov).
, Lawrence F. Katz, and Melissa S. Kearney, “The Polarization of the U.S.Labor Market,” American Economic Review, May 2006, 96 (2), 189–194.
Beaudry, Paul, David A. Green, and Benjamin M. Sand, “The Great Reversal inthe Demand for Skill and Cognitive Tasks,” Journal of Labor Economics, 2016, 34(S1), S199–S247.
Bhagwati, J.N., A.S. Blinder, and B.M. Friedman, Offshoring of American Jobs:What Response from U.S. Economic Policy? Alvin Hansen Symposium Series onPublic Policy, MIT Press, 2009.
Blinder, Alan S., “The Challenge of High Unemployment,” American Economic Review,1988, 78, 131–139.
and Alan B. Krueger, “Alternative Measures of Offshorability: A Survey Ap-proach,” Journal of Labor Economics, 2013, 31 (S1), S97–S128.
Bustos, Paula, “The Impact of Trade Liberalization on Skill Upgrading Evidence fromArgentina,” Working Papers 559, Barcelona Graduate School of Economics April2011.
Cameron, A. Colin, Jonah B. Gelbach, and Douglas L. Miller, “Robust Inferencewith Multi-way Clustering,” Working Paper 327, National Bureau of EconomicResearch September 2006.
Castex, Gonzalo and Evgenia Kogan Dechter, “The Changing Roles of Educationand Ability in Wage Determination,” Journal of Labor Economics, 2014, 32 (4),685–710.
20

Davidson, Carl, Lawrence Martin, and Steven Matusz, “Trade and search gen-erated unemployment,” Journal of International Economics, August 1999, 48 (2),271–299.
Deming, David and Lisa B. Kahn, “Skill Requirements across Firms and LaborMarkets: Evidence from Job Postings for Professionals,” Working Paper 23328,National Bureau of Economic Research 2017, month =.
Deming, David J., “The Growing Importance of Social Skills in the Labor Market,”Quarterly Journal of Economics, forthcoming.
Ebenstein, Avraham, Ann Harrison, Margaret McMillan, and ShannonPhillips, “Estimating the Impact of Trade and Offshoring on American Workersusing the Current Population Surveys,” The Review of Economics and Statistics,2014, 96 (4), 581–595.
Feenstra, Robert C. and Bradford Jensen, “Evaluating Estimates of Materials Off-shoring from U.S. Manufacturing,” UC Davis Working Paper, University of California,Davis 2009.
Frigant, Vincent and Yannick Lung, “Geographical proximity and supplying relation-ships in modular production,” International Journal of Urban and Regional Research,2002, 26 (4), 742–755.
Goos, Maarten, Alan Manning, and Anna Salomons, “Explaining Job Polarization:Routine-Biased Technological Change and Offshoring,” American Economic Review,2014, 104 (8), 2509–26.
Hamermesh, Daniel S., “Fun with Matched Firm-Employee Data: Progress and RoadMaps,” IZA Discussion Papers 2580, Institute for the Study of Labor (IZA) January2007.
Heckman, James J. and Tim Kautz, “Hard evidence on soft skills,” Labour Economics,2012, 19 (4), 451–464.
Hershbein, Brad and Lisa B. Kahn, “Do Recessions Accelerate Routine-BiasedTechnological Change? Evidence from Vacancy Postings,” Working Paper 22762,National Bureau of Economic Research October 2016.
Hummels, David, Rasmus Jrgensen, Jakob Munch, and Chong Xiang, “TheWage Effects of Offshoring: Evidence from Danish Matched Worker-Firm Data,”American Economic Review, June 2014, 104 (6), 1597–1629.
Jensen, J. Bradford and Lori G. Kletzer, Measuring Tradable Services and the TaskContent of Offshorable Services Jobs, University of Chicago Press, October
Levine, David, “Production Chains,” Review of Economic Dynamics, July 2012, 15 (3),271–282.
21

Marinescu, Ioana E. and Ronald P. Wolthoff, “Opening the Black Box of theMatching Function: The Power of Words,” IZA Discussion Papers 9071, Institute forthe Study of Labor (IZA) May 2015.
Martins, Pedro S. and Luca David Opromolla, “Exports, Imports and Wages: Evi-dence from Matched Firm-Worker-Product Panels,” Working Papers 4646, Institutefor the Study of Labor 2009.
Monarch, Ryan, Jooyoun Park, and Jagadeesh Sivadasan, “Domestic gains fromoffshoring? Evidence from TAA-linked U.S. microdata,” Journal of InternationalEconomics, 2017, 105 (C), 150–173.
Montgomery, James D, “Equilibrium Wage Dispersion and Interindustry Wage Differ-entials,” The Quarterly Journal of Economics, February 1991, 106 (1), 163–79.
S., R. Lanz Miroudot and A. Ragoussis, “Trade in Intermediate Goods and Services,”2009.
Silva, J.M.C. Santos and Silvana Tenreyro, “Further simulation evidence on theperformance of the Poisson pseudo-maximum likelihood estimator,” Economics Letters,August 2011, 112 (2), 220–222.
Tomiura, Eiichi, “Foreign outsourcing, exporting, and FDI: A productivity comparisonat the firm level,” Journal of International Economics, 2007, 72 (1), 113 – 127.
Trends in U.S. Wage Inequality: Revising the Revisionists, Review of Eco-nomics and Statistics, 2008, 90 (2), 300–323. Data and Replication Files.
Uysal, Pinar, Yoto Yotov, and Thomas Zylkin, “Firm Heterogeneity and Trade-Induced Layoffs: An Empirical Investigation,” School of Economics Working PaperSeries 2014-6, LeBow College of Business, Drexel University 2015.
Voigtlander, Nico, “Skill Bias Magnified: Intersectoral Linkages and White-Collar LaborDemand in U.S. Manufacturing,” Review of Economics and Statistics, 2013.
Yeaple, Stephen Ross, “Offshoring, Foreign Direct Investment, and the Structure ofU.S. Trade,” Journal of the European Economic Association, 04-05 2006, 4 (2-3),602–611.
22

6 Figures
Figure 1: TAA Petition Filing Over Time
050
100
150
200
Num
ber o
f Pet
itions
2010q1 2011q2 2012q3 2013q4 2015q1 2016q2Year
Goods Offshoring Services OffshoringDenied Petitions
Notes:This figure plots total number of petitions filed and approved quarterly for both Materials and Service offshoringas well as the total number of denied petitions between 2010-2015.
23

Figure 2: BGT vs. JOLTS
0
0.05
0.1
0.15
0.2
0.25Sh
are
of to
tal v
acan
cies
Share of vacancies by 2-digit industry (HK)
All BGT JOLTS
Notes: The above figure plots the share of total vacancies by industry for both the BGT and for JOLTS.
Figure 3: Full BGT vs. TAA/BGT sample across Industries
0
0.05
0.1
0.15
0.2
0.25
0.3
Shar
e of
tota
l vac
anci
es
Share of total vacancies by 2-digit industry
All BGT Sample JOLTS
Notes: The above figure plots share of total vacancies across industries in the JOLTS, the full BGT and our sample.
24

Figure 4: Full BGT vs. TAA/BGT sample across Occupations
0
0.02
0.04
0.06
0.08
0.1
0.12
0.14
0.16
0.18
0.2
Shar
e of
tota
l vac
anci
es
Share of total vacancies by occupation
All BGT Sample
Notes: The above figure plots share of total vacancies across occupations in the JOLTS, the full BGT and our sample.
Figure 5: Distribution of Number of Affected Workers for Offshoring Firms
Notes:This figure plots total number of petitions filed and approved quarterly for both Materials and Service offshoringas well as the total number of denied petitions between 2010-2015.
25

Figure 6: Distribution of Workers per Average Number of Vacancies for Off-shoring Firms
Notes:This figure plots total number of petitions filed and approved quarterly for both Materials and Service offshoringas well as the total number of denied petitions between 2010-2015.
26

Figure 7: Effect of Offshoring on Establishment, Firm-level Vacancy and Num-ber of Active Establishments
Materials Service
Panel A: Total Establishment Level Vacancies
Panel B: Total Firm Level Vacancies
Panel C: Establishments Per Firm
Notes: The above figure plots marginal effects for an event study regression where an offshoring petition is filed attime zero. Event time is measured in quarters. Total vacancies at the establishment and firm-level are measured inlevesl and our model is estimated as a Poisson. An in panel C an an establishment is considered active at time t if itposts a vacancy within 6 months after t.
27

7 Tables
Table 1: Defining Skill Categories Using Vacancy Posting Requirements
Skill Group Skill Requirements Skill Measure Source
Hard Cognitive Research, analytics, math, Based on DK (2016)statistics, data analysis
Hard Critical Thinking Problem solving, critical thinking, Our Measurestrategist thinkings
Hard Writing Writing DK (2016)Soft Character Organized, detail oriented, multi-tasking, DK (2016)
time management, meeting deadlines,energetic, communication skills
Soft Customer Service Customer, sales, client, patient, DK (2016)retail sales, up-selling
Soft Social Communication, teamwork, collaboration, DK (2016)negotiation, presentation, listening
Soft Workforce Management Supervisory, Leadership, management, Based on DK (2016)mentoring, staff project manager
Specific Automation Support Robot, robotics, automation Our Measuremachine operation, machinery
Specific Computer Computer, spreadsheet, Microsoft, DK (2016)excel, powerpoint
Specific Financial Budgeting, accounting, finance, Based on DK (2016)cost, financial analysis,financial analysis, cost, financial analysis
Specific Offshoring Support Supply chain, logistics, inventory, Our Measureinternational, import, export,material flow, materials management,purchase management, warehouse
Specific Software JAVA, SQL, Python, C++, CAD, DK (2016)LexisNexus, Visual Basic
Notes: Most of our measures are based on categories developed by Deming and Kahn (2016), which in the above table are listedas sourced from DK (2016). For several of our measures we have revised their definition slightly, these measures are listed as“based on DK (2016)”. For example, Deming and Kahn (2016) define Cognitive skills as requiring one of the following: ProblemSolving, Research, Analytical, Critical Thinking, Math, Statistics. In order to define an additional skill we call Critical thinkingwe have updated our measure of Cognitive skills as described above. Workforce management is based on a combination oftwo measures proposed by Deming and Kahn, workforce management and Project management. Financial skills are based onDeming and Kahn’s measure by the same name, which defined this still as requiring one of the following: budgeting, accounting,finance, or cost. Lastly, both Automation support and Offshoring support are measures created by us and are meant to captureskills which are complementary to trade and automation, two possible drivers of changes in skills demand.
28

Table 2: Effect of All Offshoring on Total Labor Demand OLS
Total Any Skill Hard Soft Specific
(1) (2) (3) (4) (5)
A: Total Offshoringβ : Post 14.359 24.524 11.523 25.455 16.382
(41.315) (40.152) (23.603) (38.616) (22.376)Time FE X X X X XFirm FE X X X X XCounty-Time Controls X X X X XY mean 111.69 104.25 50.42 87.25 52.39Reset p-val 0.03 0.04 0.27 0.06 0.06Observations 19512 19512 19512 19512 19512
Total Any Skill Hard Soft Specific
(1) (2) (3) (4) (5)
B: Materials Offshoringβ : Post -24.960 -25.421 -18.619 -27.164 -15.606
(35.466) (35.344) (25.517) (33.503) (19.515)Time FE X X X X XFirm FE X X X X XCounty-Time Controls X X X X XY mean 61.74 59.90 33.87 49.14 34.66Reset p-val 0.01 0.01 0.03 0.02 0.01Observations 12024 12024 12024 12024 12024
Total Any Skill Hard Soft Specific
(1) (2) (3) (4) (5)
C: Service Offshoringβ : Post 68.888 90.893 47.982 93.376 57.794
(73.681) (70.857) (36.202) (68.301) (39.777)Time FE X X X X XFirm FE X X X X XCounty-Time Controls X X X X XY mean 186.36 172.41 81.88 147.31 83.43Reset p-val 0.04 0.05 0.06 0.06 0.06Observations 9432 9432 9432 9432 9432
Notes: The dependent variable is the share of vacancy postings across the the occupational routineness distribution. Thedependent variable in column 1 is the number of vacancies in occupation from the lowest quartile of routineness (i.e. the leastroutine occupatoins) as a share of all vacancies. The dependent variable in column 4 is the number of vacancies in occupationfrom the highest quartile of routineness (i.e. the most routine occupations). Petitions and vacancies are measured at the firmlevel. Standard errors are clustered at the firm level are reported in parenthesis.* p<0.10, ** p<0.05, *** p<0.01
29

Table 3: Effect of All Offshoring on Total Labor Demand OLS (TreatmentPost×W )
Total Any Skill Hard Soft Specific
(1) (2) (3) (4) (5)β : Post×Workers -4.048 1.860 0.824 -1.669 2.548
(24.060) (25.165) (14.815) (22.656) (15.394)Time FE X X X X XFirm FE X X X X XCounty-Time Controls X X X X XY mean 111.69 104.25 50.42 87.25 52.39Reset p-val 0.07 0.02 0.01 0.01 0.01Observations 19512 19512 19512 19512 19512
Total Any Skill Hard Soft Specific
(1) (2) (3) (4) (5)β : Post×Workers -1.060 13.097 14.731 -3.118 16.547
(81.204) (79.939) (46.864) (74.768) (48.044)Time FE X X X X XFirm FE X X X X XCounty-Time Controls X X X X XY mean 111.69 104.25 50.42 87.25 52.39Reset p-val 0.00 0.13 0.01 0.01 0.05Observations 19512 19512 19512 19512 19512
Total Any Skill Hard Soft Specific
(1) (2) (3) (4) (5)β : Post×Workers 5.065 10.282 -6.319 10.138 4.518
(18.698) (22.043) (8.889) (21.403) (11.424)Time FE X X X X XFirm FE X X X X XCounty-Time Controls X X X X XY mean 111.69 104.25 50.42 87.25 52.39Reset p-val 0.02 0.65 0.01 0.17 0.01Observations 19512 19512 19512 19512 19512
Notes: Petitions and vacancies are measured at the firm level. Standard errors are clustered at the firm level are reported inparenthesis.* p<0.10, ** p<0.05, *** p<0.01
30

Table 4: Effect of All Offshoring on Hard Skills Demand OLS
Stot Sext Sint
(1) (2) (3)
A: Total Offshoringβ : Post 0.105∗ 0.052∗∗ 0.016
(0.053) (0.025) (0.030)Time FE X X XFirm FE X X XCounty-Time Controls X X XY mean 0.72 0.47 1.31Reset p-val 0.80 0.34 0.00Observations 12987 12987 12987
Stot Sext Sint
(1) (2) (3)
B: Materials Offshoringβ : Post 0.009 0.009 -0.005
(0.055) (0.039) (0.025)Time FE X X XFirm FE X X XCounty-Time Controls X X XY mean 0.71 0.47 1.27Reset p-val 0.20 0.23 0.50Observations 6763 6763 6763
Stot Sext Sint
(1) (2) (3)
C: Service Offshoringβ : Post 0.082 0.035 0.009
(0.071) (0.036) (0.037)Time FE X X XFirm FE X X XCounty-Time Controls X X XY mean 0.73 0.47 1.36Reset p-val 0.97 0.32 0.00Observations 6734 6734 6734
Notes: Petitions and vacancies are measured at the firm level. Standard errors are clustered at the firm level are reported inparenthesis.* p<0.10, ** p<0.05, *** p<0.01
31

Table 5: Effect of All Offshoring on Soft Skills Demand OLS
Stot Sext Sint
(1) (2) (3)
A: Total Offshoringβ : Post 0.287∗∗ 0.066 0.163∗∗∗
(0.113) (0.045) (0.061)Time FE X X XFirm FE X X XCounty-Time Controls X X XY mean 2.32 0.73 2.87Reset p-val 0.77 0.54 0.64Observations 12987 12987 12987
Stot Sext Sint
(1) (2) (3)
B: Materials Offshoringβ : Post 0.116 -0.015 0.195∗∗
(0.086) (0.013) (0.080)Time FE X X XFirm FE X X XCounty-Time Controls X X XY mean 2.14 0.70 2.70Reset p-val 0.26 0.41 0.06Observations 6763 6763 6763
Stot Sext Sint
(1) (2) (3)
C: Service Offshoringβ : Post 0.357∗∗ 0.110∗ 0.104
(0.159) (0.066) (0.086)Time FE X X XFirm FE X X XCounty-Time Controls X X XY mean 2.51 0.77 3.04Reset p-val 0.88 0.76 0.52Observations 6734 6734 6734
Notes: Petitions and vacancies are measured at the firm level. Standard errors are clustered at the firm level are reported inparenthesis.* p<0.10, ** p<0.05, *** p<0.01
32

Table 6: Effect of All Offshoring on Specific Demand OLS
Stot Sext Sint
(1) (2) (3)
A: Total Offshoringβ : Post 0.081 0.024 -0.006
(0.065) (0.016) (0.071)Time FE X X XFirm FE X X XCounty-Time Controls X X XY mean 1.45 0.56 2.29Reset p-val 0.24 0.51 0.02Observations 12987 12987 12987
Stot Sext Sint
(1) (2) (3)
B: Materials Offshoringβ : Post -0.043 -0.001 -0.074
(0.057) (0.020) (0.048)Time FE X X XFirm FE X X XCounty-Time Controls X X XY mean 1.52 0.59 2.30Reset p-val 0.65 1.00 0.57Observations 6763 6763 6763
Stot Sext Sint
(1) (2) (3)
C: Service Offshoringβ : Post 0.110 0.024 0.017
(0.071) (0.020) (0.094)Time FE X X XFirm FE X X XCounty-Time Controls X X XY mean 1.37 0.54 2.27Reset p-val 0.35 0.54 0.02Observations 6734 6734 6734
Notes: Petitions and vacancies are measured at the firm level. Standard errors are clustered at the firm level are reported inparenthesis.* p<0.10, ** p<0.05, *** p<0.01
33
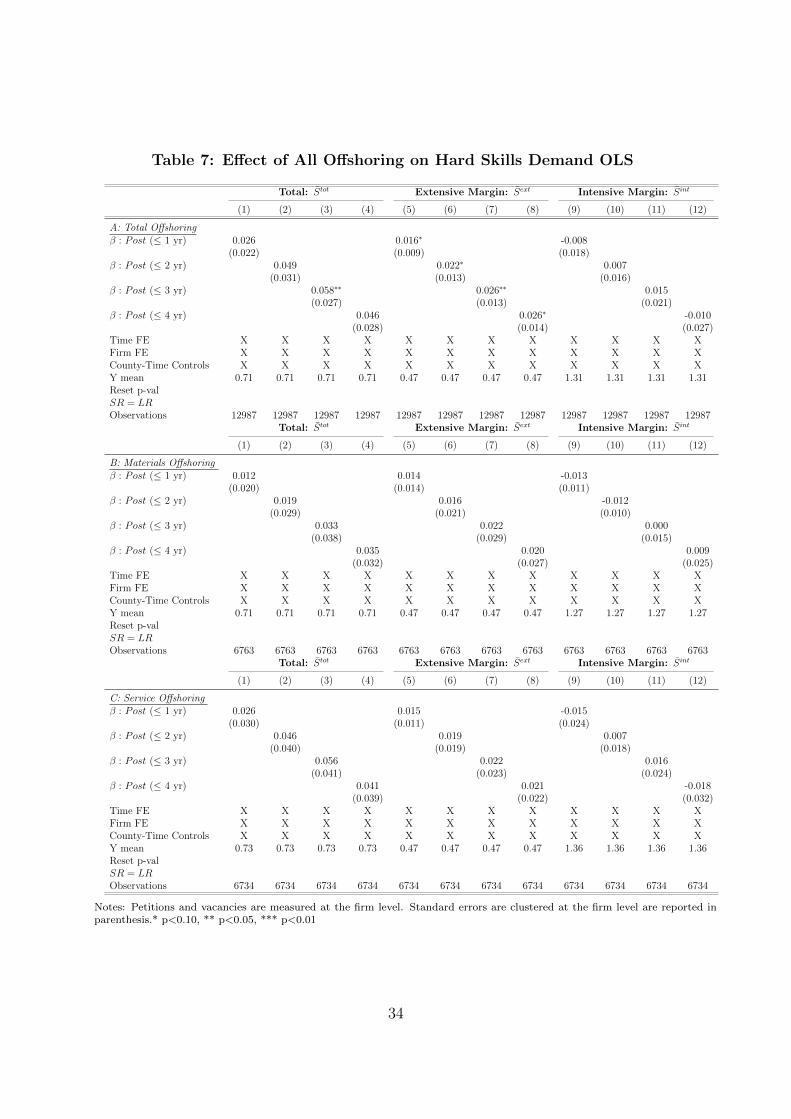
Table 7: Effect of All Offshoring on Hard Skills Demand OLS
Total: Stot Extensive Margin: Sext Intensive Margin: Sint
(1) (2) (3) (4) (5) (6) (7) (8) (9) (10) (11) (12)
A: Total Offshoringβ : Post (≤ 1 yr) 0.026 0.016∗ -0.008
(0.022) (0.009) (0.018)β : Post (≤ 2 yr) 0.049 0.022∗ 0.007
(0.031) (0.013) (0.016)β : Post (≤ 3 yr) 0.058∗∗ 0.026∗∗ 0.015
(0.027) (0.013) (0.021)β : Post (≤ 4 yr) 0.046 0.026∗ -0.010
(0.028) (0.014) (0.027)Time FE X X X X X X X X X X X XFirm FE X X X X X X X X X X X XCounty-Time Controls X X X X X X X X X X X XY mean 0.71 0.71 0.71 0.71 0.47 0.47 0.47 0.47 1.31 1.31 1.31 1.31Reset p-valSR = LRObservations 12987 12987 12987 12987 12987 12987 12987 12987 12987 12987 12987 12987
Total: Stot Extensive Margin: Sext Intensive Margin: Sint
(1) (2) (3) (4) (5) (6) (7) (8) (9) (10) (11) (12)
B: Materials Offshoringβ : Post (≤ 1 yr) 0.012 0.014 -0.013
(0.020) (0.014) (0.011)β : Post (≤ 2 yr) 0.019 0.016 -0.012
(0.029) (0.021) (0.010)β : Post (≤ 3 yr) 0.033 0.022 0.000
(0.038) (0.029) (0.015)β : Post (≤ 4 yr) 0.035 0.020 0.009
(0.032) (0.027) (0.025)Time FE X X X X X X X X X X X XFirm FE X X X X X X X X X X X XCounty-Time Controls X X X X X X X X X X X XY mean 0.71 0.71 0.71 0.71 0.47 0.47 0.47 0.47 1.27 1.27 1.27 1.27Reset p-valSR = LRObservations 6763 6763 6763 6763 6763 6763 6763 6763 6763 6763 6763 6763
Total: Stot Extensive Margin: Sext Intensive Margin: Sint
(1) (2) (3) (4) (5) (6) (7) (8) (9) (10) (11) (12)
C: Service Offshoringβ : Post (≤ 1 yr) 0.026 0.015 -0.015
(0.030) (0.011) (0.024)β : Post (≤ 2 yr) 0.046 0.019 0.007
(0.040) (0.019) (0.018)β : Post (≤ 3 yr) 0.056 0.022 0.016
(0.041) (0.023) (0.024)β : Post (≤ 4 yr) 0.041 0.021 -0.018
(0.039) (0.022) (0.032)Time FE X X X X X X X X X X X XFirm FE X X X X X X X X X X X XCounty-Time Controls X X X X X X X X X X X XY mean 0.73 0.73 0.73 0.73 0.47 0.47 0.47 0.47 1.36 1.36 1.36 1.36Reset p-valSR = LRObservations 6734 6734 6734 6734 6734 6734 6734 6734 6734 6734 6734 6734
Notes: Petitions and vacancies are measured at the firm level. Standard errors are clustered at the firm level are reported inparenthesis.* p<0.10, ** p<0.05, *** p<0.01
34
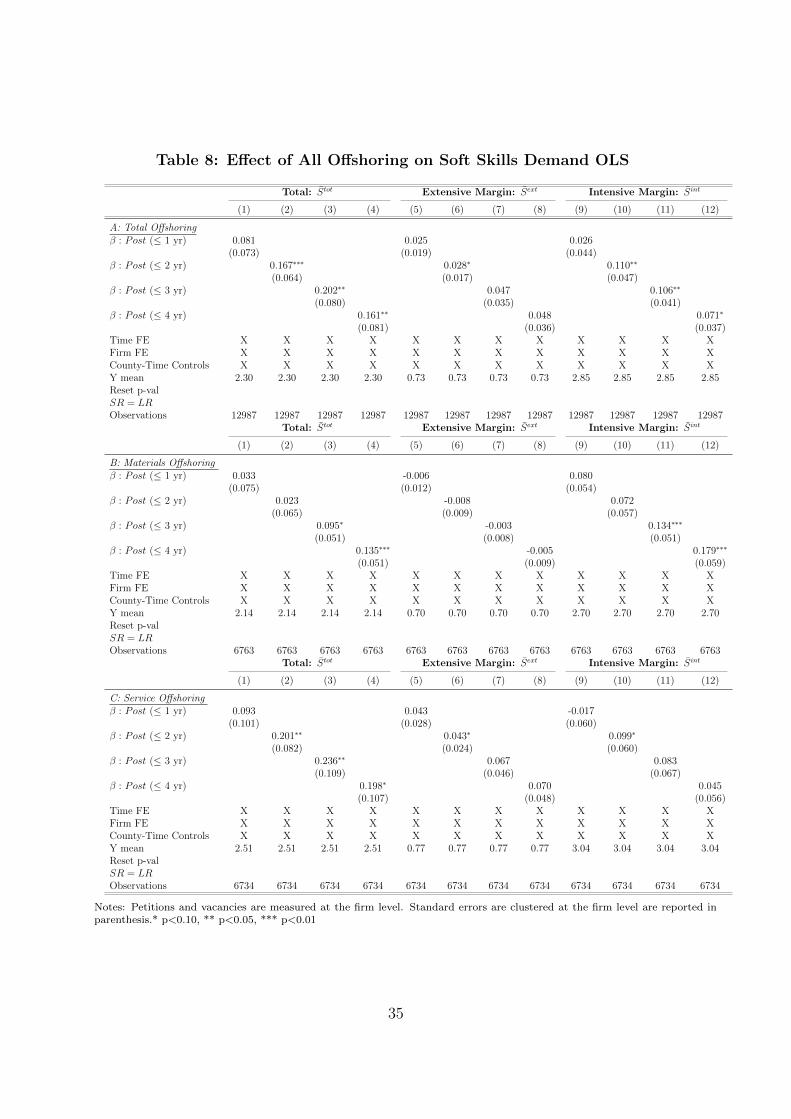
Table 8: Effect of All Offshoring on Soft Skills Demand OLS
Total: Stot Extensive Margin: Sext Intensive Margin: Sint
(1) (2) (3) (4) (5) (6) (7) (8) (9) (10) (11) (12)
A: Total Offshoringβ : Post (≤ 1 yr) 0.081 0.025 0.026
(0.073) (0.019) (0.044)β : Post (≤ 2 yr) 0.167∗∗∗ 0.028∗ 0.110∗∗
(0.064) (0.017) (0.047)β : Post (≤ 3 yr) 0.202∗∗ 0.047 0.106∗∗
(0.080) (0.035) (0.041)β : Post (≤ 4 yr) 0.161∗∗ 0.048 0.071∗
(0.081) (0.036) (0.037)Time FE X X X X X X X X X X X XFirm FE X X X X X X X X X X X XCounty-Time Controls X X X X X X X X X X X XY mean 2.30 2.30 2.30 2.30 0.73 0.73 0.73 0.73 2.85 2.85 2.85 2.85Reset p-valSR = LRObservations 12987 12987 12987 12987 12987 12987 12987 12987 12987 12987 12987 12987
Total: Stot Extensive Margin: Sext Intensive Margin: Sint
(1) (2) (3) (4) (5) (6) (7) (8) (9) (10) (11) (12)
B: Materials Offshoringβ : Post (≤ 1 yr) 0.033 -0.006 0.080
(0.075) (0.012) (0.054)β : Post (≤ 2 yr) 0.023 -0.008 0.072
(0.065) (0.009) (0.057)β : Post (≤ 3 yr) 0.095∗ -0.003 0.134∗∗∗
(0.051) (0.008) (0.051)β : Post (≤ 4 yr) 0.135∗∗∗ -0.005 0.179∗∗∗
(0.051) (0.009) (0.059)Time FE X X X X X X X X X X X XFirm FE X X X X X X X X X X X XCounty-Time Controls X X X X X X X X X X X XY mean 2.14 2.14 2.14 2.14 0.70 0.70 0.70 0.70 2.70 2.70 2.70 2.70Reset p-valSR = LRObservations 6763 6763 6763 6763 6763 6763 6763 6763 6763 6763 6763 6763
Total: Stot Extensive Margin: Sext Intensive Margin: Sint
(1) (2) (3) (4) (5) (6) (7) (8) (9) (10) (11) (12)
C: Service Offshoringβ : Post (≤ 1 yr) 0.093 0.043 -0.017
(0.101) (0.028) (0.060)β : Post (≤ 2 yr) 0.201∗∗ 0.043∗ 0.099∗
(0.082) (0.024) (0.060)β : Post (≤ 3 yr) 0.236∗∗ 0.067 0.083
(0.109) (0.046) (0.067)β : Post (≤ 4 yr) 0.198∗ 0.070 0.045
(0.107) (0.048) (0.056)Time FE X X X X X X X X X X X XFirm FE X X X X X X X X X X X XCounty-Time Controls X X X X X X X X X X X XY mean 2.51 2.51 2.51 2.51 0.77 0.77 0.77 0.77 3.04 3.04 3.04 3.04Reset p-valSR = LRObservations 6734 6734 6734 6734 6734 6734 6734 6734 6734 6734 6734 6734
Notes: Petitions and vacancies are measured at the firm level. Standard errors are clustered at the firm level are reported inparenthesis.* p<0.10, ** p<0.05, *** p<0.01
35

Table 9: Effect of All Offshoring on Specific Demand OLS
Total: Stot Extensive Margin: Sext Intensive Margin: Sint
(1) (2) (3) (4) (5) (6) (7) (8) (9) (10) (11) (12)
A: Total Offshoringβ : Post (≤ 1 yr) -0.015 -0.003 -0.040
(0.033) (0.009) (0.036)β : Post (≤ 2 yr) 0.037 0.008 0.015
(0.032) (0.010) (0.039)β : Post (≤ 3 yr) 0.077∗∗ 0.022∗∗ 0.011
(0.038) (0.010) (0.055)β : Post (≤ 4 yr) 0.052 0.018∗ -0.018
(0.037) (0.010) (0.049)Time FE X X X X X X X X X X X XFirm FE X X X X X X X X X X X XCounty-Time Controls X X X X X X X X X X X XY mean 1.44 1.44 1.44 1.44 0.56 0.56 0.56 0.56 2.28 2.28 2.28 2.28Reset p-valSR = LRObservations 12987 12987 12987 12987 12987 12987 12987 12987 12987 12987 12987 12987
Total: Stot Extensive Margin: Sext Intensive Margin: Sint
(1) (2) (3) (4) (5) (6) (7) (8) (9) (10) (11) (12)
B: Materials Offshoringβ : Post (≤ 1 yr) -0.032 -0.005 -0.043
(0.036) (0.012) (0.027)β : Post (≤ 2 yr) -0.022 0.001 -0.046∗
(0.031) (0.010) (0.023)β : Post (≤ 3 yr) 0.012 0.016 -0.043
(0.032) (0.011) (0.027)β : Post (≤ 4 yr) 0.021 0.017 -0.029
(0.036) (0.012) (0.040)Time FE X X X X X X X X X X X XFirm FE X X X X X X X X X X X XCounty-Time Controls X X X X X X X X X X X XY mean 1.52 1.52 1.52 1.52 0.59 0.59 0.59 0.59 2.30 2.30 2.30 2.30Reset p-valSR = LRObservations 6763 6763 6763 6763 6763 6763 6763 6763 6763 6763 6763 6763
Total: Stot Extensive Margin: Sext Intensive Margin: Sint
(1) (2) (3) (4) (5) (6) (7) (8) (9) (10) (11) (12)
C: Service Offshoringβ : Post (≤ 1 yr) -0.005 -0.003 -0.038
(0.044) (0.013) (0.050)β : Post (≤ 2 yr) 0.059∗ 0.009 0.043
(0.035) (0.013) (0.052)β : Post (≤ 3 yr) 0.103∗∗∗ 0.024∗∗ 0.032
(0.038) (0.011) (0.072)β : Post (≤ 4 yr) 0.068∗ 0.019 -0.018
(0.040) (0.012) (0.062)Time FE X X X X X X X X X X X XFirm FE X X X X X X X X X X X XCounty-Time Controls X X X X X X X X X X X XY mean 1.37 1.37 1.37 1.37 0.54 0.54 0.54 0.54 2.27 2.27 2.27 2.27Reset p-valSR = LRObservations 6734 6734 6734 6734 6734 6734 6734 6734 6734 6734 6734 6734
Notes: Petitions and vacancies are measured at the firm level. Standard errors are clustered at the firm level are reported inparenthesis.* p<0.10, ** p<0.05, *** p<0.01
36
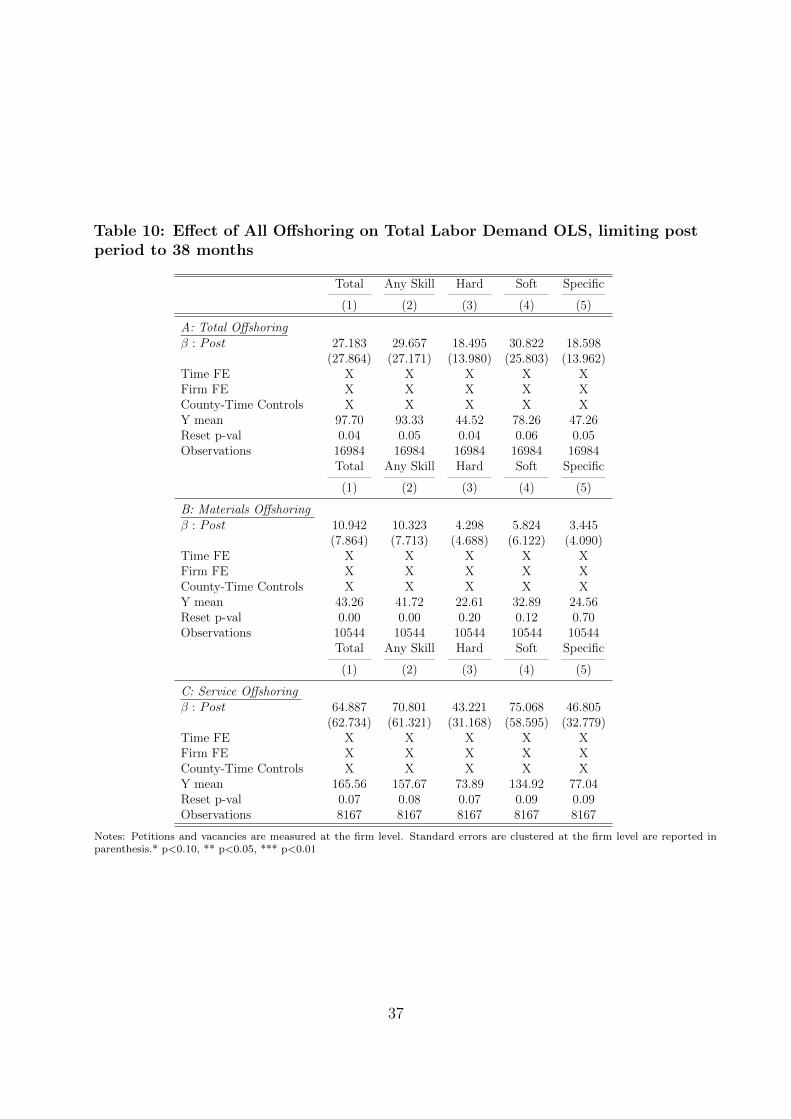
Table 10: Effect of All Offshoring on Total Labor Demand OLS, limiting postperiod to 38 months
Total Any Skill Hard Soft Specific
(1) (2) (3) (4) (5)
A: Total Offshoringβ : Post 27.183 29.657 18.495 30.822 18.598
(27.864) (27.171) (13.980) (25.803) (13.962)Time FE X X X X XFirm FE X X X X XCounty-Time Controls X X X X XY mean 97.70 93.33 44.52 78.26 47.26Reset p-val 0.04 0.05 0.04 0.06 0.05Observations 16984 16984 16984 16984 16984
Total Any Skill Hard Soft Specific
(1) (2) (3) (4) (5)
B: Materials Offshoringβ : Post 10.942 10.323 4.298 5.824 3.445
(7.864) (7.713) (4.688) (6.122) (4.090)Time FE X X X X XFirm FE X X X X XCounty-Time Controls X X X X XY mean 43.26 41.72 22.61 32.89 24.56Reset p-val 0.00 0.00 0.20 0.12 0.70Observations 10544 10544 10544 10544 10544
Total Any Skill Hard Soft Specific
(1) (2) (3) (4) (5)
C: Service Offshoringβ : Post 64.887 70.801 43.221 75.068 46.805
(62.734) (61.321) (31.168) (58.595) (32.779)Time FE X X X X XFirm FE X X X X XCounty-Time Controls X X X X XY mean 165.56 157.67 73.89 134.92 77.04Reset p-val 0.07 0.08 0.07 0.09 0.09Observations 8167 8167 8167 8167 8167
Notes: Petitions and vacancies are measured at the firm level. Standard errors are clustered at the firm level are reported inparenthesis.* p<0.10, ** p<0.05, *** p<0.01
37

Table 11: Effect of All Offshoring on Hard Skills Demand OLS, limiting postperiod to 38 months
Stot Sext Sint
(1) (2) (3)
A: Total Offshoringβ : Post 0.111∗ 0.047∗∗ 0.049
(0.058) (0.022) (0.038)Time FE X X XFirm FE X X XCounty-Time Controls X X XY mean 0.72 0.47 1.31Reset p-val 0.08 0.33 0.21Observations 6345 6345 6345
Stot Sext Sint
(1) (2) (3)
B: Materials Offshoringβ : Post 0.003 0.006 -0.010
(0.020) (0.012) (0.019)Time FE X X XFirm FE X X XCounty-Time Controls X X XY mean 0.68 0.46 1.22Reset p-val 0.65 0.88 0.18Observations 3514 3514 3514
Stot Sext Sint
(1) (2) (3)
C: Service Offshoringβ : Post 0.144∗∗ 0.060∗∗ 0.067
(0.070) (0.027) (0.044)Time FE X X XFirm FE X X XCounty-Time Controls X X XY mean 0.75 0.48 1.40Reset p-val 0.01 0.25 0.08Observations 2875 2875 2875
Notes: Petitions and vacancies are measured at the firm level. Standard errors are clustered at the firm level are reported inparenthesis.* p<0.10, ** p<0.05, *** p<0.01
38

Table 12: Effect of All Offshoring on Soft Skills Demand OLS, limiting postperiod to 38 months
Stot Sext Sint
(1) (2) (3)
A: Total Offshoringβ : Post 0.271∗ 0.063∗∗ 0.078
(0.149) (0.027) (0.098)Time FE X X XFirm FE X X XCounty-Time Controls X X XY mean 2.26 0.73 2.80Reset p-val 0.25 0.65 0.01Observations 6345 6345 6345
Stot Sext Sint
(1) (2) (3)
B: Materials Offshoringβ : Post 0.017 0.000 -0.024
(0.069) (0.016) (0.066)Time FE X X XFirm FE X X XCounty-Time Controls X X XY mean 1.95 0.69 2.53Reset p-val 0.90 0.91 0.65Observations 3514 3514 3514
Stot Sext Sint
(1) (2) (3)
C: Service Offshoringβ : Post 0.352∗ 0.083∗∗ 0.109
(0.179) (0.032) (0.117)Time FE X X XFirm FE X X XCounty-Time Controls X X XY mean 2.55 0.77 3.07Reset p-val 0.00 0.38 0.00Observations 2875 2875 2875
Notes: Petitions and vacancies are measured at the firm level. Standard errors are clustered at the firm level are reported inparenthesis.* p<0.10, ** p<0.05, *** p<0.01
39

Table 13: Effect of All Offshoring on Specific Demand OLS, limiting postperiod to 38 months
Stot Sext Sint
(1) (2) (3)
A: Total Offshoringβ : Post 0.041 -0.006 0.048
(0.071) (0.022) (0.049)Time FE X X XFirm FE X X XCounty-Time Controls X X XY mean 1.50 0.57 2.33Reset p-val 0.02 0.00 0.45Observations 6345 6345 6345
Stot Sext Sint
(1) (2) (3)
B: Materials Offshoringβ : Post -0.097 -0.042 0.008
(0.064) (0.029) (0.043)Time FE X X XFirm FE X X XCounty-Time Controls X X XY mean 1.52 0.59 2.27Reset p-val 0.31 0.06 0.31Observations 3514 3514 3514
Stot Sext Sint
(1) (2) (3)
C: Service Offshoringβ : Post 0.084 0.002 0.080
(0.080) (0.026) (0.063)Time FE X X XFirm FE X X XCounty-Time Controls X X XY mean 1.41 0.54 2.35Reset p-val 0.02 0.00 0.53Observations 2875 2875 2875
Notes: Petitions and vacancies are measured at the firm level. Standard errors are clustered at the firm level are reported inparenthesis.* p<0.10, ** p<0.05, *** p<0.01
40

Appendix
The following reports empirical results for alternative specifications as well as the underlyingskill categories which compose our hard, soft and specific skill groups.
A Figurues
41

Figure A1: Effect of Offshoring on Skills Demand at Firm Level
Materials ServiceHard Skills Demand
Soft Skills Demand
Specific Skills Demand
Notes: The above figure plots marginal effects for an event study regression where an offshoring petition is filed attime zero.
42

Figure A2: Effect of Service Offshoring on Workforce Management Skill In-tensity at Firm Level
Notes: The above figure plots marginal effects for an event study regression where an offshoring petition is filed attime zero.
Figure A3: Effect of Service Offshoring on Social Skill Intensity at Firm Level
Notes: The above figure plots marginal effects for an event study regression where an offshoring petition is filed attime zero.
43

Figure A4: Effect of Service Offshoring on Character Skills Intensity at FirmLevel
Notes: The above figure plots marginal effects for an event study regression where an offshoring petition is filed attime zero.
Figure A5: Effect of Service Offshoring on Critical Thinking Skills Intensityat Firm Level
Notes: The above figure plots marginal effects for an event study regression where an offshoring petition is filed attime zero.
44

Figure A6: Effect of Service Offshoring on Cognitive Skills Intensity at FirmLevel
Notes: The above figure plots marginal effects for an event study regression where an offshoring petition is filed attime zero.
B Tables
45

Table A1: Effect of Offshoring on Skills Demand Poisson
Total Any Skill Hard Soft Specific
(1) (2) (3) (4) (5)
A: Total Offshoringβ : Post 0.373 0.435 0.419 0.479 0.458
(0.282) (0.301) (0.336) (0.334) (0.290)Time FE X X X X XFirm FE X X X X XCounty-Time Controls X X X X XY mean 111.69 104.25 50.42 87.25 52.39Reset p-val 0.50 0.53 0.45 0.43 0.22Observations 19512 19512 19152 19368 19296
Total Any Skill Hard Soft Specific
(1) (2) (3) (4) (5)
B: Materials Offshoringβ : Post 0.223 0.170 0.042 -0.301 0.061
(1.128) (1.177) (1.336) (2.292) (1.140)Time FE X X X X XFirm FE X X X X XCounty-Time Controls X X X X XY mean 61.74 59.90 33.87 49.14 34.66Reset p-val 0.42 0.33 0.75 0.31 0.25Observations 12024 12024 11736 11952 11808
Total Any Skill Hard Soft Specific
(1) (2) (3) (4) (5)
B: Service Offshoringβ : Post 1.088 1.135 1.302 1.383 1.358
(0.975) (1.019) (0.969) (0.996) (0.956)Time FE X X X X XFirm FE X X X X XCounty-Time Controls X X X X XY mean 186.36 172.41 81.88 147.31 83.43Reset p-val 0.75 0.50 0.73 0.56 0.70Observations 9432 9432 9360 9360 9432
Notes: Petitions and vacancies are measured at the firm level. Standard errors are clustered at the firm level are reported inparenthesis.* p<0.10, ** p<0.05, *** p<0.01
46

Table A2: Effect of Offshoring on Workforce Management Demand with vari-ous Measures of Treatment within the Affected Firm
Materials Service
(1) (2) (3) (4) (5) (6) (7) (8) (9) (10)β : Post × Workers -0.008∗ -0.008 0.013∗∗ 0.012∗∗
(0.005) (0.005) (0.005) (0.005)
β : Post -0.031 -0.030 0.058∗∗ 0.057∗∗
(0.027) (0.028) (0.024) (0.024)
β : Post × Count -0.012 0.000(0.012) (0.005)
Reset p-val 0.782 0.748 0.995 0.941 0.989 0.595 0.543 0.653 0.593 0.979One Petition Firms X X X XTime FE X X X X X X X X X XFirm FE X X X X X X X X X XCounty-Time Controls X X X X X X X X X XObservations 26396 26036 28286 27926 28286 26396 26036 28286 27926 28286
Notes: The dependent variable is the share of vacancies that specify a requirement for the above skill. The measure of tradeexposure in columns 1, 2 and 6 and 7 is 1 in the month of a petition being filed within a firm scaled by the number of displacedworkers in columns 3, 4, 8 and 9 the treatment is a simple post indicator equal to 1 after the firm files a petition. In column5 and 10 the treatment is a continuous measure of the number of petitions filed within a firm. Petitions and vacancies aremeasured at the establishment level. Standard errors are clustered by state and standard errors are reported in parenthesis. *p<0.10, ** p<0.05, *** p<0.01
Table A3: Effect of Offshoring on Soft Skills Demand with various Measuresof Treatment within the Affected Firm
Materials Service
(1) (2) (3) (4) (5) (6) (7) (8) (9) (10)β : Post × Workers -0.006 -0.006 0.011∗∗∗ 0.011∗∗∗
(0.004) (0.004) (0.004) (0.004)
β : Post -0.021 -0.019 0.051∗∗∗ 0.051∗∗∗
(0.022) (0.022) (0.017) (0.017)
β : Post × Count -0.007 0.001(0.009) (0.003)
Reset p-val 0.576 0.595 0.339 0.360 0.276 0.761 0.788 0.552 0.578 0.300One Petition Firms X X X XTime FE X X X X X X X X X XFirm FE X X X X X X X X X XCounty-Time Controls X X X X X X X X X XObservations 26438 26078 28328 27968 28328 26438 26078 28328 27968 28328
Notes: The dependent variable is the share of vacancies that specify a requirement for the above skill. The measure of tradeexposure in columns 1, 2 and 6 and 7 is 1 in the month of a petition being filed within a firm scaled by the number of displacedworkers in columns 3, 4, 8 and 9 the treatment is a simple post indicator equal to 1 after the firm files a petition. In column5 and 10 the treatment is a continuous measure of the number of petitions filed within a firm. Petitions and vacancies aremeasured at the establishment level. Standard errors are clustered by state and standard errors are reported in parenthesis. *p<0.10, ** p<0.05, *** p<0.01
47