observations and ppedictions of frost heave around … · observations and predictions of frost...
TRANSCRIPT
Th~!! undersigned recommend to the F.'aculty of Graduate
Studies and Research a,_,_eptance of the thesis
"OBSERVATIONS AND PP...EDICTIONS OF FROST HEAVE AROUND A CHILLED PIPELINE"
submitted by SCOTT RAYMOND DALLIMORE
B.Sc •• Queen•s University
in partial fulfilment of the requirements for
the degree nr Master of A~ets.
THESIS SUPERVISOR
CHAIP.~M~fill, DEPARTMENT OF GEOGRAPHY
Carleton University
May 31, 1985
OBSERVATIONS AND PREDICTIONS
OF FROST HEAVE AROUND A CHILLED PIPELINE
by
SCOTT RAYMOND DALLIMORE, B.Sc.{Enq.)
A thesis submitted to
the Faculty of Graduate Studies and Research
in pa~tiaL fulfilment of
the requirements for the degree of
Master of Arts
Department of Geography
Carleton University
Ottawa, Ontario
May 1 3, 1 9 8 5 ·
I I I I I· I I I I I I I I I I I I I I
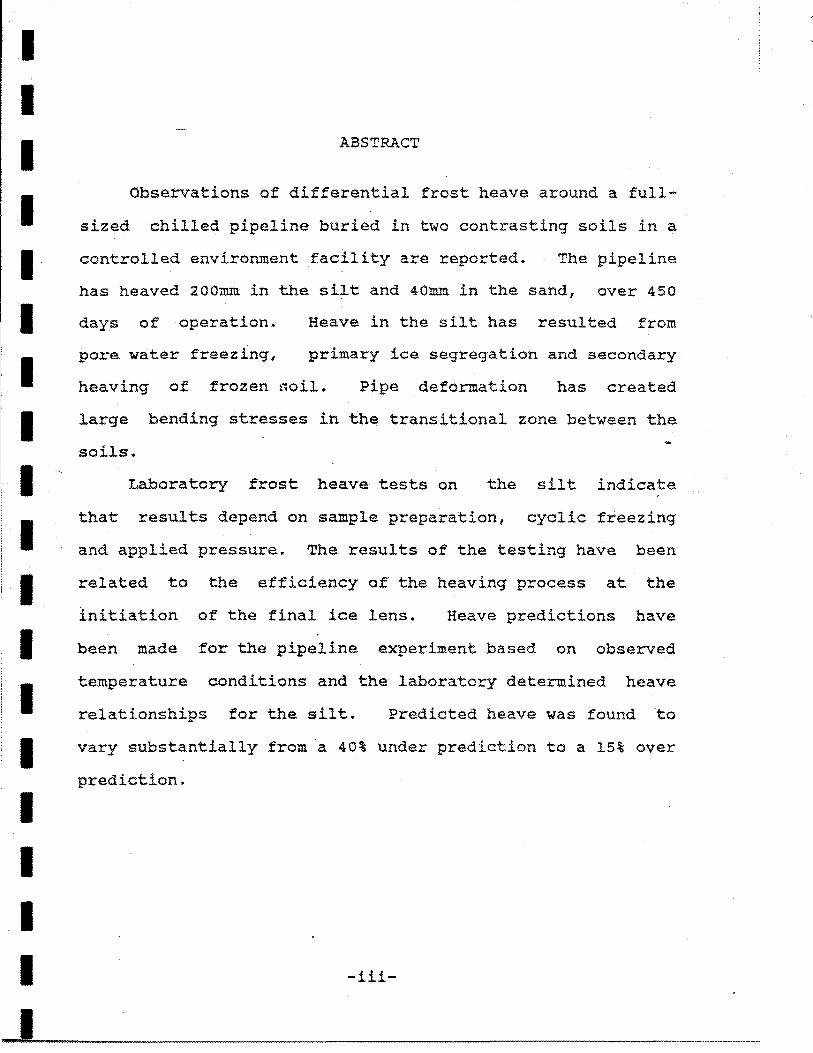
ABSTRACT
Observations of differential frost heave around a full
sized chilled pipeline buried in two contrasting soils in a
controlled environment facility are reported. The pipeline
has heaved 200mm in the silt and 40mm in the sand, over 450
days of operation. Heave in the silt has resulted from
pore water freezing, primary ice segregation and secondary
heaving of frozen neil. Pipe deformation has created
large bending stresses in the transitional zone between the
soils.
Laboratory frost heave tests on the silt indicate
that results depend on sample preparation, cyclic freezing
and applied pressure. The results of the testing have been
related to the efficiency of the heaving process at the
initiation of the final ice lens. Heave predictions have
been made for the pipeline experiment based on observed
temperature conditions and the laboratory determined heave
relationships for the silt. Predicted heave was found to
vary substantially from ·a 40% under prediction to a 15% over
prediction.
-iii-
ACKNOWLEDGEMENTS
During my two year stay at Carleton I have been fortunate to be involved with an active, friendly group of individuals who have been generous with their time in educating a newcomer in the ins and outs of permafrost studies. In particular I wish to acknowledge my thesis advisor . Dr.. Peter Williams for his guidance in formulating this thesis and for the many hours of informative discussion. Dr. Michael Smith helped tremendously in sorting out many of the technical aspects of the research and provided cheerful encouragement throughout. Dr. Roger Kettle helped in interpreting the results of the frost heave testing and analysis of the pipe-soil interactions at caen.
Laboratc~.y work occupied much of my time at carleton and a great ~3al of assistance was provided over the months by Messrs._ Danny Patterson, Larry Boyle and Alan Pendlington. Dr. Branko Ladanyi generously lent the frost heave cell which gave me so many sleepless nights or enjoyment. Mr. John Wood and Dr. Elene McCabe provided unpublished experimental data which has been included in the thesis ..
The help of the six field project managers at caen is acknowledged as is the hospitality and assistance of the staff of tl ~ Centre de Geomorphologie. My visits to Caen were especially enjoyable with the companionship of Miss Margo Burgess, Gilles Lemaire, A. Dupas and J.P. Lautridou.
Last but not least.r would like to thank my wife Audrey whose scientific and literary skills helped me to see my way through to the completion of this thesis and whose good nature: and affection have made :my life so enjoyable over the past years.
-iv-
I I I I I :
i:
I I I I I I I I I I I I I
TABLE OF CONTENTS
Page
ACCEPTANCE SHEET 0 •• W «- 0 ~·. & • 0 0. 0 ••• 0 0 ~. •. 0 0 0 M. 0 0 0 0 0 0 e ii
ABSTRACT ......... ,. ••••• ,. ••••••••• "' .................... "'... iii
ACKNOWLEDGEMENTS •· ••••• - • • • •• 3 ••••••••• •· ••••••••••••••
TABLE OF CONTENTS • • • • • • • • • • • • • • • • • • • • • • • • • • • & • • • • • • • •
LIST OF ILLUSTRATIONS . . . . . . . . . . . . . . . . . . . . . . . . . . . . . . . . LIST OF TABLES ............ •· ...... ·- ...................... . CHAPTER
INTRODUCTION 1.1 General .......................................... . 1.2 Background: Pipelines and Permafrost ••••• 1.3 Objectives ·~••••••••••••••••••••••••••••
2 FROST HEAVE OF A CHILLED PIPELINE - BASIC· CONSIDERATIONS
3
4
2.1 Ground Freezing •••••••••••••.•••••••••••• 2.2 Frost Heave •••••••••••••••••••••••••••••• 2.3 Frost Susceptibility of Soils •••••••••••• 2.4 Heaving Pressures and Resistance to
Frost Heave ..................................... . 2.5 Differential Frost Heave ••••••••••••••••• 2.6 Frost Heave Engineering Program
CANADA-FRANCE PIPELINE EXPERIMENT 3 ..... 1 General ....................................... . 3.2 Test Facility and Experimental Model ••••• 3.3 Schedule and Operating Conditions .••••.•• 3-4 Instrumentation •. •••••••••••••••••••••••• 3.5 Physical Characteristics of Caen Silt 3.6 Physical Characteristics of SNEC Sand
OBSERVATIONS OF SOIL FREEZING AND FROST HEAVE AROUND THE CAEN PIPELINE 4. 1 In troduc:tion ................................ . 4. 2 Pattern of Soi 1 Freezing ••••• , •••••••••• 4.3 Unfrozen Water Content ••••••••••••••••••• 4.4 Frost Heave ·~~·••••••••••••••••••••o•••••• 4.5 Deformation o£ the Pipeline ••••••·•••a•••
-v-
iv
v
vii
X
1 2 4
6 9
1 2
1 3 1 5 1 7
20 21 25 25 31 36
39 40 44 46 53
··-····1-·--··--,--··----------·--··--- --·---·--·····-···············-···- ·--
I
.
I
,.,.
:~ :·
I .
I .
4.6 Pipe-Soil Interactions ••••••••••••••••••• 4.7 Failure of Soil Around the Pipeline •.•••• 4.8 Internal Frost Heave Pressure ••••.•••••.•
5- FROST HEAVE TESTING 5.1 General ..................................... . 5.2 Test Program and Apparatus ••••••••••••••• 5.3 Behavior of Caen Soils During One
Dimensional Freezing ••••••••••••••••••••• 5.4 Influence of Repetitive Freeze-Thaw
Cyalinq ••••••••••••••• ~ •••••••••••••••••• S.S Influence of Sample Preparation •••••••••• 5.6 Influence of Surcharge Load ••••••••••••••• 5.7 Influence of Temperature Conditions •••••• 5.8 Summary ••••••••••••••••••••••••••••••••••
6 FROST HEAVE PREDICTION 6.1 General .................................... . 6. 2 Prediction Method •••••••••••••••••••••••• 6.3 Segregation Potential of the Caen Silt ••• 6.4 Frost Heave Prediction ••••••••••••••••••• 6.5 Comparison between Predicted and
Observed •••••••••••••••••••••••••••••••••
7 SUMMARY AND CONCLUSIONS 7.1 General.; •••••••••••••••••••••••••••••••• 7.2 Results ..................... : .•••••...••.. 7.3 Conclusions •••••••••••••••••••••••••••••• 7.4 Final Remarks .......•........ •· .......... .
BIBLIOGRAPHY •••••••••••••••••••••••••••••••••••••••••
-vi-
53 I 57
I 58
63 I 64
70
I 75 79
I 81 83 86
I 89 89
I 92 93
95 I 100 I 100 102 , 04
I 105
I I I I I I I I I
I I I I I I I I
I I I I I I I I I I
LIST OF ILLUSTRATIONS
Figure 2.1 Sections showing frost heave around a
chi~led pipeline • • • • • • • • * • • • • • • * • • • • • • 4
Figure 2.2 Differential frost heave occurring around
a chilled pipeline . . . . . . . . . . ~ . . . . . . . . . . Figure 2.3 Frost heave design program for a chilled
pipe l.i n e ••••••• a. ••• "' ...................... .
Figure· 3. 1 Longitudinal section of Caen experiment •
Figure 3.2 Transverse section of Caen experiment •••
Figure 3.3 Plan view of Caen experiment ••••••••••••
Figure 3.4 Sketch of magnetic heave device . . . . . . .. . Figure 3.5 Location of earth pressure (Glotzl} cells
Figure 3.6 Grain si~e analysis of Caen silt and SNEC
sand • • • • • • • • • • • • • • • • • • • • ~ • • • • * • • 0 • • • • • •
Figure 3.7 Unfrozen water content vs temperature for
Caen silt and SNEC sand • • • • • • • • • • • 6 • • • •
Figure 3.8 Frozen permeability of Caen silt •• 4 ••••
Figure 4.1
Figure _4.2
Figure 4.3
Figure 4.4
Sections showing evolution of frost bulb
around pipeline Ln sand and silt
Temperature profiles beneath pe in silt
Temperature profiles beneath pipe in sand
Unfrozen water content profiles and 0
progression of 0 C isotherm
Figure 4.5 Change in surface elevations after i17 days
of freezing c • • • • • • • • • • • • • • • • • • • e • • • • • * • • •
-vii-
1 0
1 6
1 8
22
23
27
29
32
34
37
4:1
42
43
45
47
-------------------------------------------J
·-------·················
Figure 4.6 Frost heave and frost penetration beneath
the Caen pipeline M • • • c • a • • • • 4 • • 6 w • • • • • 6 • 49
Figure 4.7 Differential heave with depth as deter.mined
with telescopic tubes..................... 50
Figure 4.8 Displacement of Caen pipeline during second
freeze period • • • • • • » ~ • • • • • • • • • • • • • • • • • • • •
Figure 4.9 Evolution of pipe stress and strain
54
55
Figure 4.t0 Estimate of soil pressure beneath pipe ••••• 59
Figure 4.11 Total stress measured in soil beneath centre
line of pipe in sand . . . . . . . . . . ~ . . . . . . •· . . . . Figure 4.12 Total stress measured in soil beneath centre
line of pipe in silt • * ••••••••• ·- .......... ·-
Figure 5.1 Frost heave celL used at Carleton University
Figure 5.2 Frost heave cells used during testing 6f
silt . . . . . . . . . . . . . . . . . . . ~ . . . . . . . . . . . . . . . . . . Figure 5.3 Cell used by J. Wood to measure frost heave
pressures . . . . . . . . . . . . . . . . . . . . . . . . . . . . . . . . . Figure 5.4 Typical results from frost heave test on
Caen sil.t • • • • * ·- • • • • • • • • • • • • • • • • • • • • • • • • • ~ •
Figure 5.5 Results of frost heave pressure test on
Figure 5.6
Figure 5.7
Caen silt • • • • • • • • • • • ~ • • • • * • • • • • • • • • • • • • • • •
Influence of repetitive freeze-thaw cycles
Influence of repetitive freeze-thaw cycles
under different temperature conditions
Figure 5.8 Effect of sample preparation on heave
. .. . . II • • • +
Figure 5.9 Heave of Caen silt vs frost index . . . . . . . . . -viii-
60
62
66
68
7 1
73
76
78
80
82
85

I I I I I I I I I I I I I I I I I I
Figure 5.10 Plot of velocity of water flowing towards final
Figure 6. 1
ice lens vs temperature gradient ••••••••••
Predicted and observed heave for Caen
experiment ••••••••• ·- •••••••••••••••••••• « •
-ix-
.I ...__::.__ __________________________________________________________ ..... ., ....
87
97
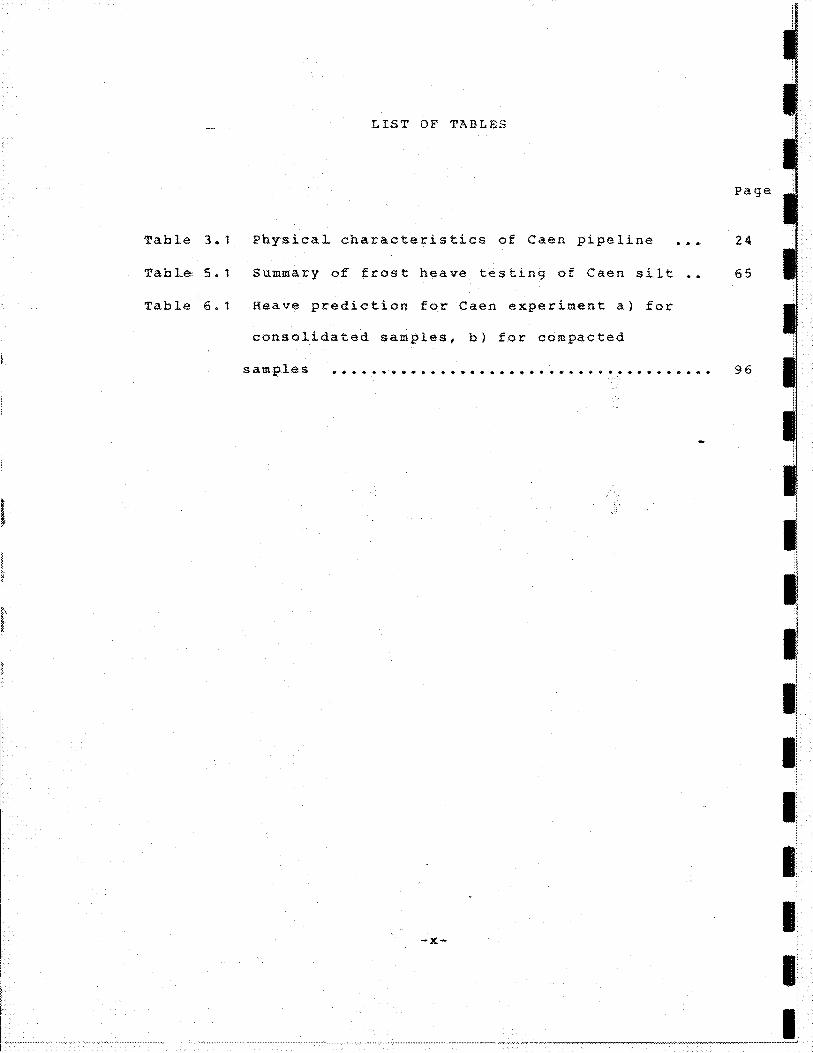
LIST OF TABLES
Page
Table 3 .. 1 Physical characteristics of Caen pipeline 24
Table 5. 1 Summary of frost heave testing of Caen silt 65
Table 6. 1 Heave prediction for Caen experiment a) for
consolidated samples, b) for compacted
samples . . . . . . . . . . . . . . . . . . . . . . . . . . . . . . . . . . . . . . . 96
l . '
• !
If I I
l
~ II I~
I I
-x-
I! I~ ····•··•·•••••••••·•••••••••••••••••••••••••••••·--··--·•-~•~wu.-~~~~--~~~~~~~~~~-____;

I I I I I I I I I I I I I. I I I I I
1.1) General
Recent
arctic have
CF...APTER I INTRODUCTION
discoveries of large energy reserves in the '.
created unprecedented impetus for 1' northern
development.. A number of unique challenges face scientists
and engineers alike in these areas, because of the harsh
climatic conditions and the widespread occurrence 01
permafrost terrain.
Frost heave, which can occur naturally in the nea~
surface soils, and is induced artificially around chilled
structures, is a particularly important problem in cold
regions. The geotechnical frost heave design of large
diameter chilled pipelines presents numerous
difficulties.
This thesis deals with the study of frost heave
around a chilled pipeline operated under controlled
experimental conditions, which is buried in a research
facility at Caen, France. The results of laboratory frost
heave testing on the Caen soils are also reported along
with attempts at frost heave prediction for the main Caen
experiment.
The Caen experiment is a multi-disciplinary study of
freezing
buried
other a
and thawing around a full sized chilled pipeline
in two soils, one a frost susceptible sflt and the
non-frost susceptible sand. The experiment is
--···1-·-······-··-··-···--····~······ ······················
1
I
I I I I I I I . ,: .. -~)~· ......
I l_z ::
~. .
2
being congucted jointly by Canadian-and French scientists
with funding by the governments of both countries. ~he
author has been involved with the.project since the fall of
1982 when the first freeze period of the experiment was
begun. The author•s association began as the first field
project manager, responsible for the operation of the
experiment and collection of data in France on a day to day
basis from August to December, 1982. subsequently, the
author continued as the canadian project ~cnager
coordinating the Canadian participation in the experiment
from Ottawa •
In total more than twenty Canadian and French
scientists and engineers have been involved in various
aspects of the project. Much of the raw data has been
presented in a number of progress reports prepared by the
author and other participants, for the Canadian funding
agency, the Earth Physics Branch of Energy, Mines and
Resources, Canada.
1.2) Background: Pipelines and Permafrost
The study of the effects of pipeline transportation
through arctic terrain has gained importance with the
discovery of large reserves of natural gas and petroleum in
several northern sedimentary basins. A number of proposed
production and transportation schemes, such as the Alaska
Natural Gas Transportation System (Federal Environmental
Assessment ~eview Office, 1979) and Polar Gas (see Polar
Gas, 1984) proposals call for transportation to southern
I I I I I I I I I I I I I I I I I I I
I I I I I I I I I I I I I I I I I I I
3
markets by~overland pipelines. The proposed pipeline routes
are several thousand kilometres in length,
wide variety of terrain in the continuous and
trcwersing a
discontinuous
permafrost regions~
since virtually no pipelining data for permafrost
terrain were available prior to the nineteen-seventies, a
new field of pipeline technology has evolved. Two modes of
pipeline transportation are generally considered for
permafrost terrain:
1) a buried mode 1 where the pipeline is placed in a
backfilled trench, and
2) an above ground mode where the pipeline is placed at
the ground surface or suspended above it on piles or
cribbing.
Except in unusual circumstances 1 the
preferred for reasons of cost, safety,
concerns.
bUl:ied mode is
and environmental
A critical factor regarding the geotechnical design of
pipelines in permafrost regions is the proposed operating
temperature. This is usually determined by the
characteristics of ~~e transmission fluid, the temperature
of the fluid when it exits compressor or pump stations
along the route 1 and the heat exchanges with the
environment. 0
!f a· buried pipeline is warm (>O C) 1 geotechnical
problems may be encountered if ice-rich 'thaw sensitive'
permafrost is present near the pipeline. If a pipeline is

• : .• '.; ..• ·. ~~::·
• • • • : •. -:. ~~~ '
II
• '.1·'' ~
• •
4
0
chilled (~0 C) geotechnical problems may be encountered if
unfrozen 'frost susceptible' materials are ""-:'esent near the
pipeline.
Natural gas transmission pipelines 0
operation below 0 c, since
are particularly
operation costs suited to
generally decrease with lower gas temperatures. Operation 0
of pipelines below 0 c is also desirable when large portions
of the pipeline route are underlain by continuously frozen
soils and only short sections are unfroZt;/J1. These thermal
conditions are very common in the continuous permafrost zone
and near the border between the continuous and the
discontinuous zones ..
To date, little published information is available on
the construction or operation of chilled gas pipelines,
although a relatively short gas pipeline is being operated
in Alaska (Jahns and Heuer, 1983) and several gas pipelines
have been constructed in Siberia (Spiridonov, 1983}.
Recently, construction has been completed on a small
diameter (323mm) oil pipeline from Norman Wells, N.W.T. to
Zama Lake, Alberta. The unusually lo~ viscosity of the oil
allows chilling over part of the pipeline route (Nixon et
al, 1984) .
1.3) Objectives
The objectives of the thesis are:
1) To investsigate the nature of frost heave
occurring around the Caen pipeline.
2) To document the interactions between the Caen
I I I I I I I I I I I I I I I I I I I
I I I I I I I I I I I I I I I I I I I·
5
pipeline and the soils and to decribe the
distribution of intern-: pressure in the soils.
3) To report the results of detailed laboratory
frost heave testing carried out on the caen
soils. ·
4) To undertake frost heave predictions for the
Caen experiment using observed thermal
conditions and the results from the
laboratory frost he.·{'l.Ve testing.
Chapter 2 of the thesis provides a review of the basi~
considerations when dealing with frost heave around a
chilled pipeline. Chapters 3" and 4 consist of a detailed
discussion of the Caen experiment including the nature of
frost heave observed around the pipeline. The results of
frost heave testing on the Caen soils and attempts at frost
heave prediction for the second freeze period of the Caen
experiment are discussed in chapters 5 and 6. Chapter 7 of
the thesis contains a summary and discussion.
I I I I 'I ~~ ; ..
I ,., •• , ::: :: ..
I I .. ,.· . . J
' ' I
::: I.·.
CHAP.,.,~R II
Frost Heave of a Chilled Pipeline : Basic Considerations
2.1 Ground Freezing
2 .. 1..1 General
6
A chilled pipeline which traverses regions of unfrozen
terrain
soil.
creates negative temperatures in the surrounding
For nearly all naturally occurring soils, only part 0
of the soil water freezes at ~.1 c. The unfrozen water which
is present in the frozen soil. is stable in a thermodynamic
sense (Williams 1 1982) with the free energies of the ice ana
the water being equal • In most soils the ice is thought to
occupy
being
the center of the. soil pores with the unfrozen water
confined to thin films adjacent to the soil mineral
surfaces (Anderson and Hoekstra, 1965) 1 where surface forces
are stronger.
The amount of the unfrozen water present in a
particular soil is dependent on the thermodynamic conditions
of the soil-ice-pore water system.. Factors affecting these
conditions include:
a} temperature,
b)pressure in the ice and water phase (Hoekstra and
Keune, 1967),
c)solute concentration in the pore water, and
d)specific sbil properties such as the physico-chemical
nature of the mineral surfaces (Dillon and Andersland 1
1966) and the specific surface area of the soil phase
~-· ~
I I I I I I I I I I I I I I I I I I I
I I I I I· I I I I I I I I I I I I I
7
(And~rson et al, 1973).
In general, the unfrozen r-.ra ter content of fine-grained soils
is much greater than that of coarse-grained soils, under
similar pressure and temperature conditions.
2.1.2 Ice segregation
Under optimum conditions of temperature, rate of heat
extraction 1 soil structure and access to unfrozen water
(Anderson and Morgenstern, 1973) 1 ice crystals may coalesce
or segregate into cont...Lnuous layers called ice lenses. The
ice. segregation process is driven by hydraulic gradients
(free energy gradients) which exist in soil water when ~
negative temperature gradient is applied.
In its simplest form, the process involves the
migration of pore water from unfrozen soil towards the zone
of ice formation 1 ~here it freezes. Due to the nature of
crystals growing from a melt, soil particles are rejected by
the ice resulting in segregation of the ice and soil
particles (Anderson, 1968). The ice crystals grow in the
direction of heat removal (Taber 1 1929), displacing the soil
in the direction of least resistance.
In cold climates, the ice segregation process is
commonly active in fine grained soils such as silts and
silty clays. The thickness of the resulting ice lenses can
vary from small seasonal lenses less than one millimetre
thick 1 to large multi-year lenses in excess of one metre in
thickness (Rampton and Mackay,l971).
There has been some discussion in the literature as to
----~---······························· ------------------~.~~---------------~·
I
I .[1
!I
8
whether th_e 'primary' ice segregation process described 0
above occurs at 0 "': or at some slightly colder temperature
(Miller 1.972 , Harlan 1973) • Based on thermodynamic
considerations and experimental observations, it now seems 0
·that ice.segregation at 0 Cis relatively rare and that for ! :
most soils,
isotherm.
0
segregation occurs some distance behind the 0 c
The temperature at which ice segregation takes
place has been called the 'segregation freezing temperature'
by Konrad and horgenstern (1980), and the zone between it 0
and the 0 c isotherm has been called the frozen fringe
(Miller, 1.972)o
2.~.3 Ice segregation within frozen ground
In addition to the processes of the ice segregation 0
which can occur at temperatures near 0 c, it has been
suggested by numerous authors (e.g., Miller 1972, Harlan
1974 and Williams 1977) that water migration and ice
accumulation may occur within already frozen ground. The
mobility of the unfrozen water (or permeability of frozen
soil) may allow this 'secondary' ice segregation.
A number of researchers have investigated the
permeability of frozen soils in the laboratory (Burt and
Williams, 1976, Loch and Kay, 1978 and Konrad and
Morgenstern, 1980). This work shows ~~at while the
permeability of soils in the frozen state is significantly -10 -1.2
reduced, values in the range of 10 to 10 mjs can still·
be achieved at temperatures several tenths of a degree below 0
0 c ..
~ ~ I I I I I I I I I I I I I I I I I.
I I I I I I I I I ,
I I I I I I I I I
9
In the field actual observations of the secondary heave
and water l'fl.:.gration in frozen soils are limited. Mackay
(l983} has summarized some observations from China and the
Soviet Union as well as his own work in northern Canada
{Mackay et al, 1979). More recently, Smith (1985) has
· idescribed field observations of secondary heave and water 0
migration occurring in soils at temperatures down to -2.4 c.
2.2 Frost Heave
2.2.1 Comp~nents of Heave
In terms of pipeline mechanics, frost heave is simply
any positive volumetric change caused by the soil freezing
process. This includes the nine percent volume expansion
from the in-situ freezingof pore water in saturated soils,
plus the volume expansion resulting from water migration and
ice segregation 1 less any reduction in volume which may
occur because of consolidation« For a circular heat sink
such as the cross section of a chilled pipeline, however,
the delineation of the frost heave problem is complex. An
idealized presentation of the geometry, showing the
components. of heave is presented in Figure 2.1.
Determination of the frost heave resulting from the in-
situ freezing of pore water is relatively straight forward.
If a soil is assumed to be saturated and th~ freezing
characteristics and geometry of the frost bulb are known,
the heave resulting from freezing of pore water i~ given by:
LL----e.-. ........ . L

Frost bulb
Heave
0 T ) 0 C
air
T,
Shear plane
UNFROZEN SOIL
. Components of frost heave
Hr"" Hi+ Hs- { V c)
Where; Hr=total heave, Htheave due to freezing of pore water , H5=heave due to ice segregation, and V c""any volume change due to consolidation
resistance to frost heave Or"" Ws + Wdl +Wp + Tr
Creep in frozen soil according to 2ndary creep law
Where; Or""resistance to heave, W5=weight of soil in frost bulb,
Wctf'''Weightof dead load applied. @surface, wp""welght of pipeline and
contained materials, and 1~ =shear resistance
Figure 2.1 Sections showing frost heave around a chilled pipeline under
a) summer conditions and b) winter conditions
------------------
I I I I I I I I I I I I I I I I I I
11
h = 0.09 X (1-W ) n i u
where; X = depth of frost penetration, and
W = (%) unfrozen water remaining in the u
frozen soil at the temperature under
consideration. ·
n = porosity
In the significant cases, however, this component of heave
is minor when compared to the heave which may result from
ice segregation.
A number of models have been developed by various
-researchers to attempt to characterize the processes of ice
seg.regation. At present, no single model has received
universal or general acceptance (National Research Council,
1984) by the scientific community.
2.2.2 Frost Heave Models
In order to predict heave in the field a suitable
model of the frost heave process must be adopted. Frost
heave models can be broadly divided into two groups, those
addressing the fundamental theoretical aspects of the ice
segregation process, and those (engineering} models which
attempt to provide a rational method of simplifying the
problem in order to predict frost heave. The objective of
an engineering model is to provide a suitable upper bound
estimate of frost heave.
Most attempts to model the frost heave process have
concentrated on the heave resulting from primary ice
segregation. Little emphasis has been placed on secondary
_____ I ~-··-···-.. ·······
~ •
,. :::
!!.
• ~
~
12
heaving, ~ince it has been assumed that it will occur very
slowly and make up only a minor part of the total heave •
2.3 Frost susceptibility of Soils
2.3 .. 1 General
In order to undertake predictions of frost heave along
a proposed pipeline route it is necessary to assess the
susceptibility of the various materials to frost heave. The
main physical soil properties which affect frost
susceptibility are mineralogy, soil texture and pore size.
To date no standard method of measuring frost
susceptibility exists, with many different methods
presently being used world wide (Chamberlain1 1981). Most
methods are based on laboratory tests, carried out on
representative field samples, which seek to establish frost
susceptibility criteria based on:
1) Particle size distribution 1
2) Pore size characteristics,
3) Soil/water interactions,
4) Frost heave tests
(after Chamberlain 1 1981).
2.3.2 Frost heave tests
Frost heave tests represent the most direct laboratory
method of assessing frost susceptibility because actual
samples can be frozen under conditions
found in the field. Frost heave tests
approaching those
usually involve
directional freezing of cylindrical soil samples which are
allowed to expand in response to heaving forces.
I I I I I I I I I I I I I I I I I I '
I
I I I I I I I I I I I I I I I I I I I
13
Sophisticated test cells include adaptations to reduce side
wall friction and lateral heat flow, free access of water at
the warm end, accurate control of end temperatures and
temperature measuring devices embedded in the cell walls.
The pressure dependence of heave can be observed in some
cells by applying a load at the free end of the sample.
The results of frost heave testing can provide valuable
information on an empirical basis as to the frost
susceptibility of various soils. Many countries undertake
standard frost heave tests under constant experimental
conditions in order to develop suitable frost susceptibility
criteria for construction purposes (see Gaskin, 1981). Most
countries use the results of the testing as a method of
comparing the qualitative response of various soils to frost
heave.
2.4 Heaving Pressures and Resistance to Frost Heave
It is well known that freezing soils can exert
significant pressure against obstructions and that applied
pressure or resistance to heave at the zone of ice formation
decreases heave. In fact, at one time it was thought that a
practical solution to the frost heave problem would be to
apply a so-called 'shut off' pressure in order to eliminate
heave. Recent work however, has shown that while a
theoretical shut off pressure may exist, it is very large
and frost heave will continue, albeit slowly, even at very
high pressures {Penner and Ueda, 1977).
For a pipeline undergoing uniform frost heave along its
I t
length, the_ resistance to heave is made up of a number of
components (see Figure 2.1). An important component is
determined by the surcharge load imposed on the soil mass in
the vicinity of the freezing plane. This is due to the
overburden pressure·from the soil above the freezing plane,
the weight of the pipeline and the contained materials
(usually ignored) and any dead load imposed at the soil
surface.
14
A second component of heave resistance results from the
lateral continuity of the soil adjacent to the frost bulb.
Since heave is preferentially concentrated along the axis of_
the pipeline, a shearing force is developed within the soil
mass. If heave is taking place in the summer when part of
the soil above the pipeline and adjacent to it may be
thawed, the shearing resistance will be determined by the
shear strength of the unfrozen soil (Figure 2.1).
Alternatively if heave is taking place in the winter or in
permanently frozen ground, the strength characteristics of
the frozen soil will define the shearing resistance.
The strength characteristics of unfrozen soils are
relatively easy to determine; however 1 the mechanical
characteristics and phenomena which control the 3trength of
frozen soils are very complex. In particular, under
constant loading frozen soils are subject to creep and
relaxation effects. This is due to the creep behavior of
the ice in the soil pores and the presence of unfrozen water
as films around the soil particles. The main external
I I I I I I I I I I I I I I I I I
.I I
I I I I I I I I I I I I I I I I I I
15
features ~hat influence the creep response of frozen soils
are stress and temperature (Zhu and carbee, 1983).
2.5 Differential Frost Heave
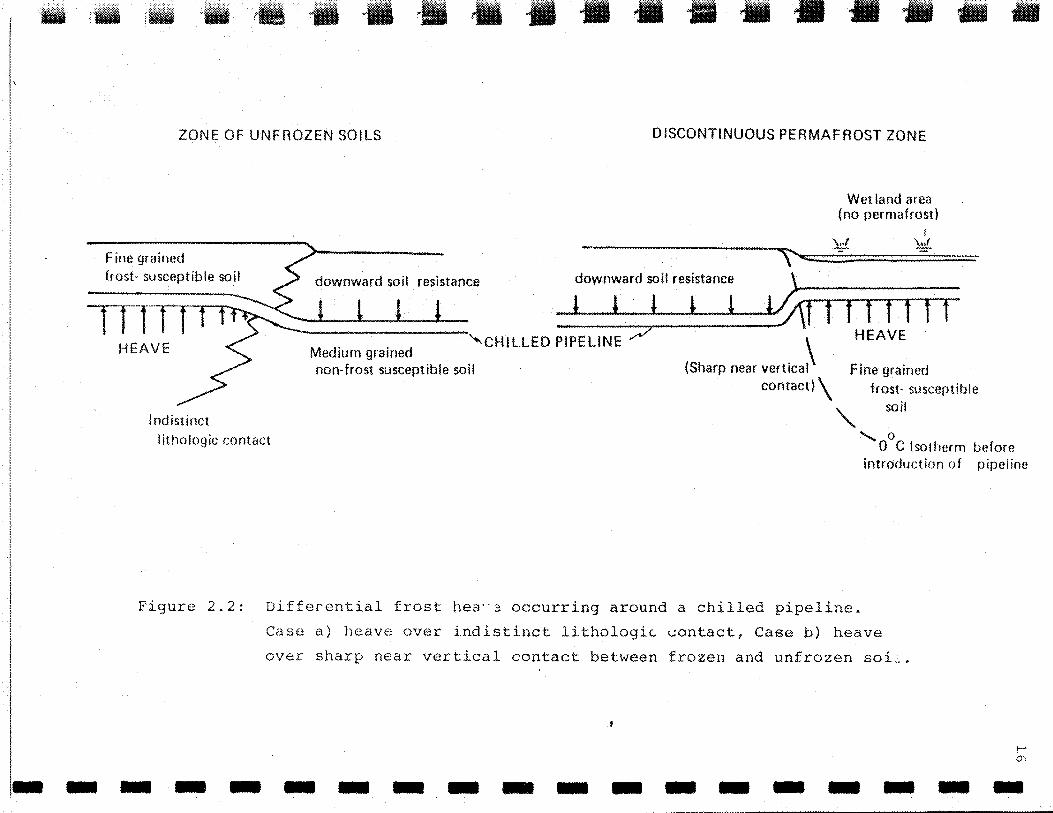
The most difficult engineering design conditions for
frost heave of a chilled pipeline occur where the route
passes through major lithologic or thermal boundaries. If
the frost heave of the pipeline is greater on one side of
the boundary than on the other, deformation of the pipeline
may occur. This type of differential heave might be
expected in the discontinuous permafrost region 1 where
numerous transitions between perennially frozen soil and
unfrozen frost susceptible soil may occur (Figure 2.2).
similarly, where a chilled pipeline passes through two soil
types of contrasting frost susceptibility, differential
heave may occur.
The mechanics of differential frost heave are complex.
A knowledge of the characteristics of the boundary is
critically important 1 including the geometry of the
interface, the abruptness of the contact and
the interconnection between the soil elements across the
boundary. If the differential components of heave are
gradational 1 as might be expected across an indistinct
lithologic boundary, the effect on the pipe will be less
severe. Conversely,
encountered, such as
permafrost area and
significant stresses
if a sharp, near-vertical contact is
one might expect between a cold
a shallow unfrozen wetland area 1
may be generated in the pipeline
-~-~~~~--··--~---·········-·········--·-·.~·-~~---···· .. ·--
, .• ~• ~-· •• ~· • • II - II II • • • • ZONE OF UNFROZEN SOILS DISCONTINUOUS PERMAFROST ZONE
Fine grained frost· susceptible soil
HEAVE
~ downward soil resistance downward soil resistance )..
Wet land area (no permafrost)
);_;{
--.ll~---! -· ......._I -....L-• __,lt...--.:1..<0\f i 1 n t =r ;= ---------"CHILLED PIPELINE ;; \ HEAVE
Medium grained non-frost susceptible soil (Sharp near vertical Fine grained
contact)\ frost· susceptible soil
a
Indistinct
lithologic contact '-..0 0 C Isotherm before
introduction of pipeline
Figure 2.2: Differential frost hea··3 occurring around a chilled pipeline.
Case a) heave over indistinct lithologic ~ontact, Case b) heave
over sharp near vertical contact between frozen and unfrozen soi~.
-------------------
I I I I I I I I I I I I I I I I I I I
17
(Figure 2.2).
Determination of the resistance to heav~ at the frost
line is further complicated when a pipeline is undergoing
differential heave. Since the pipeline has some strength,
it will act as a restrained structural member, exerting a
downward moment on the heaving section of the pipe and an
upward moment on the restrained section of the pipe. If an
annulus of frozen soil is present around the pipe it may
also have some flexural stiffness incre2~ing the heave
resistance across the transition.
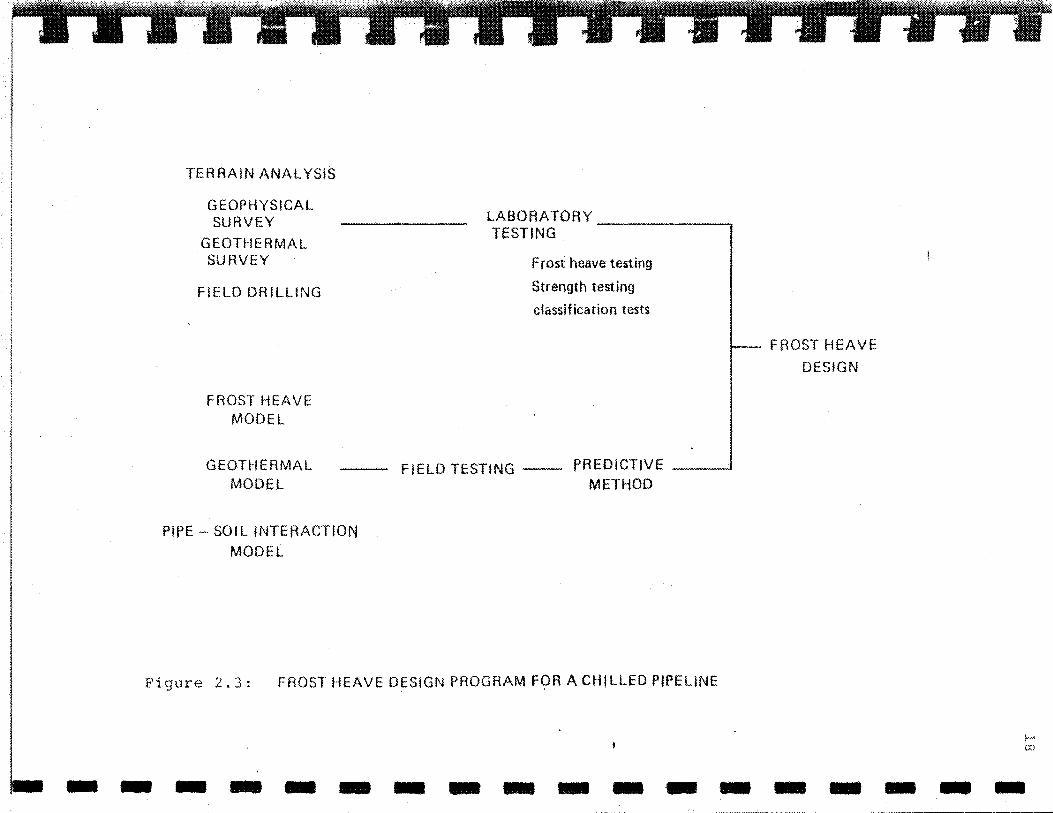
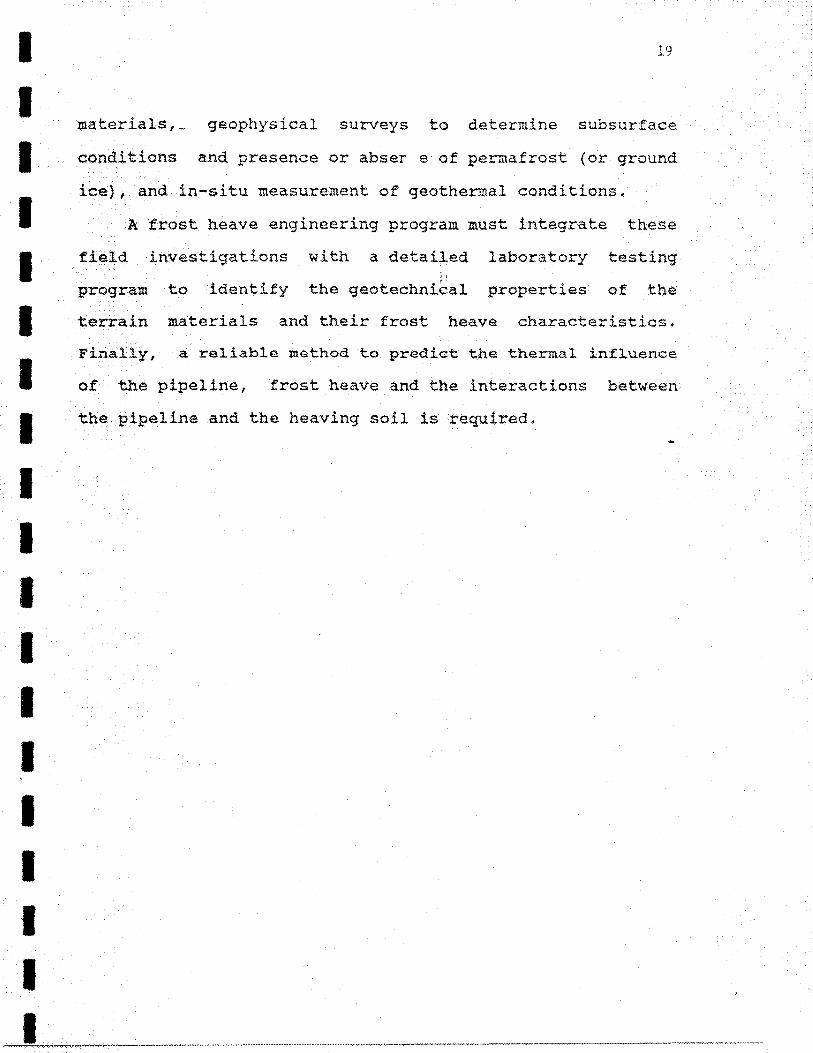
2.6 Frost Heave Engineering Progr~~
A frost heave engineering program for a major chilled
pipeline must ensure the overall reliability and safety of a
proposed pipeline design. The basic components of a typical
program are illustrated in the block diagram shown as Figure
2 • J •
The field component of the program should identify and
determine the extent of frost susceptible soils to be
encountered along a proposed pipeline route. This would
normally include some sort of terrain analysis to identify
various surfical units. Once these units are identified,
ground truthing is normally carried out to confirm the
physical characteri ics and natural variability of each
unit. This part of the program would include an analysis of
the thermal character of each terrain unit, identifying
areas of frozen and unfrozen soil. Field work may include
geotechnical drilling program, sampling of subsurface
L
TERRAIN ANALYSIS
GEOPHYSICAL SURVEY
GEOTHERMAL SURVEY
FIELD DRILLING
FROST HEAVE MODEL
GEOTHERMAL MODEL
PIPE- SOIL INTERACTION
MODEL
LABORATORY TESTING
Frost heave testing
Strength testing
classification tests
FIELD TESTING -- PREDICTIVE __ ........~ METHOD
Figure 2. 3: FROST HEAVE DESIGN PROGRAM FOR A CHILLED PIPELINE
--- ---- -- - ---
FROST HEAVE
DESIGN
-- - - -
I I I I I· I I I I I I I I I I I I I
materials,_
conditions
19
geophysical surveys to determine subsurface
and presence or abser e of permafrost (or ground
ice), and in-situ measurement of geothermal conditions.
A frost heave engineering program must integrate these
field ·investigations with a detailed laboratory testing i l
program to identify the geotechnical properties of the
terrain materials and their frost heave characteristics.
Fina11y, a re1iable method to predict the thermal influence
of the pipeline, frost heave and the interactions between
the pipeline and the heaving soil is required.
I --=---·-····-~-·····-···-~--·········································-·····························--~--·· --~~-----~~---~----
I
I
I .
I
I I . ~
:I ~
I '··
I
I .
-.1,·. :~.
·.·.···1.
~:
<.:
I . I
20
CHAPTER III canada - Frr .ce Pipeline Experiment
3.1. General
The Canada-France Pipeline Experiment is being carried
out in the Station de Gel, a special research facility ! '.
situated at the Centre de Geomorphologie at Caen, France.
The objective of the experiment is to undertake a controlled
study of soil freezing and thawing around a chilled pipeline
operated withi a} a ground surface temperature below
freezing 1 simulating winter conditions and b) a ground
surface temperature slightly above freezing, simulating
summer conditions.
The experiment is sponsored by the Governments of
Canada and France through an international agreement
between Carleton University and two French institutions; (
Laboratoire Central des Pants et Chaussees 1 and the Centre
Nationale de la Recherche Scientifique. Supervision of the
experiment is the responsibility of a scientific committee
made up of signatories of the agreement and representatives
of the Earth Physics Branch, Department of Energy, Mines and
Resources 1 Canada.
The details regarding the conception of the experiment
and documentation of its operation can be found in a nu~~er
of contract reports prepared by the Geotechnical Science
Laboratories (see Burgess et al, 1982 and Geotechnical
Science Laboratories 1 1982, 1983a and b).
I I I I I I I I I I I I I I I I I J
I IIIII I
I I I I I I I I I I I I I I I I I I
2.1
3.2 Test Facility and Experimental Model
The Station de Gel is a controlled environment facility
originally built for studies of freeze-thaw problems in
highway construction (Philippe et al, 1970). The facility
consists of a refrigerated hall 18m long by am wide and 5:m
high. Adjacent rooms are attached to the hall to
accommodate instrumentation and mechanical equipment. The
base or trough of the hall is 2.0 m deep and it has been
specially prepared to control the experimental conditions.
The indoor enviro11ment of the facility provides three main
advantages for a large-scale experiment:
1) Variations in thermal,. hydrologic and physical
conditions of the soil materials which could be expected in
a field experiment can be largely eliminated.
2} The p. ·otected indoor environment allows
instrumentation and nearly continuous monitoring
progress of the experiment.
detailed
of the
3) The initial experimental conditions can be selected
to suit the experiment.
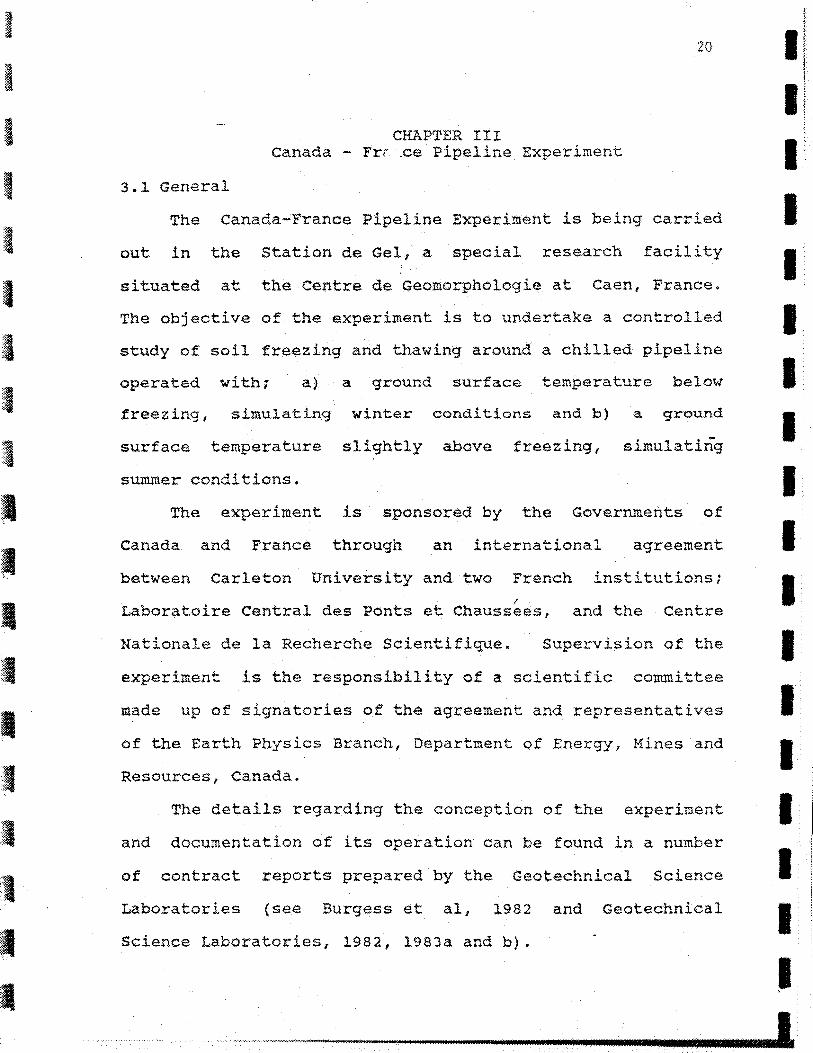
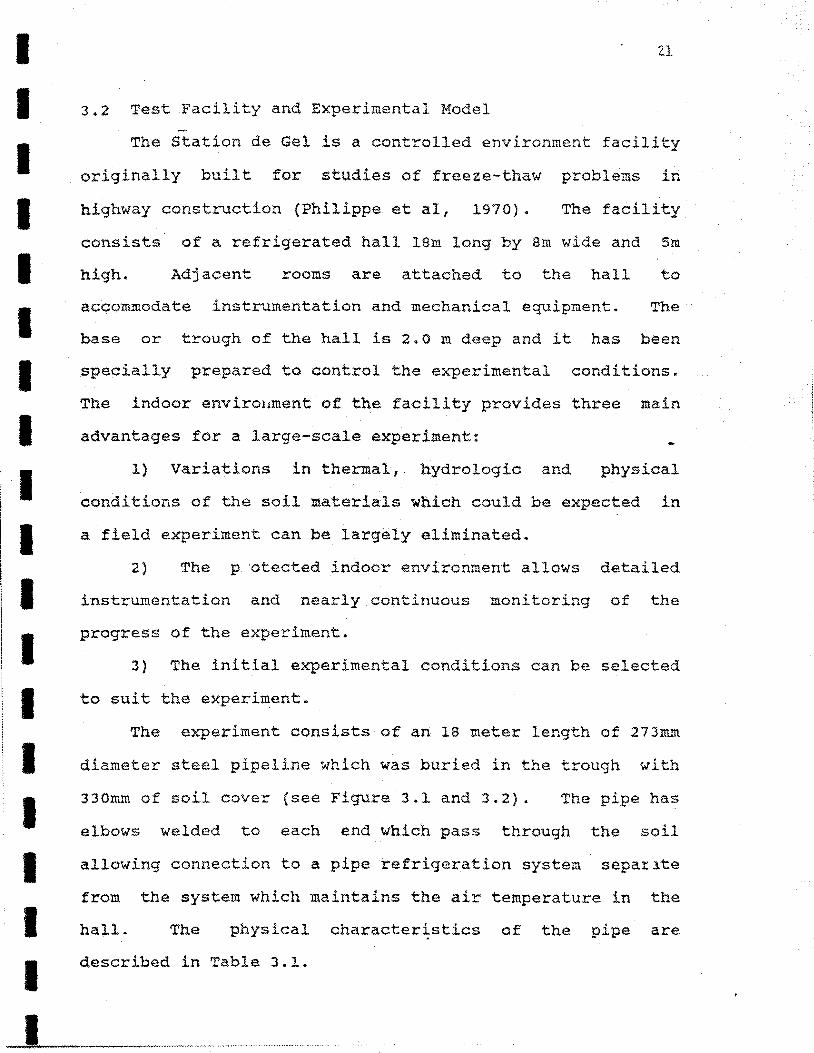
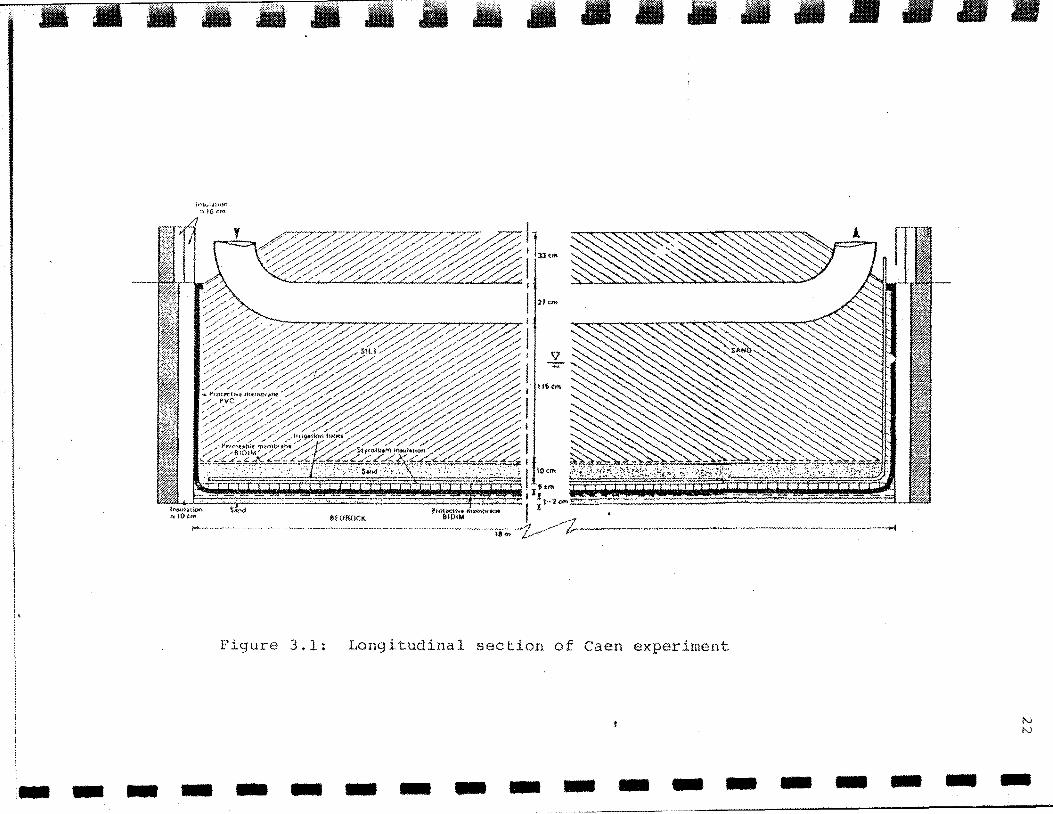
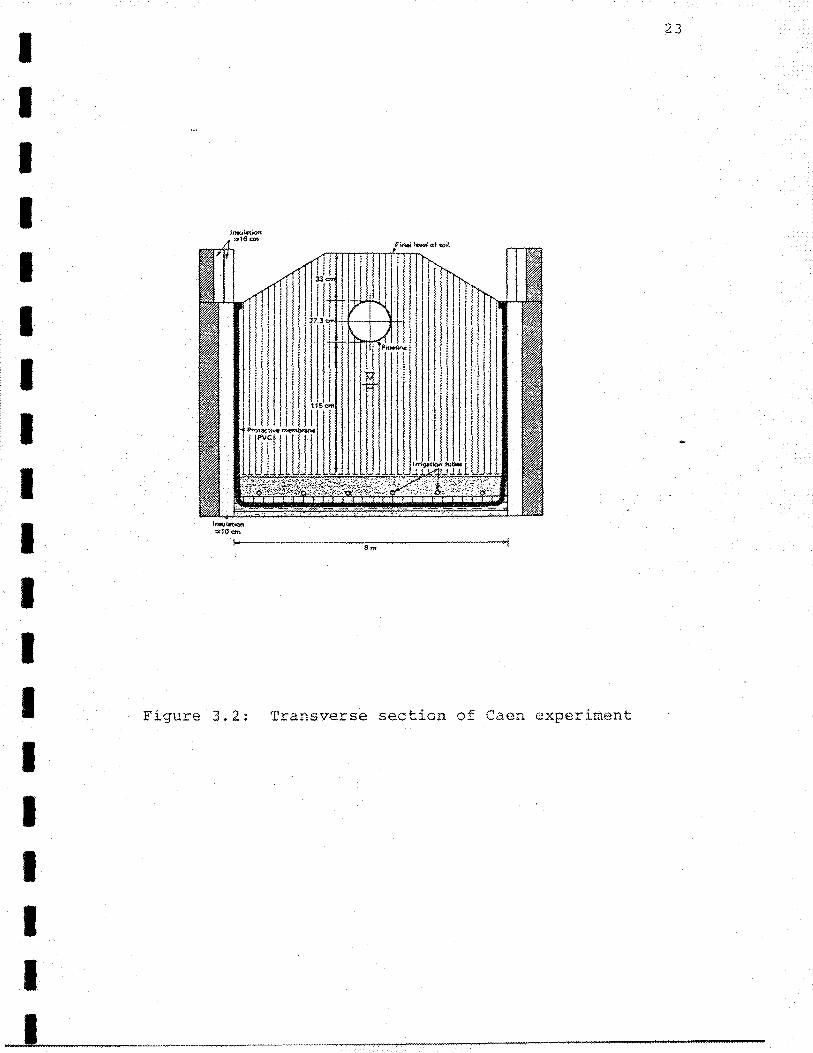
The experiment consists of an 18 meter length of 273mm
diameter steel pipeline which was buried in the trough with
330mm of soil cover (see Figure 3.1 and 3.2). The pipe has
elbows welded to each end which pass through the soil
allowing connection to a pipe refrigeration system separ~te
from the system which maintains the air temperature in the
hall. The physical characteristics of the pipe are
described in Table 3.1.
----=-~--~""'''''"'''''-'""'''''''''
l l ! l !
••••••
lr!~o_;{J1i'Ofi
:~ l(l (t(';
!t.~ I I
l 21 (-:1)\o
I.
I I
I I !6 o>1
I
' I
I I I Ill<"'
l~ .... I !
l SWIIOf.K
!-"·-~······
Figure 3.1: Longitudinal section of Caen experiment
• •
N N
·- - - - - - - - - - - - - - - - - - -
I I I I I I I I I I I I I I I I I I I
,,.,.....,., ::.:10an
1--------------...,-a-.,.-------...........;
Figure 3.2: Transverse section of Caen experiment
23
~ I• _:. I
I• t•
24
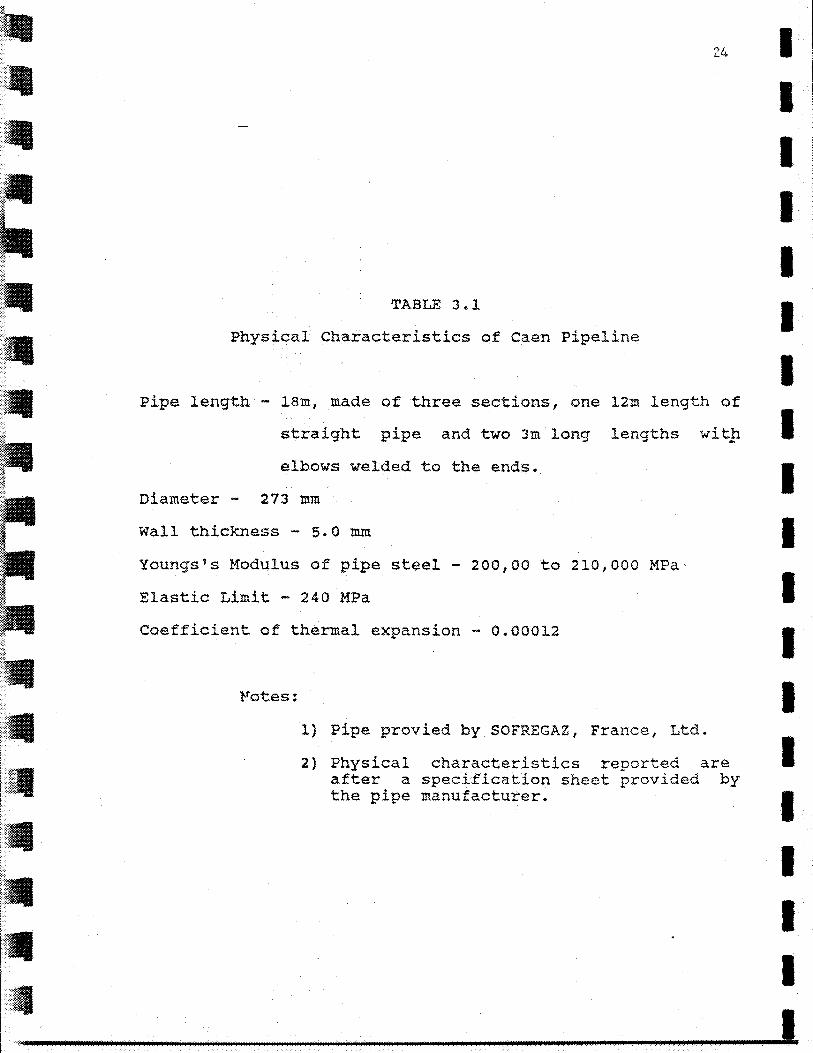
TABLE 3.1
Physical Characteristics of Caen Pipeline
Pipe length - l8m, made of three sections, one 12m length of
straight pipe and two 3m long lengths witp
elbows welded to the ends.
Diameter - 273 mm
Wall thickness - s.o mm
Youngs's Modulus of pipe steel - 200,00 to 210,000 MPa
Elastic Limit - 240 MPa
Coefficient of thermal expansion - 0.00012
1) Pipe provied by SOFREGAZ, France, Ltd.
2) Physical characteristics reported are after a specification sheet provided by the pipe manufacturer.
I I I I I I I I I I I I I I I I I I I

I I I I I I I I I
25
The pipe is buried across a transition between two
soils, a non-frost susceptible sandy soil (SNEC sand) and a
highly frost susceptible silty soil (Caen silt). The ground
water table in the soils is maintained with an irrigation
system situated at the base of the trough.
3.3 Schedule and Operating Conditions
The experiment began on September 21, 1982 with a
period of surface freezing. The operating conditions during
this period called for an ambient air temperature in the 0 0
hall of -0.75 c and an average pipe temperature of -2 c.
The water table was regulated at an approximate depth of ...
90cm below the original ground surface or 30cm below the
. The first freeze period continued for 8.5 months pl.pe.
I until June 8, 1983.
I I I I I I I I I
A period of surface thaw began immediately after the
first freeze period, with the pipe temperature remaining at 0
-2 C but the ambient air temperature in the hall being 0
raised to +4 c. The surface thaw period continued for 4
months until October, 1983 ..
After a number of modifications to the instrumentation,
the second period of surface freezing was begun on October
17 1 1983. The operating conditions during this period were
similar to the first freeze except that the average pipe 0
temperature was reduced to -5 ~ to increase the depth of
frost penetration.
3.4 Instrumentation
3.4.1 General
!.ll" t
' ·-~ ~ .
I I •It ~ .
•
?···· ·~
26
Various networks of instruments are distributed in each
of the soils 1 in the air and on the pipeline. The
instruments are distributed normally and symetrically along
a number of transverse cross-sections (Figure 3.3).
Additional instrumentation is also located in areas of
critical importance such as the transition between the two
soils. In total, more than 400 instrumentation points are
present in the experiment •
Observations are made at frequent intervals by an
automated data aquisition system or by manual methods.
Instrumentation can be broadly grouped into those
instruments which monitor the soil thermal regime, ~~e soil
hydrologic regime and the heave and stress regimes of the
pipeline and soils.
3.4.2 Thermal Regime
Temperature data for the experiment is collected
automatically from about 160 (copper-constantan}
thermocouples, 20 thermistors and several heat flux meters.
Supplemental temperature data are collected manually with a
portable thermistor string which can be placed in vertical
access tubes at various locations.
3.4.3 Soil Displacement
Movement of the ground surface is measured by
surveying a grid of 19i nails which are fixed to the soil
surface. Internal deformation showing the zone of primary
heaving and the occurrence of secondary heaving are measured
by sets of telescoping tubes, and a magnetic heave device.
I I I I I I I I I I I I I I I I I I I

------------------
puits de controlu ?"" control well
Small Door
Gaucho Vtft
F B 0 c A E
0 0 0
I I I~ ®I I ®I ' ' .,~ p1ezometre I
I I I I
I I I I I l
I I I l TOR • I • I TOR I (hor~ I I (vert)
l ---~ . I . . • :r: I
tube• d/ 1f ~ ;/ I TDA .,..~ gl-:
I I (h rl I tubes de 1 gonllement I . I X X 0 gonflement
I~ h~e <Xl ®I hr~: ®I r anne/ux
I magn tiques I I ! l I I 2.0m I 5.0m ~.m.___., ..--UL~! 6.0m l .. 2.0m
I® ~
I® limon l ®I j Sable ®I Silt Sand
IO 0 0
F B (} c A E
+-----·-------------------ll>l+--------------------9.00 m 9.00m
Oroite Rlgl1t
Figure 3.3: Plan view of Caen experiment showing location of surface
instrumentation and instrumented sections.
I
G rande Porte
Front Door
28
Two sets of telescoping tubes were installed in each of
the soils (see Figure 3.3). Each of these sets are of a
slightly different design.. One set have feet welded to the
base of each tube and the other set, which pass directly
through the pipe, are smooth sided. Each tube in a set is
of a different length with the central tube being the
smallest and longest. When the tubes are nested together
they are exposed to only lOcm of soil, with the movement of
each tube being independent of the other.
For the footed tubes, the heave of an individual tube
will only occur after the heaving soil has engulfed the base
of the tube. The smooth sided tubes probably begin to heave
when only
heaving.
a small portion of the soil around a tube is
This is because the base of a smooth tube is not
by the feet, and the adfreeze bond between the
the heaving soil will be much greater than the
anchored
tube and
resisting friction.
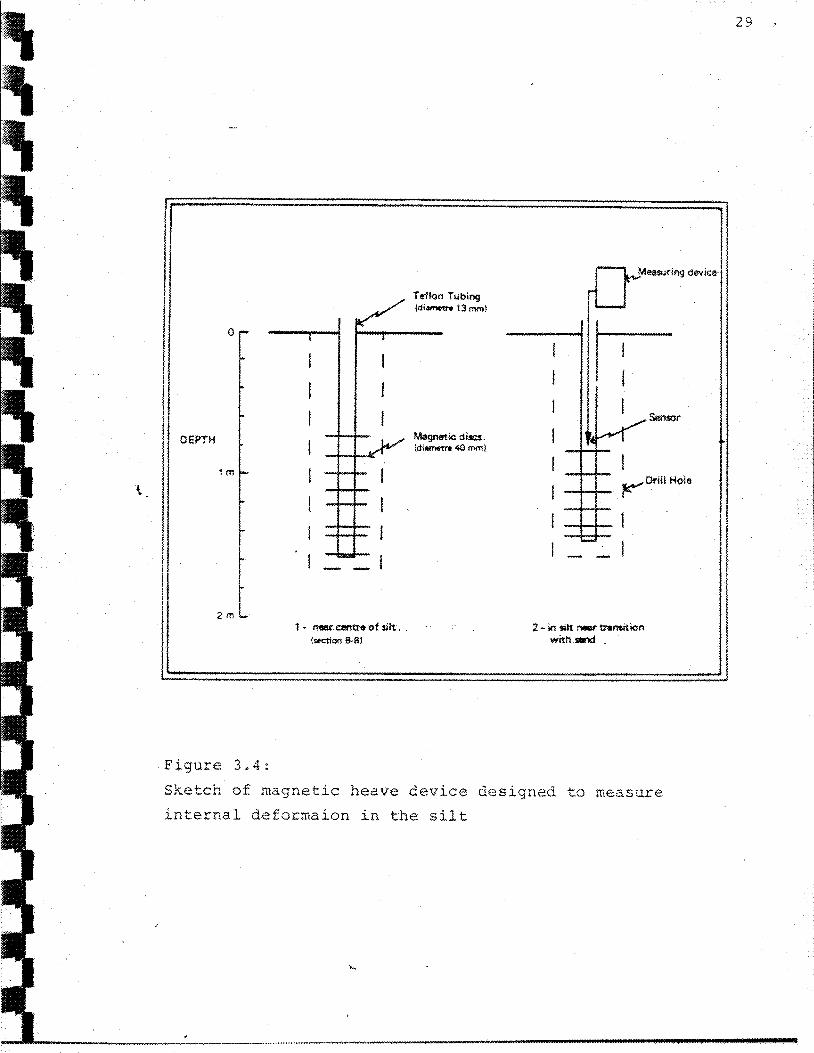
The magnetic heave device measures the displacement of
magnetic discs which are buried and free to heave with the
surrounding soil (Figure 3.4). A probe with a switch, which
closes when it enters the field of the magnets, is lowered
down an access tube. Two access tubes with 6 and a magnets
each are present in the silt (see Figure 3.3 for locations).
3.4.4 Pipe fsformation
The heave displacement, the deformation and the state
of stress in the pipe can be determined by direct
observations of the movement of vertical rods welded to the
I I I I I I I I I I I I I I I I I I I
! I i I
!
~ ~Me&$Uf"lng device!
~ Teflon Tubing ,..
(dllnWI'I:nl 13 mml '--
o,...
~ r t
I I I
I l I I I
! I F<l~Sensor OEPTH t
Magnetic diSC!. I (dit~m~ttrt 40 mm)
.... l f I I
1m ~Drill Hoie
I I I
i I I I
I - l ! f - -- -
2m L..
1 • neat".alfrtre of silt .. '- 2 ~ in sllt neal' transition (=ion !l-8) with~ .
Figure 3.4:
Sketch of magnetic heave device designed to measure
internal deformaion in the silt
l
29
l 1
I .,1 ~i.l:
I I I I I I I I
'
30
crown of the pipe. Alternatively, strain gauges mounted on
the pipe can be used.
The vertical rods are about 500mrn in length and tapered
to a point at the top. They are distributed at 500~~
intervals along the length of the pipe and the rods are
isolated from the surrounding soil by oversized PVC tubes.
There are three methods of measuring displacement of the
rods (see Bowes, 1985). A curvature gauge measures the
displacement of one rod relative to two adjacent rods, a
precision leveling device allows measurement of the angular
displacement of the rods and leveling of the rods enable?
direct measurement of movement of the rods relative to a
fixed datum.
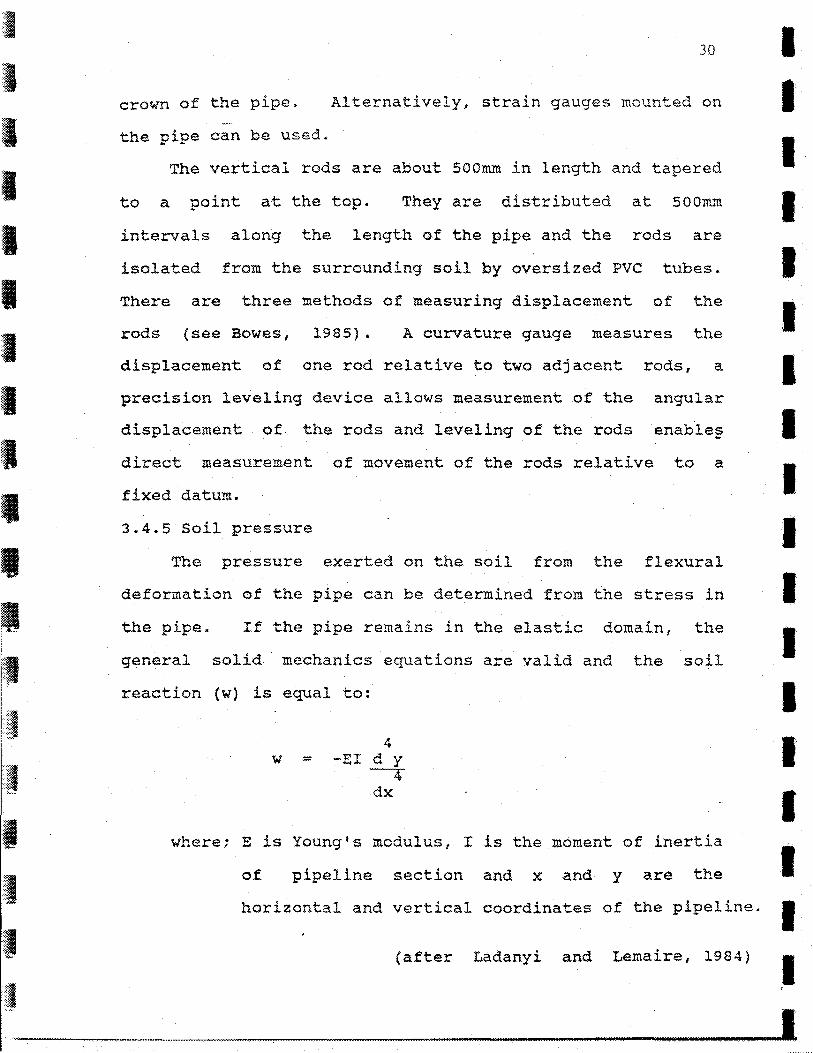
3.4.5 Soil pressure
The pressure exerted on the soil from the flexural
deformation of the pipe can be determined from the stress in
the pipe. If the pipe remains in the elastic domain, the
general solid mechanics equations are valid and the soil
reaction (w) is equal to:
where; E is Young's modulus, I is the moment of inertia
of pipeline section and x and y are the
horizontal and vertical coordinates of the pipeline.
{after Ladanyi and Lemaire, 1984)
---------------·····
I I' I I I I I I I I I I I I I I I I '
I
.. , .~~~· •, . .,., .. ·
··:·~· ;~:;-
:==.
, . , .
, . .
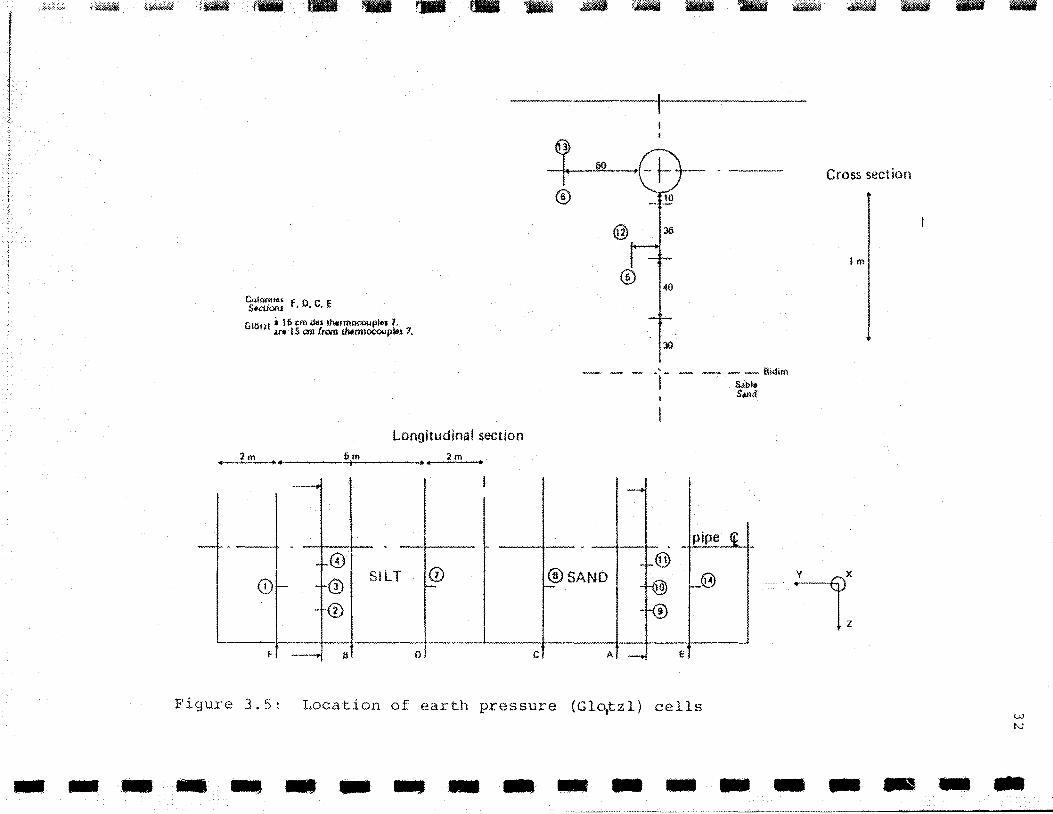
The -distribution of total earth pressure ( CJ ) is t
monitored with Glotzl cells which are buried in ~~e soils in
the vicinity of the pipeline (Figure 3.5). The Glotzl cells
contain a deformable membrane filled with oil. The pressure
of· the oil in the membrane is determined by circulating
pressurized air through a measuring system •
3.4.6 Hydrologic Regime
The characteristics of the hydrologic regime of the
soils can be determined by time domain reflec'l''rrtetry probes
{TOR) buried in the soils. The probes measure the apparent
dielectric constant of the soils from measurement of the
travel time of the TDR's step voltage. As a soil freezes
the apparent dieletric constant changes and the change can
be related to the unfrozen water content (see Patterson and
Smith, 1981) •
Two types of TDR probes, horizontal and vertical~ are
installed in the soils at locations shown on Figure 3.3.
3.5 Physical Characteristics of Caen silt
3.5,1 Classification
The Caen silt is known locally in Normandy as Limon de
Rougemontier. The material placed in the pit came from a
borrow pit in sediments of eolian origin. Before placement
in the test site the soil was prepared at CETE (Centre
d'Etude Technique de !'Equipment}. Grain size analyses
performed on the silt show its composition to be variable
with an average of 13 to 20% clay (<0.002mm), 65 to 75% silt
Cal~~~~·u f o f" E Sf'CUOlU ' ....
Gii:IUI * lli em <l<il lNtll'IOCOuploi 7, .ilr• 15 em from dwrmocoupl$s '1.
Longitudinal section 2m 2m
--- I
- - . . 0
0 0 0 SILT - -
-·®
F ~ a ()
® ....;: SAND
c
- --llidim Sa bit S•nd
pipe
Figure 3. 5: Location of earth pressure (Glo,tzl) cells
Cross section
lm
------~----------~~
•• •• I-I
•• •• •• I 1:
•• •• ~. ~. •• II.·.· ' '
I . :·I I ~I
I I I ·I I ~--
; I ... I
33
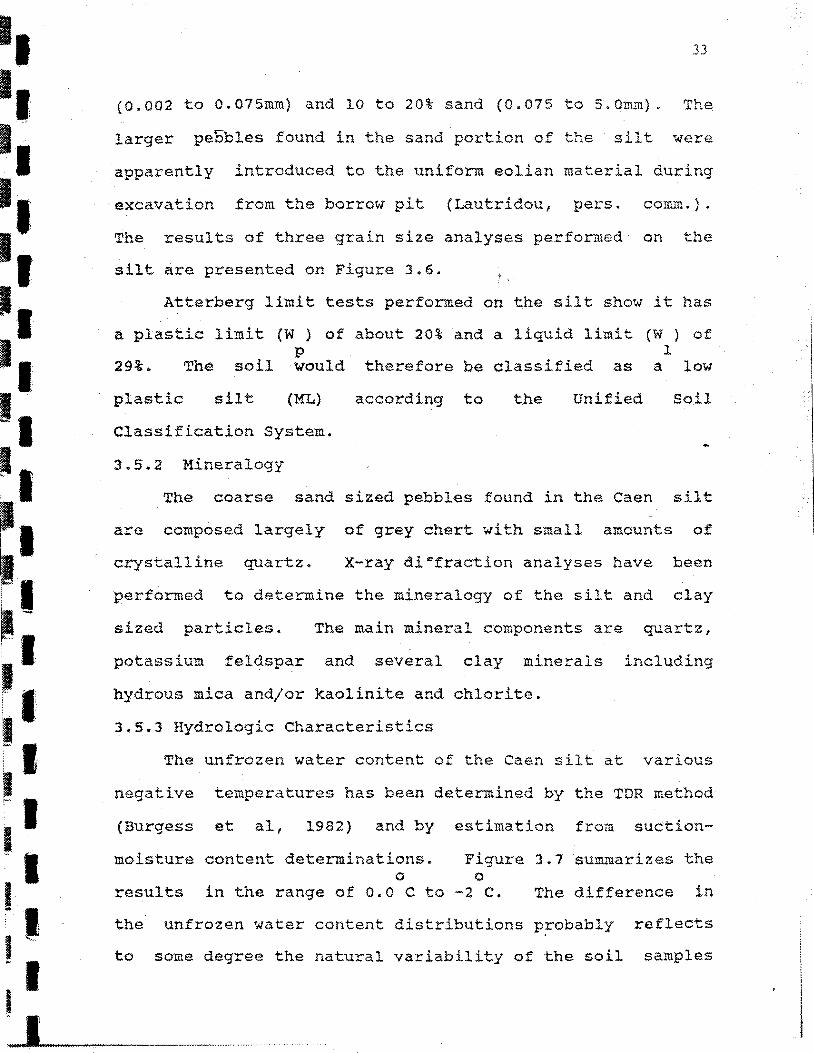
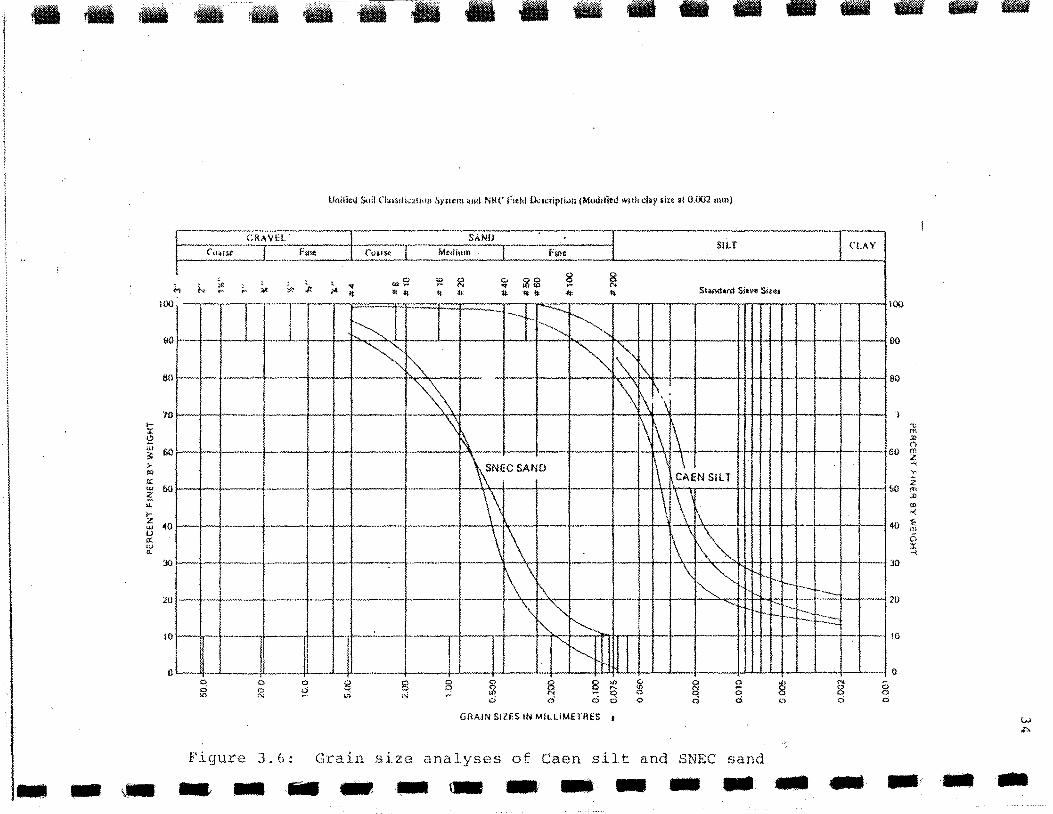
(0.002 to 0.075nun} and 10 to 20% sand (0.075 to S.Onu11). The
larger pebbles found in the sand portion of the silt were
apparently introduced to the uniform eolian material during
excavation from the borrow pit (Lautridou 1 pers. conu11..).
The results of three grain size analyses performed on the
silt are presented on Figure 3.6. ! " ..
Atterberg limit tests performed on the silt show it has
a plastic limit (W } of about 20% and a liquid limit (W } of p 1
29%. The soil would therefore be classified as a low
plastic silt (ML) according to the Unified Soil
Classification System .
3.5.2 Mineralogy
The coarse sand sized pebbles found in the Caen silt
are composed largely of grey chert with small amounts of
crystalline quartz. x-ray di~fraction analyses have been
performed to determine the mineralogy of the silt and clay
sized particles. The main mineral components are quartz 1
potassium feldspar and several clay minerals including
hydrous mica andjor kaolinite and chlorite.
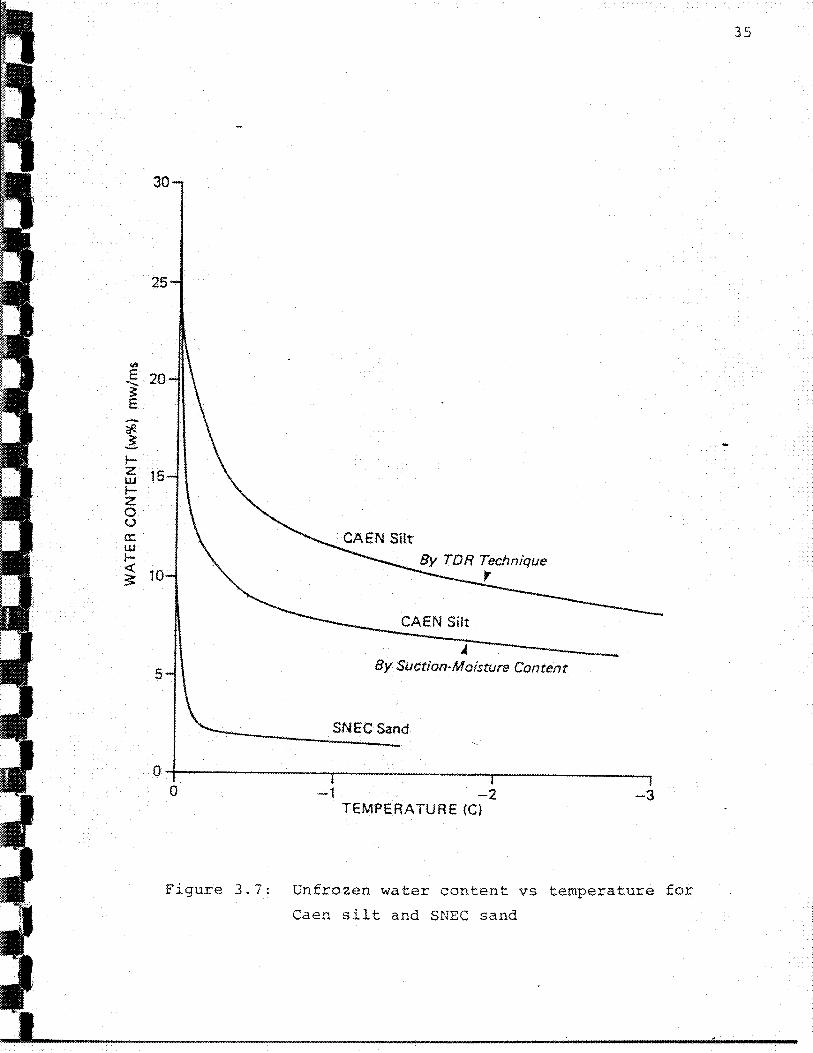
3.5.3 Hydrologic Characteristics
The unfrozen water content of the Caen silt at various
negative temperatures has been determined by the TDR method
(Burgess et al, 1982) and by estimation from suction-
moisture content determinations. Figure 3.7 sunu~arizes the 0 0
results in the range of o.o C to -2 c. The difference in
the unfrozen water content distributions P!Obably reflects
to some degree the natural variability of the soil samples
• • - • - -
CRAVH.
Co;one • [ ·--~--~lilt
i-J 1-. ~ ~ ' ~ - ;,it. ;(:. ?t
lOO
:WE 9
8(
10 --·-. f-
I :r \:?
............. __ UJ so ?,; >-"' u:: -- ~--·-I.U w ~ u.
i ~.._ ____ 1-z 40 "' (.)
a: w "-
:3() ---- ·-········-.
! 20 ----------- ------
~---~-l..-.• ·--·-
!0
0 <::< 0 0
d
- - - - -
SANO ·-:~ ·---
Co a• ~---~-- Medium ~----- fl~~t : SilT ~--~ .. -~~·
~ ~~ '!!. ~ :? 1&15 ~ ~ It: t< 'II *' ~~' 1j. ~# 4t ·Uc StandArd Sltn Slt~•
t~--1 ~~J --t ~ .
"" i'---" ,....__ -··
~ ~ !\' l'-, \. -1--·
~ \ \f\ . \ \
\ ·- ...
\\NECSAND ... u .. -..-
1\ I
.. ~ -.... ..
\ -------------. --~\ \ 1\ __ ......_ _____ ~· ·---- --·
\ ~"" '~ "·----~-
I ,,
""' L.......-..... .. -L----8 '"
8 N d
GRAIN SIZES IN MfU.IMHRES t
\f\ 1\\ \
-·-- ---
I l 0 IS> 0 0
~ \
CAEN SILT
\\ \
\
.. -
[\
1\~ ~"'-____ .,
--
.......
0
0 ci
.. ..
t--
-i-
Figure 3.6: Grain size analyses of Caen silt and SNEC sand
- - •
1--.....
fLAY -. .. -.. --.
-......
-1---
---- ,.......,-- 100
...
i
~=--[::::::-
-f-.--
eo
BO
r-"!;
"' ~ n 60 ~
""<
" -- flO ~
;o
....... ........... 30
2'0
'------ l
·- 0
g ci
• •
--~~----~-~---~~~~-
<h
E -~ E.
* _! ~ z UJ 1-z 0 (,)
0:: w !-< 3
30
25
20
15
By TDR Technique 10 ,
CAEN Silt
~
5 By Suction-Moisture Content
SNEC Sand
0;--------------,~-------------r------------~ 0 -1 -2 -3
TEMPERATURE (C)
Figure 3.7: Unfrozen water content vs temperature for
Caen silt and SNEC sand
35
I ·'I t ·r
:. I.
I . •.
'I I I I 'I'' :;~ ...
;:1: ...
36
tested, but it is also likely that the unfrozen water
contents determined by the suction-moisture content method
are somewhat low because it is difficult to account for salt
present in the pore water.
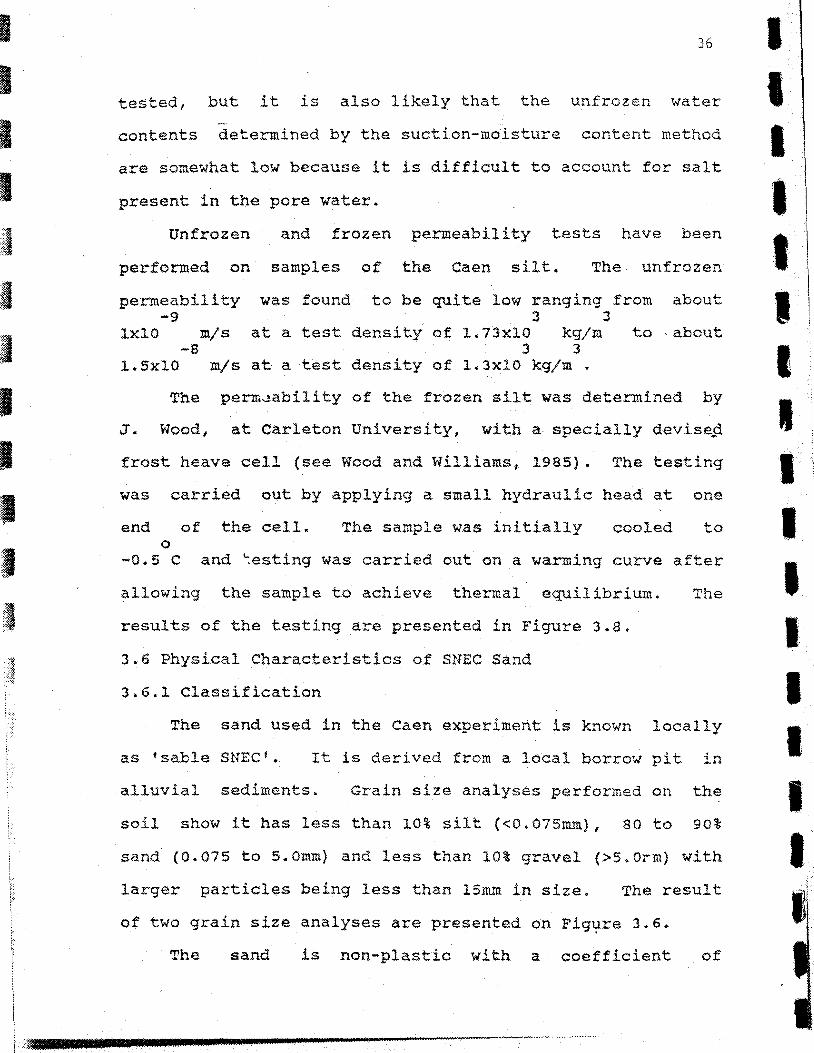
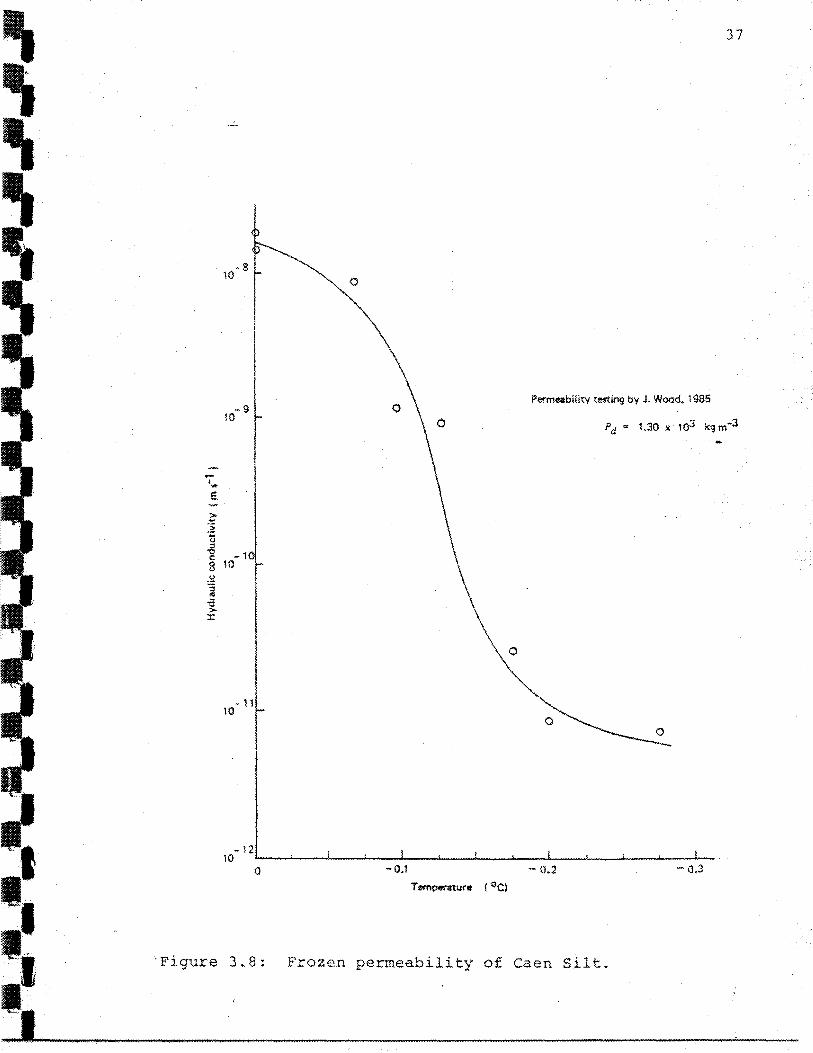
Unfrozen and frozen permeability tests have been
performed on samples of the Caen silt. The unfrozen
permeability was found to be quite low ranging from about -9 3 3
lxlo m;s at a test density of 1.73Xl0 kg/m to ·about -s 3 3
l.SxlO mjs at a test density of 1 .. 3xl0 kgjm . The perm-.1ability of the frozen silt was determined by
J. Wood, at Carleton University, with a specially devise£!
frost heave cell (see Wood and Williams, 1985) . The testing
was carried out by applying a small hydraulic head at one
end of the cell. The sample was initially cooled 0
-0.5 c and -:esting was carried out on a warming curve
allowing the sample to achieve thermal equilibrium.
results of the testing are presented in Figure 3.8.
3.6 Physical Characteristics of SNEC Sand
3.6.1 Classification
to
after
The
The sand used in the caen experiment is known locally
as •sable SNEC 1 • It is derived from a local borrow pit in
alluvial sediments. Grain size analyses performed on the
soil show it has less than 10% silt {<0.075mm), 80 to 90%
sand (0.075 to S.Omm) and less than 10% gravel (>S.Orm) with
larger particles being less than 15~~ in size. The result
of two grain size analyses are presented on Fig~re 3.6.
The sand is non-plastic with a coefficient of
I
' I I I I I I I I I I~
I I I I
-9 lO
-11 10
0
0
-0.1
Permeability te$ting by J. Wood, 1985
0
-0.2 -{).3
·Figure 3~8: Frozen permeability of Caen Silt.
37
• • I
,. \~ .
• •• • .
• • .
. i,
.lll
o'l;>_·_ ::: ;._~
I
38
uniformity (0 /D ) of 5.5. to 6.0 and a coefficient of 60 10
curvature (D 0 /0 D ) of 1.5 to 1.8. It falls 30 30 60 10
between the requirements for a well graded and a poorly
graded sand (SW-SP} by the Unified Soil Classification
system.
3.6.2 Hydrologic Characteristics
The unfrozen water content of the sand has been 0 0
determined between the range of 0 c to -2 C by the suction
moisture content method. As shown on Figure 3.7, the 0
~.frozen water content drops off sharply below 0 c. The
amount of unfrozen water remaining in the soil is
significantly less than for the finer grained Caen silt.
The unfrozen permeability of the sand was found to be -5 3 3·
about l.SxlO mjs at a test density of l.9xlO Kg/m . The
permeability of the frozen sand was not determined. Since
the unfrozen water content is very low it is expected that
the frozen permeability would also be low.
--·~, ______________________ , ................................... .
I I I I I I I\ I I I I I I I I ,, I I
'
I
CHAPTER IV
OBSERVATIONS OF SOIL FREEZING AND FROST HEAVE AROUND THE CAEN PIPELINE
4.1 Introduction
39
The second period of surface freezing, with a pipe 0 0
temperature of -5 C and an air temperature of -0.75 c, has
been chosen for discussion in this chapter. This period is
of longer duration than the first period of freezing and
the colder pipe temperature has resulted in greater frost
penetration and heave. Also, a number of improvements -t:.o
the experiment have increased the reliability of the thermal
data for this cycle.
At the initiation of the second period of surface
freezing, nearly all of the annulus of frozen soil formed
during the first freeze period had melted as a result of the
surface thaw. The soil around the pipeline and throughout
the pit underwent thaw-consolidation. Towards the sides of
the pit, where the entire soil layer was thawed, the silt
settled below its original level by 2 to lOmm. The sand
remained in a dilated state however, with a net displacement
of 5 to lO:nu"U.
The thaw of soil around the pipeline during the period
of surface thaw resulted in sett"..ement of the pipeline and
the release of stress built up during the first freeze
period. Since cold air was circulated in the pipeline 0
(temp. -2 c) during the surface thaw, some frozen soil still
I I I I I I I I I 'I t I I '., .. ;~: .,
40
surrounded the pipe at the end of the thaw. As a result of
the annulus of frozen soil and the dilation effect in the
sand, the pipe was displaced about 10 to 15mm above the
datum established at the start of the experiment.
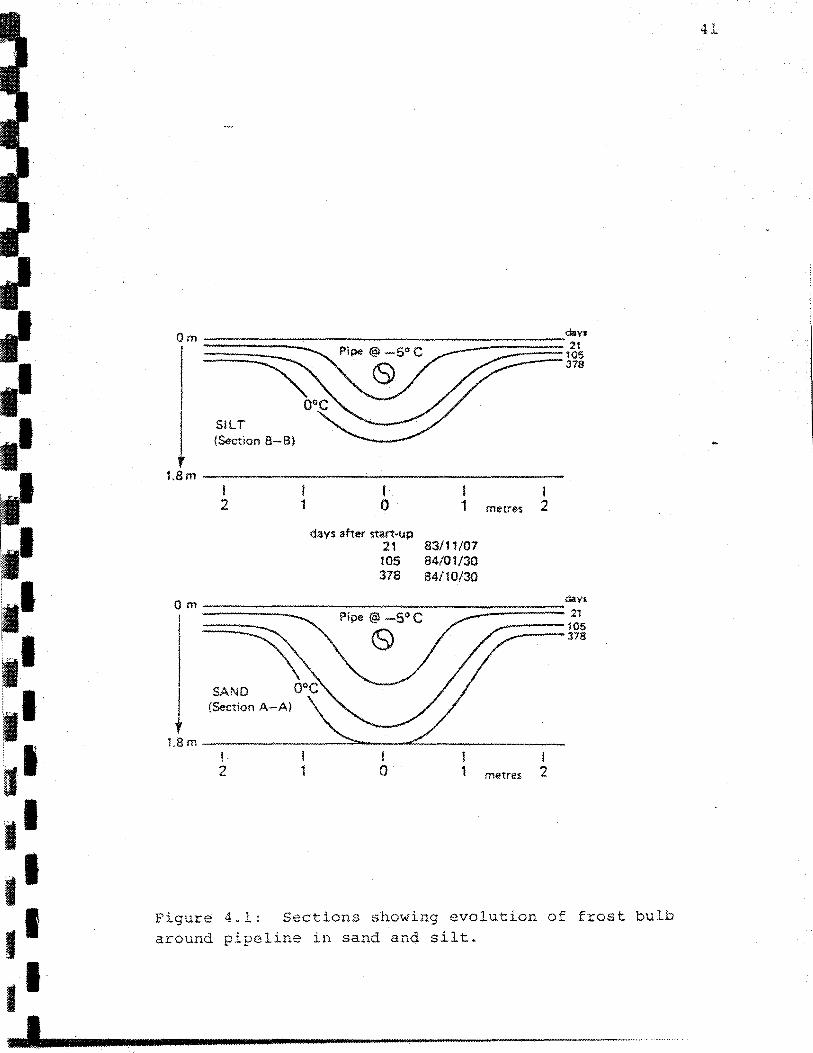
4.2 Pattern of Soil Freezing
After the air temperature was lowered for the second 0
freeze period (-0.75 }, a freezing front moved down from the
ground surface (see Figure 4.1). At the same time, a
freezing front advanced radially from the pipeline, but at a
faster.rate than before since it was at a lower temperature 0
(-5.0 C).
The rate of freezing has been substantially higher in
the sand than in the silt 1 reflecting its higher thermal
conductivity and lower water content (heat capacity). The
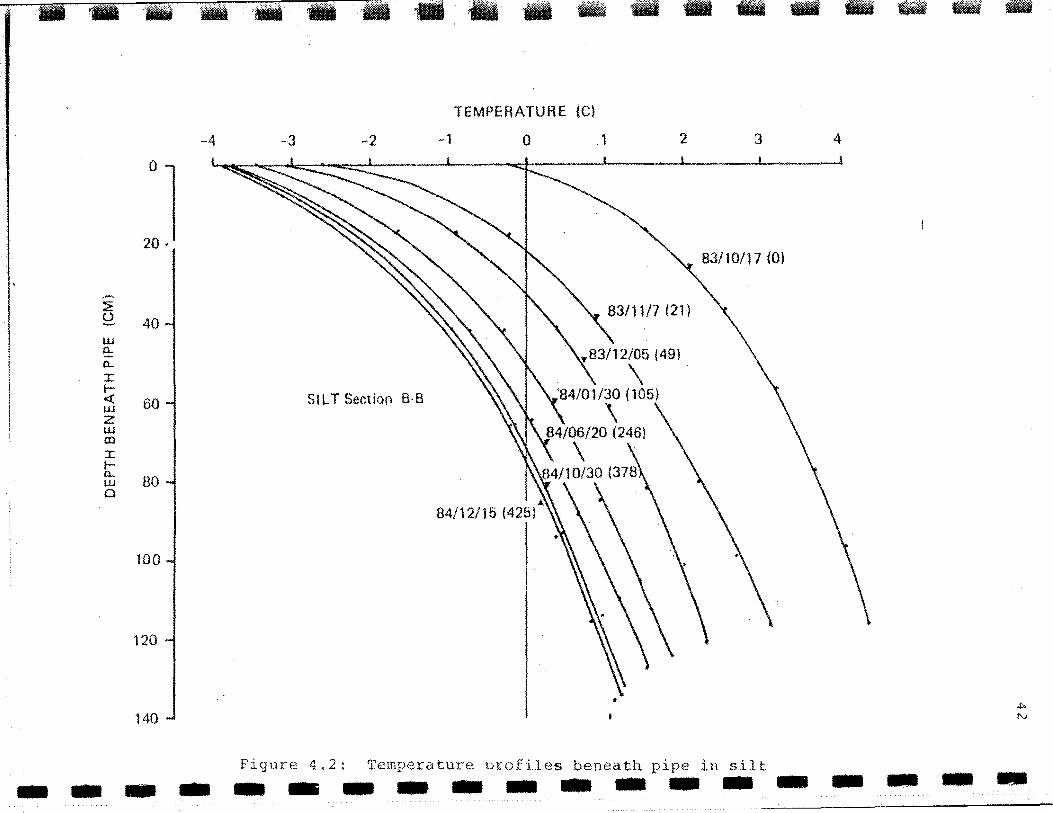
evolution of the thermal gradients beneath the pipe has been
determined by thermocouple measurements and from limited
thermistor data (a number of thermistors buried in the silt
became
Figure
inoperable during the first freeze) .
4.2 and 4.3 the gradients changed
As shown on
rather quickly
after the start of the freezing 1 but the rate of change
decreased ·with time. The thermal data shown in the figure 0
are considered to be accurate to +/- 0.1 c.
During the last 100 days shown on Figure 4.2 1 the
thermal gradient beneath the pipe in the silt remained
relatively constant, 0
0
approximately 1.9 C/m in the unfrozen
sol~ and 5.3 c;m in the frozen soil. The more rapid rate of
freezing beneath the pipe in the sand has resulted in frost
i ···~: •. ______________________ __,.....,.........--
t I I I I I I I I I I I
' t I I I I I
~ •• •• ~ •• ~~· •• •• 'II
•• •• ·.I I
•• Figure 4.1: Sections showing evolution of frost bulb around pipeline in sand and silt •
• 1 ... ---------------·················
41
• 'IIi
-4 -3
~ ~ 40 w 0.. 0..
I I-<( 60 w z UJ m I I-0..
80 w 0
100
120
140
• ,. • - • 'lrt%3" • TEMPERATURE {C)
-1 0 .1
SILT Section B·B
• • -2 3 4
1
• • • •
Figure 4.2: Temperature urofiles beneath pipe in silt
--~----------------

UJ 0..
0...
:r: ..... <( UJ z w Cll
r r-0.. UJ a
0
20
40
60
80
100
120
140
TEMPERATURE (Cl
-4 -3 -2 -1 1 2 3 4
SAND Section A·A
I
I
I I
44
penetration beneath the bottom of the pit under the centre
line of-the pipeline. The average thermal gradient in the 0
frozen portion of the sand was about 2.6 c;m.
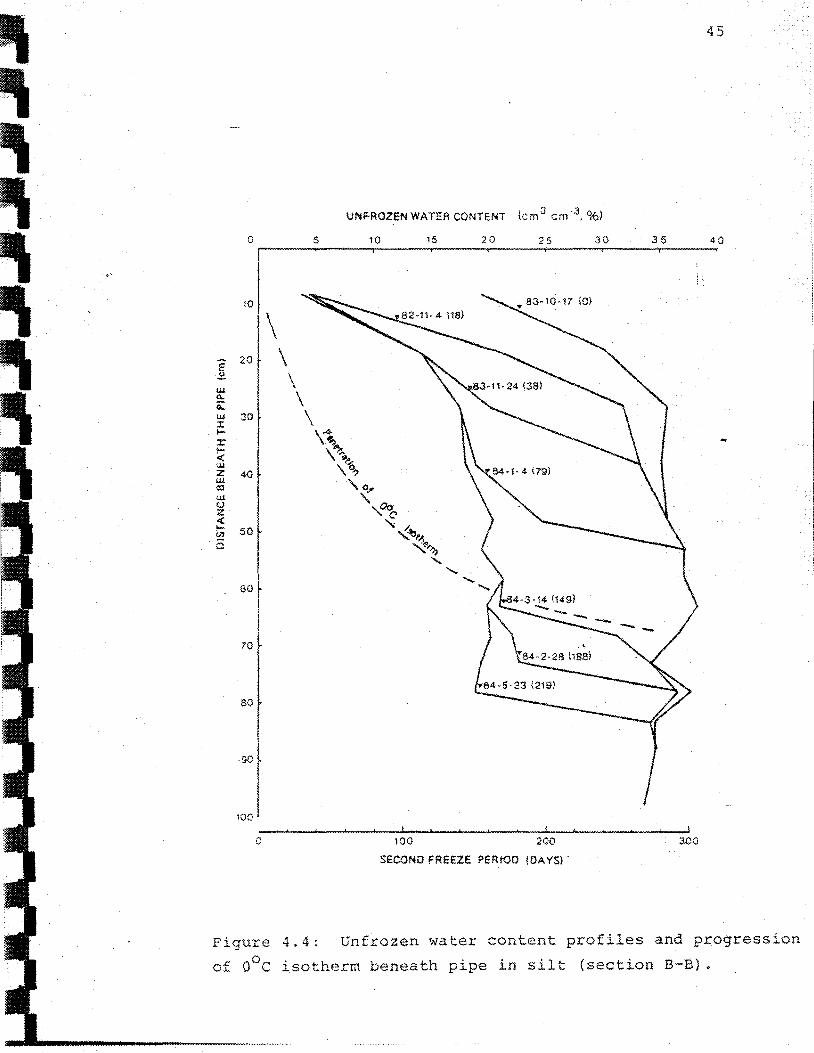
4.3 Unfrozen Water Content
The change in the unfrozen water content of the silt
during freezing has been determined from Time Domain
Reflectometry probes buried beneath the pipe (see
the Geotechnical Science Labs., 1984).
change in the unfrozen water content
first 219 days of the freeze period. 0
the 0 c isotherm is also shown on
l;"eference.
FiTJre 4.4 shows
profile during the
The progression ~f the
the same figure for
The progressive decrease in the unfrozen water content
with time during the first 150 days ~
freezing and the penetration of the frost line. 0nce the
frost line passes below the TOR probe, a sudden drop in
unfrozen water content occurs. After freezing, the unfrozen
water content of the silt decreased to between 10 to 20
percent (by volume) with the exact amount being related to
the unfrozen water content curve fer the silt and the amount
of excess ice present in the soil.
After 150 days the unfrozen water content in the silt
begins to decrease beneath the frost line. For instance, on
day 188 the frost line is about 65cm beneath the pipe but
the soil at the 70 to SO em depth shows a drop in unfrozen
water content (see Figure 4.4).
may be due to dessication of the
The drop in water content
unfrozen soil directly
I I I I I I I I I I I I I I I I I I I
-~ .•
0
- 20 E ~
UJ. 0.. a: w 30 :r: 1-:r ~ w ffi 40 a:l u.L u z .:(
~ 50 0_
60
70
80
oo~ 10J
0
5
45
10 T5 20 25 JO 35 40
100 200 300
SECOND FREEZE PEfHOO WAYS} .
Figure 4.4: Unfrozen water content profiles and progression
of 0°C isotherm beneath pipe in silt (section B-B).
I I
' I I I I I I
' . , •...
~
'1: ~~~
··I / i
l:l:~. l. 1.~ :~~
beneath the frost line.
observed in laboratory
(Patterson, pers. comm.}.
4.4 Frost Heave
4.4.1 General
46
This type of phenomenon has been
freezing tests with other soils
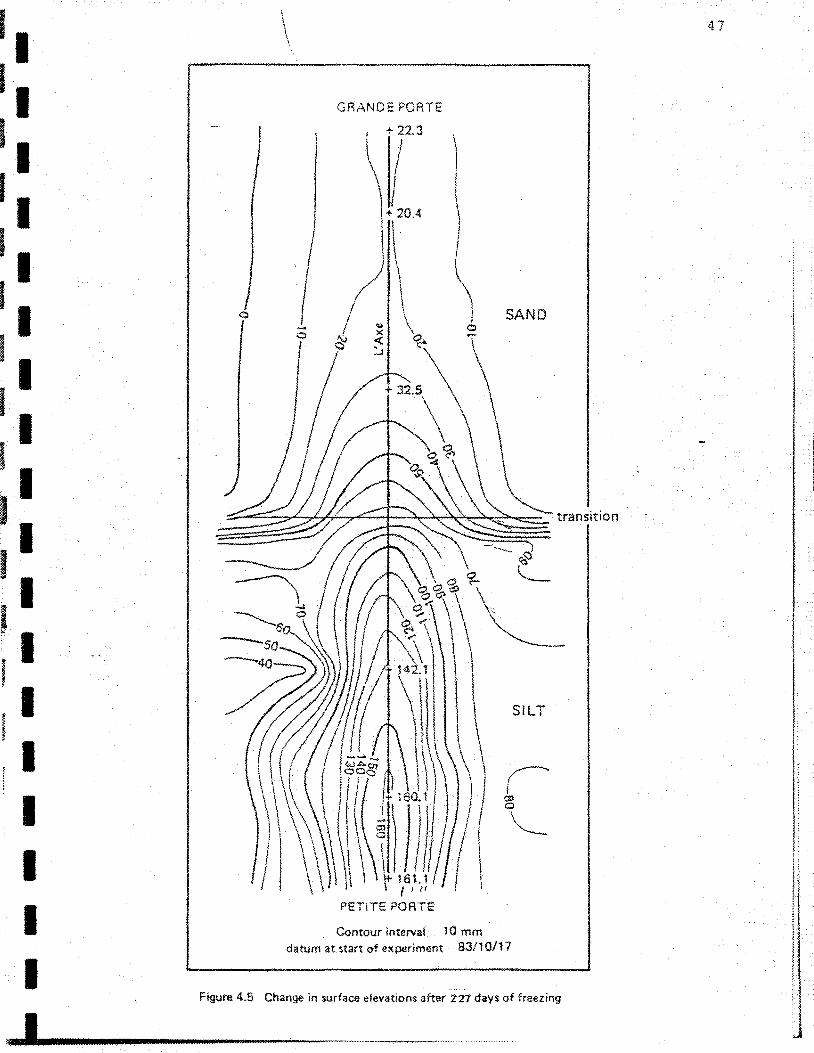
The soil freezing which has occurred .around the
pipeline 1 and down from the ground surface, has resulted in
substantial frost heave in the silt. Figure 4.5 shows the
change in the elevation of the surface of the two soils
(total heave) during 227 days of the second freeze period.
The more frost susceptible silt has undergone greater heave
than the sand and a step has built up along the contact
between the two soils. Heave in both soils has been
concentrated along the axis of the buried pipeline •
The differential nature of the he<...'/e between the two
soils has resulted in the deformation of the pipeline,
particularly in the transition zone between the soils. In
order to examine the effects of frost heave in the two soils
without the complex influences of the pipe-soil interactions
in this area, the heave around the end portions of the
pipeline can be studied. Soil pressures measured beneath
the pipeline 1 and determined from pipe stress measurementsL
confirm that these areas are relatively unaffected by the
pipe-soil interactions (see section 4.6).
4.4.2 Frost heave in the silt
The c~mulative heave with time in the silt beneath the
axis of the pipeline (at section B-B) has been determined
==·~· ----------
I I I I I I I I I I I I I I I I I I I
\
\
GRANDE?ORTE
SAND
Contour interval. 10 mm datum at start of experiment 83/1 0/17
Figure 4.5 Change in surface elevations after 221 days of freezing
47
I
I I
48
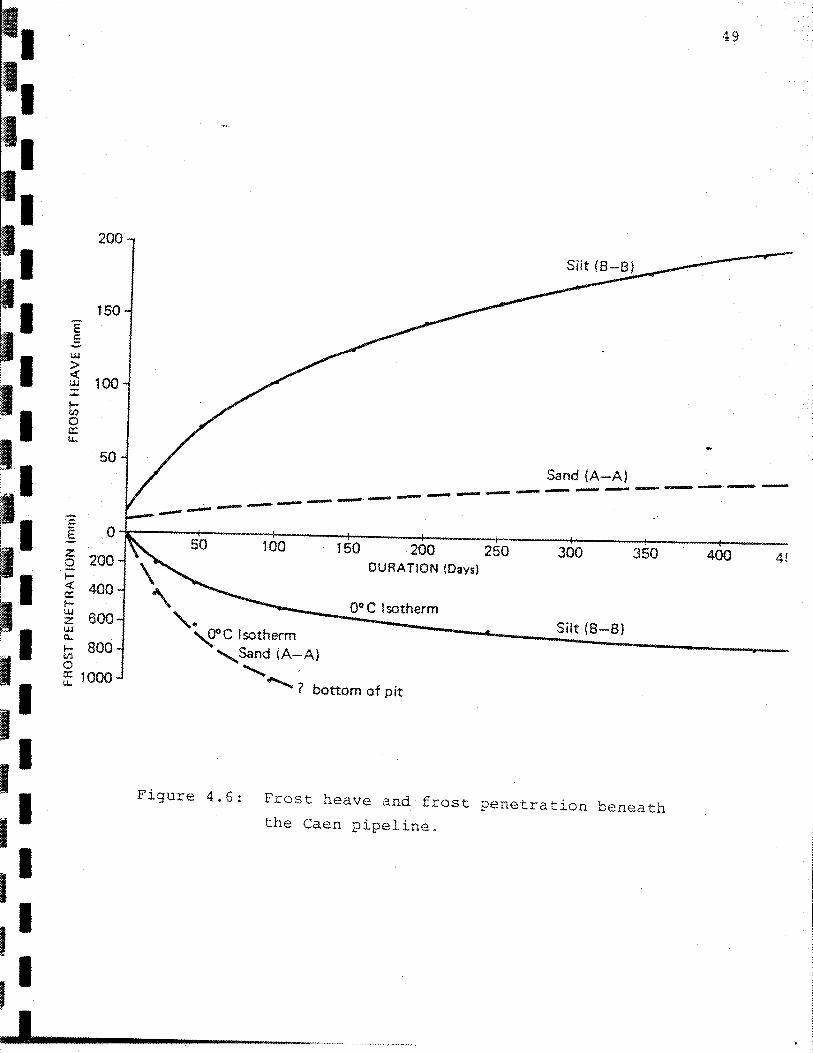
from the frost heave tubes, the magnetic heave device and
from surface leveling (Figure 4.6). The penetration of the 0
o c isotherm, as determined from thermal data, is also
shown. The heave shown is the result of two components:
1. Heave due to the progressive freezing of unfrozen 0
pore water as the soil is cooled below 0 C, and
2. Heave due to ice lensing {segregation) in the
soil as pore water is redistributed as a result
of the temperature (water potential) gradients.
These components have been determined for the silt, using
the freezing characteristic curve for the soil (Figure 3.7)~
OVerall, heave
silt accounts
as a result of pore water expansion in
for only 8% of the total heave, with
remainder resulting from ice segregation.
the
the
Figure 4. 6 shows t:t 1t initially the rate of frost
heaving (H) was high as the frost line penetrated rapidly
into the soil. GraduaLly the rate of frost penetration {X)
and the rate of heaving slowed; however, the ratio of H/X
gradually
· 350 days.
increased with time reaching more t.han 50%
With time more and more of the heat
after
being
extracted from the soil is contributing to the growth of
segregated ice.
The data from the telescoping tubes and the buried
magnets allow one to look at the nature of the segregation
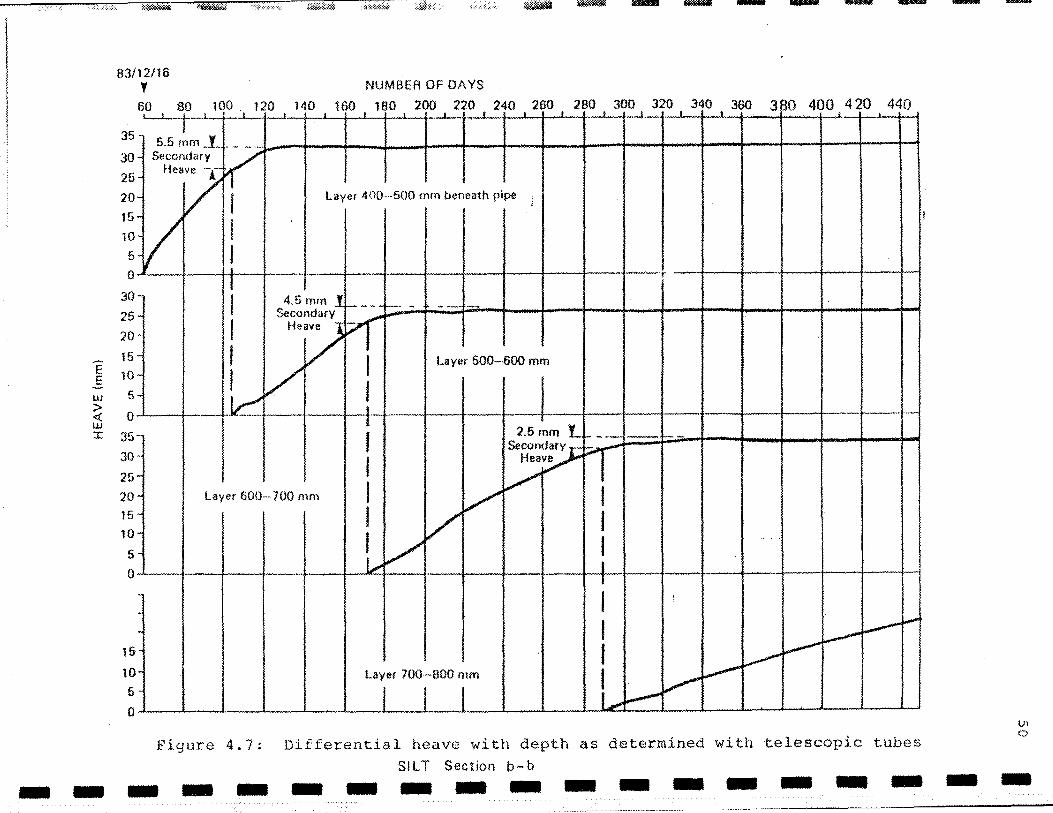
heaving with depth. Figure 4.7 shows the heave by layer as
measured by each independent frost heave tube (the heave
displacement of the upper layers which results from heave of
I I I I I I I I I I I I I I I I I I I
200
I I 150
E E
I w > -< 100 w I 1-
I U)
0 a:: u.
50
I I E
0 E z 0 200
I I 1-<:( 400 a: 1-I w 600 z
•• w c.. 1- 800 t/'1 0 ~ 1000
•• I I I I I I I I ~ I I I
49
Sand (A-A) _ .-......- --- ............ ..-. _.,......._....,......_
-- ......................... __... .........
50 100 150 200 250 300 350 400 4! DURATION (Daysl \
" 0° C Isotherm
"· --:----~~:::::_ __ ~----~S~ilt~(~B:-!8~)--------------~C Isotherm 'Sand {A-A}
.......... -.......? bottom of pit
Figure 4.6: Frost heave and frost penetration beneath
the Caen pipeline.
-E E
UJ
> <:{ UJ
83/12/16 Y NUMBER OF DAYS
60 80 100 120 140 160 lBO 200 220 240 260 280 300 320 340 360 380 400 4 20 440 L........l.....-t _I .I I t
35
30
25 20
15
10
5
0
30
t~
25 20
15
10 ~
,~ 5
0
I I I • 5.5 mm...!. __
Sooonda'y v~ Heave -.. -
Vr layer 400---500 rnm beneath pipe i
v I I t -.. ............ -.,.. ·-· f I 4.5mm 1 f- -- -·- --· I
Secondary rr Heave ~
I vv I Layer 500-600 mm
l I I -~ 1._ !--· I
I I ....J.. t
·r
----· --:r 35 2.6mm I. - I -- f---
Secon~ 30
25 :w Hi
10
5
0
15
10
5 0
-~ I I Heave
v layer 600--700 mm I v I
I v I f v I (..... I . ·- I
I I ~
:..,....
I ~ ~
~ layer :100--800 mm L v ~ I I I ~
Figure 4.7; Differential heave with depth as determined with telescopic tubes
SILT Section b-b ------------------1;1 0
-
the lowermost layer has been neglected by only comparing the
changes in the distance between adjacent tubes). The heave
of an individual tube begins shortly after the frost line
passes beneath the top of the tube (see section 3.3.2). As
~he freezing front descends over time, heave occurs at
prosressively greater depths and heave is detected in the
next frost heave tube. The rate of heave shown by
individual tubes and from tube to tube declines with time as
discussed above.
A notable featu·re of Figure 4. 7 is the occurrence of
simultaneous differential heave within adjacent soil layers.
For instance, the 400 to 500mm layer shown on the figure
begins heaving on about day 60, indicating that the freezing
front has passed some aistance below 400mm beneath the pipe.
This layer continues to heave until about day 123 when it
levels out after a total displacement of 32mm. Evidence of
simultaneous differential heave is indicated on day 103 when
the 500 to 600mm layer begins to heave. Between day 103 and
aay 123, the 500 to 600mm layer and the 400 to soomm layer
both. undergo heave displacement. In this case, the total
heave measured at the surface is made up of heave in both
layers occurring simultaneously. The heave in the 400 to
soomm layer must be occurring within entirely frozen ground
since the frost front is in the vicinity of the 500 to 600mm
layer d~ring this period. Undoubtedly some of this heave is
the result of pore water expansion as the unfrozen water
behind t~e frost front progressively freezes. However,
52
given the porosity of the soil and the freezing
characteristic curve, heave resulting from insitu freezing
accounts for less than 10% of the total.
Evidence of this 'secondary' heaving in the silt can be
sean, at some time 1 in all the layers below JOOmm beneath
the pipe. sec,ondary heave measured with the heave tubes has
accounted for about 16% of the total heave in the silt shown
on Figure 4.7. For the most part, the secondary heave only
occurs in two adjacent heave tubes, suggesting that the
heave is confined to a zone less that lOcm thick, adjacent
to the plane of primary ice segregation. Observations of
the thermal gradients beneath the pipe in the vicinity of
the tubes suggest that the secondary heave probably occurs 0 0
at temperatures between -0.4 C and -0.1 c.
4.4.3 Frost heave in the sand
The total heave with time of the sand beneath the axis
of the pipeline has been determined in a similar manner to
the silt. Figure 4.6 shows the total heave and the 0
penetration of the 0 c isotherm at section A-A. Reflecting
the less frost susceptible nature of the sand, the heave is
significantly less than for the silt. The components of the
heave have been estimated for the sand, using the thermal
data and the freezing characteristic curve for the soil
(Figure 3.7). overall, heave as a result of pore water
expansion accounts for nearly 100% of the observed heave.
No segregational heave is indicated.
4.5 Deformation of Pipeline
The design of the experiment has meant that the
pipeline is essentially unrestrained except by the forces
exerted on it by the surrounding soil materials. When the
soil beneath the pipeline began to heave at the start of the
freezer period, vertical displacement of the pipeline
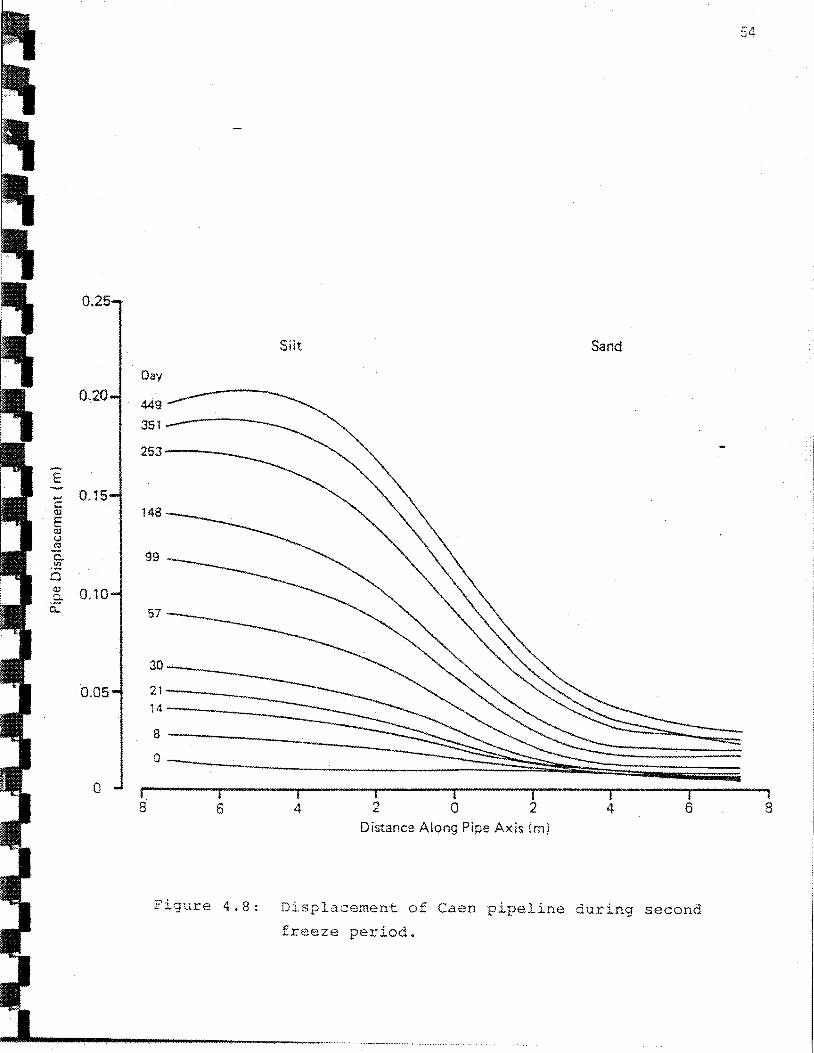
resulted. Figure 4.8 shows the heave along the axis of the
pipeline as determined by leveling of the vertical rods.
As a result of the greater magnitude of heave in the silt,
and the restraint of the frozen sand surro~nding the
pipeliner the vertical displacement of the pipeline is
substantially reduced in the transition zone between the two
soils.
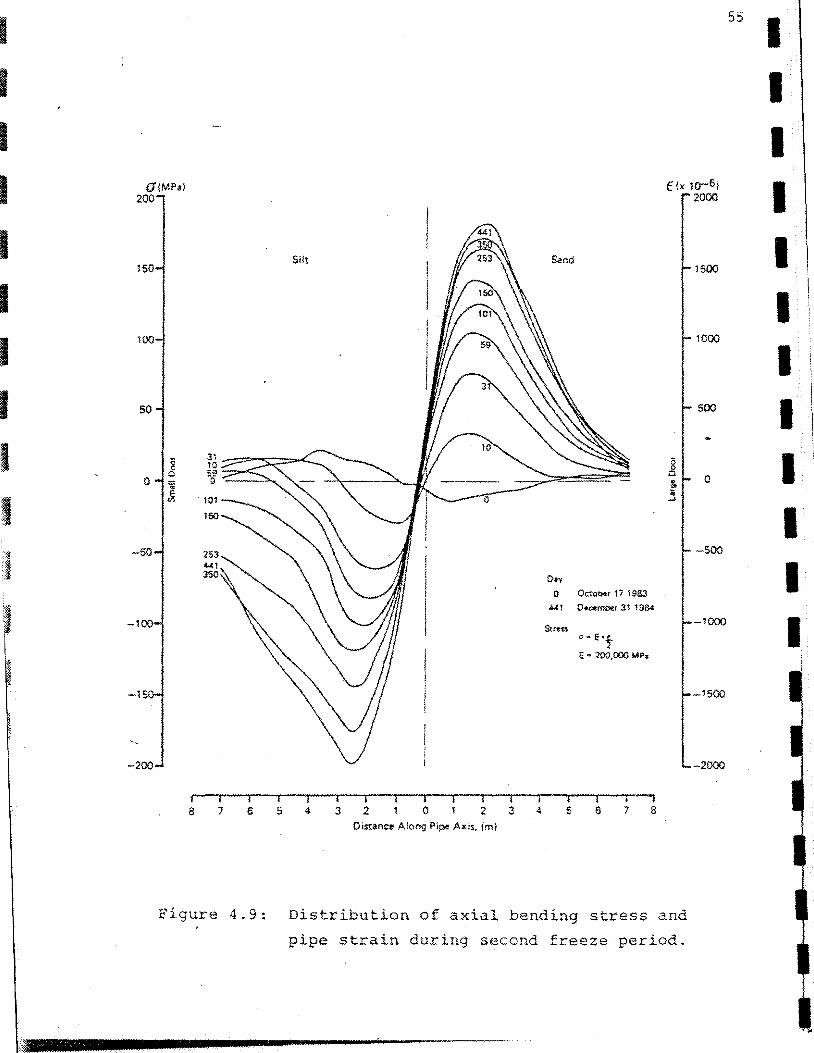
The deformation of the pipeline has resulted in the
build up of large bending stresses in the transition zone.
Figure 4.9 shows the build up of pipe stress during the
freeze period as determ-ined from strain gauge measurements.
A maximum stress in the order of 200MPa is indicated¥ with
the elastic limit of the pipe steel being approximately
240MPa. The deformation or maximum elongation of the pipe
was about 0.2% ..
4.6 Pipe-soil Interactions
The driving force causing the frost heave at Caen is
being generated within the soil mas.~ beneath the pipeline.
These forces are transferred to the pipeline where the
differential components of heave and the restraiQt of the
surrounding soil materials result in the build up of pipe
I I I I I I I I I I I I I I I I I I I
-- ----------------------------------··········-···--------------------------··-················--------------·--··-· --------------------------------
0.25
0.20
-E - 0.15 c:: <l)
E w u
..:! 0.. -~ c ¢! 0.10 a.
0..
0.05
0
Day
449
351
253
148
99
57
30
21 14
8
0
8 6
Figure 4.8:
Silt Sand
4 2 0 2 4 6 Distance Along Pipe Axis (m)
splacement of Caen pipeline during second
freeze period.
54
8
I I I I I I I I I I •.
I <·' ,.
·>
t: :~ ,,
.,
CJiMPal Elx w-6i 200
-15
Slit
g c .. ~ l01
l50
253 4-4:1 350
I I I I I a 7 e s 4
I I 3 2
t 0
I t I 2 3 4
Distanc!' Along Pi~ Axis, im)
Sand
8 0
!l. ;;; _,
D•v 0 O~r 171983
.Ul O•aemlxr 311984
Sw:u o .. E•t E o 200,000 MPo
t I 1 5 6 7 8
~'igure 4 . 9 : Distribution of axial bending stress and
pipe strain during second freeze period.
2000
1500
1000
500
0
-500
-1000
-1500
-2000
55
I I I I I I I I I I I I
56
stress. In turn, the stress built up in the pipe tends to
counteract the heaving forces and in effect attempts to
limit heave displacement. A change in the stress
distribution in the soil mass around the pipeline results.
As long as the pipeline remains in the elastic domain,
an estimate of the soil reactions can be obtained from the
deformation of the pipeline by taking the second
differential of the deflection line (Ladanyi and Lemaire~
1984} • If the soil reaction is said to be W then w(x) can
be determined as follows:
where;
w(x) = - EI £ n c
It is the second differential of the pipe
strain,
E is Young's modulus of pipe steel (210GPa)~
I is the moment of inertia of pipe section -5 4
(3xlO m ) , and
c is the distance to the neutral axis of the
pipeline {136.5mm).
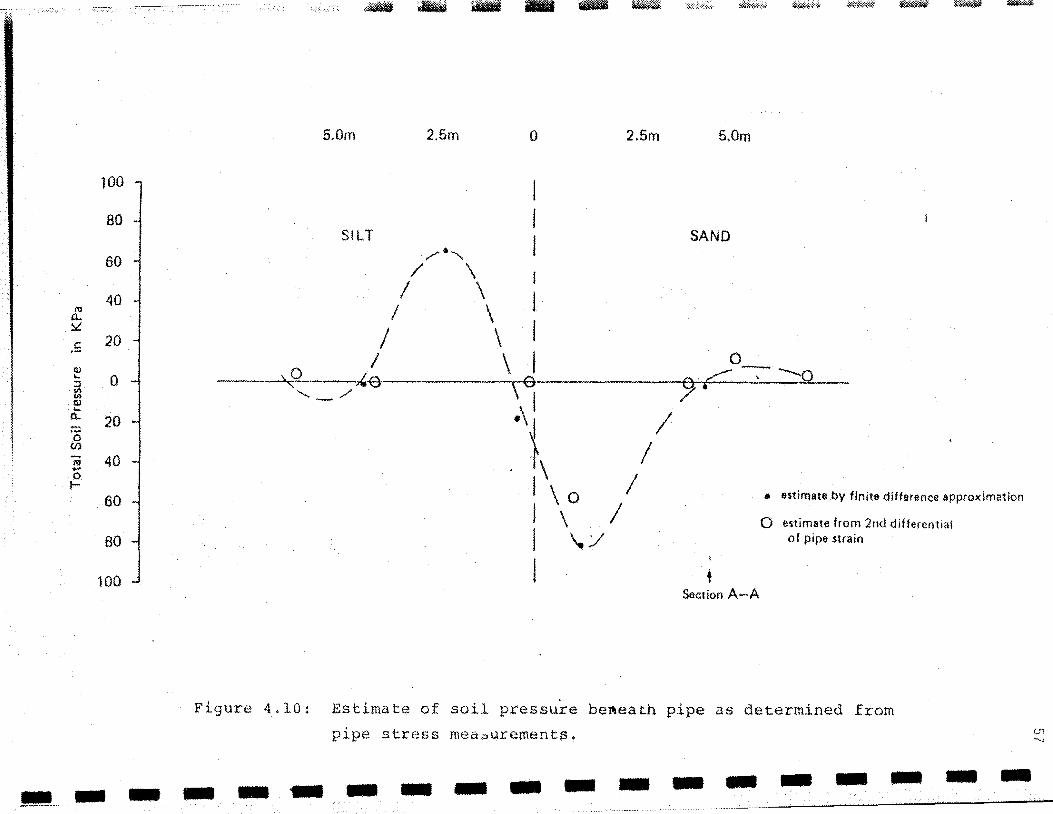
Figure 4.10 shows an estimate of the soil pressure
immediately adjacent to the pipeline if the load imposed on
the pipe is assumed to be applied uniformly across a 273mm
wide trench. The second differential of .... . s~-raJ.n has been
estimated from the strain gauge data by the finite
difference approximation (see Bowes, 1985) with
interpolation between data points.
The figure should only be considered as a rough
100
80
60
40 0:1 ll. ~
.S 20
¢) \.0 ... 0 :l <II ' U> ......... Ql ..... 0. 20 ·-0 Ul - 40 0:1 .., ()
1-60
80
100
Figure 4.10:
5.0m 2.5m
SILT
......... "" / \
I \ I \
I \ I \
4o _/
-0 2.5m
I
l I I
\e I
•\ I l, 1\o I \ I I './ I
5.0m
SAND
0 eC::::::::
•
' ........_,0
• estimate by finite difference approxlmution
0 estimate from 2nd differential of pipe strain
Section A-A
~ ~ as determined from Estimate of soil pressure be•eath p'pe
pipe stress ~ea~urements.
~----~-------------
58
estimate; ·however it clearly shows a region of high positive
pressure close to the axis in the silt and a region of his:~
negative pressure close to the axis in the sand. In
essence, the surcharge of the sand· above the pipe and the
strength of the frozen sand are sufficient to conteract the
heaving force generated in the silt (the area under each
of the curves being roughly equal). Pressures near the end
of the pipe in the sand and the silt are significantly
reduced. For instance at sections A-A and B-B, loc~ted
about 4 metres from the transition between the two soils,
the pipe-soil interactions have a negligible effect on soil
pressure. Preliminary modeling of the pipe-soil
interactions and the stresses generated by the deformation
of the pipe has been undertaken by Lemaire (1983).
The Glotzl cells buried beneath the pipeline measure
total vertical stress in the soils and it would be expected
that they would be affected by the pressures generated by
the deformation of the pipeline. Unfortunately the cells
were not located in the zones close to the transition and
for the most part they do not show the magnitude of soil
pressures indicated by Figure 4.l0. However, the trend in
the pressure of the cells when they are buried in unfrozen
soil is similar to that shown (see Geotechnical Science
Labs, 1983a).
4.7 Failure of Soil Around the Pipeline
Observations at the surface have revealed several
fissured zones which run along the axis of the pipeline
.,:1 '[~
::.:.~ ::.1·
.:::~ ·-;·
·.·.1 :t··
;.1 ;ij~
:1 ~· ~:-·=t
··I :::
·:1 ::~: ;.
·::
I I ··I~ :ii
I I ;':1· ·;:;.J' ........
,:l:f .}
·~·· ~r ·.,.
:,1:·· :~:. ·:::.
~~
·:1 t
:.1:· :~: ....
59
offset from the centre line of the pipe. In addition, a
large vertical crack has formed along the centre lL . ...: of the
pipeline at several locations. Comparison of the heave of
the soil along the axis and heave of the pipe show that the
pipe has heaved more than the surface of the soil in theSi2 i:
areas.
The location of these areas of failure of the soil
above the pipeline can be related to the stress distribution
in the soil indicated by Figure 4.10. In nearl~ all cases
the failure occurs in regions where the soil encounters a
negative pressure. In other words, in areas where the
pipeline is trying to cut through the overlying soil.
4.8 Internal Frost Heave Pressure
Investigation of the evolution of total s~ress in the
soils around the pipeline as determined by the Glotzl cells,
has revealed a characteristic freezing behavior. Figure
4.11, shows the total vertical stress with depth as measured
with three cells buried beneath the pipe at section A-A in
the sand. The changes in stress shown in the figure seem to
result from the soil freezing process and not from any
vertical pressures induced by the bending of the pipeline.
For section A-A, examination of Figure 4.10 shows ~hat the
soil beneath the pipeline is in an area of negligible
positive pressure. This means that the bending of the pipe
actually has very little effect on soil pressure.
The behavior of the Glotzl cells in Figure 4.11 is
typical of most of the cells in the sand and in the silt.
.·:::"'1111. ----------------
I I I I I I I I I I I I I I I I I I I
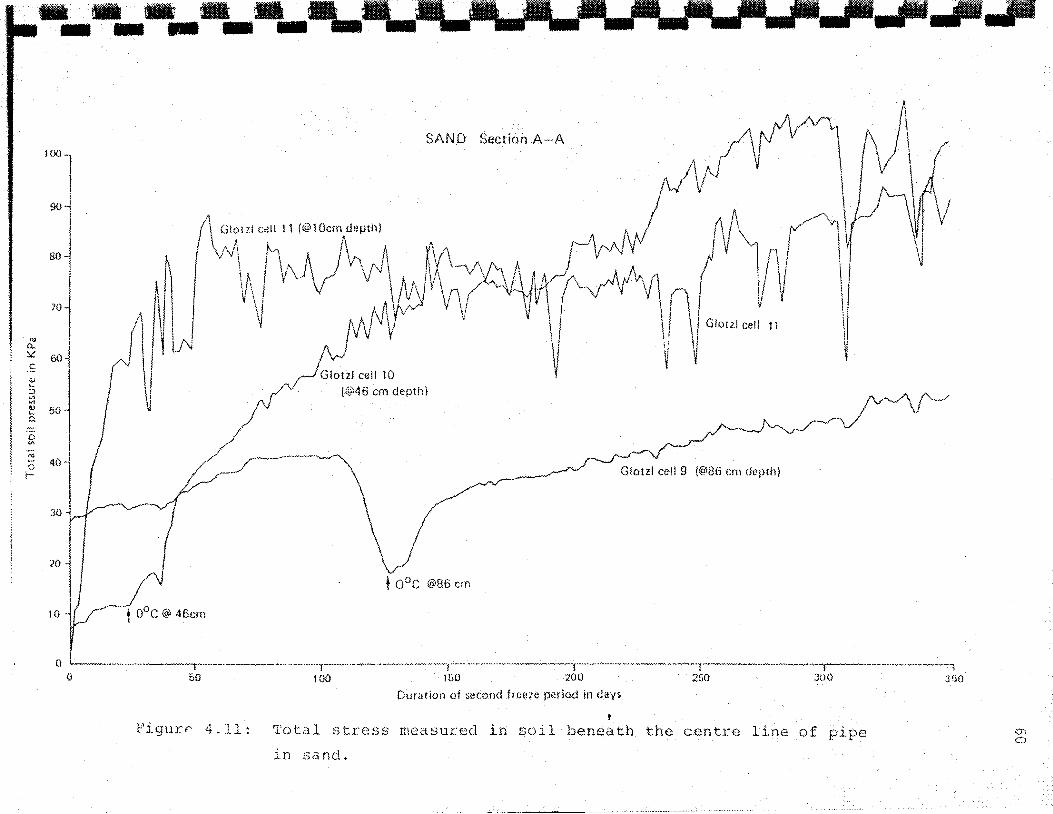
.£ ~ ;, Ul
'"
100
90·
80
~ 50 Q
SAND Section A-A
o~-········-·····-----.-·-······----·-···············-··--·---·------,---·-········-·-··--~~-,-·······-----------,-----·····--··---~--··-----·----~ 0 50 100 lbO 250 3f.i0
Duration of second freeze period indays
t Figur~~ 4.11: Total stress measured in soil beneath the centre line of pipe
in sand.
cr-. 0
I I
I
61
At the start of freezing, each of the cells is in unfrozen
soil and the pressuLe is roughly equal to the weight of the
overburden above the cells. As the freezing proceeds the
cell closest to the pipe (cell #11) becomes incorporated
into the annulus of frozen soil forming around the pipe and
the pressure rises rapidly. The pressure in the lower cells
is unaffected, until the freezing front penetrates further
beneath the pipe. In cell #10 for instancer the pressure is 0
relatively stab~~ until day 25 when the o c isotherm passes
beneath the cell and the cell becomes incorporated into the
frozen soil. The pressure then rises rapidly in a similar
manner to cell #11.
Glotzl cell #9 behaves somewhat differently than the
other cells. At first the pressure is unaffected by the
freezing process and the pressure rises gradually from 30 to
40 KPa, possibly in response to small bending stresses in the 0
pipeline. Although the exact location of the 0 C isotherm
is difficult to determine, as it approaches the vicinity of
the cell at about day 110, the pressure falls possibly
indicating sicati.on beneath the freezing front ..
Subsequently, the pressure begins to rise again but at a
slower rate than the other cells.
Earth pressure cells buried beneath the pipe in the
silt show similar stress build up related to soil freezing
(see Figure 4.12). Pressures measured in the silt are
somewhat lower however, possibly as a result of the warmer
soil temperatures and less frost penetration.
I I I I I I a:. I
I :
I ' I
: I l I
• • I ;
I I 1.
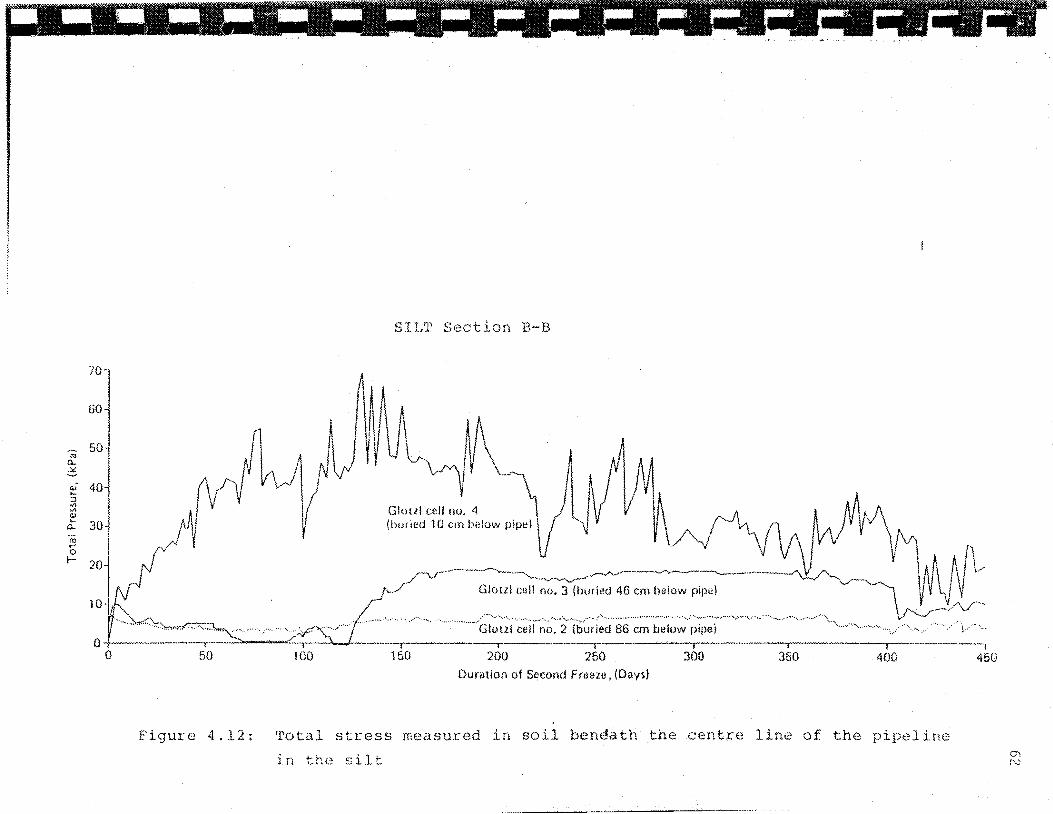
"' a.. .:!(.
701 60
50-l
~ 40 ::::1 ., "" CJ ...
a.. ·.;; ~
0
t- 20
l 2: · ure 4._ Flg
· , B-B SectlOI, SILT -
. soil f''1sured l.n ---ress m~c 'l'otal s ...
..... , silt in ~.-n~:~
bem!ath the
400
P ipeline line of the . centre
I I I I ·1·.:~ :~-
1 I I I •I~ :·
I I i
5.1 General
CHAPTER V
FROST HEAVE TESTING
Laboratory frost heave tests have been performed on the
Caen soils to characterize their heaving behavior, as a
basis for prediction of heave at Caen. over 50 tests have
be~\ carried out, mostly at the Geotechnical Science
Laboratories, Carleton University. Data from additional
testing undertaken at the Laboratoire Regional des Pants et
Chauss~es de Nancy, the Department of Civil Engineering,
University of Aston and Hardy Associates (1978) Ltd. are
also included.
During analysis of the frost heave tests a number of
different
heaving
parameters were evaluated to give an over.;iev: of
behavior. Heaving conditions during the various
stages of each test have been examined in terms
i) the frost penetration rate (X) vs the
rate {H},
O F• ~ .
frost heave
ii) the ratio between heave rate and the frost index
(Aguirre-Puente et al, 1974) 1 and
iii) total heave and average total heave rate.
The temperature gradient and heave rate at the initiation of
the final ice lens have been determined for each test. From
these data the segregation potential (SP) has been
calculated according to the procedure outlined by Konrad and
I I I I I I I I I I I I I I I I I I I
i ~ •• •• •• ~ •• •• •• •• ·I ' I I I I I
64
Morgenstern, (1981).
A-- summary of each of test results . d' .. 1n 1cat1ng
particulars of individual test conditions and some of the
derived frost heave parameters is given in Table 5.1. The
following sections discuss some of the details of the test
program, the general behavior of the soils during frost
heave testing and some of the conditions which were found to
influence heave behavior of the silt.
5.2 Test Program and Apparatus
5.2.1 Carleton University frost heave testing
The frost heave cell used at Carleton is a modified
version of a Northern Engineering Service design 1 loaned by
Ecole Polytechnique in Montreal. The cell accommodates
cylindrical soil samples llOmm long by l02mm in di.-1.metre
(Figure 5. l) . Most samples were prepared by consolidation
in the test cell from a 50 percent soil-water slurry •
Consolidation was carried out by step loading until primary
consolidation was completed and the desired test density was
achieved. Several tests were also carried out on samples
compacted manually in the cell using a modified Proctor type
method.
After sample preparation, the test cell was cooled (to
warm side temp.) in a temperature controlled chamber to
achieve isothermal conditions. The permeability tests were
normally carried out during this stage. Temperatures during
the tests were maintained by heat exchange plates (cooled by
circulating baths) located at the ends of the sample.
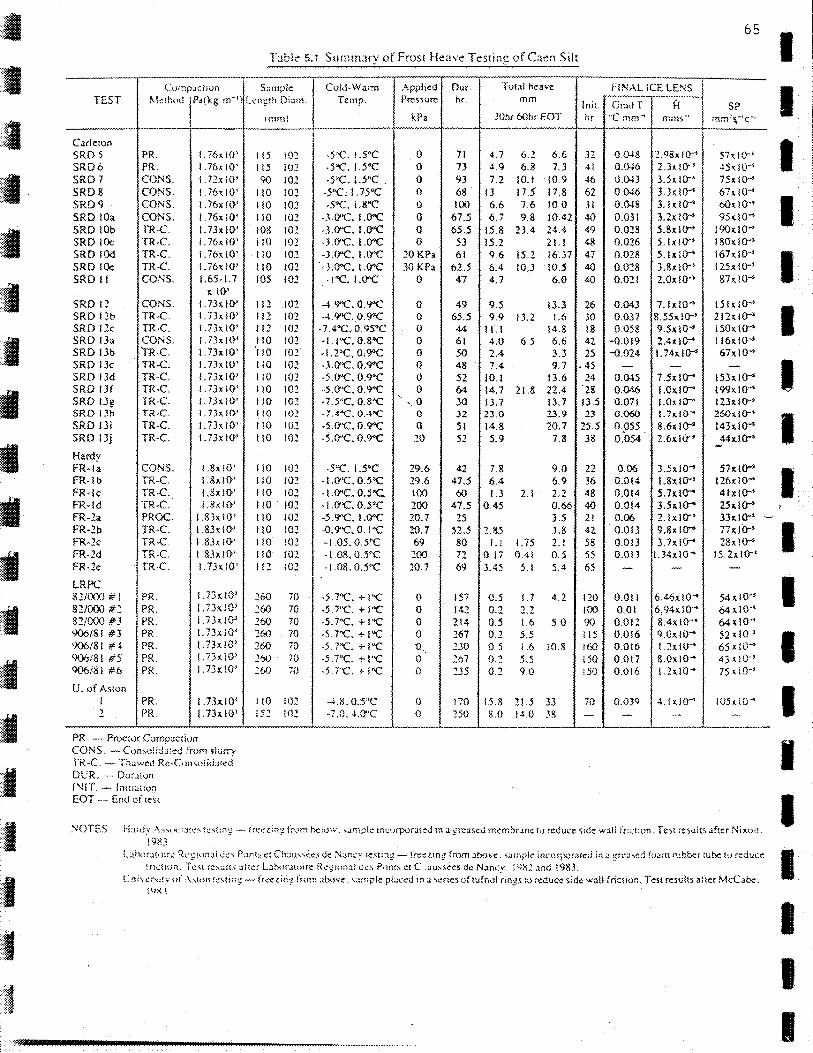
. I
··.·-<·
. .:I:
·.1" ::'
::~:~ .}
::it •
•_: .. :g
·.jl
·!· 'I f!:
65
TJb!e 5.1 Summary of Frost Heave Testing of Caen Silt
-------------------------------------------------------~------·--r---......,..--....,----------.---------------........,--... __ _ f'!NAL !-~-~LENS I
!nit. Cr~d T l H l
C:.J<np~ctivn
TEST ,O..kth~:~! r~(l<g. m''.
C.lr!ClQfl SRD 5 PR. !.76:<;i0' SRD6 PR. l.76x: !0' SRD 7 CONS. !.72.\ ;o• SRDS CONS. !.76.d0' SRDI} CONS. L76:d0' SRD lOa CONS. !. 76x 10' SRD !Ob TR-C. L 73xl0' SRD We TR-C. ! . 76~ !0' SRD !Od. TR-C. !.76:d0' SRD !Oe TR-C. ! • 76x.l0' SRD II CONS. !.65- 1.7
:r. ifY SRD 12 CONS. L 73~ 10' SRD l.:!b TR-C. !. 73~ !0' SRD 12c TR-C. ! . 73.<: !0' SRD !Ja CONS. l.73x !0' SRD !Jb 'rR·C. !. 73~!0' SRD 1.3c TR..(.:. L 73x 10' SRD !3d TR-C. U3x:l0' SRD !Jf TR-C. LJJ.dO' SRD !Jg TR-C. l.lh !0' SRD !Jh TR-C. !.7hf(}'
SRD 13i TR-C. 1.73:<.10' SRD !Jj TR-C. ! . 7Jx 10'
Hardy FR-!a CONS. L8x:i0' FR-Ib TR-C. !.&x !0·' FR-lc TR-C. L&)(lO·' FR-Id TR-C. • U.hlO' FR-:!a PROC. 1 !.8J:d0' FR·lb TR-C !83x.l0-' FR-2c TR..C. f! .83x:l0·' FR-.:ld TR-C. . !.83xl0·' FR-2e TR-C. !.73)( !0'
I
LRPC ! &.YOW #! ~ PR. !. 73:<:!0' 8:!/000 #?. PR. l. 7Jx !0' 82!000 #J ! PR. l. 73.<:!(}'
906/8 I #J PR. L73xl0' 'XX>!S! #4 PR. !. 73.>: HP 'XX>/81 #5 PR. !. 73:<.!0' 906/81 #6 PR. l. 7Jx: !0'
U. of As!on l PR. !.73.x.l0' ! PR. !.7hiG'
PR. --- Pmcwr Cump~c:i.m CO:--<S.- Consoiichtcd fwm >lurry TR-C.- Thawed R~-Consoii<.i~te-d OUR. ---- Dur·1ton !'<IT. - !nniat<on EOT ---- End of :esr
!983
s~mplc
L\."n~th Di;.u11.
~lTIH1i
I I !5 102 11.5 lO]
90 iO:! 1!0 iO:! 110 !0:! t 1!0 !02 !OlS !Ol !!0 !01 1!0 tO.~
110 !{)1
105 102
I!::! !01 112 !02 112 102 1!0 !02 !fO !02 !tO 102 110 102 llO 10:! 1!0 !01 flO !1)2
llO W2 110 tO:!
!!0 10:! !10 !0~
1!0 !0::! 1!0 102 1!0 !0:! llO !0:! !!0 !02 !!0 !i.E I !2 t02
260 70 260 70 !60 70 260 70 160 70 260 70 :!60 ~'I
"'
i 10 iO.:! !52 !<1~
Va.;m
?
Cold-\ Tem
....
-5"C.! -5"C. I -5"C. I ·5"C. L
.5'C
.5"C
.5"C 75"C .&"C -5"C. i
·-' t)''C, .J O''C. .J .O''C. -HY'C. ->.O"C. ·I"C.l
-4 9"'C, --l.9"C.
. O''C
.O''C
.O''C
.O''C I.O"C .ere
0.9''C 0.9<'C
• 7 .4"C. 0 9s•c 0.8"C 0.90<: 0.9"<: 0.9"C 0.9''C 0.8"C 0.4"C 0.9"C' 0.9"C
·I.! "C. -1.2"C. .J.O''C. -5.0"C. -5.0''C. -7.5"C, -7.-1~,
-5.0''C. -s.O'·C.
-5"C. I ·I .O''C. ·I.O''C. ·I.O''C. -5.9''C. ...0.9'-c.
.s•c 0.5"C 0.5"C. osc I .O"C O.i''C
·105. 0 5"C .'SOC 5"C
-1 illl.O -1.08. 0
·5.7"C. -5. /''C. -5. 7"C. -5. 7''C. -5.7"C. -5 T'C. ·5.7"C.
+ + + + + + l-
!"C l''C !"C l"C !"C I"C l"C
Applied Pre$sure
kPa
0 0 0 0 0 0 0 0
20K?a 30 KPa
0
0 0 0 0 0 0 0 0
' '· 0 0 0 :!0
29.6 29.6 !00 200 20.7 20.7 69 200 .::o. 7
0 0 0 0 1.}
0 0
-Ul.O. YC 0
11 73 93 6& 100
67.5 65 . .5
53 6!
62~5
47
49 65.5 44 61 50 48 52 64 JO 32 51 52
42 47.5 60
47 . .5 25
52.5 80 72 69
!57 142 2!4 267 2JO 267 235
170
Tol:tl heav.: mm
30ht 60hr EOT
4.7 6.2 6.6 4.9 6.8 7.3 7.2 !0.! 10.9
IJ 17.5 17.8 6.6 7.6 100 6.7 9.8 !0.42
15.8 23.4 24.4 !5.2 21.! 9.6 !5.2. !6.37 6.4 !O.J !0.5 4.7 6.0
9.5 13.3 9.9 13.2 !.6
ILl !4.8 4.0 6.6 2.4 3.3 7.4 9.7
10.1 !3.6 !4.7 2!.8 22.4 !3.7 !3.7 23.0 13.9 14.8 20.7 5.9 7.8
7.8 9.0 6.4 6.9 l.3 2.1 2.2
0.45 0.66 3.5
?..85 J.8 I.! 1.75 2.1
0 !7 0.4! 0.5 3.45 5. I 5.4
0.5 1.7 4.2 0.2 2.2 0.5 1.6 5.0 0.2 5.5 0.5 ! .6 !0.8 0.1 5.5 02 9.0
!5.8 2!.5 33
hr. "C mm~ rnms·· I
J2 () .0-18 l. 98x 10"' 41 0.0-16 2.}d0'' 46 0.04) 3.5~ IQ-' 62 0.0-16 J.JdQ-' .H 0.0-!S ]. !~I<T' 40 0.031 3.2:<:10""' 49 0.028 5.Sx:io-' 48 0.026 5.!x!tr' 47 0.028 5.1xlo-< 40 0.018 }.8~ !(}-' 40 0.0:21 2.0~1o·•
26 0.043 7.1~10"'
30 0.037 8.55~1()-'
!8 0.058 9.5xl0'' 42 -0.019 2.4~10"-'
25 -o.024 L 74~!o-" . 45 - -
24 0.045 7 .5x lo--' zg 0.04-6 1.0;~~; lo-'
!3.5 0.071 1.0~ !()•
13 0.060 !.7.d0~
25.5 0.,055 8.6;~. to--38 0.054 2.6.x.!if'
22 0.06 3 .. 'h!O..,. 36 0.0!4 L8xlo-" 48 0.014 5.hl<T" 4IJ 0.014 3.5~t!<r" 2! 0.06 2. !.x.IO'"' 42 0.013 9.8~10"'"
58 0.0!3 3.7.\!0"'" 55 O.OU 1.34.\10~
65 - -
!20 0.011 6.46.t.!O .. !00 0.01 6;'14d0""' 90 0.0!1 8.4l(IO··• ll!) 0.0!6 9.0~10-
160 0.016 I 21. to-' !50 0.017 8.0;.;10 ... !50 0.016 !.2xl0~
70 0.03Q
- --Hl.4. _l~-~~0""' !50 8.0 !4.0 38 cr·c o _ _____t ______ L-._.J...... _____ ....__, __ _
SP rnm.::~-~c-:
5h!(T' .:5~ JO·' 75~!0""'
6hl0"' 60x 1(}-' 95:<..10 ...
!9(h!O"' l80dQ-' 167.. !0'' 125~!Q-' 87.\!0 ...
!.Six 10-' 2!2x!D-' l50xi<T' 116x!O·' 67x!O ..
-153;~.!0-s
t99xiO-• !ZJx!Q-' 260xto-• 143;~.!0~
44;~.10""' -57 dO""'
126x!O ... 41:>:1(}--' 25;~.!0""'
J.J,:J o-• 77:1(1()-' 28xHr'
15.2.d(}-' -
54~10""' 64xiO·• 64~1o·•
52x!O' 65x !0 ... 43 X JQ·<
75 ~ to·•
!05d0"'
-
L:.!hdr::.t{o.):rc R:.:~!dn:;l J::-; P~H1!:i er Ch:::u~"~cs d~ N:uKy fe . .;,tin,;!- frt:t":l.ing f:1.1m .1t.v..n:t". '\:Hnpk lncorporari!d in.J gr-I..":L·,cd fo,3;n rubber tube: hJ reduc~ fnctHH1. T(!'.t r:;;..ulr:; :Jr'tcr L:.:bor .. HoJre R~~t<m.J.l U~s Pdnf;..ct C .:..~u:-.~~es dr.: N.ln~v. j'-)~2 ~nd :9SJ.
L' ni>t'r"t'· n( .-\,ton t'"lin~- (r<::-<:zin2 (rum -<~>w. '~mpk pbccJ in a >.:ries oftufn·.Jf ~in~s w xduce sid~ waH fric1ior.. Test results after McC.lbe. f'll( 1 . . -
I I I I I I I I I I I I I I I I I I I
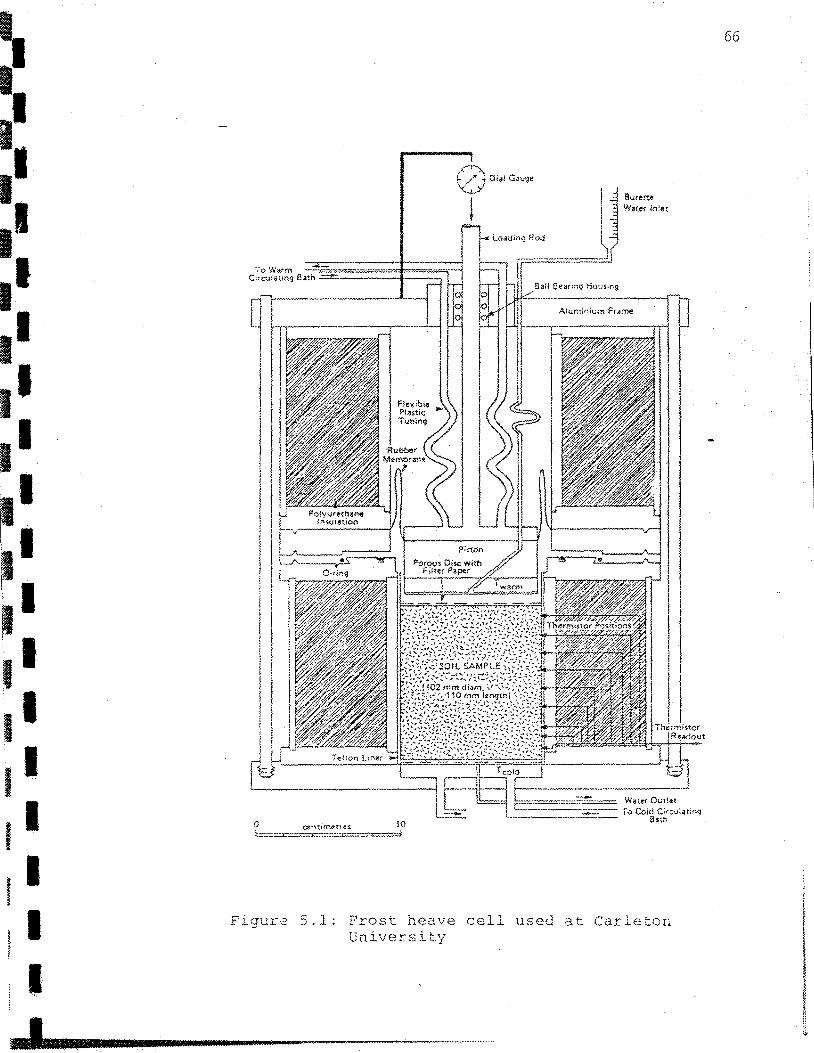
Figure 5.1:
.I
tlu<ene W~tor ln!et
Frost ve cell used at Carleton University
66
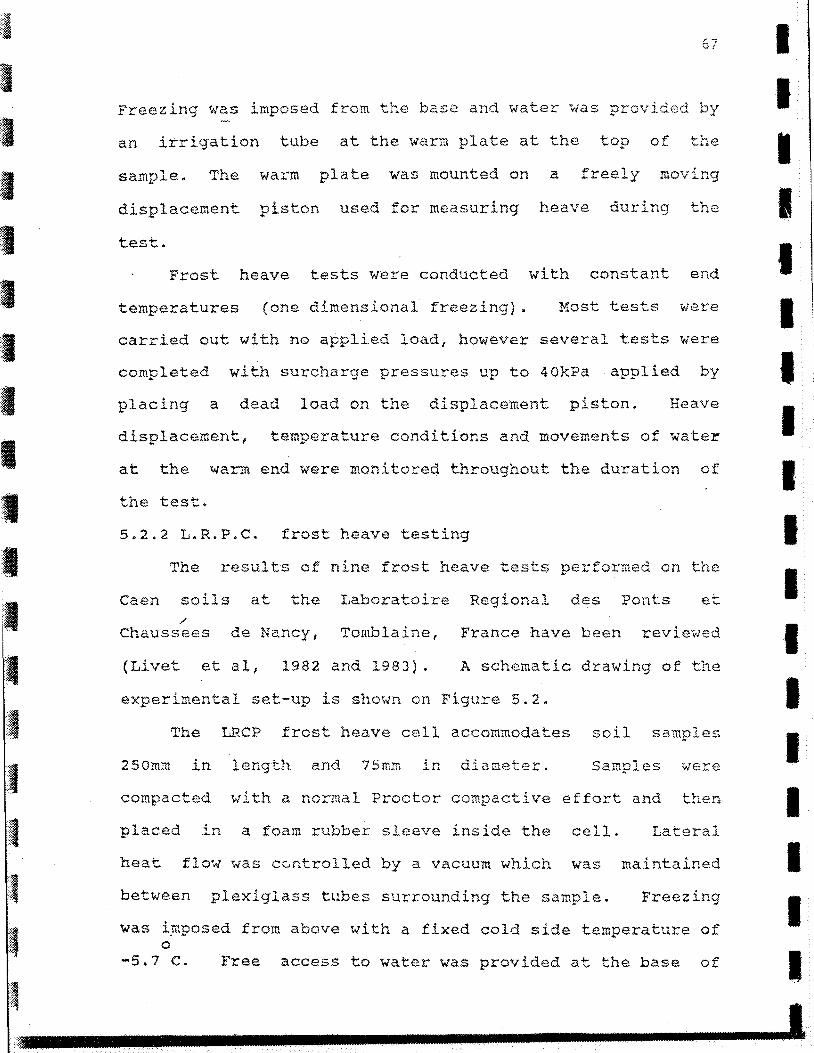
.,.~ :~·
':1 ~~~·
I 1·.·.· .,.
:=· I.
;. 'I;
I I I I I i· .. 1 ;;·.·
•.1:.•· ·.· :,:.
~~
•. ~ .11
··~ :~
~.·. ~~
·l. ·~
:··
.·~
Freezing \-las imposed from the base and water ~;as provided by
an irrigation tube at the warm plate at the top of the
sample. The warm plate was mounted on a freely moving
displacement piston used for measuring heave during the
test.
Frost heave tests were conducted with constant end
temperatures (one dimensional freezing) . Most tests were
carried out with no applied load{ however several tests were
completed with surcharge pressures up to 40kPa applied by
placing a dead load on the displacement piston. Heave
displacement, temperature conditions and movements of water
at the ~arm end were monitored throughout the duration of
the test.
5.2.2 L.R.P.C. frost heave testing
The results of nine frost heave performed on the
Caen soils at the I,aboratoire Regional des Pants /
Chaussees de Nancy, Tomblaine 1 France have been revievled
(Livet et al, 1982 and 1983). A schematic drawing of the
experimental set-up is shown on Figure 5.2.
The LRCP. frost heave cell accommodates soil samp s
250m:m in length and 75mm in diameter. Samples were
compacted
placed in
with a normal Proctor compactive effort and then
a foam rubber sleeve inside the cell. Lateral
heat flm.; was cc.,ntrolled by a vacuum which was maintained
between plexiglass tubes surrounding the sample. Freezing
was i~posed from above with a fixed cold side temperature of 0
-5.7 C. Free access to water was provided at the base of
I I I I I I I I I I I I I I I I I I I
...... -'Z
·-·-· ~-···· ·-........ -.
·--
,.-
68
I _··- ..... -'../
...... -~~ ~·~-,_-_~~~
Hardy Assoc.
Frost Heave Cell
(after Hardy Assoc. , 1983)
-- - ..-,a
.;.,=._ ~-=-.:_ __ =---= ---
""".rp-=-,::.;- --;:CPC Frost Frost Heave Cell
i.
,;- . ...Yil~oa;;. - · i I -- =:==? I - ::'""~:::::--:-~·:__! ______ ~
1::. 1~•tt,ll'er-,v..auor
'' T,..,"''(Q\ol~t
Ftgure 5.2
'--·
(after, Ltvet et al, 1982)
/ '0. ~ ,., .. ., t.
University of Aston
Frost Heave Cell
(after McCabe, pers. comm.)
Frost heave cells usej dunng testtng of silt.
0
the cell which was maintained at a temperature of 2 c.
5.2.3 Hardy Associates frost heave testing
69
Eight frost heave tests have been performed on the Caen
silt at the permafrost laboratories of Hardy Associates
(1978) Ltd., Calgary, Alberta {Hardy Associates (1978) Ltd,
1983) • The test cell used is similar in design and
operation to the one used at Carleton (see Figure 5.2).
Soil samples tested were llOmm in length and lOlmrn in
diameter. Tests were performed on samples consolidated from
a saturated soil slurry and en samples compacted in place
with a Proctor type compactive effort. Friction between the
walls of the cell and the sample was reduced by
encapsulating the sample in a greased rubber mentbrane.
Tests were performed with applied pressures from 20.7 to
200.1 k?a.
5.2.4 University of Aston frost heave testing
'I'WO frost heave tests were perfonr.ed on the Caen silt
at the laboratories of the Department of Civil Engineering 1
University of Aston in Birmingham 1 England (Mccabe, pers.
conuu.}. ..... Both tests were run in the Controlled Heave Unit
(CHU) which is a specially designed frost heave cell (Figure
5.2) (see McCabe and Kett1e, 1983).
Test samples were prepared by the standard technique
specified ..JY the Transport and Road Research Laboratory
(TRRL, 1977) • This involved manual compaction in a mould
(diameter 102~~) using a proctor type method. After
extr~sion, samples were trimmed to the specified sample

' '.:1: ~:i.
··.1'.' 3"
!I ;:::,
:~
'
"I •·.i
'
'I'. f
I
-' ··1·', ): ;::·
·-··
~~· ,.
•
=1'=' ..
:: ..
'I' 1~: ~ ~
I I
70
length {llOmm and 152mm), encapsulated in a rubber membrane
and placed inside 5 Tufnol rings designed to eliminate side
wall friction. Freezing was carried out from above with
fixed end temperatures and free access to water at the base.
5.2.5 Frost heave pressure testing
Several confined frost heave tests have been performed
on the Caen soils by J. Wood at the Geotechnical Science
Laboratories, Carleton University. These tests represent
part of a Doctoral study of the development of internal
stresses during frost heaving. Details of the test program
and instrumentation are given in Torrance and Wood (1983~
and Williams and Wood (1984 and 1985).
The frost heave cell has been specially designed to
measure internal stresses in a small sample (length 35mm X
54mm diam) at two different locations as one dimens~onal
freezing takes place. The cell allows accurate end
temperature contro1 1 continuous measurement of stress build
up and free access to water at the cold and warm ends (see
Figure 5.3).
5.3 Behavior of Caen Soils During One Dimensional Freezing
5.3.1 Caen ·silt
Frost heave tests performed on the caen silt at
Carleton University show a characteristic behavior. At the
start of the test, freezing is very rapid with a high frost
penetration and frost heave rate. Initially pore water is
expelled from the sample at t~e warm end. This phenomenon
has been observed in other experiments (N.R.C., 1984) and it
I I I I I I I I I I I I I I I I I I I
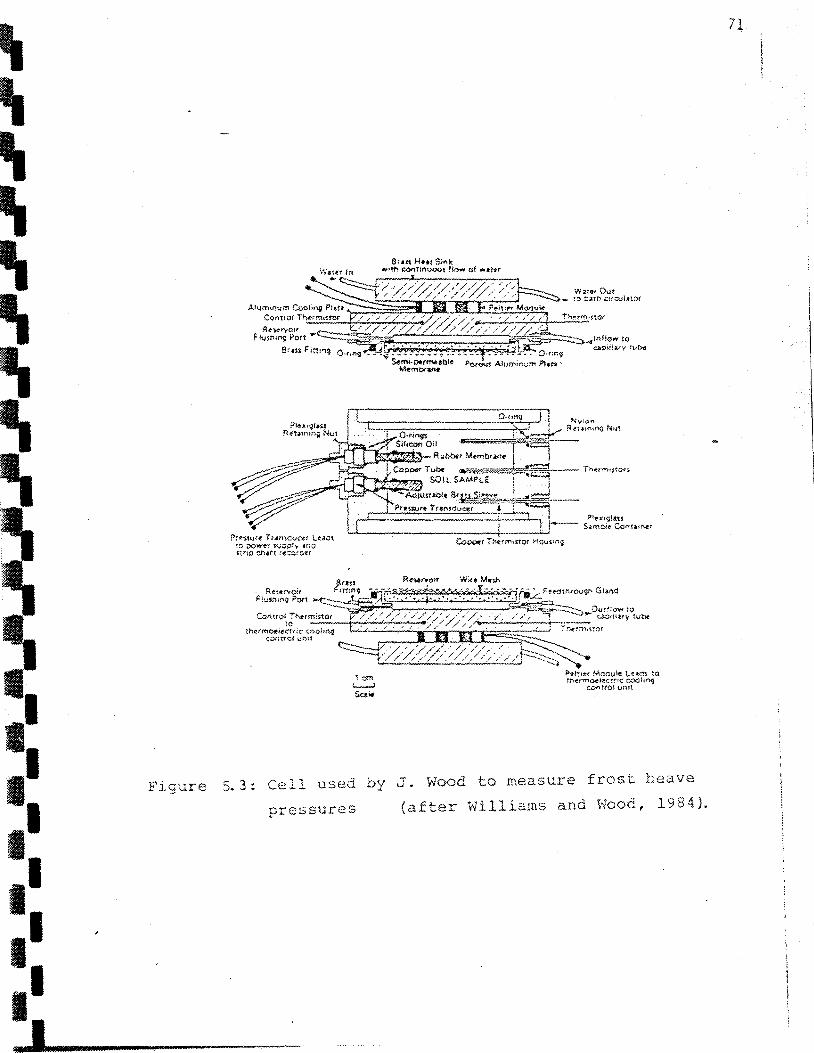
I
•• •• •• •• •• 1.1
Figure
::ie~Yyou·
F !<>stun~ l'o<t
Sr.au ~itt~.,~ O-r~M-9 ..... ~
Pr~ssu.re r:-ani.CUOH L~dC\ ro ;:>owt'r wop:.,. an-.:1 stt:t) Chirl. :eccrOi!!
s. 3: Cell used
pressures
by
. 0·""9 .P~Q'IJS A~umlnurn Pl•tt'
W~t!tt Out :., n.a-:n ;;u·CtJbtor
'r u • ~-load
(after
to measure frost
W i 11 iams and ~·Jood ,
71
heave
1984).
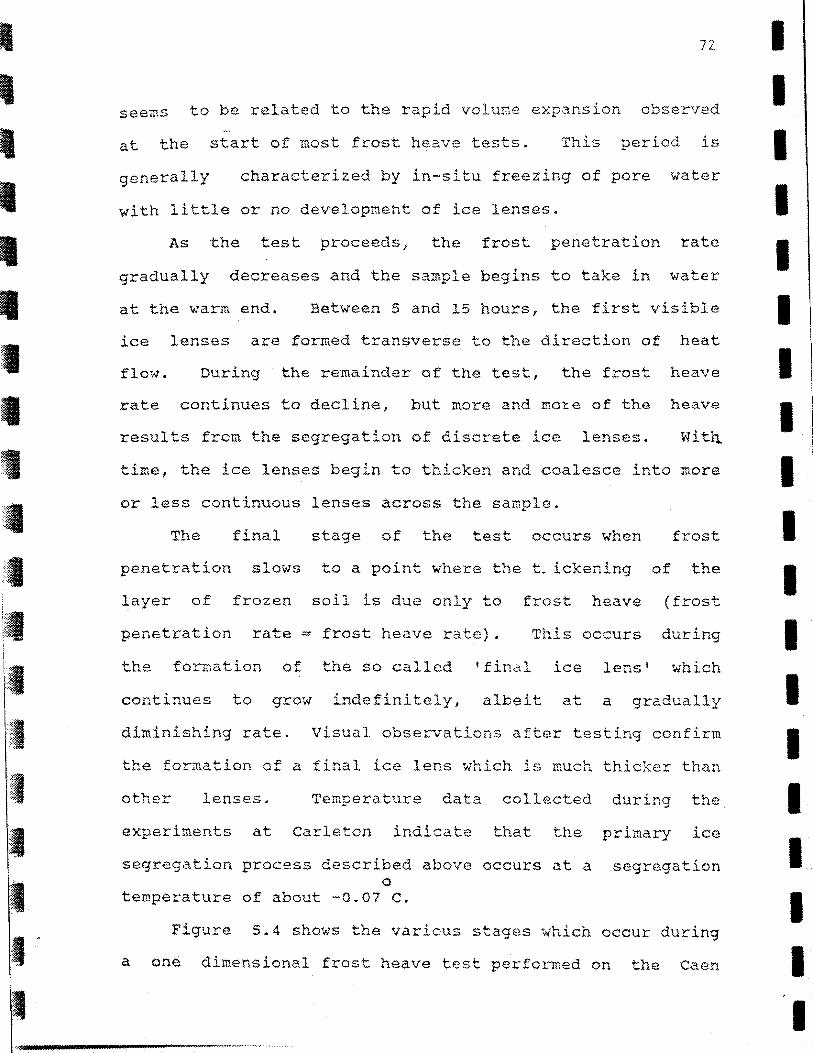
I
' ' I
-• :g
•.~1: :~·
:1
72.
seems to be related to the rapid volume expansion observed
at the start of most frost heave tests. This period is
generally characterized by in-situ freezing of pore water
with little or no development of ice lenses.
As the test proceeds, the frost penetration rate
gradually decreases and the sample begins to take . water ~n
at the warm end. Between 5 and 15 hours, the first visible
ice lenses are formed transverse to the direction of heat
flow. During the remainder of the test, the frost heave
rate continues to decline, but more and mo~e of the heave
results from the segregation of discrete ice lenses . Witi:l
time, the ice lenses begin to thicken and coalesce into more
or less continuous lenses across the sample.
The final stage of the test occurs when frost
penetration slows to a point where the t. ickening of the
layer of frozen soil is due only to frost heave (frost
penetration rate= frost heave rate). This occurs during
the. formation of the so called 'final ice lens' which
continues to grow indefinitely, albeit at a gradually
diminishing rate. Visual observations after testing confirm
the formation of a final ice lens which is much thicker than
other lenses. Temperature data collected during the
experiments at Carleton indicate that the primary ice
segregation process described above occurs at a segregation 0
temperature of about -0.07 c.
Figure 5.4 shows the various stages which occur during
a one dimensional frost heave test performed on the Caen
I I I I I
I I I I I I I I I I I I
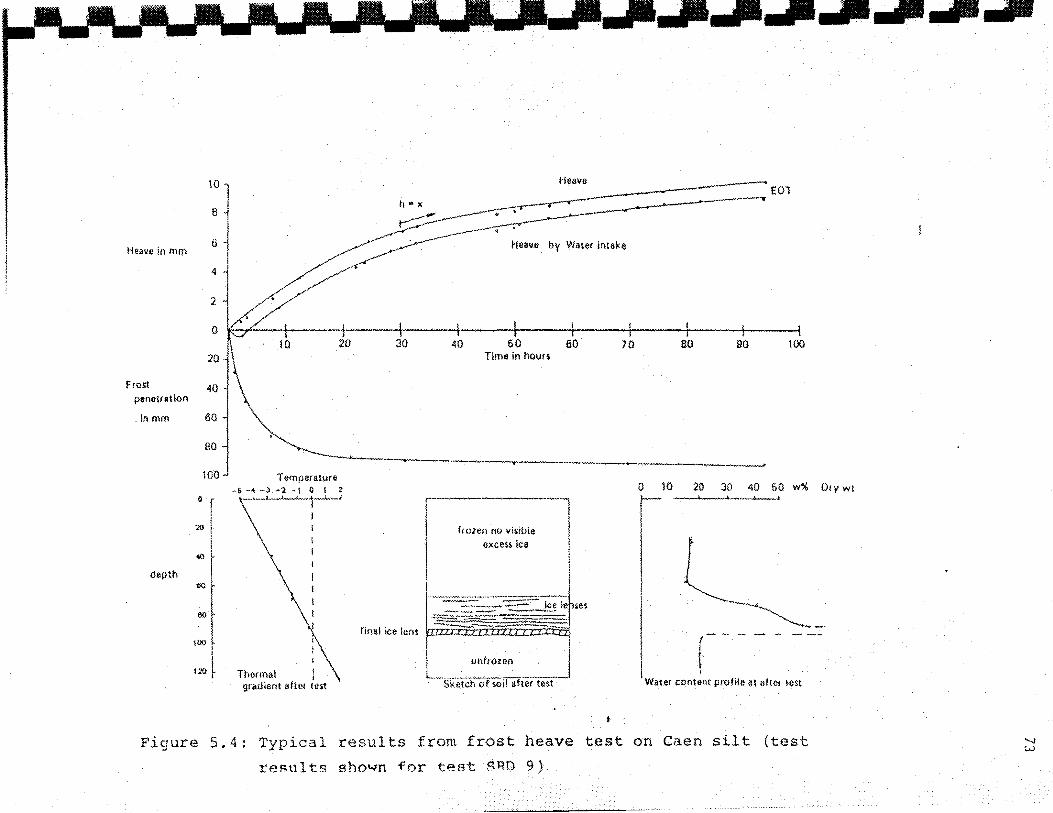
10
l3
Hea>Je in mm 6
4
2
0
20
frost penetration
.lnmm 60
80
100
depth
100 l
1:10 1-
tO 20
T emperatJ.Aru -o-~--l~l-·1 o 1 ~ _, __ ,___ I ;
I
Thermal I gradient after test
30 40 60 50 Time in hovrt
I '""""" ,. .. , .. l,,. I exces~ lea
! ----~~-~ -::=._- l<:e le ses - ·~ .
:a:z:r:ca~ fin11l ice lens
L ________ unlroz:_ ________ _l Sketch of soil shef test
70 80 llO 100
0 10 20 30 40 60 w% Dry wt
I I
. t I . , Water content prom~ at alter !est
Figure 5.4: Typical results from frost heave test on Caen silt (test
reBults sho~n for test SRD 9)
• • .
~.: .. ·· :::
··=·: ..
_::··
•
74
silt. The thermal gradient and a sketch of the sample after
testing are shown. The redistribution of water during the
test can be determined by the water content profile shmvn
beside the sample .
5.3.2 SNEC sand
The frost heave behavior of the sand is quite
different from the more frost susceptible silt. Given
similar temperature conditions during the test, the sand
undergoes much less heave . The initial stages of freezing
are characterized by rapid frost penetration rates: however
the heave rates are less. Unlike the silt, no expulsion Qt
water was obserV"ed from the unfrozen soil.
As the test proceeds, the frost penetration rate and
the heave rate decline. In four of the five tests performed
on the sand no ice lenses wer : observed 1 even after testing
for 465 hours by LRPC (Livet et al, 1983). However, for
test SRD 15 performed at. Carleton 1 two 5nun thick ice lenses
were noted after testing for 126.5 hours. These were the
only lenses noted in the sample and they show that although
rare in the sand, under some circumstances a balance between
the supply of water and heat extraction can be established
resulting in primary ice segregation.
5.3.3 Internal frost heave pressure
Williams and Wood (1984) report the results of confined
frost heave tests performed on the Caen soils. Their
findings show that if a negative temperature oradient J . • is
established in the soil, substantial internal pressures can
I I I I I I I I I I I I I I I I I I I
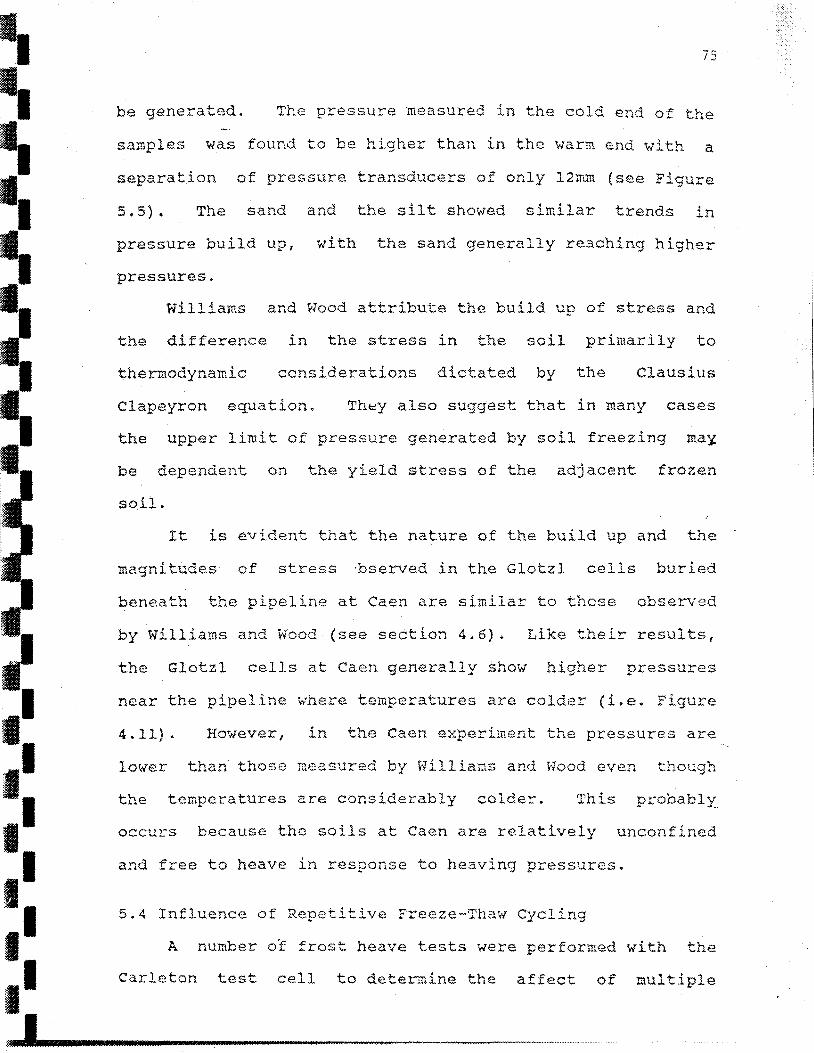
..
..
.. I I
75
be generated . The pressure measured in the cold end of the
samples was found to be higher than in the warm end with a
separation of pressure transducers of only 12m.'n (see Figure
5. 5} • The sand and the silt showed similar trends in
pressure build up, with the sand generally re.aching higher
pressures.
Williams and Wood attribute the build up of stress and
the difference in the stress in the soil primarily to
thermodynamic considerations dictated by the Clausius
Clapeyron equation. Th~y also suggest that in many cases
the upper limit of pressure generated by soil freezing ma~
be dependent on the yield stress of the adjacent frozen
soil.
It is evident that the nature of the build up and the
magnitudes of stress ·bserved in the Glotzl cells buried
beneath the pipeline at Caen are similar to those observed
by Williams and Wood (see section 4.5). Like the results,
the Glotzl cells at Caen generally show higher pressures
near the pipeline where temperatures are colder (i.e. Figure
4. 11) • However, in the Caen experiment the pressures are
lower than· those measured by Williams and Wood even though
the temperatures are considerably colder. This probably
occurs because the soils at Caen are relatively unconfined
and free to heave in response to heaving pressures .
5.4 Influence of Repetitive Freeze-Thaw Cycling
A number or frost heave tests were performed with the
Carleton test cell to dete~~ine the affect of multiple
•• •• •• •• •• •• ,_.., 1------------····--·················
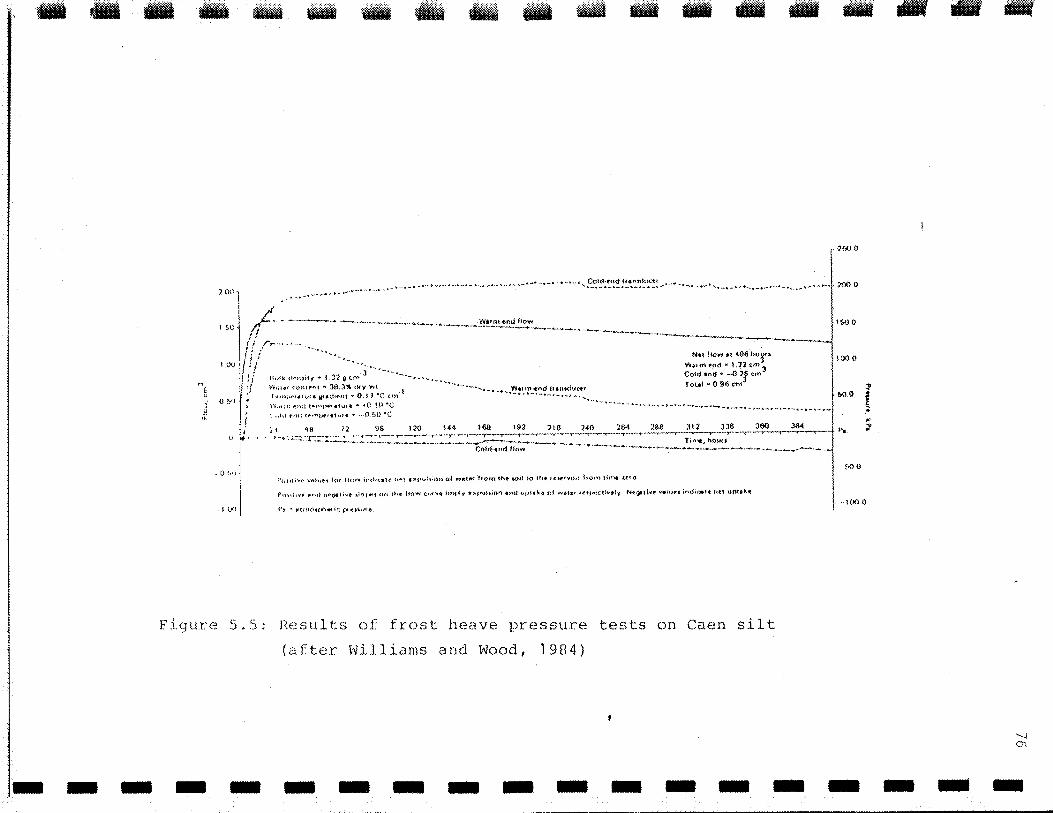
• - • •
Fisrure 5.5
- - - - -
-
n,.,JkdNl>H'f • J 3'2g:cn).j· ... ~-~.~- .. - .. _ ........ ~ .... W11t~r <'UHII""-t" 3S.J"' dfy ""l ·l s'""f'""l•tvt• wu.lliN\1 ""0.11 Ac <tn
• -
Ntt tlow ~~ .t06 hu~u. Vo/~,m tfld • l.l'J s:m ~ Cohj trnd • --0.1f tm ..
loteJ • 0 96 t'1'A
Results of frost heave pressure tests on Caen silt
(after Williams and Wood, 1984)
- - - - - - - - - -
-
r 1YJ o
1SQO
\00 ()
•. l(J() 0
- - - -
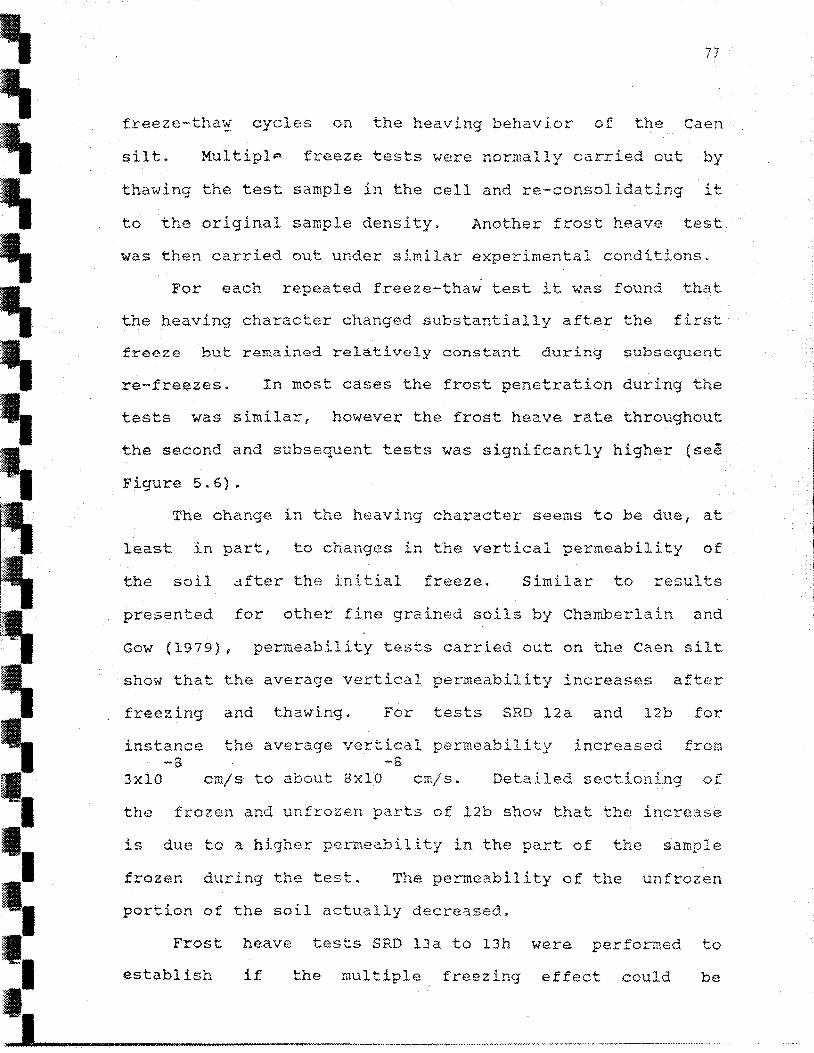
:· . ...
a. ·--.. .. .. L . ~:.-1
77
freeze-tha'1. cycles on the heaving behavior of the Caen
silt . MultiplP freeze tests were normally carried out by
thawing the test sample in the cell and re-consolidating it
to the original sample density. Another frost heave test
was then carried out under similar experimental conditions.
For each repeated freeze-thaw test it was found that
the heaving character changed substantially after the first
freeze but remained relatively constant during subsequent
re-freezes. I ~ th f L ~ ~< d ' th n mos'- cases .e ros1: pene~...ra .... ~on ur1.ng e
tests was similar, however the frost heave rate throughout
the second and subsequent tests was signifcantly higher (see
Figure 5.6) •
The change in the heaving character seems to be due, at
least in part, to changes in the vertical permeability of
the soil .:1fter the initial freeze. Similar to results
presented for other fine grained soils by Charrtberlain and
Gow (1979), permeability tests carried out on the Caen silt
show that the average vertical permeability increases after
fre.ez ing and thawing. For tests SRD 12a and 12b for
instance the average vertical permeability increased from -3 -B
3xl0 cro.;s to about Bx.lO cm;s. Detailed sectioning of
the frozen and unfrozen parts of 12b show that the increase
is due to a higher perxneability in the part of the sample
frozen during the test. The permeability of the unfrozen
portion of the soil actually decreased.
Frost heave tests SRD lJa to 13h were performed to
establish if the multiple freezing effect could be
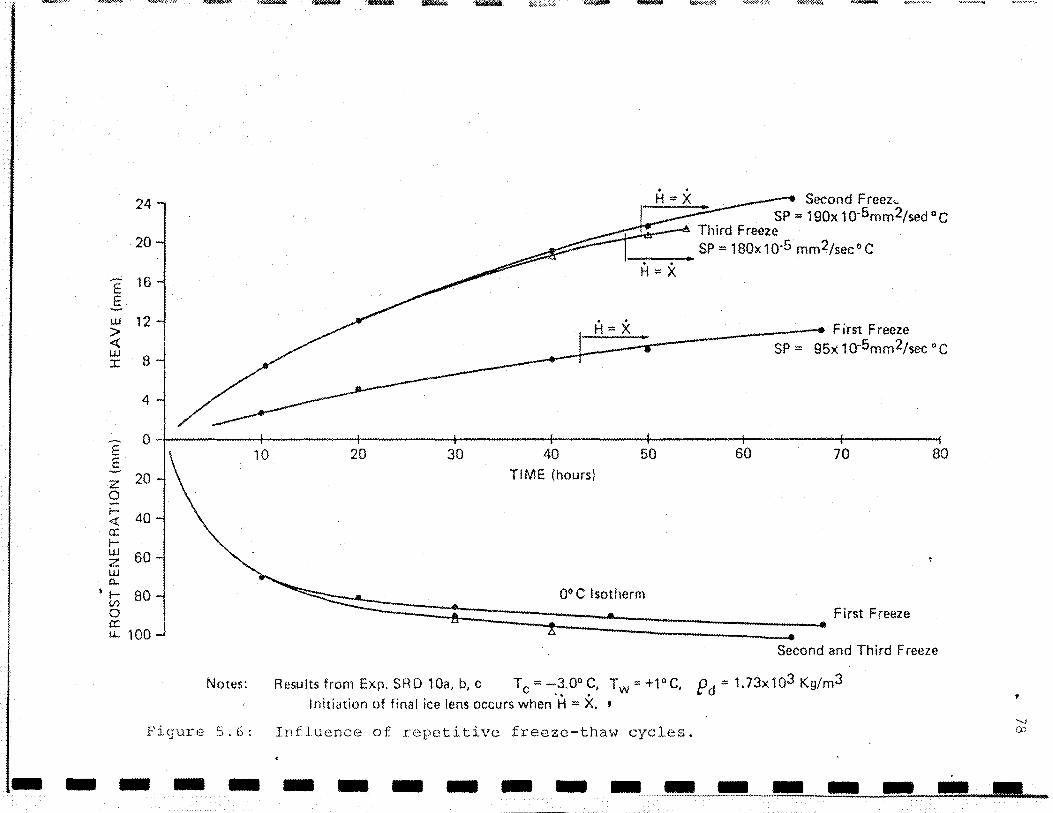
24
20
E 16 E
UJ 12 > .:( w
8 J:
4
E 0
,.. t:
z 20 0 !- 40 <I: a: r-UJ 60 z w 0...
~~-- 80 V)
0 a: u. 100
Notes:
10 20 30 40 TIME (hours)
, ___ _
50
Second F reez ... SP = 190x 1o·5mm2/sed °C
Third Freeze SP = 180x1Q·5 mm2Jsec°C
60 70 80
~~~~::::::::~~::::::::~0~0
~C~!s~o;d~le;r;m~:::::::::::::::---" First Freeze
Second and Third Freeze
Results from Exp. SRD 10a, b, c Tc = -3.0° C, Tw = +1°C, f?d = 1.?3x1Q3 Kg/m3 Initiation of final ice lens occurs when ·H =X. '
Figure 5.6: Influence of repetitive freeze-thaw cycles.
~~~~~~~-~-~----------~ -- -------------------
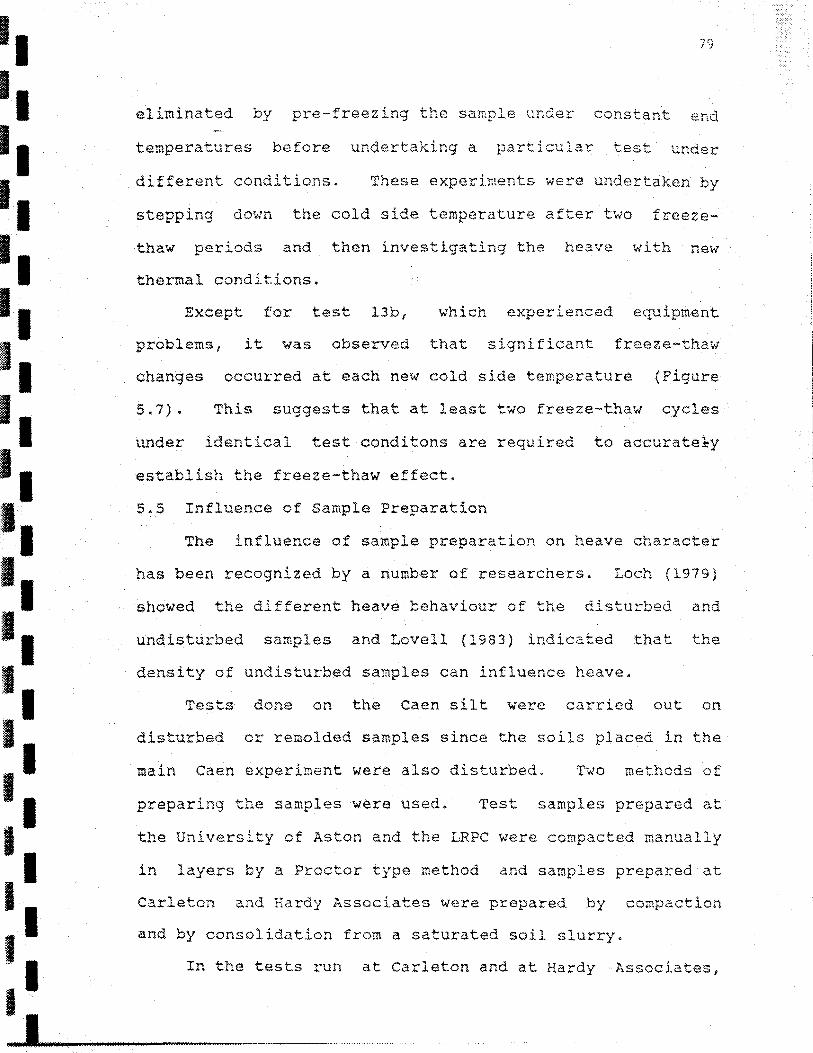
•• •• I I
•• •• •• •• •• I I
•• I I
•• •• I I
II I
•• I •• ••
79
eliminated by pre-freezing the sample under constant end
temperatures before undertaking a particular test under
different conditions. These experiments were undertaken by
stepping down the cold side temperature after two freeze-
thaw periods and then investigating the heave with new
thermal conditions .
Except for test 13b, which experienced equipment
problems, it was observed that significant freeze-thaw
changes occurred at each new cold side temperature (Figure
5. 7) • This suggests that at least two freeze-thaw cycles
under identical test conditons are required to accurate1y
establish the freeze-thaw effect.
5.5 Influence of Sample Preparation
The influence of sample preparation on heave character
has been recognized by a number of researchers. Loch (1979)
showed the different heave behaviour of the sturbed and
undisturbed samples and Lovell (1983) indicated that the
density of undisturbed samples can influence heave.
Tests done on the Caen silt were carried out on
disturbed or remolded samples since the soils placed in the
main Caen experiment were also disturbed. T-wo methods of
preparing the samples were used. Test samples prepared at
the University of Aston and the LRPC were compacted manually
in layers by a Proctor type method and samples prepared at
Carleton and Hardy Associates were prepared by compaction
and by consolidation from a saturated soil slurry .
In the tests run at Carleton and at Hardy Associates,
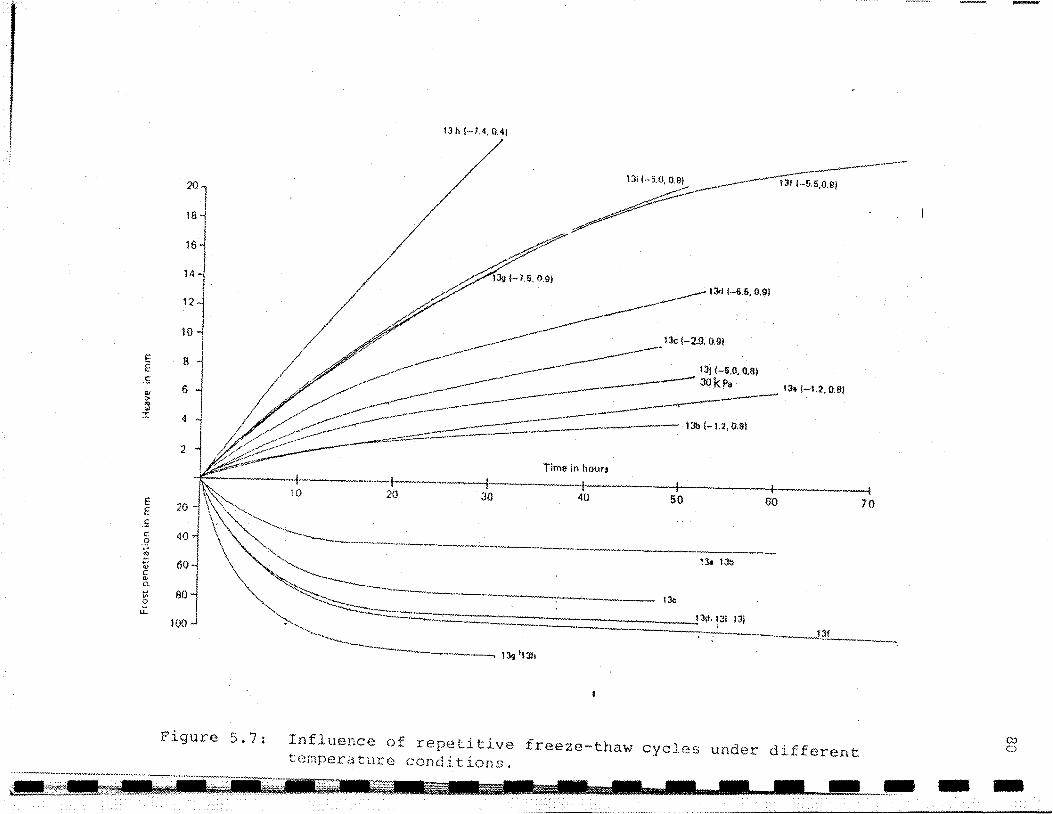
13 h (-7.4, 0.4!
20
Hi
16
14
12
10
E 8 E c:
... 6 :>
ill :r.
20 30 ·-----11---
40 ·--4---------+---------4
60 50 70
!3c
-~--,------ 13_1.;... __ _
Figure 5.7: Influence of repetitive freeze-thaw cycles under different
I I
81
h d th t 1 t d t .. , d ·~ was o...,serv-e . a samp es compac e_ o a Slml_ar ens1~.-y
by the Proctor type procedure exhibited less heave than
those consolidated from a slurry. As shown in tests SRD 6
and 7 (Figure 5.8), in most cases the frost penetration
rates and thermal gradients ~;ere similar but the heave rat.es
were higher.
Permeability testing sho~tJed that the difference in the
heaving character may result because of lower permeabilities
for the samples compacted by the Proctor type method. At an 3 3
insitu density of 1.73 x 10 kg/m the permeability of the -8
silt compacted in layers was found to be about 5 x 10 cm;s
while the permeability of the consolidated sample was a x -s
10 cmjs.
Most of the frost heave testing carried out on the 3 3
silt was at a dry density of about 1.73 x 10 kg/m similar
to that found in the main experiment. Frost heave tests SRD
14a to 14e were carried out at a density of about 1.5 x 3 3
10 kg/m similar to that which might be encountered in a
naturally occurring soil. Although only a limited number of
tests \-.'ere. performed, it appears that the reduction in the
density only had a minor effect on heaving behavior, with
the observed heave decreasing slightly when compared to
other tests.
5.6 Influence of Surcharge Load
Frost heave tests were carried out a Carleton and at
Hardy Associates with applied loads on the displacement
piston. In some cases the load was applied to simulate
,.,.,....,..I ---·-···--·······

12
10
E 8 E w '6 > <{ UJ
4 :r:
2
E 0
E z 20 0 1-<{ 40 0::: 1-UJ z 60 UJ a..
t;; 80 0 0::: u. 100
10
Notes:
TIME (hours)
20 30 40
-ll---------·-----------A------
50
Consolidated from Slurry SP = 60x1o-5mm2/sec o C
60 70
0° C Isotherm
------------------------ ,lJ. ---
Results from Exp. SRD 6,9 Tc"' -5.0°C, Tw = +1.5°C, pd ~ 1.73x10³Kg/m3
Initiation of final ice lens occurs when I~ "" X.
t
Figure 5.8: Effect of sample preparation on heave behavior
80
-------------------
83
surcharge _pressures in the experiment and in others,
(notably Hardy Assoc. FRlc, ld and 2d), relatively high
pressures in excess of those normally encountered were
applied.
comparison of the heave results, after an initial
freeze-thaw period, indicates that frost heave is reduced
with the application of surcharge load. Ho\vever,
significant heave occurred and steady state conditions were
established even after application of a 200KPa load.
A number of authors have determined experimental
relationships between surcharge pressure and the logarithm
of the frost heave rate (Penner and Ueda 1978, Linnell and
Kaplar 1959) or segregation potential (Konrad and
Morgenstern, 1982). Results from testing of the caen silt
show the relationship beb..reen surcharge pressure and the
lograritrn of segregation potential has a distinctly non-
linear trend. Nixcn 1 in Hardy Assoc. Ltd (1983), has
suggested that this may be due to the high percentage of
silt sized particles in the Caen soil and that the trend of
the segregation potential vs applied pressure plot may in
fact be bi-linear. Testing carried out at Carleton seems to
discount a bi-linear trend, suggesting that rnore testing is
required before an accurate relationship can be determined.
5.7 Influence of Temperature Conditions
Many researchers have recognized the relationship
between temperature conditions during a frost heave test and
heaving behavior. Penner and Ueda (1978) concluded that

·1·~.' J
~ ~~ .. 1
1·. ~,
I
• :1>
~:
I '1. •.
·'I ~<·.
-~r· ··,
·ll ··.1.''. ··::
I :I: ::::·
II
• I -• !
8! ..
the cold side temperature was a significant factor in
determining heave rate in their tests. Similarly, Livet
(1981) concludes that the temperature imposed on the cold
face is critical . Livet suggests if the cold face is
maintained at a constant value it is possible to classify
the frost susceptibility of soils by the relation between
heave and the square root of the freezing index (I=integral
of temp. of cold plate with respect to time).
The effect of the cold side temperature on frost .a
tests on the caen silt has been investigated in terms of the
frost heave index (I} as defined by Livet {1981). Similar
to results reported in Livet et al {1982 and 1983) the plot -1/2
of frost heave vs {I) was found to be linear for each
test (Figure 5.9). However, the slopes of the lines were
variable even for frost heave carried out unuer
similar temperature conditions.
The temperature gradient near the frost line is perhaps
a lilore representative indicator of the control of
temperature conditions during frost heave. The importance
of temperature gradient has been discussed by Gorle (1980)
and by Konrad and Morgenstern (1980). Figure 5.10 shows the
relation of heave rate (in terms of the velocity of water
flowing to the frost line) to the temperature gradient for a
number of tests on the Caen silt. Each of the tests was
run under similar experimental conditions and only the
results from the primary heaving portion of the tests are
considered. Although some scatter is observed between
i·· ... ------------------~~"'··········· ··········································································••<>••················· .................... ..
I I I I I I I I I~
I I I I I I I I I I
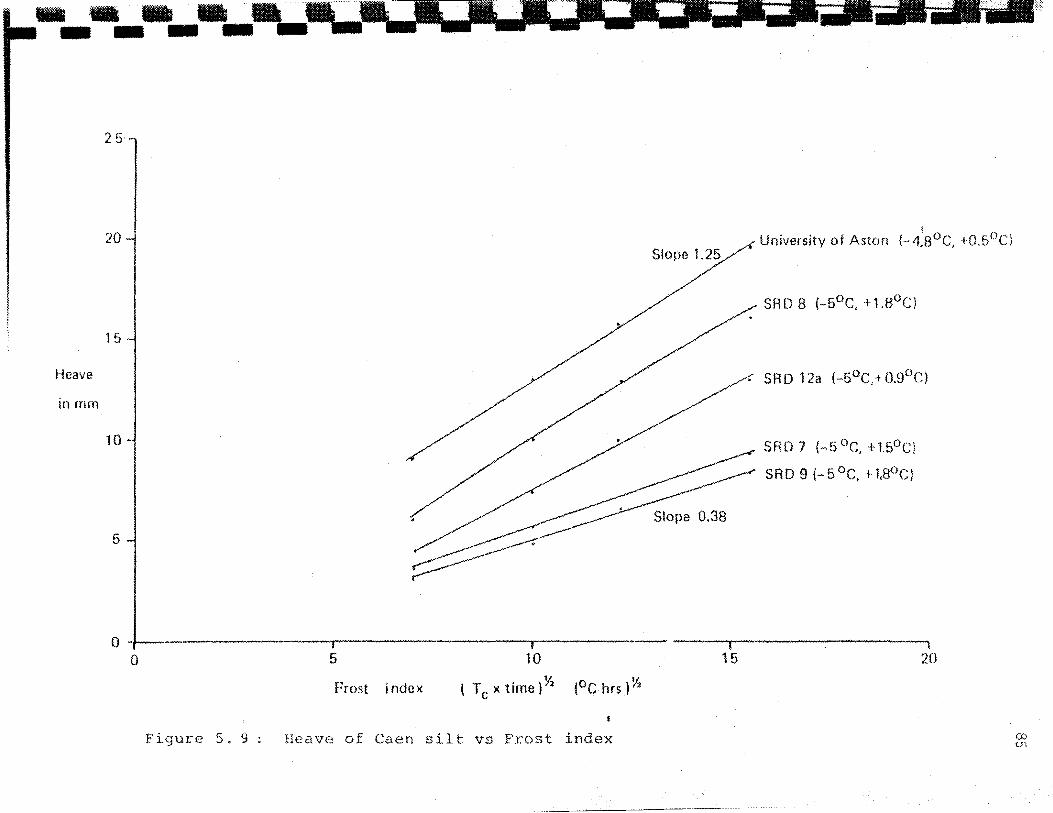
---. ----
Heave
inmm
25
20
15
10
5
0 -0
Figure 5. 9
5 10
Frost i ndox l T c x time } % (°C hrs ) Y:a
Heave of Caen silt vs Frost index
Slope 1.25
15 20
00 Ul
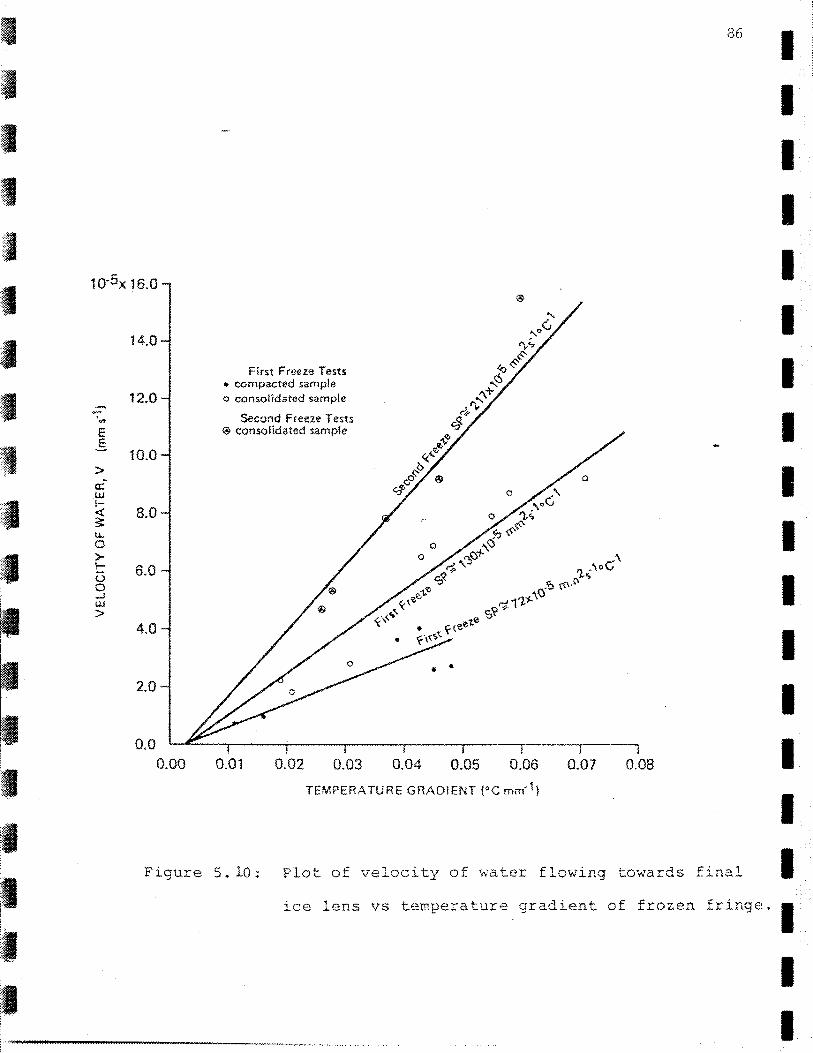
I ,'1'' r
. I I . .
I .
<
E E
> a: w !-
14.0
12.0
10.0
-< 8.0 3: u.. 0 >-t: 0 0 ..J w >
6.0
4.0
2.0
0.0 0.00
First Freeze Tests " compacted sample o consolidated sample
Second Freeze Tests @ consolidated sample
0.01 0.02 0.03
• •
0.04 0.05 0.06
TEMPERATURE GRADIENT {"C mm·1)
86
I
0.07 0.08
I I I I I I I I I I I I I I
Figure 5. 10; t of velocity of water flowing towards final
I I
e lens vs temperature gradient of frozen fringe. I
I I
87
individual_ test results, several distinct linear
relationships are indicated showing the inFluence of sample
preparation and cyclic freezing. The slopes of the lines
are almost equal to velocity/grad T (the intercept error
being small), a ratio which Konrad and Morgenstern (1981}
have termed the segregation potential (SP) •
It is interesting to note that data collected from
three different test cel.l.s are included on Figure 5.10.
This suggests that for this comparison at least, the test
cell chosen has little influence on heaving character.
5. 8 Sunrmary
The Caen soils have a characteristic heave behavior
during one dimensional freezing in a frost heave cell. The
sand shows relatively little heave, wj~h the heave resulting
primarily from freezing of pore water. The more frost
susceptible silt shows more heave 1 with heave resulting from
pore water freezing and ice segregation.
Primary frost heave of the silt was found to be
dependent on the temperature gradient near the frost line.
Tests carried out under similar experimental conditions
except for end temperatures, were found to lie on a linear
plot when temperature gradient (grad T) was plotted against
the. velocity of water flowing tot-lards a thickening final
lens. Figure 5.10 shows the experimental results of 24 tests
on the silt with no applied load. Al~hough some scatter is
observed, three distinct linear relationships are indicated
'I
88
showing the influence of cyclic freezing and sample
preparation on heave behavior. For the data shown, second
freeze tests on consolidated samples can be seen to show a
significant increase in velocity (for the same grad T)
relative to first freeze tests. It is also apparent that
samples consolidated from saturated soil slurries undergo
more heave than samples compacted to a similar density by a
Proctor type method.
Other factors such as surcharge pressure and density
are expected to affect heave behavior. For the data
available, the design of the test cell seems to have littl~
effect on the velocity vs grad T plot.
1·------~~~~
I I I I I I I I I I I I I I I I I I I
~ II II II II II II II II I I
• I I I
'• I I I I I ... -
89
CHAPTFR VI
FROST HEAVE PREDICTION
6.1 General
The caen experiment provides an excellent opportunity
for testing various frost heave prediction methods, since
the experimental conditions have been carefully controlled.
In addition, since accurate temperature measurements have
been taken throughout the L}.-periment it is not necessary to
use a model to estimate the thermal conditions. The use of -measured temperature gradients and rates of frost
penetration for instance, allows a direct test of the
capabilities of a particular frost heave modeL
The frost heave ob; erved around the Caen pipeline in
the sand can be accounted for entirely by expansion
resulting from pore water freezing (see section 4.4.3}.
Emphasis has therefore been placed on the prediction of
heave in the silt. For the simplest case, the heave near
the end of the pipeline can be considered, since as
discussed in sections 4.4 and 4.6, this region is relatively
unaffected by the complicated pipe-soil interactions in the
transition zone between the sand and the silt.
6.2 Prediction Method
For satisfactory frost heave design of a chilled
pipeline, heave which may occur throughout the operating
life of the pipeline should be considered . For large scale
90
pipeline projects such as those proposed for northern
canada, operating lives in the order of twenty five years
are envisaged. This type of engineering problem requires
information regarding the overall rate and magnitude of
heave. Detailed information about the thickness and
location of individual lenses may be of less practical
importance.
Frost heave modeling has been carried out by numerous
researchers in order to develop a theoretical understanding
of the ice segregat ~1 process. A recent sunu11ary of the
various models is give by O'Neil (1983) and N.R.C. (1984)~
These modeling efforts have significantly advanced the
theory of frost heave and the understanding of the factors
which influence heave. At present however, the models are
often complex and d.'fficult to parameterize. At best, even
the most sophisticated models such as those presented by
O'Neil and Miller (1980) and Guymon et al (1983), are only
capable of predicting the pattern of growth of ice lenses in
uniform ideal soils (see Holden, 1983 and Guymon et al,
1983).
As work has proceeded at a theoretical level, other
methods have been developed which attempt to solve everyday
problems encountered in engineering practice. These are
often based on laboratory testing of samples representative
of construction materials or soil samples actually collected
from the field. The t~st procedures outlined by Aguirre
Fuente et at (1974}, Transport and Road Research Laboratory
I I I I I I I I I I I II I' I II
I I
~ I
.'1'· .. ;? : ::.-
~1 .. ~;:
'I·
~:: ;:.
I I I =1=-~:
I I =I :: I 1·;·1':,. f·.::::·· 1;:~
~
concept
in a
of heaving efficiency with soil thermal
relatively simple model which they
conditions
claim can
specifically predict frost heave around chilled pipelines
(Konrad and Morgenstern, 1984). In their model 1 the heaving
efficiency of the soil (termed the segregation potential,
SP) is related to the velocity of water flowing towards a
forming ice lens by the relation:
V = SP X Grad T
wherL; Grad Tis the gradient of temperature across the
frozen fringe.
Viewed in simple terms the segregation potential model
can be considered as a case of limited water flow towards
' 1.ce formation, with SP representing the· the zone of
permeability of the frozen fringe and Grad T determining the
driving force. Application of this method reqtlires frost
heave testing in the laboratory to determine the segregation
potential of a particular soil. Frost heave predictions can
then be made, provided the thermal conditions in the field
can be detelwined.
6.3 Segregation Potential of the Caen Silt
Konrad and Morgens rn (1984) have suggested that only
a limited number of well-controlled freezing tests are
required to adequately characterize the segregation
potential of an homogeneous soil in the field. For frost
heave predition of chilled pipelines they suggest that II ... in practice, three freezing tests'using constant temperature
boundary conditions and different applied surcharges
92 I I I I I I I I I I I I I I I I I I I
93
covering the expected range in the field suffice to define
the field frost heave characteristics" (Konrad and
Morgenstern 1984 1 pl04}.
As described in the previous chapter 1 a large body of
data is available from frost heave tests carried out on the
caen silt under different experimental conditions
several frost heave cells. The results of these
using
tests
clearly indicate, for this soil at least, that determination
oi the segregation potential is not nearly as straight
forward as Konrad and Morgenstern suggest. Even if factors
such as cyclic freezing, compaction method and density are
ignored, it is very difficult to repeat individual test
results under identical conditions (as noted in the range of
SP values noted in table 5.1).
In an attempt to rationalize the frost heave test
results, the data were plotted in terms of water velocity vs
temperature gradient for the initiation of the final ice
lens. If a number of frost heave tests are carried out at
different cold side temperatures, a series of plots can then
be determined for the Caen silt (see Figure 5.10). For
practical purposes the slope of the velocity vs temperature
plot can be regarded as an overall estimate of the
segregation potential of the soil (intercept term being
negligible) reducing the uncertainty of individual test
results. A direct prediction of frost heave can then be
made provided the thermal conditions (temperature gradient)
are known.
.1~ '.' ?
r §
..• ~ I
.. :.i ~ < .
•
94
6.4 Frost Heave ion
Prediction of the frost heave of the Caen silt has been
carried out for the second freezing period of the Caen
experiment with the Segregation Potential Method. Following
the procedure presented by Nixon (1982) frost heave can be
determined from the equation:
where;
H = [(1.09 v t) + H ] i
H the total heave, v is the velocity of
water flowing to the freezing front (v =
SP gradT),
t is the time and H is heave due to in-situ i
freezing .
An estimated, segregation potential for the silt by the
method described Section 6.3 been determined from
frost heave tests carried out on a) samples
layers by a Proctor type method and b) samples
compacted in
consolidated
from a soil-water slurry. Since the second freeze period of
the Caen experiment involved re-freezing of soil previously
frozen during the first freeze, a second freeze value of SP
was used for the pred ion until day 60 when the frost line
had penetrated beneath the maximum depth of previous
freezing. A SP value dete~mined from tests carried out on
unrestrained samples was used for the predictions since soil
pressure cells buried in the silt (see section 4.6)
indicated that soil pressures near the freezing front were
negligible.
I I I I I I I I I I I I I I I I I I I

~I I
~I ~I ~I .I II II II ~I I
. I II I II II II II II II I
95
The t_gmperature gradients near the frost , . .Llne measured
beneath the pipe at section B-B (Figure 4.2) were used for
frost heave prediction. At the start of the freezing the
temperature gradients were large and changing rapidly. This
was accotr~odated by taking an average gradient for the firct
week of the experiment and by gradually increasing the time
step throughout the freezing period. Table 6.1 summarizes
the method used for the prediction indicating the time
steps, temperature gradients and the components of heave for
the first 450 days of the second freeze period.
6.5 Comparison Between Predicted and Observed
The actual heave of the silt at section B-B is
presented on Figure 6.1 along with the predicted heave based
on frost heave testing of consolidated and compacted
samples. After 250 days, the prediction using the
Segregation Potential determined from consolidated samples
over-predicts heave by about 10%. The prediction using a
segregation potential determined from compacted samples is
30% to 40% lower than the observed heave.
For the consolidated samples there is an indication of
the prediction beginning to diverge from the observed heave
with time {see Figure 6.1). By 450 days the error increases
to a 15% over-prediction of heave. This occurs because the
observed rate of heave has slowed down with time, but the
temperature gradient used for the frost heave prediction has
remained relatively constant.
It would be expected thqt, with time, the rate of heave
·························-------
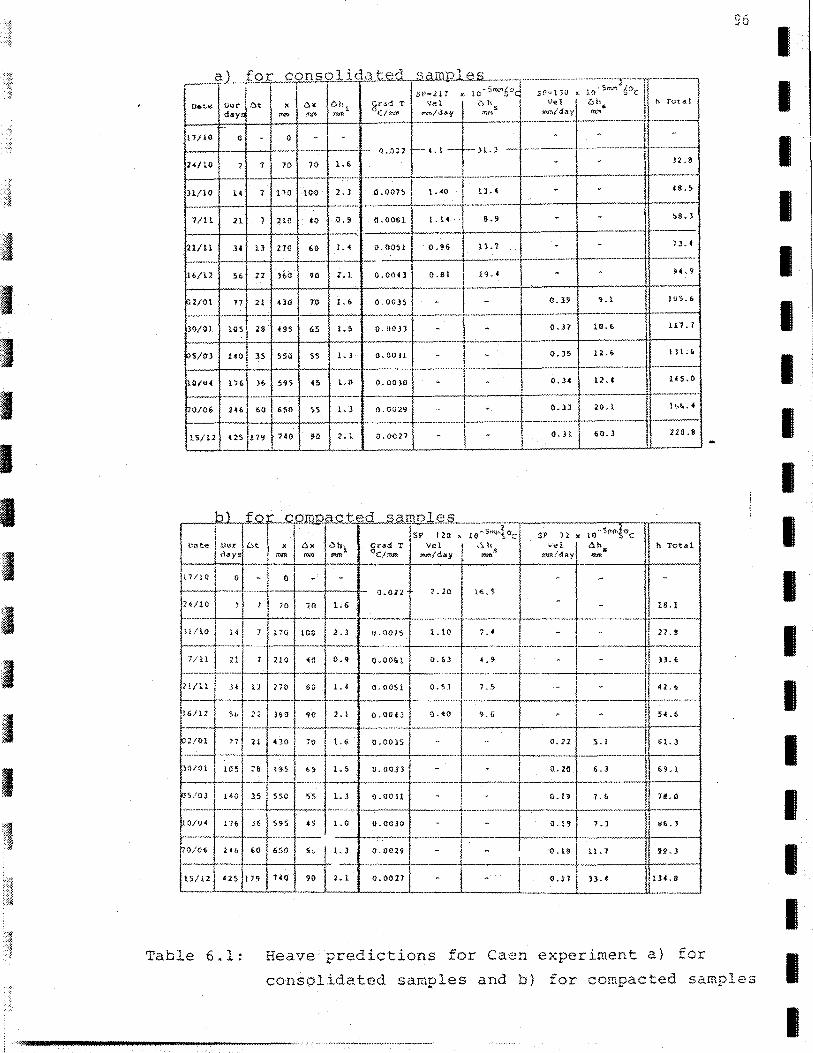
I .
I I
'I' ~~
I
. SV,..lli x; 10
V.e:l ~> h rr>:r./d<!lf ~1M$
!-U/H) 0 -
!}.002']
SP·zl JO {(
"'"' mm/day ~--------·~f------·~
(l.Jl
···-----·--·---~--------------l-----·--······--~-------!----------H----1
l SP 120 " l0- 5 '""'$<:<:::'
o. 3l
SP 72 X
.-.,1 mm/day
10 .. ,,...,1"c C. h., -
ua .s
h Tot .. l llilte I Our 6t x l <Cix C)t.l. grad 'r Vel .~ lcs I. b i) f or_cp.mt~la c ted sa lll..P. .. t~.s __________ i'__ '
j <J~y~ mm co.-a mm L/:rNtt: ::1\rn/d2$y ~
t 7/l 0 l u -~- 0 - • --- ------f----_----fl--_-------1
- ------- 1 o.on z.2o lf..S
7 ? I 10 '~-- _1_-_G-+-----<--'-.................. +----------1-----.--- ----=----------H-1-8--l------l .. ,., .. , . r.,, "' ,_, .,_,,, ... , ·-· - - , ,_, _'_'::_t_J-; ;;-c+-.-o--1'-__ -o_-. _9-: .. ~:·~~c--~--~-o~~>~l~:~~-~--:--~--~---·t+-·--------~--~ ~~-~-~-~:~~~·-~~~-~~:~~~-~~~~~-~~:~~H~--~~~~~--~1
().51 i LS 2 l/ll J4 u 210 1.4 O.OIJS1 42.6
~----4--~--+- ----- ···-----l~~-~-------------·-+'--~---1---------i--------------<>;-------- .. ·-~ !ui/12 2.!
0. 22 5.1 joUOl n 21 430! 70 l 1.6
, ______ ___,r--+---t-------+----4----'!-----------+-------+------··-~ ------H------1
l--3-o-;o_t4-lo_s-f--~-f-•-;;_s -tj-6_;4_1_._"'-"'~~o. uoJ l l __ _:-_______ L ______ ~~--+-~~o-._2_0 -~-6--J------fl--6-9·-· _1 --1
~S/())l 140 JS S>O ~5 1.3 O.Cil!l - I . -----i·-----------------+---Q-. -!94 !--1-. J----H,---~~-6-. J-----1
~0/V~ 1'16 J6 S9S B 1.{) !! .!)I) lO
---·+--+-->------ -- --J---------- -------------t----4-------·--+1------H------1 H6 6Q
lS/12
Table 6.1:
6S!l L l.J IJ.(HlH O.UIH-1
().11 1 .n.• ----------~·-·-···--~
!H.a
Heave predictions for Caen experiment a) for
consolidated samples and b) for compacted samples
I I I I I I I I I I I I I I I I I I I
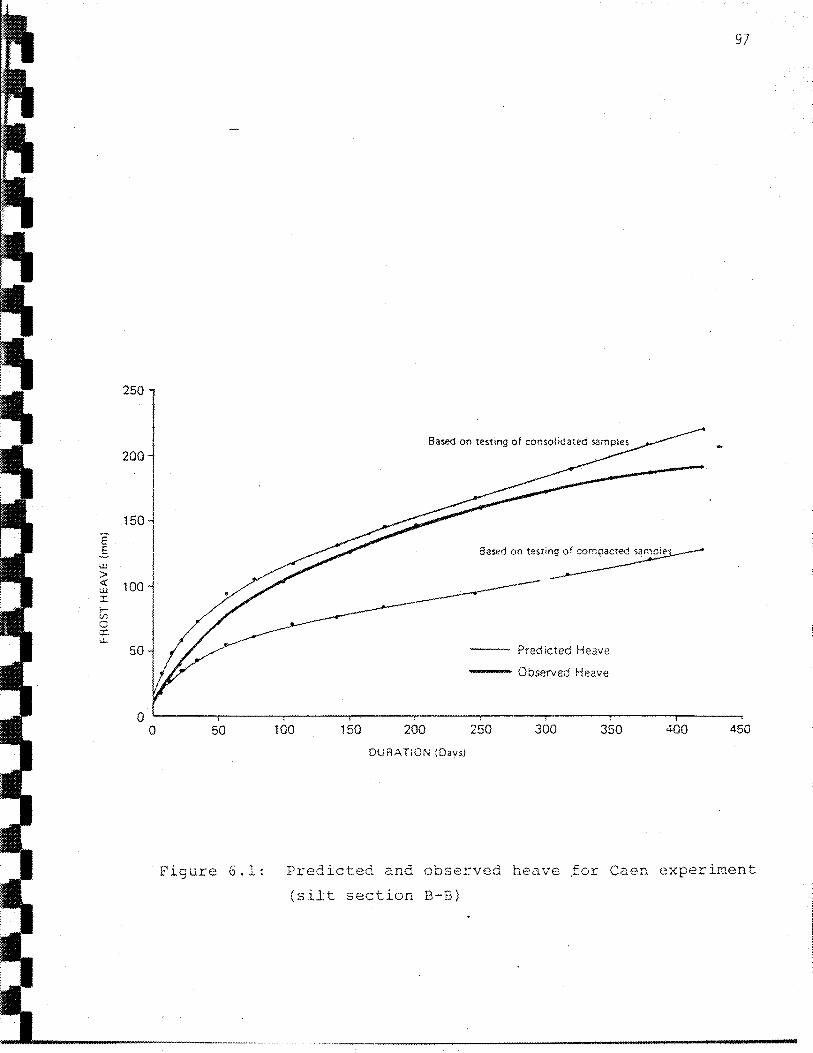
E E
w > <( Ul
:r: t:i 0 a: Ll..
250 l 2001
1
! 150 -l
1 ' I ! I
I 100
50
8ass:d on testi~
Predicted Heave
--- Observed Heave
97
0 ~------~------~------~------~-------r-------, ·------,-------~------~ 0 50 100 150 200 250 300 350 400 450
Fi9ure 6.1:
DURATiON (Oavs)
Predicted and observed heave jor Caen experiment
(silt section B-B)
98
around a chilled pipeline would decline as the resistance to
heave increases and the net heat flow decreases.
Observations by Akagawa (pers. comrn.) from laboratory tests,
and Carlson et al. (1982), from a full-scale fie~d
experiment, for example, suggest that the rate of .heav~ng
may ultimately approach zero. It is possible, therefore,
that similar conditions may eventually occur in the Caen
experiment and that the divergence in the predicted and the
observed heave noted during the last 100 days may increase.
When comparing the predicted and observed heave, it is
important to review the simplifications involved in the one
dimensional method used. For instance, a simple one
dimensional approach incorporates a number of assumptions
which might be expected to result in an over prediction of
heave. Heave is determined from the thermal qradient
beneath the centre line of the pipe and the assumption is
made that the heave is occurring uniformly along a
horizontal plane beneath the.pipeline which is the ~ame
thickness as the pipe. As indicated previo~sly on F~gure
4.1, this is not the case since tne heaving plane is
circumferential around the p~peline. The magnitude of the
vertical component of heave would be expected to be somewhat
less than that implied by heave on a vertical plane. In
addition, the frozen silt surrounding the pipeline could be
expected to have some shearing resistance to frost heave
deformation which would reduce the frost heave.
The segregation potential method used for the frost
99
heave pre-diction only considers heave by primary ice
segregation and insitu freezing of pore water. However, ,5%
or more of the heave at Caen has been shown to result from
secondary heave. This clearly shows that any prediction
carried out by this method for the Caen experiment will
have another source of error.
Finally a major consideration when comparing the
observed and the predicted heave is the difference between
the prediction based on a segregation potential for
compacted samples and consolidated samples. The soils
placed in the test facility at Caen were compacted in
layers and wetted up afterwards, suggesting that results
from testing on compacted samples might be more appropriate
for heave prediction. Alternatively, since the average lift
thickness at Caen was probably more than 30cm and the length
of the frost heave test cell was only llcm, consolidated
samples which were uniformly compacted from the top down may
be more representative.
I I I I I I I I I I I I I I I I I I I
~. ~. ~. I I I I . I .I I I
•• •• I I I I
•• •• I
•• •• •• •• I ••
100
CHAPTER VII
SillfH.P~qy AND CONCLUSIONS
7.1 General
The frost heave design of a chilled pipeline in areas
with widespread occurrences of frost susceptible soils
requires an integrated engineering program involving many
aspects of the actual physical environment and reliable
predictive methods. While constructed to re~resent an
extreme frost heave situation, the Caen experiment provides
an excellent opportunity to study heave of a chilled
pipeline under controlled experimental conditions.
The information presented in this thesis provides a
detailed picture of the nature of heave of thE soils around
the pipeline and the effects of the pipe-soil interactions
on heave, pipe stress and soil pressures. The results of
frost heave testing on the Caen soils in the laboratory are
reported and a number of frost heave predictions are carried
out for the pipeline .
1.2 Results
The major findings of this thesis can be summarized as
follows:
1) Nature of Frost Heave
a) The heave of the soils at Caen has resulted in
about· 20cm displacement in the frost susceptible silt and
4cm displacement in the non-frost susceptible sand .
·············--·····---·-----·-······-··········--····---··-·-···- ----------
,,, •. . :!" .
~li.
' .•... · : ~: :·· :?
• >, !. iii
water
101
b) _ Heave of the sand can be accounted for by pore
freezing. Heave of the silt resul~~ from:
i) pore water freezing (less than 10% of total),
ii) primary ice segregation behind a stable
frozen fringe (80% of total), and
iii) secondary ice segregation within a band of
frozen soil somewhat colder than the primary
I I I I I I
ice segregation temperature (10-15% of total). I The amount of heave resulting from primal.)' and secondary ice
segregation increased as the experiment proceeded but the
overall heave rate decreased.
2) Pipe Soil Interactions
a) The dif rential heave and the abruptness of the
transition between the sand and the silt has resulted in
significant pipe-soil interactions in a 3.0m zone on each
side of the trans ion. Bending stresses of about 200MPa
representing about 0.2% strain were measured after 450 days
of freezing in this zone.
b) The soil pressures in the annulus of frozen soil
around the pi ine were relatively unaffected by pipe
deformation but showed high positive stresses relating to
the soil freezing.
3) Laboratory Characterization of Heaving
a) The sand shows relatively little heave during one
dimensional frost heave tests with most of the heave
resulting from freezing of pore water.
b) Heave of the silt during one dimensional freezing
I I I I I I I I I I I I
102
was found- to be affected by cyclic freezing, sample
preparation, density and applied pres:::-'·re.
c) Primary heave of the silt was characterized by
plotting the velocity of water flowing towards the
thickening final ice lens, against the temperature gradient
near the frost line.
4) Frost Heave Prediction
a) Based on the observed thermal conditions beneath
the pipe, a number of frost heave _c .. ·redictions were carried
out for the Caen pipeline following the method presented by
Konrad and Morgenstern (1984). The range in segregation
potential from individual laboratory frost heave tests was
found to be too great to assign a single value so the
plot of velocity vs temperature gradient for the silt was
used as an estimate.
b) The results were variable, with the prediction
based on the laboratory testing of compacted samples being
30 to 40% lm.;er than the observed and the prediction based
on consolidated samples being 15% greater than the observed,
after 450 days of freezing. The difference between the
predicted and the observed, based en consolidated samples,
appeared to be increasing with time.
7.3 Conclusions
The observations of the nature of t heave around
the Caen pipeline, the results of the laboratory testing on
the Caen soils and the heave pred ions for the pipeline
---------------------
:;:~ ,,1 .t
I 'I :_~; >
::1 :~.
:.1 ~:; --.
·;I
.I , __ , .. _, ;:•
I
103
provide a large amount of detail information which can
be incorporated in a frost heave design method.
The investigations of the components of heave of the
silt clearly show that in frost susceptible soils, heave of
a chilled pipeline can result from in-situ freezing, primary
ice segregation and secondary ice segregation at 0
temperatures down to -0.4 c. !f the occurrence of secondary
heaving is accepted, then the implications of heave induced
in frozen soils which are close to the freezing point should
be considered in an overall ~rost heave program. Recent
field measurements of secondary heave (i.e. 1 Smith, l985j
suggest that in some soils secondary heave may occur at even
colder temperatures than that noted in the caen experiment.
Observations of pipe-soil interactions at Caen suggest
that if an unprotected pi_ 'eline is buried in areas where
differential heave is expected, significant pipe stress may
occur over short transition zones. Pipe-soil interaction
models must therefore consider relatively sharp differential
movements over short horizontal distances. The pressures in
the annulus of frozen soil surrounding chilled pipelines can
be expected to be relatively unaffected by local pipe-soil
interactions, but show substantial pressure increases upon
freezing.
The frost heave predictions carried out for the Caen
experiment show that the method proposed for prediction
of heave of chilled pipelines by Konrad and Morgenstern
(1994}~ requires some modifications to account for the
I I I I I I I I I I I I I I I I I I I
104
effects of cyclic freezing, density, variations in sample
preparation and in-situ soil characteristics. If possible,
it would be advisable to estimate the segregation potential
of a particular soil on the basis of a large number of frost
heave test results, by plotting the relation between
velocity of water flow versus temperature gradient near the
frost line. The segregation potential can then be estimated
from the slope of the best fit line.
The wide variations in predicted heave suggest that
considerable caution must be taken when applying a
particular predictive method in field situations.
7.3 Final Remarks
Detailed observations of the frost heave around the
Caen pipeline illustrate the value of full-sized experiments
carried out under t lrefully controlled conditions. When
factors such as the variability of soil conditions,
hydrology and climate are controlled, the reliability of the
resulting data allows rigorous testing of a variety of
analytical models.
The author hopes that the investigations reported here
will contribute to the knowledge base for engineered
structures in permafrost areas.
,., ~·
:,,,.· (
I I I I I I '.1:.:. :~
I . ~
I
BIBLIOGRAPHY
AGUIR...T{E-PUENTE, J.,. DUPAS 1 A., and PHILIPPE, A. 1974. Frost heaving and the classification of soils in accordance with their frost susceptibilty. Frost i Jord, Nr.·l4, pp. 41-48.
ANDERSON, D.M. 1968. Undercooling, freezing point depression and ice nucleation of soil water. Israel Journal of Chemistry, Vol. 6, pp. 349-355.
MiDERSON, D.M. and HOEKSTRA, P. 1965. Migration of interlamellar water during freezing and thar,<~ing of Wyoming bentonite. Scit. .. itific Proceedings, Soil science Society of America, Vol. 29, pp. 498-504.
ANDERSON, D.M. 1 and MORGENSTER...l\f 1 N .R. 1973. Physics_~ chemistry and mechanics of frozen ground: a review. Proceedings, 2nd International Conference on Permafrost, Yakutsk, U.S.S.R., pp. 257-288.
ANDERSON, D.M., TICE, A.R., AND HCKIM,H.L. 1973, The unfrozen water and the apparent speci heat capacity of frozen soils. 2nd International Conference on Permafrost, Yakutsk, u.s.s R., pp. 289-294~
AKAGAH.A., S. 1983. Relation bett.;een frost specimen length. Personal communication IV Conference on Permafrost.
heave and Internation
ARAKAWA, K. 1966. Theoretical studies of ice segregation in soil. Journal of Glaciology, Vol. 6. pp. 255-260.
BOWES, w.H. 1985. Bending sses in pipe due to frost heave. Pipelines and Frost Heave, Proceedings of a Seminar 1
Caen France 1 Geotechnical Science Laboratories/ Dallimore S.R. and Williams, P.J. eds. pp. 255-260.
BURGESS, M. M. , LEM.l\.IRE, G. 1 SMITH 1 M. W. and WI LLil-.HS, P. J. 1982. Etude du gel des sols auteur d'une conduite refroite enterree dans un station experi:mentale, Phase 1. Earth Phys Branch Open File 82-18, Energy 1 Mines and Resources, Canada, 73p.
BURT, T.P. AND WILLIAMS, P.J. 1976. Hydraulic conductivity in frozen soils. Earth Surface Processes, Vol. 1, pp. 349-360.
CARLSON, L.E., ELLWOOD, W.A. 1982. Field test
J. R. , NIXON 1 J. F. and SLUSA....t(CHUK, results of operating a chilled
I I I I I I I I I I I I I I I I I I I
106
buried pipeline in unfrozen Canadian Permafrost Conference, 480.
ground. Calgary,
Proceedings, IV Alberta, pp. 475-
CH&~BERL~IN, E.J. 1981. Frost susceptibility of soil. u.s .A. Army, Cold Regions Research Engine£?!ring Laboratory 1
Monograph 81-2, llOp.
CHJ<J•1BERLAIN 1 E.J ~ and CARBEE, D. D. 1981. The Cold Regions Research Engineering Laboratory frost heave test. Frost i Jord 1 Nr. 22, pp. 55-62.
CHAMBERLAIN, E.J. and GOH, A.J. 1979. Effect of freezing and thawing on the permeability and structure of soil~. Engineering Geologyr Vol. 13, pp. 73-92.
DILLON, H.B., and ANDERSLAND, O.B. 1966. unfrozen water content in frozen soils. Geotechnic~l Journal, Vol. 3 1 pp. 53-60.
Predicting Canadian
GASKINI P. classification.
1981. Review of frost susceptibility Frost i Jord, Nr. 22 1 pp. 3-11.
GEOT.ECHNICAL SCIENCE LA..BORATORIES. 1982, Feasibility study for stresses in a pipeline buried in freezing soil. Carleton University, Geotechnical Scienc Laboratories, Report IR 32, 36p.
GEOTECHNT:CAL SCIENCE Li\BORATORIES. 1983a. Investigation of soil fr~~zing in association with a buried chilled pipeline in a large-scale test facility: Phase 2. Carleton University 1 Geotechnical Science Laboratories Report IR 33, 44p.
GEOTECHNICAL SCIENCE stresses developed in Carleton University, Report IR 36, 43p.
LABORATORIES. 1983b. Analysis of a pipeline buried in freezing ground. Geotechnical Science Laboratories,
GORLE, D. 1980. Frost susceptibility of soils: influence of the tnermal variables and depth to the water table. Proceedings, 2nd International Symposium on Ground Freezing, Trondheim, Norway, pp. 772-783.
GUYHON, G.L., BERG, R.L .. AND HROMi'\DY.A, T.V. 1983. Field tests of a frost-heave model. Proceedings, 4th International Conference on Permafrost, Fairbanks, Alaska, Vol. 1, pp 409-414.
HARDY ASSOCIATES (1978) LTD. 1983. Additional frost heave testing on caen silt. Open File Report 84-10, Earth Physics Branch, Energy, Mines and Resources, Canada 1 6p.
HARLAN I R. L. transport in
1973. partially
Analysis of frozen soil.
coupled Water
hea.t-fluid Resources
I .
·I· •· :-:
I ·.··1· •· :~
i·l· r~
11
I . .
I 'I' ::-
1
107
Research, Vol. 9, pp. 1314-1323.
HARLAN, -R.L. 1974. Dynamics of water movement in permafrost: a review. Permafrost Hydrology, canadian Natim.~l Committee, International Hudrological Decade, Proceedings of a Workshop Seminar, Calgary, pp. 69-77.
HOEKSTRA, P. and KEUNE, R. 1967. Pressure effects on the conductance of frozen .montmorillonite suspension. Clays and Clay Minerals, vol. 15, pp. 215-225.
HOLDEN, J.T. 1983. Approximate solutions for Miller's theory of secondary heave. Proceedings, 4th International Conference on Permafrost( Fairbanks, Alaska, Vol. 1, pp 498-503.
HWP.u~G, C.T. 1977. Frost heave of a chilled gas pipeline. Pro~eedings, 30th Canadian Geotechnical Conference, SasYatoon, Saskatchewan, pp. 59-87.
J&qNs, J.O. and HEUER, C.E. 1983. Frost heave mitigation and permafrost protection for a buried chilled gas pipelinQ. Proceedings, 4th International Conference, Fairbanks 1
Alaska, pp. 531-536.
KONRAD, J.M. and MORGENSTE~~, N.R. 1980. A mechanistic theory of ice lens formation in fine-grained soils. Canadian Geotechnical Journal, Vol. 17, pp. 473-486.
K1.."iRAD 1 J.M. and MORGENSTERN, N.R. potential of a freezing soil. Journal, Vol. 18, pp. 482-494.
1981. The segregation Canadian Geotechnical
KONR~D, J. H. and MORGENSTERN 1 N. R. applied pressure on freezing soils. Journal, Vol. 19, pp. 483-494.
1982. Effects of Canadian Geotechnical
KONRAD, J.H. and MORGENSTERN, N.R. 1984. Frost prediction of chilled pipelines buried in unfrozen Canadian Geotechnical Journal 1 Vol. 21 1 pp. 100-116 .
heave soils.
LADANYI, B. and LEMAIRE, G. 1984. Caen pipeline experiment: a back-analysis of observations made during the first year of the test. Pipelines and Frost Heave, Proceedings of a Seminar, Caen, France, Dallimore, S.R. and Williams, P.J. eds. pp. 39-40.
LE}ffiiRE 1 G. 1983. Etude experimentale d'un gazoduc enterre soumis a des temperatures negatives. Memoire presente en vue de l'obtention du grade de Maitre est Sciences Appliquees (M.Sc.A), Montreal, Quebec, 66p .
LINNELL, K.A. and KAPLP-R, C.W. and material type in frost action. Bulletin No. 225, pp. 81-120.
. 1959. The factor of soil
Highway Research Board
I I I I I I I I I I I I I I I I I I I ______ , .......................... _
I I I
•• ~. I
•• 'I
•• •• I
•• •• •• •• . I 4
108
LIVET, J. 1981. Experimental method for the classification of soils ~ccording to their frost susceptibility, France. Frost i Jord, Nr. 22, pp. 13-22.
LIVET, L.J., BOUTONNET, M. AND PETELOT, 11.M. 1982. Determination de la susceptibilite au gel d'echantillons de vols fins, destines a la station de gel de caen 1 Laboratoire Regional des Pants et Chausees, Dossier 906/Sl.
LIVET1 J., BOUTONNET, M. and PETELOT, J.M. 1983. Determination de la susceptibilite au gel des sols fin suivant le mode operatoire "essaie de gonflement au gel" l'echantillon: Limon Rougemontier. Laboratoire Regional des Ponts et Chausee 1 Dossier 82/001.
LOCH, L.P. 1978. Influence of heat extraction rate on ice segregation rate of soils. Frost i Jord, Nr. 20, pp. 19-30.
LOCH, L.P. AND KAY 1 B.C. 1978. Water redistribution in partially frozen, saturated silt t:J.nder several temperature gradients and overburden loads. Soil Science Society Q.f fu~erica Journal, Vol. 42, pp. 400-406.
LOVELL, C. W. Proceedings, 4th Fairbanks, Alaska,
1983. Frost susceptiblity International Conference on pp. 735-739.
of soils. Permafrost,
MACKAY, J.R. 1983. Downward water movement into frozen ground, western arctic coast, Canada. Canadian Journal of Earth Sciences, Vol. 20, pp. 120-134.
' MACKAY, J.R., OSTRICK, J., LEWIS, C.P. and MACKAY, O.K. 1979. Frost heave at ground temperatures below 0 c, Inuvik 1
Northwest Territories. Geological Survey of Canada, Paper 79-la, pp. 403-406.
MCCABE, E.Y. 1984. Frost heave testing, Caen silt. Personal con:..munication .
HCCABE 1 E.Y. and KETTLE, R.J. 198'3. The influence of surcharge ·load on frost susceptibility, Proceedings, 4th International Conference on Permafrost, Fairbanks, Alaska, pp. 816-820 .
NATIONAL RESEARCH COUNCIL. 1984. Ice segregation and frost heaving, ad hoc study group on ice segregation and frost heaving: National Academy Press. 6~p.
NIXON, J.F. 1 STUCHLYt J. and PICK, A.R. 1984. Design of Norman Wells pipeline for frost heave and thaw settlement. 3rd International Symposium on Offshore Mechanics and Arctic Engineering, A.S.M.E. Trans. of the Journal of Energy Resource Technology •
·i.l i·f
l: ·]I . :riB }IJ
I,
109
NIXON 1 J.F. 1982. Field frost heave predictions using the segregation potential concept. Canadian Geotechnical Journal, Vol. 19, pp. 521-526.
O'NEIL, K. and MILLER, R.D. 1980. Numerical solutions for rigid ice model of secondary frost heave. 2nd International Symposium on Ground Freezing, Trondheim, Norway, pp. 656-669.
PATTERSON 1
unfrozen Results Journal,
D. and SMITH, M.W. 1981. The measurement of water content by time domain reflectometry.
from laboratory tests, Canadian Geotechnical Vol. 18, pp. 131-144.
PENNER, heaving.
E. 1972. Influence of freezing rate on Highway Research Record, no. 393 1 p.56-64.
frost
PENNER, E. and GOODRICH, L.E. 1980. Influence of freezing rate on frost heaving. Highway Research 1 Vol. 393 1 pp.56-64.
PENNER 1 E. and UEDA, T. 1977. The dependance of frost heaving on load applications. Proceedings, S}~posium on Frost Action in Soils, University of Luela, Sweden 1 Vol. 1 1
pp. 92-101.
PHILIPPE, A., AGUIRRE-PUENTE, J. and BERTOGOUILLE, H. 1970. La station de gel de Caen. Presentation premiere experimentation report LCPC-CNRS, France.
POLAR GAS. 1984. Application for a certificate of public authorizing the construction of 4, Geotechnical Assessment.
to the National Energy Board convenience and necessity
pipeline facilities. Vol.
R~~PTON, V.N. and }~CKAY, J.R. 1971. Massive ice and icy sediments throughout the Tuktoyaktuk Peninsula, Richards Island and nearby areas, District of Mackenzie. Geological Survey of canada 1 Paper 71-21 1 16p.
SMITH, M.W. 1985. Observations of soil freezing and heaving at Inuvik, North'.vest Territories, Canada. Journal of Earth Science, Vol. 22, pp. 281-290.
SPIRIDONOV, V.V. 1983. Engineering designs pipelines in permafrost and boggy terrain in Proceedings 4th International Permafrost Fairbanks, Alaska, pp. 1184-1~89 .
for laying the north. conference,
TABER, s. 1929. Frost heaving. Journal of Geology, Vol. 37, pp. 428-461.
TORRANCE, J.K. and WOOD, J.A. 1983. Investigation of temperature induced stresses and water movements in frozen soils. Final report to the Department of Energy, Mines and
I I I I I I I I I I I I I I I I I I
•• !'·---__,..,...,.,.,~---··· ............................................. ··············-··········-.. ·······-······-~--·--··--·-·--··~-·~-- ..................... ~~~··---··-1·
llO
Resources, Canada, D.S.S. File No. 24SU 232335-2-0581.
TRANSPORT_ AND RO.'\D RESEARCH LABORATORY. 1977. The LR90 frost heave test-interim specification for use with granular soil, TRREL Supplementary Report SR 318, Crowthorn, England.
VAN VILET-LANOE, B., CLOUTARD, J.P. and PISS&~T, A. 1984. Structures caused by repeated freezing and tha"tving in various loamy sediments: a comparison of active, fossil and experimental data. Earth Surface Processes and Landforms, Vol. 9, pp. 553-565.
WILLIAHS, P.J. 1976. Isothermal volume change in frozen soils. Laurits Bjerrum Hemorial Volume, Norwegian Geotechnical Institute, Oslo, Norway.
WILLIA.HS 1 P. J • Introduction to England, 212p.
1982. The Geotechnical
Surface of the Earth; an Science. Longman, London
WILLIAMS, P.J. and WOOD, J.A. 1984. Internal stresses in soils during frost heaving. Final report to the Department of Energy, Mines and Resources 1 Canada, D.s.s. File No 24SU 23235-3-1098.
WILLihlfS I p. J. frozen ground.
and WOOD, J.A. 1985. Internal stresses in Canadian Geotechnical Journal, in press.
WOOD, J.A. AND WILLik~S, P.J. 1985. Stress distribution in frost-heaving soils. Proceedings 4th International Ground Freezing S~,posium, Sapporo 1 Japan, in press.
Znu, Y. and C&~BEE, D.L. 1983. Creep behavior of frozen silt under constant uniaxial , stress. Proceedings 4th International Permafrost Conference, Fairbanks, Alaska 1 pp. 1507-1512.