observations of convective and dynamical instabilities in...
TRANSCRIPT

JOURNAL OF GEOPHYSICAL RESEARCH, VOL. 104, NO. D17, PAGES 21,549-21,568, SEPTEMBER 20, 1999
Observations of convective and dynamical instabilities in tropopause folds and their contribution to stratosphere-troposphere exchange
John Y. N. Cho, 1 Reginald E. Newell, 1 T. Paul Bui, 2 Edward V. Browell, 3 Marta A. Fenn, 4 Michael J. Mahoney, s Gerald L. Gregory, 3 Glen W. Sachse, 3 Stephanie A. Vay, 3 Tom L. Kucsera, 6 and Anne M. Thompson 6
Abstract. With aircraft-mounted in situ and remote sensing instruments for dynamical, thermal, and chemical measurements we studied two cases of tropopause folding. In both folds we found Kelvin-Helmholtz billows with horizontal wavelength of -0900 m and thickness of -•120 m. In one case the instability was effectively mixing the bottomside of the fold, leading to the transfer of stratospheric air into the troposphere. Also, we discovered in both cases small-scale secondary ozone maxima shortly after the aircraft ascended past the topside of the fold that corresponded to regions of convective instability. We interpreted this phenomenon as convectively breaking gravity waves. Therefore we posit that convectively breaking gravity waves acting on tropopause folds must be added to the list of important irreversible mixing mechanisms leading to stratosphere-troposphere exchange.
1. Introduction
At midlatitudes, tropopause folds are believed to be the major source of stratosphere-to-troposphere trans- fer of air. These V-shaped layers with high ozone and potential vorticity content angle down from the strato- sphere for several kilometers and, at times, reach the planetary boundary layer. However, the fold itself is a reversible process, so for permanent stratosphere- troposphere exchange to take place the air in the fold must mix irreversibly with the outside environment. This necessary mixing has been attributed to Kelvin- Helmholtz-induced turbulence [Shapiro, 1980], bound- ary layer turbulence [Johnson and Viezee, 1981], strato- spheric streamer fragmentation and roll up [Appenzeller et al., 1996], and localized wet convection [Langford and Reid, 1998]. However, few direct observations of the ex- change process exist, and it is far from clear which, if any, of these proposed mixing mechanisms is dominant.
In this paper we present observations made through two tropopause folds with in situ and remote sensing instruments aboard a DC-8 during the NASA Sub-
•Department of Earth, Atmospheric, and Planetary Sciences, Massachusetts Institute of Technology, Cambridge.
2NASA Ames Research Center, Moffett Field, California. 3NASA Langley Research Center, Hampton, Virginia.
4Science Applications International Corporation, Hampton, Virginia. 5NASA Jet Propulsion Laboratory, Pasadena, California.
6NASA Goddard Space Flight Center, Greenbelt, Maryland.
Copyright 1999 by the American Geophysical Union.
Paper number 1999JD900430. 0148-0227/99/1999JD900430509.00
sonics Assessment (SASS) Ozone and Nitrogen Exper- iment (SONEX) [Singh et al., 1999]. Although the primary purpose of this mission was not the study of stratosphere-troposphere exchange, the extensive col- lection of chemical, dynamical, and thermal measure- ments in the upper troposphere enabled us to examine examples of tracer transport around tropopause folds.
2. Instrument Descriptions
SONEX was conducted between October 7, 1997, and November 12, 1997, and was aimed at studying the chemical effects of aircraft emissions in the North At-
lantic flight corridor. The measurement platform was a DC-8 equipped with 16 scientific instruments. Below we briefly describe the instruments relevant for this pa- per: the meteorological measurement system (MMS), the differential absorption lidar (DIAL), the microwave temperature profiler (MTP), the in situ ozone probe, the differential absorption CO measurement (DACOM), and the laser hygrometer.
The MMS measured the air velocity with respect to the aircraft and the aircraft velocity with respect to the Earth and combined the two vectors to get the zonal u, meridional v, and vertical w wind components. The air motion system consisted of two 5-hole differential pressure probes (Rosemount 858Y), three total temper- ature probes with different response times, a pitot static pressure probe, and a dedicated static pressure sys- tem. The aircraft motion sensing system consisted of a high-resolution inertial navigation device (Litton LTN- 72RH), an embedded GPS ring laser inertial navigation instrument (Litton LN-100G), and a multiple-antenna GPS attitude reference system (Trimble TANS Vector).
21,549
21,550 CHO ET AL.: TROPOPAUSE FOLD INSTABILITIES
The data stream was sampled at 65 Hz, then subse- quently reduced to 5 and 1 Hz for postmission analysis. Pressure p and temperature T were also obtained from these probes, and then potential temperature 0 was cal- culated from those values. The turbulent energy dissi- pation rate e was estimated from a frequency band of 0.8 to 1.5 Hz. For data accuracy, resolution, and the method for estimating e, see (fhap., et al. [1998].
The DIAL system was used to remotely measure ozone and aerosols in the zenith and nadir directions.
Two frequency-doubled Nd:YAG lasers were used to pump two frequency-doubled, tunable dye lasers. One of the dye lasers was operated at 292 nm for the DIAL on-line wavelength of ozone, and the other one was op- erated at 300 nm for the off-line wavelength. The out- put beams were transmitted out of the aircraft coax- ially with the receiver telescopes. The backscattered laser energy was collected by two back-to-back 36-cm- diameter telescopes. The analog signals from the de- tectors were digitized at 5 MHz to a 12-bit accuracy, and the averaged digitized signals were stored every 2 s. The data sampling resolutions used in our study are 90 m in altitude and 60 s in time. An earlier version
of this instrument made the first remote measurements
of ozone and aerosols across a tropopause fold [Brow- ell et al., 1987]. More details on the system are avail- able elsewhere [Browell et al., 1998; W. B. Grant et al., Observations of tropical boundary layer air masses in the northern midlatitude upper troposphere during SONEX, submitted to the Journal of Geophysical Re- search, 1999].
The MTP, a passive microwave radiometer, measured the natural thermal emission from oxygen molecules at three frequencies (55.51, 56.66, and 58.79 GHz). It is viewed at 10 elevation angles between -800 and 800 using a scanning mirror, yielding a vertical tempera- ture profile from near the surface to 24 km for each 16-s cycle. The altitude resolution was thus variable, being best (-,150 m) near the aircraft altitude, and de- grading with distance from the aircraft. The postflight results were calibrated against 42 rawinsondes launched near the DC-8 flight track during the two transit flights between California and Maine. These provided an ab- solute accuracy of 0.5 K rms near the aircraft altitude; this degrades with distance, becoming <<1.5 K rms 3 km away. See Denning et al. [1989] for further information.
Ozone was measured in situ with the NO + 03 chemi- luminescence principle [Clough and Thrush, 1967]. On the basis of the sample exchange rate at sea level the re- sponse time of the probe was estimated to be ,-•1 s with faster response at higher altitudes. Samples were taken at 6 Hz then averaged to I Hz. The data were further corrected for water vapor quenching effects using the hygrometer measurements. The accuracy is estimated to be 5%, or 2 ppbv, and the precision is estimated to be 2%, or 0.8 ppbv.
The DACOM measured CO, N20, and CH4 in situ with a folded path, tunable diode laser spectrometer
using a differential absorption technique [Sachse et al., 1987; Collins et al., 1996]. Again, the response time was estimated to be ~1 s based on the sample exchange rate. There were quasiperiodic gaps in the data of order 30 s every ~10 min because of the real-time calibration pro- cedure, which was necessary to account for slow drifts in instrument sensitivity.
The laser hygrometer consisted of a compact laser transceiver mounted to an aircraft window plus a sheet of retroreflecting "road sign" material affixed to an outboard engine enclosure to complete the optical loop. Using differential absorption techniques, H20 was sensed along this external path to an estimated preci- sion of 2% in mixing ratio with a response time of 50 ms. See S. Vay et al. (Tropospheric water vapor measure- ments over the North Atlantic during SONEX, submit- ted to the Journal of Geophysical Research, 1999) for further details.
3. Observations
After two test flights out of its home base at Moffett Field, California, the DC-8 flew cross-country to Ban- gor, Maine, on October 13, 1997. A prominent strato- spheric intrusion was present over the northcentral plains, and the DC-8 traversed its south end (Plate 1). The section of the tropopause fold penetrated by the aircraft was downstream of a trough and on the west side of a jet at the aircraft level. Satellite images showed a clear column of air along the eastern flank of the in- trusion bordered farther east by a line of storm clouds associated with an accompanying lower-level cold front. Details will be shown and discussed in section 3.1.
During the next flight on October 15, 1997, the DC- 8 encountered another stratospheric intrusion over the mid-Atlantic as it flew from Bangor to Shannon, Ire- land (Plate 2). This time the fold existed on both the upstream and downstream sides of the trough. The air- craft, flying at --•3 km, passed through the lower tip of the western branch of the fold, then again traversed the same fold as it ascended steeply to over ? km. It then entered the main body of the intrusion and ascended in steps as it crossed through to the eastern side. The ver- tical cross-sectional view will be shown and discussed in section 3.2.
Some of the subsequent flights during SONEX also sampled stratospheric intrusions, but we will focus our analysis on these two events because only in these cases did the aircraft ascend (or descend) through a tropopause fold giving us vertical profiles of data nec- essary for estimating high-resolution gradient and flux quantities.
3.1. Case 1: October 13, 1997
Plate 3 is a "curtain plot': of ozone concentration measured by the DIAL as the DC-8 flew under then up through the tropopause fold. The DC-8 was fly- ing at a fairly constant air speed of •220 m s -1 (the
CHO ET AL.: TROPOPAUSE FOLD INSTABILITIES 21,551
_
EPV (K m^2/kg s)
1.0e-05 8.5e-06 7.0e-06 5.5e-06 4.0e-06 2.5e-06 1.0e-06 -5.0e-07 -2.0e-06
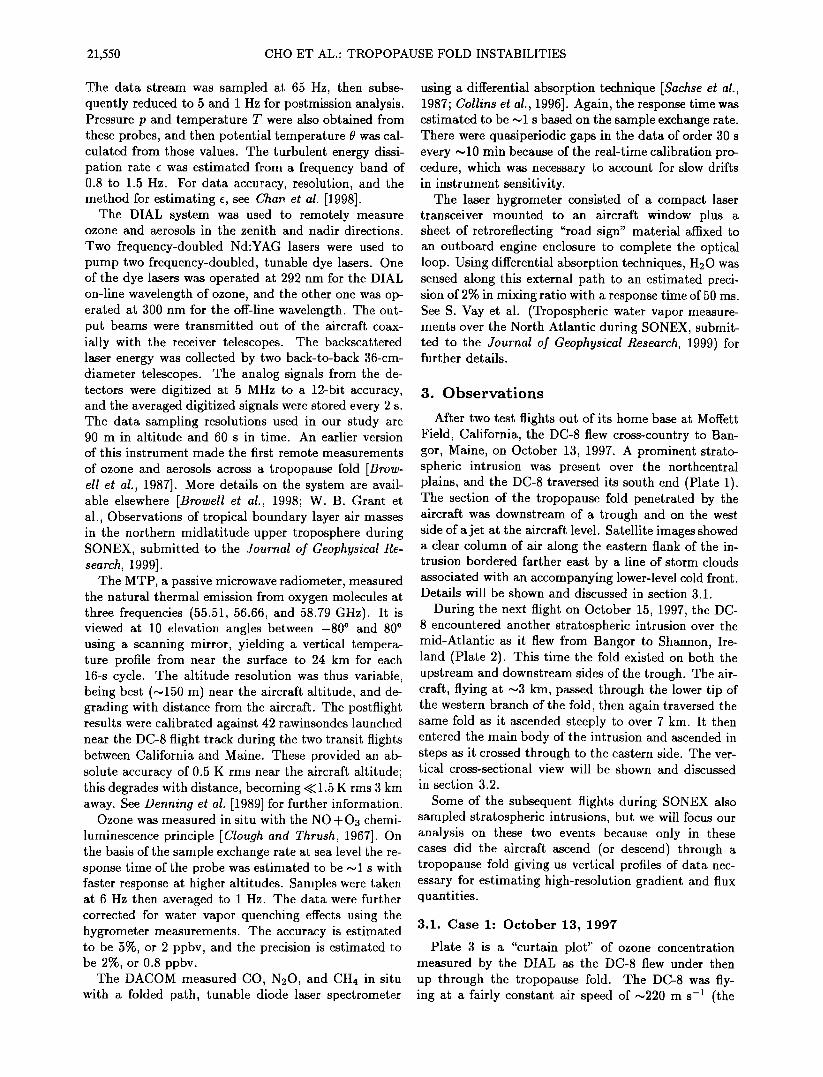
Plate 1. Map of geopotential height in decameters (red contour lines), Ertel's potential vorticity (color scale), and horizontal winds (yellow vectors) on the 330-K surface for 1200 UT, October 13, 1997. The scaling on the wind vectors is standard: one flag is 50 m s -•, one bar is 10 rn s -•, and one half bar is 5 m s -• The plotted field values were output from a model run by the Data Assimilation Office of t•e NASA Goddard Space Flight Center (A.M. Thompson et al., The Goddard/Ames meteorological support and modeling system during SONEX: Evaluation of analyses and trajectory-based model products, submitted to the Journal of Geophysical Research, 1999). The longitudinal and latitudinal grid spacing used by the model was 2.5 ø by 2 o . The white line shows the flight path of the DC-8, which departed Moffett Field, California, at 1519 UT and landed in Bangor, Maine, at 2241 UT.
ground speed was slightly higher), so roughly 1 hour corresponds to •800 km. Because of the incomplete overlap of the transmitted beam and the receiver field of view at close range, there were no data from the DIAL in the height range delineated by the dashed lines. In this region the data were linearly interpolated by also including the in situ measurement of ozone at the air- craft level, hence the vertical blurring of the image in this zone. The apparent widening of the fold where the aircraft cut across it was probably not real.
In situ measurements of trace gases reveal the fine structure present within the fold (Figure 1). The de- tailed anticorrelation of Oa versus CO, N20, and H20 shows the intermingling of stratospheric and tropo- spheric air. (The CH4 trace, not shown here, was virtu- ally identical to that of CO.) Within what appeared to be the main body of the fold from ~18.04 (1802:24) to ~18.09 (1805:24) UT the gradient in the ozone concen- tration was mainly in the vertical (upward) direction.
(Whenever the time is given in decimal hour notation we will also give it in standard notation in parenthe- ses. All figures and plates with time axes are labeled in decimal hours UT.) We deduce this from the obser- vation that ozone remained steady as the aircraft was at level flight in the first half, while it increased as the aircraft ascended, and also from the positive correlation between small-scale fluctuations of ozone and potential temperature in Figure 2. Just after 18.06 (1803:36) UT when the aircraft began to ascend, there was a rapid oscillation in the trace constituent concentrations. We
will argue in section 3.1.1 that this was a manifestation of a Kelvin-Helmholtz instability.
As the aircraft continued to climb, there was a sec- ondary maximum in the ozone measurement (and min- ima in the other shown constituents) just after 18.11 (1806:36) UT. A possible third local maximum in ozone began •18.14 (1808:24) UT. The sharp edge on the topside of the main fold and this secondary maxima

21,552 CHO ET AL.: TROPOPAUSE FOLD INSTABILITIES
EPV (K m^2/kg s)
1.0e-05 8.5e-06 7.0e-06 5.5e-06 4.0e-06 2.5e-06 1.0e-06 -5.0e-07 -2.0e-06
Plate 2. Same as Plate 1, except, for October 15, 1997. The DC-8 departed Bangor at 1211 UT and landed in Shannon, Ireland, at 1821 UT.
are reminiscent of past in situ observations [Danielsen et al., 1970; Shapiro, 1974; Danielsen and Mohnen, 1977; Johnson and Viezee, 1981]. Unfortunately, the resolution and the near-field blind zone of the DIAL did not allow us to observe the two-dimensional character of these substructures.
The dynamical measurements are displayed in Fig- ure 3. The increase in horizontal wind speed, especially in the meridional, as the aircraft ascended through then away from the fold is consistent with the classic picture of the jet stationed above the topside of the tropopause fold, inducing the secondary circulation necessary for folding. Clearly, the background wind shear was quite strong in this region beneath the jet. The rapid oscil- lation seen just after 18.06 (1803:36) UT in the tracers are also visible here, especially in 0 and u. Turbulence, as indicated by log e, peaked at the edge of the main fold's topside (18.09 (1805:24) UT), around the •e•o•d ozone maximum (•18.12 (1807:12) UT), and at the be- ginning of the third ozone maximum (just before 18.14 (1808:24) UT). There appears to be some correlation between •, relative upward motion, and a decrease in dO/dz, which is suggestive of convective instability.
3.1.1. Dynamical (Kelvin-Helmholtz) instabil- ity. Let us now look closer at the rapid oscillations
observed in both chemical and meteorological quanti- ties shortly after 18.06 (1803:36) UT. Figure 2 shows the periodic undulations in tracer and dynamical mea- surements suggestive of Kelvin-Helmholtz (KH) billows. The perturbations in v were much smaller than in u, which is consistent with the plane of the vertical shear (estimated from the data to be 59 ø , measured clockwise from the north) being in closer alignment in the zonal direction than in the meridional direction.
Assuming that the oscillations were, indeed, KH bil- lows, we can estimate their horizontal wavelength and vertical thickness. Along the aircraft heading the pe- riod was •5.5 s, which translates to a length of 1.23 km at the aircraft speed of 224 m s -1. Since the air- craft heading was 102 ø, this yields a true horizontal wavelength of hh = 1230 cos(102 ø--59 ø) = 900 m. The vertical thickness is then given by the relation- ship Az = Aa/7.5 = 120 m [Miles and Howard, 1964]. These numbers are quite similar to those of rapid os- cillations observed near the tropopause by a uniquely high-resolution radar experiment [Cho et al., 1996].
However, the calculated gradient Richardson number for the height interval across the presumed KH layer is Ri = 0.52, which is larger than the classic instability criterion of 0.25. It could be that the aircraft was al-

CHO ET AL' TROPOPAUSE FOLD INSTABILITIES 21,553
200
150
•100
50
SONEX DC-8 1997/10/13 i i i ! i i
. .
'•' 80
0 60 40
314
,-, 312
.•.• 310
ø•308 z
306
120
100 80
60
E •-7 N •
ß ,
6 i , i i , , 18.02 18.04 18.06 18.08 18.1 18.12 18.14 18.16
UT (h)
Figure 1. Plots, from top to bottom, of O3, CO, N20, and H20 mixing ratios through the tropopause fold region on October 13, 1997, and the pressure altitude of the aircraft.
ready within the instability layer as it began its ascent, since the oscillation in the data began just as the climb began. If this were true, then the extra wind shear nec- essary to bring Ri down to 0.25 may have existed just below the aircraft height at 18.06 (1803:36) UT. Also, the instability may have been in a decay phase where Ri could be larger than 0.25. Finally, because the air- craft flew more horizontally than vertically, horizontal gradients could have mapped into the estimated vertical gradients and caused them to be underestimated.
Because the apparent KH instability occurred in the middle of the tropopause fold, it would not have been ef- fective in mixing the air inside the fold with the air out- side. Mainly, it would have smoothed the vertical gradi- ents of quantities within the instability layer. In terms of stratosphere-troposphere exchange we are more inter- ested in turbulence occurring at the edge of the fold and also around the secondary maxima observed in ozone just outside the main fold region.
3.1.2. Convective (Rayleigh-Taylor) instabil- ity. We now turn our attention to the topside of the tropopause fold and to the secondary maxima in ozone that followed shortly. The bottomside of the fold was not associated with any appreciable turbulence, so we will not discuss it here.
Figure 4 shows the changes in the squares of the Brunt-V&tishl//frequency N and vertical shear in hor- izontal winds dU/dz as well as the resulting Ri. For ease of comparison, we display log e, w, and ozone con- centration below them. To calculate the vertical gra- dients, we fit a straight line in a least squares sense to the quantity versus altitude for an interval 4-60 rn from the data point. This 120 m represents the outer scale of turbulence Lo, which varies according to L0 - (2rr/O.62)eZ/2 -3/2[Weinstock, 1978]. We get Lo - 120 rn if we take e - 4 x 10 -4 W kg -z (the high value measured by the MMS in this vicinity) and N 2: 2 x 10 -4 rad 2 s -2 (a typical value calculated from MTP

21,554 CHO ET AL.- TROPOPAUSE FOLD INSTABILITIES
•' 170 •- 160 • 150 0•140
•, 65 •. 60
0 55 o 50
,-, 311
•310
SONEX DC-8 1997/10/13
0•309 ........ z
> ,
E 70
0 60
•' 29 ,•E 28
27
•, 20 E,•18 • 16
,_, 0.5
• -0.5
317 ..........
315
313
•-7 0)-8 o
18.059 18.06 18.061 18.062 18.063 18.064 18.065 18.066 18.067 18.068 18.069
UT (h)
Figure 2. Expanded time plots, from top to bottom, of O3, CO, N20, H20, the zonal wind component u, meridional wind component v, vertical wind component w, potential temperature •, and turbulence log e from October 13, 1997.
profiles). Also, the observation of a nearby dynamically unstable layer of the same thickness indicates that this is a reasonable value.
For regions with Ri < 0.25, there was a clear corre- spondence between high thermal stability N 2 and high vertical shear. This preference for dynamic instability to occur across layers of enhanced thermal stability is in keeping with both theory [Phillips, 1966] and past ob- servations [e.g., Fritts and Rastogi, 1985]. There was also a convectively unstable period between •18.116
(1806:58) and -18.124 (1807:26) UT when N 2 and Ri became negative. Note that the vertical shear was very low during this time, which is consistent with the convective instability of high-frequency gravity waves in both theory and laboratory observations JOvianski, 1972]. The same region experienced strong turbulence and large perturbations in upward velocity, which also points to convective instability. Furthermore, the grav- ity wave breakdown interpretation is supported by a wavelike perturbation in u, v, and 0 with maxima in

CHO ET AL' TROPOPAUSE FOLD INSTABILITIES 21,555
4O
o• 35
• 30
25
SONEX DC-8 1997/10/13
6O
m 40 E
v
• 20
-1
-3
33O
325 320
315
18.02 18.04 18.06 18.08 18.1 18.12 18.14 18.16
UT (h)
Figure 3. Plots, from top to bottom, of u, v, w, log e, and 0 through the tropopause fold region on October 13, 1997.
the wind components and minima in dO/dz at •018.09 (1805:24) and ,-•18.12 (1807:12) UT. Even the enhance- ments in fine-scale u and v perturbations at the "crests" are suggestive of wave breakdown. Although N 2 did not become negative •18.09 (1805:24) UT, it did reach a local minimum. If the gravity wave breakdown expla- nation is correct, then the secondary ozone maximum ,-•18.12 (1807:12) UT was probably the result of either vertical wave advection of the tropopause fold or up- ward, irreversible turbulent mixing of ozone or both.
Of course, vertical gradient quantities calculated from a slantwise flight are only approximations. Remotely sensed data from the MTP did not indicate a supera- diabatic lapse rate--•18.12 (1807:12) UT, but the in- strument only gave a reading every 16 s with a vertical resolution of about •150 m, so it could have missed a localized instability. To examine the situation in two
dimensions, we can draw upon past numerical mod- els of convectively breaking gravity waves. Figure 5 is a sequential schematic of three potential tempera- ture isopleths perturbed by a gravity wave until con- vective overturning occurs. The heavy lines indicate the hypothetical paths of an ascending aircraft and po- tential temperature increases with height as indicated. Note that dO/dl, the gradient along the aircraft path, only becomes negative as the isopleths tilt more steeply than the aircraft ascent angle. Although only a quali- tative sketch, an important feature illustrated here that is seen in models is the stretching of the isentrope spacing in the horizontal direction as the wave grows [e.g., Walterscheid and Schubert, 1990]. Typically, as the overturning begins, the potential temperature hor- izontal gradient is an order of magnitude less than the background vertical gradient. If the aircraft could as-

21,556 CHO ET AL.' TROPOPAUSE FOLD INSTABILITIES
x 10 -4 SONEX DC-8 1997/10/13
O.75
0.5
0.25
0
-0.25
•-3
•-5 •-7
o_ 9
.• 2oo >
'" 150
"'•100
O 50 18.07 18.08 18.09 18.1 18.11 18.12 18.13 18.14 18.15 18.16
UT (h)
Figure 4. Plots, from top to bottom, of the Brunt-V•iis•il•i frequency squared N 2, vertical shear squared (dU/dz) 2, Richardson number Ri, log e, w, and Oa mixing ratio from October 13, 1997.
cend purely vertically, then convective instability would be detected as dO/dl = dO/dz < 0; however, since it was moving mostly horizontally in this case (at a slope of-•1:50), if the magnitude of dO/dl was more than, say, one tenth of the background vertical gradient, then there would be strong evidence for convective instabil- ity. Around 18.12 (1807:12) UT we estimate the back- ground potential temperature vertical gradient to have been -•0.007 K m -• from the MTP, while MMS data showed that IdO/dll (negative gradient) reached as high as 0.003 K m -•, thus supporting the conclusion that there was an area of convective instability there.
3.1.3. Tropopause fold •urbulen• ozone flux. We can now estimate the vertical tracer flux from the
tropopause fold to the ambient troposphere induced by turbulence generated by convective and dynamical in- stabilities. We will use ozone as the example tracer.
For a stably stratified (N 2 > 0) environment we ap- ply the vertical eddy diffusivity
Kz - O:N--- • , (1) where c• is a proportionality factor that varies with the flow conditions [e.g., Itsweire et al., 1986]. We invoke the expression derived by We•nstock [1992]
where L• = -2(2)X/2p'(Op/Oz)-• is the vertical energy- containing scale of turbulence with p• the rms air density fluctuation and p the background air density, L•, - 2•reX/2N -a/2 is the buoyancy scale, and Lv = 31•,a/4e-•/4 is the viscous dissipation scale with kine- matic viscosity •, = 1.458 x 10⁻⁶Ta/2/[(T + 110.4)p] ( Sutherland 's formula). Here p can be calculated from p and T through the ideal gas law p = pRT, where R is the gas constant for air.

CHO ET AL.- TROPOPAUSE FOLD INSTABILITIES 21,557
o o
(^qdd) o!l•l:J õu!x!lAI ouozo ß q' Od 0 0 0 0 0
(W>l) epnl!llV

21,558 CHO ET AL.: TROPOPAUSE FOLD INSTABILITIES
dO/dz > 0 • I
dO/dl > 0
dO/dl = 0
z d0/dl < 0
Figure 5. Sequential schematic of three potential tem- perature isopleths perturbed by a gravity wave until convective overturning occurs. The heavy lines repre- sent the hypothetical paths of an ascending aircraft. The length variable along these paths is l, and z is up- ward and x is horizontal. The dO/dl values are for the center dot area.
For unstable and neutral conditions (N 2 _< 0), we use
0•, az, (3)
where/7 is an empirical constant, g is the gravitational acceleration, A0 and Az are the vertical temperature difference and thickness across the unstable region, and K,• is the molecular diffusivity [Kraichnan, 1962; Or- lanski and Ross, 1973]. We choose/• = 0.08, following the laboratory results of Ingersoll [1966]. Using the relation K,•/u = 1.34 [Chapman and Cowling, 1970], Sutherland's formula, and the ideal gas law, (3) be- comes
Kz _ 1.57 x 10_3 [ g[AOI O(T+ 110.4) p T•Az, (4)
where p is in hPa. The vertical flux of trace constituent mixing ratio •( is then given by
dx ß • ---•c• d-7 (•)
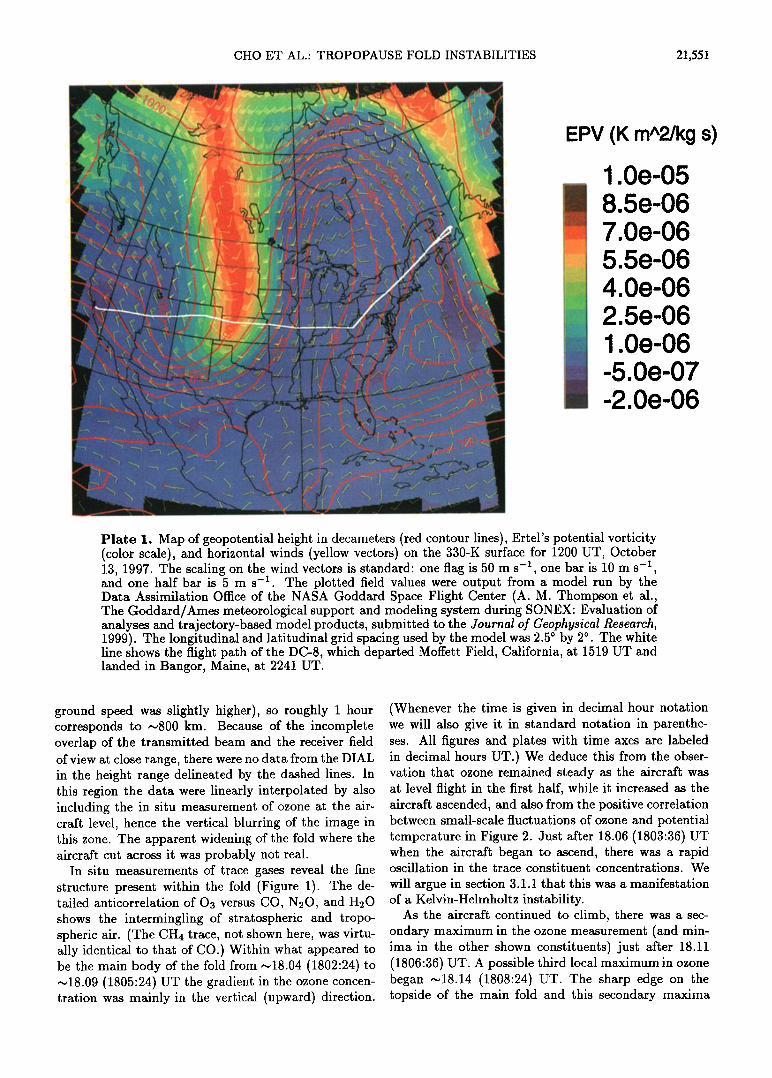
Figure 6 shows the resulting Kz and (I)o3 calculated for the same period as covered by Figure 4. The ozone mixing ratio and its vertical gradient are also plotted for reference. The background gradient quantities were calculated in the same way as for Figure 4. Between
--•18.115 (1806:54)and 0-•18.125 (1807:30) UT when N 2 _<0, we took IzXOl- 1.5 K ZXz- 225 m for (4).
Kz is relatively constant in this region because the T and p fluctuations in (4) were much smaller than the e fluctuations in (1). Although it may be counterintu- itive that convective instability would not yield a much larger Kz, the reduction of the local vertical gradient by the breaking wave limits the turbulent vertical con- stituent flux [Fritts and Dunkerton, 1985]. The largest ozone flux is upward from the topside of the "main" body of the tropopause fold, which is interesting since one usually thinks of stratosphere-to-troposphere trans- fer in terms of downward flux. The values are in excel-
lent agreement with those estimated by Shapiro [1980] (q)o• = 1.3-1.4 m s -• ppbv on the topside of folds), which is remarkable considering that we used a com- pletely different estimation method. The average value of K• = 4.4 m 2 s -• calculated by Danielsen et al. [1987] from a simple three-dimensional model of a tropopause fold is somewhat larger than our values but not very different considering the variability of the fold struc- ture. We did not calculate q)o• for the bottomside of the fold because the aircraft was flying level there and we could not estimate the vertical gradient quantities. However, as seen in Figures I and 3, the turbulence was very much weaker on the bottomside, so we believe the vertical mixing there was negligible.
We must, however, insert a cautionary note regard- ing our estimates of Kz and q)o•. First, as mentioned before, horizontal gradients may be mapped into verti- cal gradients estimated from slant path data. Although Kz is dominated by e variations, q)o• is linearly pro- portional to the vertical ozone gradient. Thus the ver- tical ozone gradient is a crucial quantity, especially its sign. The "vertical" structure of the tropopause fold up to 18.1 (1806:00) UT matches nicely with the DIAL ozone data above and below. In fact, a comparison with q)o• calculated with the interpolated DIAL ozone pro- files supports the negative ozone gradient (and upward flux) just after 18.09 (1805:24) UT. However, the up- ward gradients (and downward fluxes) •018.11 (1806:36) and -,-18.14 (1808:24) UT are not observed in the DIAL- derived results. The associated ozone features were too
small scale and local to show up in the DIAL data, and therefore we cannot confirm that the vertical gradient features there were not mainly produced by horizontal structures.
Second, (3) is not the only eddy diffusion formula- tion proposed for convective turbulence. For example,
INI has also been suggested [Priestley, 1954; Lilly, 1962], which yields much higher Kz values for our two cases, so there is considerable uncertainty in eddy diffusivity under convective turbulence. How- ever, there are theoretical reasons and experimental ev- idence favoring (3) [Globe and Dropkin, 1959; Kraich- nan, 1962; Ingersoll, 1966]. Third, the method of es- timating e from 5-Hz dynamical measurements as out- lined by Chan et al. [1998] has not been fully verified

CHO ET AL.- TROPOPAUSE FOLD INSTABILITIES 21,559
(^qdd) o!•eEI õu!x!• eu0zo c) o o
(W)l) ep n•,P, IV

21,560 CHO ET AL' TROPOPAUSE ];'OLD INSTABILITIES
(•s/•pm) aN
(trot) opnl!11¾ oJrl$$oJcl
CHO ET AL.: TROPOPAUSE FOLD INSTABILITIES 21,561
200
,-, 150
0•100
5O
SONEX DC-8 1997/10/13
• 0.5 E
,', 0
o
'• -1
2.5
2
1.5
1
0.5
ß i i i ß i
ß . ß
1.5
-0.5 18.t }7 18.08 18.09 18.1 18.11 18.12 18.13 18.14 18.15 18.16
UT (h)
Figure 6. Plots, from top to bottom, of 03 mixing ratio, vertical gradient of 03 mixing ratio, vertical eddy diffusivity Kz, and vertical flux of 03 mixing ratio from October 13, 1997.
by comparison with other instruments. We decided to use the Kz approach because the 1-s resolution of the tracer measurements was not fine enough for a direct eddy correlation (w/x •, where the primed quantities are perturbations from the means) approach. In i s the air- craft traverses over 200 m, so the Nyquist length scale would be greater than the turbulent eddy scale, so w•x • would not represent turbulent flux, which is what we wanted in our investigation of irreversible transport.
3.2. Case 2: October 15, 1997
Plate 4 shows in color-scale form the vertical pro- files of ozone concentration measured by the DIAL as the aircraft encountered the western branch of the tropopause fold (see also Plate 2). The apparent discon- tinuity in the fold was caused by the DIAL's near-field blind zone, marked by dashed lines in Plate 4. Thus the fold was not visible inside the blind zone except where the aircraft intersected it with the in situ probe. Following this "connect-the-dots" mental picture of the
fold, one can see that the aircraft crossed it horizontally from topside to bottomside .-•14.9 (1454:00) UT, then ascended through it from bottomside to topside •015.1 (1506:00) UT. This scenario is supported by the plot of stability as characterized by N 2 calculated from the MTP temperature profiles (Plate 5). Although instru- mental problems cut off the data at 15.16 (1509:36) UT, we can still see the layer of very stable stratospheric air extending down from the right-hand edge of the plot, leftward across the flight line •15.1 (1506:00) UT, then down again through the flight path .-•14.9 (1454:00) UT.
Figure 7 again shows the anticorrelation of O3 versus CO and CH4, clearly indicating the encounter with a lower portion (height .-•3 km) of the tropopause fold at .-•14.9 (1454:00) UT and a higher section (height •4 km) at 15.1 (1506:00) UT. The aircraft began enter- ing the main body of the stratospheric intrusion .-•15.4 (1524:00) UT. We note the similarity of the upper part of the fold to case i in that the sharply defined top- side was followed by a couple of weaker perturbations.

21,562 CHO ET AL.' TROPOPAUSE FOLD INSTABILITIES
120
100
80
6O
40
SONEX DC-8 1997/10/15
o o 80
60
..• 800
•11780 (,•1760
1740
2 14.8 14.9 15 15.1 15.2 15.3 15.4 15.5
UT (h)
Figure 7. Plots, from top to bottom, of 03, CO, and CH4 mixing ratios through the two intersections with the western branch of the tropopause fold region on October 15, 1997, and the pressure altitude of the aircraft.
There was also a hint of a wavelike structure in the
ozone trace on the the more diffuse bottomside. Fortu-
nately, the aircraft was ascending through this region, so we will be able to estimate the vertical gradient quan- tities needed for instability analyses as we did for case 1.
The corresponding dynamical measurements are dis- played in Figure 8. In the ascent region of interest (15.05-15.3 (1503:00-1518:00) UT), there was a zone of strong vertical shear and regular oscillations in w •,15.1 (1506:00) UT (more easily seen in Figure 9) correspond- ing to the second fold encounter. Together with the wavy bottomside seen in ozone, this suggests the pres- ence of KH billows. Immediately following the shear zone was a fast oscillation with period •,0.01 hours in u that grew quickly with height and/or horizontal distance and appeared to break •,15.14 (1508:24) UT corresponding to a maximum in e and to the sec-
ondary ozone maxima. This oscillation is marked by a horizontal bar with vertical tick marks separated by 0.01 hours above the u trace in Figure 8. This combi- nation of dynamical and tracer observations was also seen in case 1, which we interpreted to be convec- tively breaking gravity waves. In this case the small- scale wave was superimposed on a larger-scale wave with period •,0.1 hours that also grew in amplitude with height and/or horizontal distance and appeared to break -•15.3-15.4 (1518:00-1524:00) UT. (This oscil- lation is marked by a horizontal bar with vertical tick marks separated by 0.1 hours below the u trace in Fig- ure 8.) Note the strong enhancement in e -•15.3-15.4 (1518:00-1524:00) UT. One can also see that dO/dz was close to zero in the areas of suspected convective wave breaking. With one-dimensional measurements such as we have it is not possible to unambiguously deter-
CHO ET AL.' TROPOPAUSE FOLD INSTABILITIES 21,563
2O
E 10
0
SONEX DC-8 1997/10/15
-2O
-40
-60
-80
-1
330
320 310
300
14.8 14.9 15 15.1 15.2 15.3 15.4 15.5
UT (h)
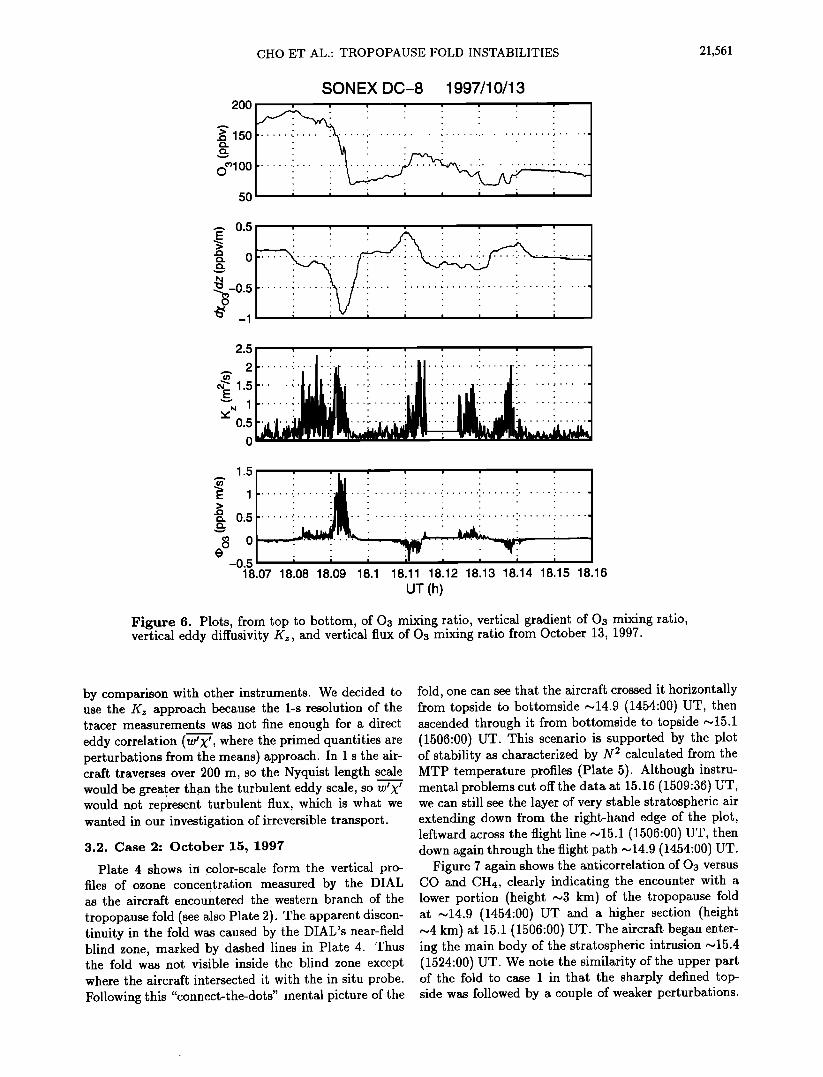
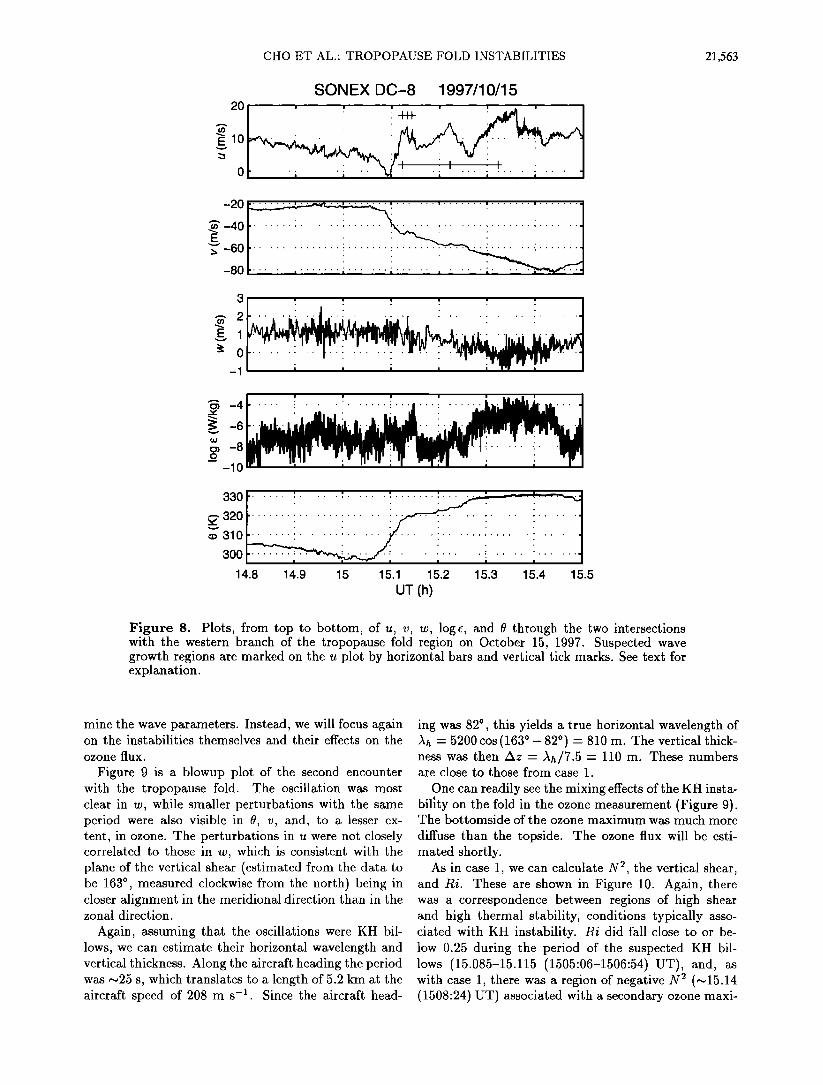
Figure 8. Plots, from top to bottom, of u, v, w, log e, and 0 through the two intersections with the western branch of the tropopause fold region on October 15, 1997. Suspected wave growth regions are marked on the u plot by horizontal bars and vertical tick marks. See text for explanation.
mine the wave parameters. Instead, we will focus again on the instabilities themselves and their effects on the
ozone flux.
Figure 9 is a blowup plot of the second encounter with the tropopause fold. The oscillation was most clear in w, while smaller perturbations with the same period were also visible in •, v, and, to a lesser ex- tent, in ozone. The perturbations in u were not closely correlated to those in w, which is consistent with the plane of the vertical shear (estimated from the data to be 1630 , measured clockwise from the north) being in closer alignment in the meridional direction than in the zonal direction.
Again, assuming that the oscillations were KH bil- lows, we can estimate their horizontal wavelength and vertical thickness. Along the aircraft heading the period was --•25 s, which translates to a length of 5.2 km at the aircraft speed of 208 m s -1 Since the aircraft head-
ing was 82 ø, this yields a true horizontal wavelength of An = 5200 cos(163 ø -82 ø) = 810 m. The vertical thick- ness was then Az = •a/7.5 = 110 m. These numbers are close to those from case 1.
One can readily see the mixing effects of the KH insta- bility on the fold in the ozone measurement (Figure 9). The bottomside of the ozone maximum was much more
diffuse than the topside. The ozone flux will be esti- mated shortly.
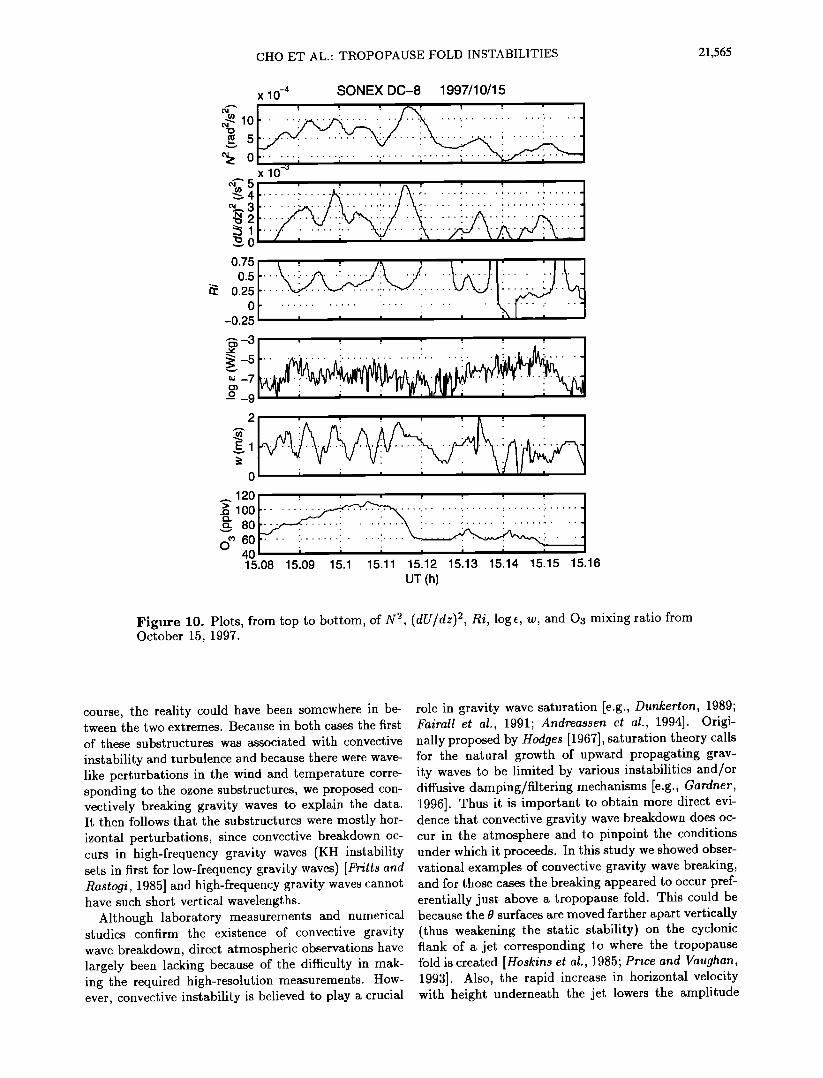
As in case 1, we can calculate N 2, the vertical shear, and Ri. These are shown in Figure 10. Again, there was a correspondence between regions of high shear and high thermal stability, conditions typically asso- ciated with KH instability. Ri did fall close to or be- low 0.25 during the period of the suspected KH bil- lows (15.085-15.115 (1505:06-1506:54)UT), and, as with case 1, there was a region of negative N 2 (•15.14 (1508:24) UT) associated with a secondary ozone maxi-

21,564 CHO ET AL- TROPOPAUSE FOLD INSTABILITIES
11o
90
70
50
SONEX DC-8 1997/10/15
15
-3O
E,• -40
-5O
2
310
300 15.08 15.09 15.1 15.11 15.12 15.13 15.14 15. t5 15.16
UT (h)
Figure 9. Expanded time plots, from top to bottom, of Os, u, v, w, and 0 from October 15, 1997.
mum and apparent wave breaking (as discussed above). Finally, we estimate the vertical ozone flux for this pe-
riod (Figure 11). Where N 2 < 0 •15.15 (1509:00)UT, we took IA01 = 0.8 K and Az = 80 rn for (4). The flux values are generally lower than for case 1. This is not surprising since the turbulence was weaker and the ozone gradients were smaller. Since the altitude of fold interception was lower in case 2 (-•4 km) than in case I (•6.5 km), the stratospheric air inside the fold would have had more time to mix with the surround-
ing tropospheric air, thus weakening the ozone gradient at the edges. This can also be seen in the peak ozone concentration inside the folds, -• 110 ppbv for case 2 ver- sus •190 ppbv for case 1. However, as in case 1, the estimated vertical ozone gradients of the substructures between 15.13 (1507:48) and 15.15 (1509:00) UT (and the corresponding fluxes) must be viewed with caution because of possible aliasing of horizontal gradients.
4. Summary Discussion
Even though the two cases of tropopause folding stud- ied here occurred at different times and places and were sampled at different altitudes, there were some striking similarities. Both folds had sharply defined topsides with two foldlike substructures shortly following that contained lower ozone amounts than the fold itself. It
is difficult to say whether these substructures were hor- izontal or vertical variations because the flight paths were one-dimensional and slantwise. Unfortunately, the near-field blind zone and coarse time resolution of the
DIAL did not allow two-dimensional mapping of these small-scale ozone perturbations. If the perturbations were purely horizontal, then their separation distances would have been ~ 10 and 8 km for case 1 and case 2, re- spectively. If they were purely vertical, then their sepa- ration distances were •400 and 200 m, respectively. Of
CHO ET AL.' TROPOPAUSE FOLD INSTABILITIES 21,565
•-'5
0.75
0.5
0.25
0
-0.25
'•-3
oo- 7
o_ 9
2
E1
0
x 10 -'• SONEX DC-8 1997/10/15
x10
i i i i •
120
80 60
40 15.08 15.09 15.1 15.11 15.12 15.13 15.14 15.15 15.16
UT (h)
Figure 10. Plots, from top to bottom, of N 2, (dU/dz) •, Ri, log e, October 15, 1997.
w, and O3 mixing ratio from
course, the reality could have been somewhere in be- tween the two extremes. Because in both cases the first of these substructures was associated with convective instability and turbulence and because there were wave- like perturbstie "• ;" *h .... ;.A •,•cl t.•m.poraf,]]r• cc•rre- sponding to the ozone substructures, we proposed con- vectively breaking gravity waves to explain the data. It then follows that the substructures were mostly hor- izontal perturbations, since convective breakdown oc- curs in high-frequency gravity waves (KH instability sets in first for low-frequency gravity waves) [Fritts and Rastogi, 1985] and high-frequency gravity waves cannot have such short vertical wavelengths.
Although laboratory measurements and numerical studies confirm the existence of convective gravity wave breakdown, direct atmospheric observations have largely been lacking because of the difficulty in mak- ing the required high-resolution measurements. How- ever, convective instability is believed to play a crucial
role in gravity wave saturation [e.g., Dunkerton, 1989; Fairall et al., 1991; Andreassen et al., 1994]. Origi- nally proposed by Hodges [1967], saturation theory calls for the natural growth of upward propagating grav- ity waves to be limited by various instabilities and/or diffusive damping/filtering mechanisms [e.g., Gardner, 1996]. Thus it is important to obtain more direct evi- dence that convective gravity wave breakdown does oc- cur in the atmosphere and to pinpoint the conditions under which it proceeds. In this study we showed obser- vational examples of convective gravity wave breaking, and for those cases the breaking appeared to occur pref- erentially just above a tropopause fold. This could be because the 0 surfaces are moved farther apart vertically (thus weakening the static stability) on the cyclonic flank of a jet corresponding to where the tropopause fold is created [Hoskins et al., 1985; Price and Vaughan, 1993]. Also, the rapid increase in horizontal velocity with height underneath the jet lowers the amplitude

21,566 CHO ET AL.' TROPOPAUSE FOLD INSTABILITIES
120
100
80
60
4O
.-. 0.2 E
"' 0
.• -0.2
SONEX DC-8 1997/10/15
1.5
'"' 0.5
0.2
0.1
0 o
-0.1 15.1
ß . .
)8 15.09 15.1 15.11 15.12 15.13 15.14 15.15 15.16
UT (h)
Figure 11. Plots, from top to bottom, of 03 mixing ratio, vertical gradient of 03 mixing ratio, Kz, and vertical flux of 03 mixing ratio from October 15, 1997.
threshold for wave breaking [Thorpe, 1978] and causes more gravity waves with phase velocities in the same direction as the background flow to reach critical levels and convective instability [ Thorpe, 1981; Fritts, 1982]. In any case, we need to add convectively breaking grav- ity waves to the list of mechanisms leading to the irre- versible mixing of tropopause folds with their environ- ment.
KH instabilities are much more commonly observed in the atmosphere (see, e.g., Fritts and Rastogi [1985] for references). We observed KH billows inside both tropopause folds encountered and noted a correlation between strong vertical shear and high static stability as anticipated theoretically [Phillips, 1966] and frequently observed [e.g., Browning et al., 1973]. In case 2 the KH instability had apparently acted on the bottomside ozone gradient and made it much more diffuse than the topside of the fold, whereas in case I the KH instability located in the middle of the fold was not effective in
mixing air inside and outside the fold.
The site of maximum ozone flux out of a tropopause fold was on the topside of case 1, with a peak value of •1.5 ppbv m s -x in good agreement with previous air- craft observations by Shapiro [1980]. In this particular case the instability was generated by a combination of background shear and wave-induced weakening of static stability.
Acknowledgments. The work at MIT was funded by NASA grants NAG2-1105, NAGl-1758, and NAGl-1901. The work performed by M. J. Mahoney was carried out by the Jet Propulsion Laboratory, California Institute of Tech- nology, under a contract with NASA. He also acknowledges the able assistance of Bruce L. Gary with the MTP data analysis. Finally, we would like to thank the DC-8 flight crew for their hard work.
References
Andreassen, (D., C. E. Wasberg, D.C. Fritts, and J. R. Isler, Gravity wave breaking in two and three dimensions,

CHO ET AL.: TROPOPAUSE FOLD INSTABILITIES 21,567
1, Model description and comparison of two-dimensional evolutions, J. Geophys. Res., 99, 8095-8108, 1994.
Appenzeller, C., H. C. Davies, and W. A. Norton, Fragmen- tation of stratospheric intrusions, J. Geophys. Res., 101, 1435-1456, 1996.
Browell, E. V., E. F. Danielsen, S. Ismail, G. L. Gregory, and S. M. Beck, Tropopause fold structure determined from airborne lidar and in situ measurements, J. Geophys. Res., 92, 2112-2120, 1987.
Browell, E. V., S. Ismail, and W. B. Grant, Differential ab- sorption lidar (DIAL) measurements from air and space, Appl. Phys. B, 67, 399-410, 1998.
Browning, K. A., G. W. Bryant, J. R. Starr, and D. N. Ax- ford, Air motion within Kelvin-Helmholtz billows deter- mined from simulaneous Doppler radar and aircraft mea- surements, Q. J. R. Meteorol. Soc., 99,608-618, 1973.
Chan, K. R., J. Dean-Day, S. W. Bowen, and T. P. Bui, Tur- bulence measurements by the DC-8 meteorological mea- surement system, Geophys. Res. Lett., 25, 1355-1358, 1998.
Chapman, S., and T. G. Cowling, The Mathematical Theory of Non-Uniform Gases, 423 pp., Cambridge Univ. Press, New York, 1970.
Cho, J. Y. N., R. F. Jurgens, and M. A. Slade, High- resolution stratospheric dynamics measurements with the NASA/JPL Goldstone solar system radar, Geophys. Res. Lett., 23, 1909-1912, 1996.
Clough, P. N., and B. A. Thrush, Mechanism of chemilumi- nescent reaction between nitric oxide and ozone, Trans. Faraday Soc., 63,915-925, 1967.
Collins, J. E., G. W. Sachse, B. E. Anderson, R. C. Harriss, K. B. Bartlett, S. T. Sandholm, L. O. Wade, L. G. Burney, and G. F. Hill, Airborne nitrous oxide observations over the western Pacific Ocean: September-October 1991, J. Geophys. Res., 101, 1975-1984, 1996.
Danielsen, E. F., and V. A. Mohnen, Project Duststorm report: Ozone transport, in situ measurements, and me- teorological analyses of tropopause folding, J. Geophys. Res., 82, 5867-5877, 1977.
Danielsen, E. F., R. Bleck, J. Shedlovsky, A. Wartburg, P. Haagenson, and W. Pollock, Observed distribution of radioactivity, ozone, and potential vorticity associated with tropopause folding, J. Geophys. Res., 75, 2353-2361, 1970.
Danielsen, E. F., R. S. Hipskind, S. E. Gaines, G. W. Sachse, G. L. Gregory, and G. F. Hill, Three-dimensional analy- sis of potential vorticity associated with tropopause folds and observed variations of ozone and carbon monoxide, J. Geophys. Res., 92, 2103-2111, 1987.
Denning, R. F., S. L. Guidero, G. S. Parks, and B. L. Gary, Instrument description of the airborne microwave temper- ature profiler, J. Geophys. Res., 9•,, 16,757-16,766, 1989.
Dunkerton, T. J., Theory of internal gravity wave satura- tion, Pure Appl. Geophys., 130,373-397, 1989.
Fairall, C. W., A. B. White, and D. W. Thomson, A stochas- tic model of gravity-wave-induced clear-air turbulence, J. Atmos. Sci., •,8, 1771-1790, 1991.
Fritts, D.C., The transient critical-level interaction in a Boussinesq fluid, J. Geophys. Res., 87, 7997-8013, 1982.
Fritts, D.C., and T. J. Dunkerton, Fluxes of heat and con- stituents due to convectively unstable gravity waves, J. Atmos. Sci., d, 2, 549-556, 1985.
Fritts, D.C., and P. K. Rastogi, Convective and dynamical instabilities due to gravity wave motions in the lower and middle atmosphere: Theory and observations, Radio Sci., 20, 1247-1277, 1985.
Gardner, C. S., Testing theories of atmospheric gravity wave saturation and dissipation, J. Atmos. Terr. Phys., 58, 1575-1589, 1996.
Globe, S., and D. Dropkin, Natural convection heat transfer in liquids confined by two horizontal plates and heated from below, J. Heat Transfer, 81, 156-185, 1959.
Hodges, R., Generation of turbulence in the upper atmo- sphere by internal gravity waves, J. Geophys. Res., 72, 3455-3458, 1967.
Hoskins, B. J., M. E. Mcintyre, and A. W. Robertson, On the use and significance of isentropic potential vorticity maps, Q. J. It. Meteorol. Soc., 111,877-946, 1985.
Ingersoll, A. P., Thermal convection with shear at high Rayleigh number, J. Fluid Mech., 25,209-228, 1966.
Itsweire, E. C., K. N. Helland, and C. W. Van Atta, The evolution of grid-generated turbulence in stratified fluid, J. Fluid Mech., 126,299-338, 1986.
Johnson, W. B., and W. Viezee, Stratospheric ozone in the lower troposphere, I, Presentation and interpretation of aircraft measurements, Atmos. Environ., 15, 1309-1323, 1981.
I(raichnan, R., Turbulent thermal convection at arbitrary Prandl number, Phys. Fluids, 5, 1374-1389, 1962.
Langford, A. O., and S. J. Reid, Dissipation and mixing of a small-scale stratospheric intrusion in the upper tropo- sphere, J. Geophys. Res., 103, 31,265-31,276, 1998.
Lilly, D. K., On the numerical simulation of buoyant con- vection, Tellus, ld,, 148-172, 1962.
Miles, J. W., and L. N. Howard, Note on a heterogeneous shear flow, J. Fluid Mech., 20,331-336, 1964.
Orlanski, I., On the breaking of standing internal gravity waves, J. Fluid Mech., 5d,, 577-598, 1972.
Orlanski, I., and B. B. Ross, Numerical simulation of the generation and breaking of internal gravity waves, J. Geo- phys. Res., 78, 8808-8826, 1973.
Phillips, O. M., The Dynamics of the Upper Ocean, 261 pp., Cambridge Univ. Press, New York, 1966.
Price, J. D., and G. Vaughan, On the potential for stratosphere-troposphere exchange in cut-off low systems, Q. J. It. Meteorol. Soc., 119,343-365, 1993.
Priestley, C. H. B., Convection from a horizontal surface, Aust. J. Phys., 7, 176-201, 1954.
Sachse, G. W., G. F. Hill, L. O. Wade, and M. G. Perry, Fast-response, high precision carbon monoxide sensor us- ing a tunable diode laser absorption technique, J. Geo- phys. Res., 92, 2071-2081, 1987.
Shapiro, M. A., A multiple-structured frontal zone-jet stream system as revealed by meteorologically instru- mented aircraft, Mon. Weather Rev., 102,244-253, 1974.
Shapiro, M. A., Turbulent mixing within tropopause folds as a mechanism for the exchange of chemical constituents between the stratosphere and troposphere, J. Atmos. Sci., 37, 994-1004, 1980.
Singh, H. B., A.M. Thompson, and H. Schlager, SONEX airborne mission and coordinated POLINAT-2 activity: Overview and accomplishments, Geophys. Res. Lett., in press, 1999.
Thorpe, S. A., On the shape and breaking of fmite amplitude gravity waves in a shear flow, J. Fluid Mech., 85, 7-31, 1978.
Thorpe, S. A., An experimental study of critical layers, J. Fluid Mech., 103,321-344, 1981.
Walterscheid, R. L., and G. Schubert, Nonlinear evolution of an upward propagating gravity wave: Overturning, con- vection, transience and turbulence, J. Atmos. Sci., 4,7, 101-125, 1990.
Weinstock, J., On the theory of turbulence in the buoyancy subrange of stably stratified flows, J. Atmos. Sci., 35, 634-649, 1978.
Weinstock, J., Vertical diffusivity and overturning length in stably stratified turbulence, J. Geophys. Res., 97, 12,653- 12,658, 1992.

21,568 CHO ET AL.: TROPOPAUSE FOLD INSTABILITIES
E. V. Browell, G. L. Gregory, G. W. Sachse, and S.A. T.L. Kucsera and A.M. Thompson, Code 916, NASA Vay, NASA Langley Research Center, Hampton, VA 23681- Goddard Space Flight Center, Greenbelt Rd., Green- 2199. ([email protected]; [email protected]; belt, MD 20771-0001. ([email protected]; thomp- [email protected]; s.a. [email protected]. gov) son@gator 1.gsfc.nasa.gov)
T. P. Bui, Mail Stop 245-5, NASA Ames Research Center, M. J. Mahoney, Mail Stop 246-101, NASA Jet Moffett Field, CA 94035-1000. ([email protected]) Propulsion Laboratory, California Institute of Technol-
J. Y. N. Cho and R. E. Newell, Department of Earth, ogy, 4800 Oak Grove Dr., Pasadena, CA 91109-8099. Atmospheric, and Planetary Sciences, Massachusetts In- ([email protected]) stitute of Technology, 77 Massachusetts Ave., 54-1823, Cambridge, MA 02139-4307. ([email protected]; newell@newelll. mit.edu )
M. A. Ferm, Science Applications International Cor-
poration, 1 Enterprise Parkway, Hampton, VA 23666. (Received January 14, 1999; revised May 25, 1999; ([email protected]) accepted June 16, 1999.)