observing system monitoring center - cpo homecpo.noaa.gov/sites/cpo/cod2/2014 progress...
TRANSCRIPT

FY2014 Annual Report - Observing System Monitoring Center Page 2 of 14
Observing System Monitoring Center Eugene Burger1, Kevin Kern2, Kevin O’Brien3, 1NOAA/PMEL, Seattle, WA 2NOAA/NDBC, Stennis Space Center, MS 3University of Washington/JISAO, Seattle, WA
Table of Contents 1. Project Summary ......................................................................................................................... 3 2. Scientific and Observing System Accomplishments .................................................................. 7 3. Outreach and Education ............................................................................................................ 14 4. Publications and Reports........................................................................................................... 14
4.1. Publications by Principal Investigators ........................................................................... 14 4.2. Other Relevant Publications ........................................................................................... 14
5. Slides ......................................................................................................................................... 14

FY2014 Annual Report - Observing System Monitoring Center Page 3 of 14
1. Project Summary The Observing System Monitoring Center (OSMC)1 project exists to join the discrete “networks” of in situ ocean observing platforms -- ships, surface floats, profiling floats, tide gauges, etc. – into a single, integrated system. The OSMC addresses this goal through capabilities in four areas: 1) it captures the real-time ocean data stream from the NOAA GTS into a database, and makes those data available at minimal delay to scientific end users through easy-to-use, service-oriented techniques; 2) it utilizes these data to compute metrics, indices and indicators of effectiveness of the observing system (the scientifically useful data it produces); 3) it strives to integrate the community of delayed-mode data assembly centers under a unified set of data services; and 4) it provides real-time monitoring of the integrated networks of in situ platforms. The increased emphasis on data integration is a shift in the OSMC project priorities that began in earnest in July 2011, and was reinforced in the clarification of roles between JCOMMOPS and OSMC in May 2014.
Figure 1. Several examples of maps generated by the OSMC
As a tool for observing system management, the OSMC helps the Climate Observation Division (COD) to ensure that NOAA meets the long-term observational requirements of forecast and modeling centers, international research programs, major scientific assessments, and decision-makers. The OSMC provides observing system managers with custom maps and tables that summarize the contributions of different countries and programs to the system at any point in time. It tracks the deployment progress of observing system elements over time. It provides tools to help scientists track the effectiveness of in situ observations for assessing the state climate variables – temperature, salinity, etc.
1 http://www.osmc.noaa.gov

FY2014 Annual Report - Observing System Monitoring Center Page 4 of 14
Figure 2. A sample of the drill down products available from the OSMC
OSMC serves the real-time data, ingested into the OSMC from the GTS and other sources, to the public as an integrated, easy-to-use stream. The real-time data are served out via Web Services using the popular ERDDAP2 program from NOAA/NMFS. ERDDAP products include data in several popular delivery formats (OPeNDAP, JSON, CSV, KML) that can be accessed through web browsers and popular desktop analysis tools. Products also include standardized ISO (19115) metadata and maps (images) visualizing the data.
The OSMC project is working to unify access to the platform-focused, delayed-mode data assembly centers that perform quality assurance and quality control on the output on individual observing “networks”. The OSMC data integration strategy will extend beyond in situ observations to include synthesis products,
2 The ERDDAP server is a development of the Environmental Research Division of NOAA/NMFS/PFEL -- http://coastwatch.pfeg.noaa.gov/erddap
What is “integrated data management?” “Integrated data management” is best understood by contrasting it with today’s norms for ocean data management. Today each platform assembly center typically provides its own web site at which users (humans, but not machines) can select data of interest. Data can then be downloaded in the file format(s) favored by that network. A user desiring interior ocean temperatures from both Argo and TAO, for example, must learn to navigate two independently designed (and very distinct) Web sites, each with its own technical jargon and each with its own style of selecting regions, times, platforms, and variables with various imposed groupings. When the use of these distinct Web sites have been mastered, a larger barrier remains – that of distinct data formats. Custom software is often needed to read the data from distinct networks. Not even variable names are standardized between them. Non-experts would often be unwilling to pursue such a task to completion.

FY2014 Annual Report - Observing System Monitoring Center Page 5 of 14
satellite observations and model outputs. The target vision is that managers and scientists should be able to compare and contrast in situ observations with all other data sources for the same space-time locations in support of such activities as IPCC AR5/CMIP5.
Figure 3. XBT drop metrics from the OSMC
Figure 1 illustrates how the OSMC maps display the status of the global observing system for in situ ocean surface meteorological and oceanographic measurements. Observing system managers may constrain their selections of observations by factors such as the platform type, the programs associated with platforms, the parameter that is observed (temperature, sea level height, etc.), the contributing nation, or the instrument ID. With a click the user can drill down to access details of a particular platform and the measurements it has made as shown in Figure 2. A variety of more detailed reports, summarizing the state of the observing system are available through a special reporting interface. Figure 3 illustrates one such example, the progress of completion of XBT drops along named lines The OSMC also displays observing system metrics, incorporated into the system as they are developed by NOAA observing system scientists and others. These analysis capabilities help managers and scientists to assess the adequacy of the observations to infer critical ocean state fields, such as sea surface temperature. Figure 4 shows two such examples.

FY2014 Annual Report - Observing System Monitoring Center Page 6 of 14
Figure 4. On the left, a metric measuring the percentage of weeks that 25 or more SST
observations occurred in a given 5x5 degree box is shown. On the right is a time series showing the evolution of the SST observing system.
One of the great challenges in earth science data integration that must be addressed during the coming decade is the integration of observations and products. The OSMC is a platform for climate product integration as well as climate observations monitoring. Some illustrations of current capabilities are shown below in figure 5. The left panel shows the integration of OSMC observation records with SST bias errors computed by Dick Reynolds at NCDC and served by OPeNDAP (left) while the right panel shows the Equivalent Buoy Density (EBD) product on a 5ºx5º grid.
Figure 5. Observations over Reynold’s SST bias errors (left); EBD for Jan–June, 2014 (right)
These visualizations clearly indicate where additional drifting buoys should be added in order to reduce satellite bias errors for SST.
The web site for the program is http://www.osmc.noaa.gov

FY2014 Annual Report - Observing System Monitoring Center Page 7 of 14
2. Scientific and Observing System Accomplishments The following milestones track the progress made by the OSMC project during fiscal year 2014. For clarity the accomplishments are broken out by collaborating institution (PMEL and NDBC). PMEL Accomplishments • OSMC project leadership
o PMEL provided project leadership for the OSMC collaboration: hosted weekly technical teleconferences; oversaw the tracking of bug fixes, and deliverables; and coordinated planning and troubleshooting between groups.
o In conjunction with JCOMMOPS, OSMC leadership convened a technical meeting April 28 – May 1, 2014 in Toulouse. Key conclusions from the meeting, which will be discussed in greater detail in this report, included: Use OSMC integration tools to create a prototype data management framework for
the new generation of the Tropical Pacific Observing System (TPOS). More effective metrics are needed to gauge the real time and delayed mode data
streams. These metrics are to be defined by Ocean Observations Panel for Climate (OOPC) and implemented by OSMC
Creation of OSMC Terms of Reference and clearly defined roles of JCOMMOPS and OSMC.
• Operational capability to OSMC real-time data via data services
o In FY014, we maintained operational access to OSMC data at NDBC using the Environmental Research Division’s Data Access Program (ERDDAP)3 (figure 6). The following “views” corresponding to the discrete sampling geometry conventions of the Climate and Forecast CF conventions4 have been maintained: Surface Trajectories – drifters, surface-based ship obs, etc Profiles – Argo, CTDs, moorings, etc. TimeSeries – Moored observations, etc. Points – all observations – as either multivariate tuples (implying many voids) or
individual variable reports (more condensed)
3 http://osmc.noaa.gov/erddap/ 4 http://cf-pcmdi.llnl.gov/documents/cf-conventions/1.6/cf-conventions.html#discrete-sampling-geometries

FY2014 Annual Report - Observing System Monitoring Center Page 8 of 14
Figure 6. ERDDAP-based access to realtime profile data from Oct 31, 2014
o IOOS operational use of the OSMC GTS data stream continues by various groups, including
the MARACOOS group out of Rutgers University, led by John Wilkin. o One successful instance of operational usage of the OSMC data stream came through
interactions with the company Pacific Gyre, Inc5. Pacific Gyre is a California based company that produces drifting buoys for research institutions. They were struggling to find a reliable way to verify the data they were producing with their drifters was a) getting to the GTS and b) of good quality. After discussions with their technical team, and after ensuring that the GTS headers they were using to transmit data were in our queue, we were able to illustrate how easily they could access the real time data from their drifters. Once instructed in the simple technique to utilize the machine-to-machine interface and RESTful URL’s provided by the OSMC, they were ecstatic:
“Thanks so much for your help. We've been trying to implement some kind of check for our GTS insertion system for quite some time, and this will finally do it for us. The only QA we had [previously] was to wait for someone to complain that something didn't look right. So having the API access from your site is huge for us. Although not actual consumers of GTS data, without your data, we could be publishing incorrect data to the world and might never know it.”
• COD-wide data integration o In FY14, we began implementation of our defined strategy for integrating data access and
discovery to ocean observations. Modern metadata records are now being created for OSMC real time data.
• In FY14, the OSMC GTS real-time data was included as part of the Unified Access Framework project data catalog at http://upwell.pfeg.noaa.gov/erddap.
5 http://www.pacficgyre.com

FY2014 Annual Report - Observing System Monitoring Center Page 9 of 14
o Including the OSMC data in this project ensures that ISO 191156 compliant metadata records are generated and made available through the UAF metadata web accessible folder (WAF). This WAF can be harvested by data discovery systems.
Figure 7. An ISO 19115 metadata record for the OSMC real-time profile data.
OSMC real-time data has been made discoverable through search portals and other
community portals. • OSMC ISO 19115 metadata is ingested via the UAF WAF and loaded into a
search and discovery tool called Geoportal at NOAA’s National Ocean Data Center ( NODC)7 (See figure 8).
• The UAF WAF has also been registered with data.noaa.gov8 which will ensure that the OSMC metadata will be available from search tools found on that site.
Figure 8. The OSMC real-time data available through the NODC UAF Geoportal discovery tool.
6 http://www.iso.org/iso/home/store/catalogue_ics/catalogue_detail_ics.htm?csnumber=53798 7 http://uaf.nodc.noaa.gov/ 8 https://data.noaa.gov/dataset?q=OSMC

FY2014 Annual Report - Observing System Monitoring Center Page 10 of 14
• Processes were implemented between PMEL and NODC to ensure that metadata
from the OSMC real-time stream is updated on a daily basis. o We have started implementing an integrated data management framework to support the
new generation Tropical Pacific Observing System (TPOS). At the joint JCOMMOPS/OSMC meeting in Toulouse (April-May, 2014), there was
unanimous agreement that OSMC should lead the JCOMM programs in a test bed use of ERDDAP to provide unified data access over the Tropical Pacific region, in support of TPOS.
The goal is to provide a uniform set of web services for data delivery across TPOS data streams. This includes uniform access to both real-time and delayed mode data. • Because the TPOS data streams are highly complementary to those managed by
COD, the development of this prototype will be directly correlated with COD data integration goals.
The following data streams have been integrated through the OSMC ERDDAP software (see figure 9): • Real-time GTS data • Delayed mode AOML drifter data • Delayed mode TAO mooring data • Currently working on Hydrographic data from CCHDO
Figure 9. Comparison of real- time drifter data from GTS and delayed mode data from AOML. The image on the
left compares drifter tracks found in both sources. The image on the right is the difference of SST from the two sources, after being gridded to a 5° by one month grid.
This work will continue in earnest during FY15 to include additional sources of data,
including Argo, SOOP/VOS, SOCAT and OceanSITES. A poster of this work will be presented at the annual AGU meeting in San Francisco,
December 2015. • OSMC Terms of Reference
o A final task at the Toulouse meeting was to clarify the complimentary roles of JCOMMOPS and OSMC.

FY2014 Annual Report - Observing System Monitoring Center Page 11 of 14
o One past concern has been about the level of overlap between OSMC and JCOMMOPS functionality. After significant discussions with representatives from the World Meteorological Organization (WMO), OOPC, the Global Climate Observing System (GCOS), COD, OSMC and JCOMMOPS, the sense of the meeting was unanimous in that there is a very small, yet acceptable level of overlap between JCOMMOPS and OSMC. The former is focused on the process of getting instruments deployed and tracking per platform when and where they are functioning. OSMC, by contrast, is focused on the per variable output of the observing system, integrating the contributions of all networks. To this end a Terms of Reference for OSMC was drafted and discussed in detail at the meeting. The OSMC Terms of Reference has been posted on-line.9
• Ongoing Operational support for OSMC
o Continue to provide and maintain the quarterly platform reporting statistics at http://osmc.noaa.gov/reports.html (figure 3).
o Continue to update the “% complete metric” describing, in one figure, the percentage of completeness for the Global Ocean Observing System. In the Toulouse, 2014 technical meeting, it was agreed that more user-oriented
metrics were needed to gauge the effectiveness of the real time and delayed mode data streams at meeting the stated goals of the observing system. It was also agreed that these metrics would need to be defined clearly by the OOPC before they could be implemented through the OSMC. We hope to hear more about the updated metric required in FY15.
o Continue to provide, through standard web services, an aggregated version of the Equivalent Buoy Density product. (http://ferret.pmel.noaa.gov/thredds/dodsC/ebd.html)
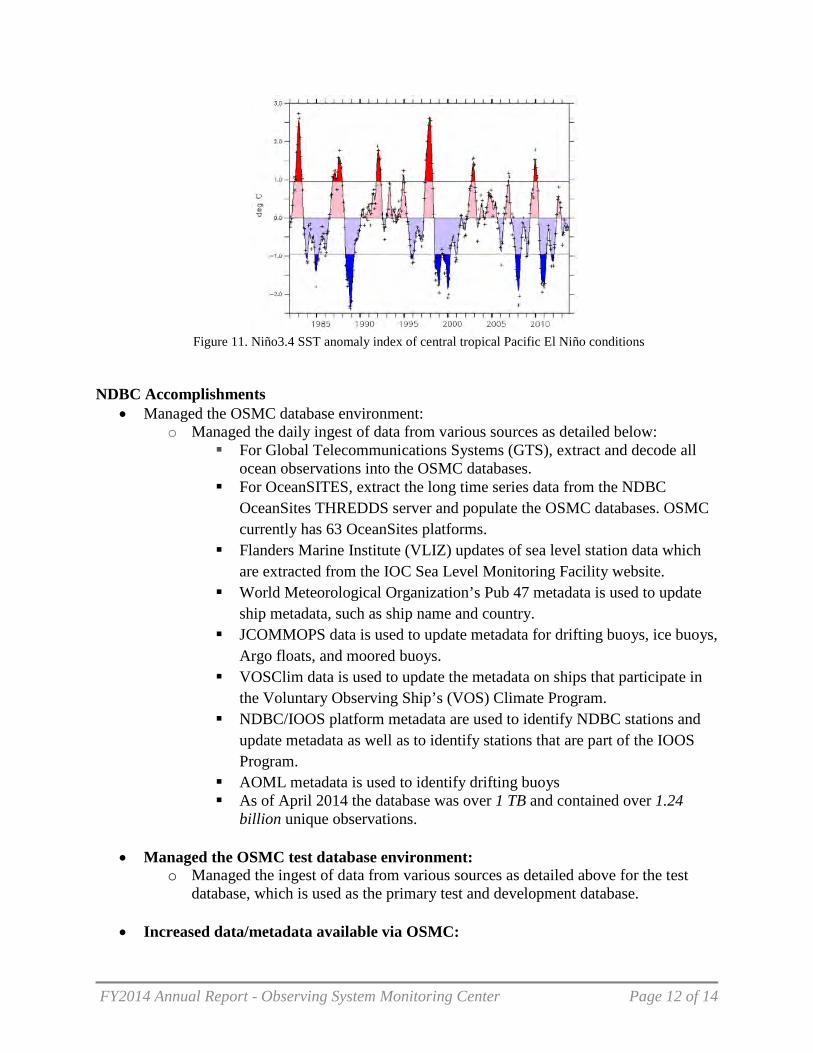
o Maintain gridded summary counts (See figure 10) o Maintain the State of the Ocean Website (figure 11) that tracks ocean indices through
weekly updates, in partnership with Dr. Andrew Chiodi. (http://stateoftheocean.osmc.noaa.gov)
Figure 10. A sampling of the platform count summaries now available through the OSMC
9 http://www.osmc.noaa.gov/OSMC-TermsofReference.pdf
FY2014 Annual Report - Observing System Monitoring Center Page 12 of 14
Figure 11. Niño3.4 SST anomaly index of central tropical Pacific El Niño conditions
NDBC Accomplishments
• Managed the OSMC database environment: o Managed the daily ingest of data from various sources as detailed below:
For Global Telecommunications Systems (GTS), extract and decode all ocean observations into the OSMC databases.
For OceanSITES, extract the long time series data from the NDBC OceanSites THREDDS server and populate the OSMC databases. OSMC currently has 63 OceanSites platforms.
Flanders Marine Institute (VLIZ) updates of sea level station data which are extracted from the IOC Sea Level Monitoring Facility website.
World Meteorological Organization’s Pub 47 metadata is used to update ship metadata, such as ship name and country.
JCOMMOPS data is used to update metadata for drifting buoys, ice buoys, Argo floats, and moored buoys.
VOSClim data is used to update the metadata on ships that participate in the Voluntary Observing Ship’s (VOS) Climate Program.
NDBC/IOOS platform metadata are used to identify NDBC stations and update metadata as well as to identify stations that are part of the IOOS Program.
AOML metadata is used to identify drifting buoys As of April 2014 the database was over 1 TB and contained over 1.24
billion unique observations.
• Managed the OSMC test database environment: o Managed the ingest of data from various sources as detailed above for the test
database, which is used as the primary test and development database.
• Increased data/metadata available via OSMC:

FY2014 Annual Report - Observing System Monitoring Center Page 13 of 14
o Resolved issues with data and metadata loads as they arose o Added additional GTS bulletin headers as required when new data sources were
identified. Added GTS headers IOBB 18 KPML and IOBC18 KPML to the OSMC
processing to obtain PMEL Papa and KEO mooring data via BUFR. Added GTS header SOFX01 DEMS to the OSMC processing to ingest
data from INCOIS floats. Added GTS header IOBX05 KWBC to the OSMC processing to ingest
data from 2 drifting/Ice buoys: 48651, 48655.
• Miscellaneous Support: o Performed a manual comparison of the VLIZ water level stations between the
OSMC and the VLIZ website and took appropriate steps to update/corrected the OSMC database.
o Working to modify the VLIZ water level software that was originally developed by NGDC to address issues identified during the comparison above.
o Currently working with UCAR to obtain the latest BUFR decoder (table version 22) to enable additional data to be incorporated into OSMC.
o Supported Pacific Gyre Inc. by ingesting their drifting buoys via the GTS, which provided them a method to verify GTS distribution of data.
o Supported IOOS “Gliderpalooza” events to ensure that all gliders were ingested into the OSMC database.
o Investigated timing anomalies with glider reports in BUFR. The timing of the Glider2Bufr process was adjusted for better ingest with OSMC processes.
o Modified trajectory view to produce a time series view for stationary platforms. o Modified decoder to ingest glider data. o Assisted PMEL with resolving query performance issues and/or other OSMC
related support. o Hosted the OSMC IT environment, providing system administration and DBA
support. Managed the security environment for OSMC as part of the NDBC
Certification and Accreditation process. Migrated OSMC processing software from the PGDEVL server to
OSMCWeb01 server to resolve security vulnerabilities. Working to migrate the OSMC database to higher performance hardware. Installed additional memory in the OSMCWeb01 server to address
performance issues. Freed file space on server so that processing could continue. Added the lon360 column to OSMC ERRDAP views to improve
performance. Terminated connections between NGDC and NDBC in support of OSMC
since NGDC is no longer an OSMC partner. Ran the Gather Stats process as needed to improve database performance
issues.

FY2014 Annual Report - Observing System Monitoring Center Page 14 of 14
3. Outreach and Education The OSMC is involved in several areas of outreach. i) As the backbone of the Adopt a Drifter Program (ADP) tracking webpage, the OSMC allows students and teachers to track drifters that have been deployed at sea. ii) LAS, OSMC-produced visualizations and tables are also included dynamically among the products distributed by the AOML Global Drifter Program. Users are able to view OSMC-generated tracking products, such as viewing observations on Google Earth. iii) We assist the scientific community at large with our continued support and maintenance of the State of the Ocean site. iv) We continue to provide operational access to integrated ocean observations (including COD obs.) via web services for model forecasters such as John Wikin at Rutgers/MARACOOS. The OSMC data has also been critical for commercial entities such as Pacific Gyre, Inc, as described in the PMEL accomplishments section. The OSMC continues to function as an outreach arm of the COD community for data integration activities. This includes interaction with the following groups:
• JCOMMOPS • GODAE and related global ocean operational forecast endeavors • NOAA’s Integrated Ocean Observing System (IOOS) program • NOAA’s Global Earth Observations Integrated Data Environment (GEO-IDE) and the
Unified Access Framework (UAF) • NOAA’s Environmental Data Management Committee (EDMC) • DoE’s Earth Systems Grid (ESG), supporting WCRP CMIP5 • NASA’s Earth Systems Information Partners (ESIP) • Climate and Forecast Conventions standard for netCDF (CF)
4. Publications and Reports 4.1. Publications by Principal Investigators 4.2. Other Relevant Publications and Presentations O’Brien, K. M., Hankin S., Mendelssohn, R., Simons, B., Kern K., Smith, B., 2013: Interoperable Access to Near Real Time Ocean Observations with the Observing System Monitoring Center, Abstract IN14A-02 presented at 2013 Fall Meeting, AGU, San Francisco, Calif., 9-13 Dec. O’Brien, K.M., 2013: OSMC data integration plan update for Climate Observation Division, May, 2014. O’Brien, K.M., 2013: OSMC data integration plan discussion with TPOS executive board, June, 2014. 5. Slides Please see the attached slide illustrating the OSMC/COD data integration strategy.