occupational segregation by hours of work in europe · occupational segregation by hours of work in...
TRANSCRIPT
1
Occupational segregation by hours of work in Europe Theo Sparreboom1,2 Abstract This paper quantifies levels of occupational segregation between full-time and part-time work and attempts to identify some of the determinants of this segregation. In the first part of the analysis, segregation between full-time and part-time work is measured for all workers as well as within sub-groups of the employed – men, women, youth and adults for 15 European countries, using data from the European Labour Force Survey. The extent to which segregation is driven by constituent sub-groups is also analysed. It is demonstrated that occupational segregation by hours of work is generally higher for males than for females, suggesting that part-time pay penalties may be more important for men than for women, and higher for young workers than for adult workers. The remainder of the paper uses regression analysis across countries to identify factors which drive segregation by hours of work. Three groups of variables are considered that are related to (1) the quantity of work; (2) the quality of work; and (3) institutional factors. It is found that segregation by hours of work for sub-groups of the employed is driven by different factors. In particular, segregation for men is correlated with the volume of work, while variables from all three groups are important for adult women and young workers.
1 International Labour Office; email: [email protected]. 2 Research assistance was provided by Pinar Hosafci, ILO Consultant.
This is an Accepted Work that has been peer-reviewed and approved for publication in the International Labour Review, but has yet to undergo copy-editing and proof correction. See http://www.blackwell-synergy.com/loi/ilr for details. Please cite this article as a “Postprint”; 10.1111/ilr.12017

2
1. Introduction Women and young workers are among the most prominent groups facing systematic labour market disadvantages. Female labour force participation rates, for example, are lower than male rates in virtually all countries, and women often have lower wages. In a sample of countries used in the Global Wage Report, the gender wage gap ranged from 35.8 per cent in the United States to 4.0 per cent in Sweden (ILO, 2015a), while in the European Union women’s gross hourly earnings were on average 16.4 per cent below those of men in 2013.3 The position of youth in labour markets around the world is reflected in youth unemployment rates, which are usually at least twice as high as adult unemployment rates, but also in indicators of the quality of jobs (ILO, 2013). Occupational segregation by sex accounts for a significant part of the observed wage gap between men and women (World Bank, 2011),4 and occupational segregation is also an important factor in explaining part-time pay penalties. Manning and Petrongolo (2008) show that, in Britain, the part-time pay penalty becomes very small if occupational differences between part-timers and full-timers are controlled for. Based on a double decomposition of the gender wage gap (between men and women employed full-time as well as between full-time and part-time working women), Matteazzi et al. (2013) find that labour market segregation is more important than the prevalence of part-time employment as such in explaining gender wage gaps. This paper quantifies levels of occupational segregation between full-time and part-time work and attempts to identify some of the determinants of this segregation. In the first part of the analysis, segregation between full-time and part-time work is measured for all workers as well as within sub-groups of the employed – men, women, youth and adults for 15 European countries. The extent to which segregation is driven by constituent sub-groups is also analysed. It is demonstrated that occupational segregation by hours of work is generally higher for males than for females, suggesting that part-time pay penalties may be more important for men than for women, and higher for young workers than for adult workers. The remainder of the paper uses regression analysis across countries to identify factors which drive segregation by hours of work. Three groups of variables are considered that are related to (1) the quantity of work; (2) the quality of work; and (3) institutional factors. It is found that segregation by hours of work for sub-groups of the employed is driven by different factors. In particular, segregation for men is correlated with the volume of work, while variables from all three groups are important for adult women and young workers.
3See http://ec.europa.eu/eurostat/statistics-explained/index.php/Gender_pay_gap_statistics; accessed 30.04.15. 4 Other factors that have been advanced by researchers include, for example, an undervaluation of women’s work; workplace characteristics; and the overall wage structure in a country, which may reflect wage setting mechanisms designed with a focus on workers in male dominated sectors (see ILO (2015a) and the references therein for overviews).
3
This paper is organized as follows. Section 2 reviews literature related to segregation by hours of work, and discusses some of the theoretical background related to segregation between part-time and full-time work. Section 3 documents such segregation by gender and age groups across European countries. Section 4 conducts the empirical analysis for the drivers of segregation by hours of work. Section 5 concludes. 2. Explaining segregation by hours Part-time work is an important ‘non-standard form of employment’, as the standard employment relationship is often understood as being work that is full-time (ILO, 2015b). Similar to other forms of non-standard employment, part-time work has become more important over the past several decades. In the EU15, part-time employment as percentage of total employment increased from 17.5 in 2000 to 21.4 in 2010 and 22.9 in 2014.5 For women, the percentage increased from 33.3 in 2000 to 38.0 in 2014, while the corresponding percentages for men are 5.7 and 9.8. There are few systematic studies on the determinants of segregation with respect to hours of work. Much more work has concentrated on the incidence of part-time work (Buddelmeyer et al., 2008; O’Reilly and Fagan, 1998) and wage penalties and other aspects of the quality of part-time work (Bardasi and Gornick, 2008; Manning and Petrangelo, 2008; Matteazzi et al., 2014; OECD, 2010). For example, Buddelmeyer et al. (2008) find that cyclical variables exert a negative effect on part-time employment in the short run, whereas institutions and other structural factors, such as changes in legislation are important in explaining the volume of part-time employment in the long run. OECD (2010) demonstrated that the part-time penalty is reflected in a wider range of indicators, including earnings potential, union membership and job security. At the same time, however, this study showed that part-time jobs also carry a “premium” in terms of control of working time and health and safety risks. An evaluation of the impact of legislation on equal treatment for part-time workers in the OECD study suggests that the legislation is associated with an increased likelihood of having a permanent contract for men and women, and an increased likelihood of participating in training for men, thus reducing the job quality gap between full-time and part-time workers, but only in countries with tight labour market conditions (ibid., box 4.3). Occupational distributions are often related to age, and occupational segregation among young people tends to be greater than segregation among their adult counterparts. EHRC (2010) shows that both young men and young women in Britain were overrepresented in elementary occupations and sales jobs and underrepresented in managerial, professional and associate professional positions.6 Many young people combined education with low paid, low quality jobs on a part-time, temporary basis. However, in contrast to men, women continued to be underrepresented in better paying, higher status managerial and professional occupations in later years. Andrews et al. (2007) use British careers service data on young peoples’ occupational preferences to determine segregation in the youth training market (“pre-labour market
5Eurostat, http://ec.europa.eu/eurostat/web/lfs/data/database; accessed 30.04.15. 6 Similar evidence is available for Australia; a recent survey found that nearly two fifths of students aged 15–24 years worked part-time and around 87 per cent of part-time workers aged 15–24 years worked in low skilled occupations such as elementary clerical, sales and service jobs (Abhayaratna et al., 2008).

4
segregation”) and information on occupational destinations after young people successfully entered the labour market to calculate segregation in the competitive job market (“post-labour market segregation”). The authors find that in the United Kingdom, occupational segregation in the pre-labour market is significantly higher than occupational segregation in the post-labour market. In other words, there is a mismatch between workers’ preferences before they enter the job market and the jobs that they obtain. These differences are attributed to (1) different treatment of young people by their family, school and peers that presort them into occupations that fit traditional gender stereotypes and/or (2) young peoples’ own perceptions of gender roles in the labour market. Antecol and Cobb Clark (2010) argue that entry into male-dominated fields of study and male-dominated occupations are both related to individual’s perception of having male traits such as the willingness to work hard, impulsivity, and the tendency to avoid problems. These non-cognitive traits, the authors contend, provide an important, though incomplete, explanation for segregation both in young people’s educational fields and occupational choices. Tijdens (2002) distinguishes four regimes, or models, which explain to varying degrees whether a woman works part-time or full-time. The first model reflects the supply-side nature of part-time work – the “gender roles regime” – according to which the probability that an individual is engaged in part-time employment depends on gender roles in the family. The remaining three models – the “secondary labour market regime”, the “optimal staffing regime” and the “responsive firms regime” – reflect the demand side. According to the secondary labour market regime, firms create low-wage and high-turnover part-time jobs, while according to the optimal staffing regime, firms will create part-time jobs in response to fluctuations in workload, for example because of time-related demand for services. Finally, according to the responsive firms regime, firms are responsive to workers’ demand for reduced hours in their jobs. These models also suggest that part-time work is likely to be more widespread in certain occupations (and industries) than in others, and that the nature of part-time work is such that segregation between full-time and part-time work can be expected (Sparreboom, 2014). Both the gender roles regime and the responsive firms regime suggest segregation by hours of work along similar lines as segregation by sex. If, along neoclassical lines, the family is viewed as a production unit which can benefit from specialization, such specialization results in differential choices for working time (e.g. a preference for part-time work, which helps explain segregation by sex) but may also affect occupational choices through linkages between occupations and the need to travel, availability to work overtime and so on. According to the responsive firms regime, segregation by sex or by hours will be reinforced to the extent that firms are likely to be more responsive to workers’ needs with regard to part-time work in workplaces in which women (or part-time workers) are already well-represented. The optimal staffing regime is also more relevant for certain industries and occupations than others, as set out in OECD (2010), while the nature of the secondary labour market regime (emphasising low-wage employment) suggests segregation away from higher skilled (and better paid) occupations. Segregation according to these regimes is also related to characteristics of part-time jobs and workers, such as the number of hours worked and whether the worker would prefer to work more hours. In Norway, for example, involuntary part-time employment is strongly associated with secondary labour market characteristics, while voluntary

5
short part-time work allows employers more flexibility in low-skill service industries (Kjeldstad and Nymoen, 2012).

6
3. Segregation by hours of work in Europe The main data source used in this paper is the Eurostat European Labour Force Survey (ELFS) for the year 2011, and we consider 15 countries.7 Key advantages of the ELFS are the consistent measurement across all countries covered by the survey and the sample size, which allows for the precise measurement of characteristics of small sub-groups of the employed.8 The measure of segregation used in this paper is the Duncan and Duncan index of dissimilarity (ID). The ID is defined as half the sum of the absolute differences, over all groups of occupations, between proportions of two groups of workers (part-time/full-time).9,10 The index can in general be interpreted as the minimum proportion of either group that has to change categories to make the relative frequency distributions equal (Mulekar, Knutson and Champanerkar, 2008, p. 2099). An advantage of the ID is that it is not directly dependent on the relative volume of employment of any group, and therefore allows for cross-country comparisons (Charles and Grusky, 1995). 3.1 Descriptive results In our sample of countries, the incidence of part-time work averages 18.7 per cent, but the average is much higher for women (28.9 per cent) than for men (10.2 per cent), and much higher for youth (33.6 per cent) than for adults (16.8 per cent). The large differences in incidence reflect the different roles of part-time work for sub-groups of the employed, and the extent to which part-time work has been accepted. In several countries in northern Europe (Belgium, Ireland, Netherlands, Norway and the United Kingdom), the incidence of part-time work exceeds 20 per cent. In the Netherlands the majority of employed women work part-time, and in another four countries the majority of employed youth work part-time (Denmark, Ireland, Netherlands and Norway). In Greece and Portugal, on the other hand, the incidence of part-time work is less than 10 per cent (Annex Table A). Occupational segregation by hours of work in our sample of countries ranges from 30 per cent in Ireland to 52 per cent in Portugal, and averages 40 per cent. With the exceptions of Belgium, Portugal and Spain, segregation is greater for men than for women in all countries (Figure 1). The intuitive explanation of the greater segregation for men is that women are often confined to a more narrow range of occupations, and segregation due to part-time work therefore appears to be more restrictive for men
7 These countries are Austria, Belgium, Denmark, Finland, France, Greece, Ireland, Italy, Luxembourg, Netherlands, Norway, Portugal, Spain, Sweden and the United Kingdom. With the exception of Norway, these are all member states of the European Union before its enlargement in 2004. 8 The average number of observations on the employed population is more than 100,000 per country. 9 ID = (1/2) Σ ABS (PTi/PT – FTi/FT), with: ABS absolute difference PTi/PT proportion of part time-workers in occupation i FTi/FT proportion of full-time workers in occupation i Σ summation over all occupations i 10 We use the information on usual weekly hours of work, and following Van Bastelaer et al. (1997) and Sparreboom (2014), a cut-off of 30 hours to define part-time work.

7
(Sparreboom, 2014). The pattern by sex is the same for youth, and segregation for young women exceeds that for men only in Belgium (Figure 2). At the same time, segregation for youth is greater than for adults in all countries except Greece, Italy, Portugal and Spain. This seems consistent with a greater role of part-time work alongside other activities for young workers in comparison with adults. It is interesting to know which sub-groups of the population drive overall levels of segregation by hours, which can be demonstrated by an examination of pairwise correlations between levels of segregation in sub-groups of the employed. These correlations show that the overall level of segregation is strongly and significantly correlated with the level for adults (which constitute the large majority of the employed), but not with the level for youth (Table 1). Correlation between segregation across all workers and male (adult) workers is particularly strong, and the same is true for young male workers and all young workers.

8
Figure 1. Segregation by hours of work (ID, percentages), by sex, 2011
Source: Author’s calculations based on the Eurostat ELFS. Figure 2. Youth segregation by hours of work (ID, percentages), by sex, 2011
Source: Author’s calculations based on the Eurostat ELFS.

9
There is also significant correlation between male and female levels of segregation by hours, across all workers and for adults and youth. This seems consistent with Tijdens’ finding that the responsive firms regime is important in explaining the incidence of part-time work, to the extent that firms are not less open to demands for reduced hours from males than from females. In this case men benefit from the fact that part-time work is already accepted due to the strong presence of women in certain occupations. Table 1. Correlations of levels of segregation by hours of work between sub-groups of the employed, 2011
All Male Female Adult Male adult
Female adult Youth Male
youth Female youth
All 1.00 Male 0.90 1.00 Female 0.75 0.61 1.00 Adult 0.87 0.66 0.69 1.00 Male adult 0.78 0.78 0.65 0.82 1.00 Female adult 0.67 0.45 0.92 0.81 0.69 1.00 Youth 0.42 0.38 0.02 0.32 0.21 0.00 1.00 Male youth 0.55 0.63 0.09 0.36 0.36 0.00 0.86 1.00 Female youth 0.09 0.10 -0.09 0.08 0.05 -0.09 0.75 0.50 1.00
Source: Author’s calculations based on the Eurostat ELFS for 15 countries.
P<0.1 P<0.01 P<0.001
3.2 Segregation for selected sub-groups Table 2 shows levels of segregation by hours for selected sub-groups of the employed. In general, the levels suggest that workers who are often in a disadvantaged labour market position also face more restrictions in occupational choices, although this does not necessarily hold for all sub-groups. Segregation by hours of work for workers with a permanent job is generally lower than for those with a temporary job, for those who are not wishing to work more hours in comparison with those looking for more work, and for those with a high level of education (defined as more than secondary education) in comparison with those with a low level of education. Across all workers there is no difference in levels of segregation between foreign-born and native-born workers, but there are large differences for adult male and young male workers, which appear to face more restrictions than their native-born counterparts. Young female workers with low levels of education experience relatively higher levels of segregation, but the opposite is true for (adult) male and female sub-groups.
10
Table 2. Segregation by hours of work for selected sub-groups of the employed (ID, percentages), 2011
All Male Female Adult Male adult
Female adult Youth Male
youth Female youth
All 39.5 38.5 31.6 38.0 34.2 30.7 40.6 46.0 31.3 Permanent job 37.3 40.0 32.1 36.4 39.0 32.0 40.9 47.9 34.8 Temporary job 44.2 42.5 35.5 42.9 38.3 34.5 45.1 52.3 35.8 Native-born 39.4 38.8 31.5 37.5 34.3 30.3 41.3 47.1 32.2 Foreign-born 39.4 40.6 31.5 39.7 40.0 32.1 40.3 51.1 35.5 Do not wish more work 38.2 36.9 29.0 37.6 35.2 29.1 41.3 47.4 33.5 Wish more work 40.2 40.0 31.9 38.9 36.1 30.9 41.6 47.8 33.2 High education 38.1 38.8 30.5 36.9 35.9 29.4 40.8 49.0 32.1 Low education 41.0 37.5 30.2 39.9 32.1 28.6 42.5 47.3 34.0
Source: Author’s calculations based on the Eurostat ELFS for 15 countries. 4. Drivers of segregation by hours of work Segregation by hours of work can be expected to be related to three groups of factors: (1) the quantity of employment; (2) the quality of employment; and (3) institutions. If levels of part-time work are very low, it seems likely that there are no part-time workers in some occupations, while at higher levels of part-time work a wider coverage of occupations would be achieved which would lower segregation. Similarly, segregation may be affected by overall levels of employment and unemployment. Segregation is also related to the quality of employment if part-time jobs are associated with low quality employment and such employment is more likely in certain (sectors and/or) occupations. Finally, institutions are important as institutional factors affect part-time employment rates in the long run, and may also be more important in certain (sectors and/or) occupations and in this way affect segregation. The three groups of factors clearly give rise to large sets of indicators which potentially help explain segregation. Table 3 lists a selection of three indicators for each group of factors, together with the definitions and data sources. The first group consists of indicators which are widely used to measure the volume of work, and includes the part-time employment rate to capture the volume of part-time work. The indicators in the second group concern aspects of the quality of work such as job security and overtime hours, as well as education. Although the latter refers to the worker (and not the job), it is likely that workers with higher levels of education enjoy a higher quality of work. The indicators regarding quality of work have been calculated as differences between the share of jobs or workers with certain characteristics among full-time workers and the commensurate share among part-time workers. In contrast to the indicators on quantity and quality of work, the three institutional indicators (union density, family benefits and marginal tax rates) are not based on the ELFS, and are only available across all workers. Finally, we add the share of part-time workers wishing to work more hours as
11
an indicator (which does not belong in one of the three groups), as this share may also affect occupational choices. Table 3. List of indicators potentially affecting segregation by hours of work
Short name Indicator Unit Source
For each sub-group PTR Share of part-time work in employment
(part-time employment rate) Percentage Eurostat ELFS
UNR Unemployment rate Percentage Eurostat ELFS EPR Employment-to-population ratio Percentage Eurostat ELFS TEMP Difference between the share of
workers with temporary contracts among full-time workers and the commensurate share among part-time workers
Percentage points
Eurostat ELFS
EDUC Difference between the share of workers with low education among full-time workers and the commensurate share among part-time workers
Percentage points Eurostat ELFS
OVER Difference between the share of workers with paid overtime hours among full-time workers and the commensurate share among part-time workers
Percentage points
Eurostat ELFS
INVOL Share of part-time workers wishing to work more
Eurostat ELFS
Across all workers UNION Trade union density Percentage of
employees OECD.Stat https://stats.oecd.org/Index.aspx?DataSetCode=UN_DEN
FAMBEN Public spending on family benefits in cash, services and tax measures
Percentage of GDP
OECD, Social Expenditure Database (SOCX) www.oecd.org/social/expenditure.htm
TAX Marginal effective tax rates for part-time employees (one-earner married couple with 2 children)
Percentage OECD, Benefits and Wages: Statistics http://www.oecd.org/social/benefits-and-wages.htm
The results in Table 4 demonstrate that all indicators are significantly correlated with segregation for at least one sub-group of the employed, but none of the indicators is correlated with segregation across all groups. In other words, and despite the significant correlations highlighted in Table 1 above, correlations between segregation in sub-groups, which are often driven by different factors, are not strong enough to drive results across all workers. The part-time employment rate only (negatively) correlates with segregation for adult men. This is for all countries the sub-group with the lowest share of workers in part-time employment, and it is not surprising that a higher part-time employment rate is associated with lower segregation by hours for this sub-group. Adult men also constitute the largest sub-group of the employed, and are often relatively equally distributed across occupations (in full-time employment). For men (all ages), a higher employment-to-population ratio is associated with more segregation, which is due to the fact that more employment primarily means more full-time employment in cross-country comparisons (there is correlation between the male employment-to-population
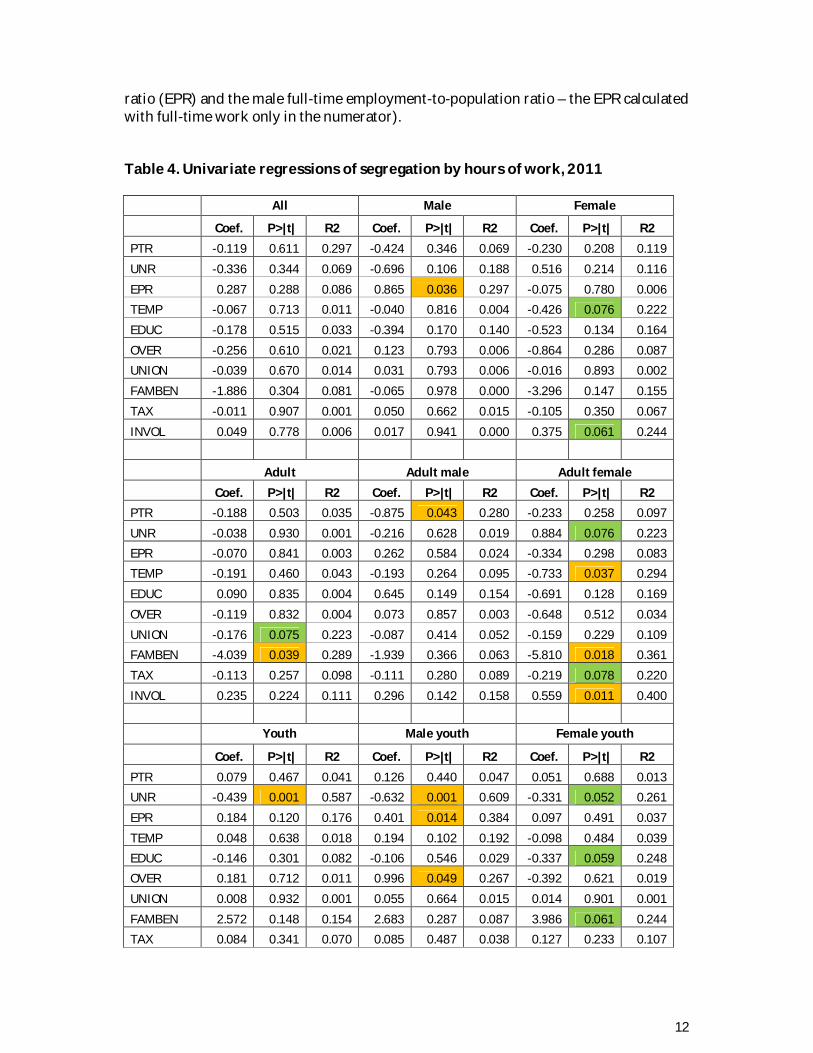
12
ratio (EPR) and the male full-time employment-to-population ratio – the EPR calculated with full-time work only in the numerator). Table 4. Univariate regressions of segregation by hours of work, 2011
All Male Female
Coef. P>|t| R2 Coef. P>|t| R2 Coef. P>|t| R2 PTR -0.119 0.611 0.297 -0.424 0.346 0.069 -0.230 0.208 0.119 UNR -0.336 0.344 0.069 -0.696 0.106 0.188 0.516 0.214 0.116 EPR 0.287 0.288 0.086 0.865 0.036 0.297 -0.075 0.780 0.006 TEMP -0.067 0.713 0.011 -0.040 0.816 0.004 -0.426 0.076 0.222 EDUC -0.178 0.515 0.033 -0.394 0.170 0.140 -0.523 0.134 0.164 OVER -0.256 0.610 0.021 0.123 0.793 0.006 -0.864 0.286 0.087 UNION -0.039 0.670 0.014 0.031 0.793 0.006 -0.016 0.893 0.002 FAMBEN -1.886 0.304 0.081 -0.065 0.978 0.000 -3.296 0.147 0.155 TAX -0.011 0.907 0.001 0.050 0.662 0.015 -0.105 0.350 0.067 INVOL 0.049 0.778 0.006 0.017 0.941 0.000 0.375 0.061 0.244 Adult Adult male Adult female Coef. P>|t| R2 Coef. P>|t| R2 Coef. P>|t| R2 PTR -0.188 0.503 0.035 -0.875 0.043 0.280 -0.233 0.258 0.097 UNR -0.038 0.930 0.001 -0.216 0.628 0.019 0.884 0.076 0.223 EPR -0.070 0.841 0.003 0.262 0.584 0.024 -0.334 0.298 0.083 TEMP -0.191 0.460 0.043 -0.193 0.264 0.095 -0.733 0.037 0.294 EDUC 0.090 0.835 0.004 0.645 0.149 0.154 -0.691 0.128 0.169 OVER -0.119 0.832 0.004 0.073 0.857 0.003 -0.648 0.512 0.034 UNION -0.176 0.075 0.223 -0.087 0.414 0.052 -0.159 0.229 0.109 FAMBEN -4.039 0.039 0.289 -1.939 0.366 0.063 -5.810 0.018 0.361 TAX -0.113 0.257 0.098 -0.111 0.280 0.089 -0.219 0.078 0.220 INVOL 0.235 0.224 0.111 0.296 0.142 0.158 0.559 0.011 0.400 Youth Male youth Female youth
Coef. P>|t| R2 Coef. P>|t| R2 Coef. P>|t| R2 PTR 0.079 0.467 0.041 0.126 0.440 0.047 0.051 0.688 0.013 UNR -0.439 0.001 0.587 -0.632 0.001 0.609 -0.331 0.052 0.261 EPR 0.184 0.120 0.176 0.401 0.014 0.384 0.097 0.491 0.037 TEMP 0.048 0.638 0.018 0.194 0.102 0.192 -0.098 0.484 0.039 EDUC -0.146 0.301 0.082 -0.106 0.546 0.029 -0.337 0.059 0.248 OVER 0.181 0.712 0.011 0.996 0.049 0.267 -0.392 0.621 0.019 UNION 0.008 0.932 0.001 0.055 0.664 0.015 0.014 0.901 0.001 FAMBEN 2.572 0.148 0.154 2.683 0.287 0.087 3.986 0.061 0.244 TAX 0.084 0.341 0.070 0.085 0.487 0.038 0.127 0.233 0.107
13
INVOL -0.386 0.020 0.353 -0.459 0.006 0.455 -0.089 0.552 0.028 Source: Author’s calculations based on the Eurostat ELFS for 15 countries.
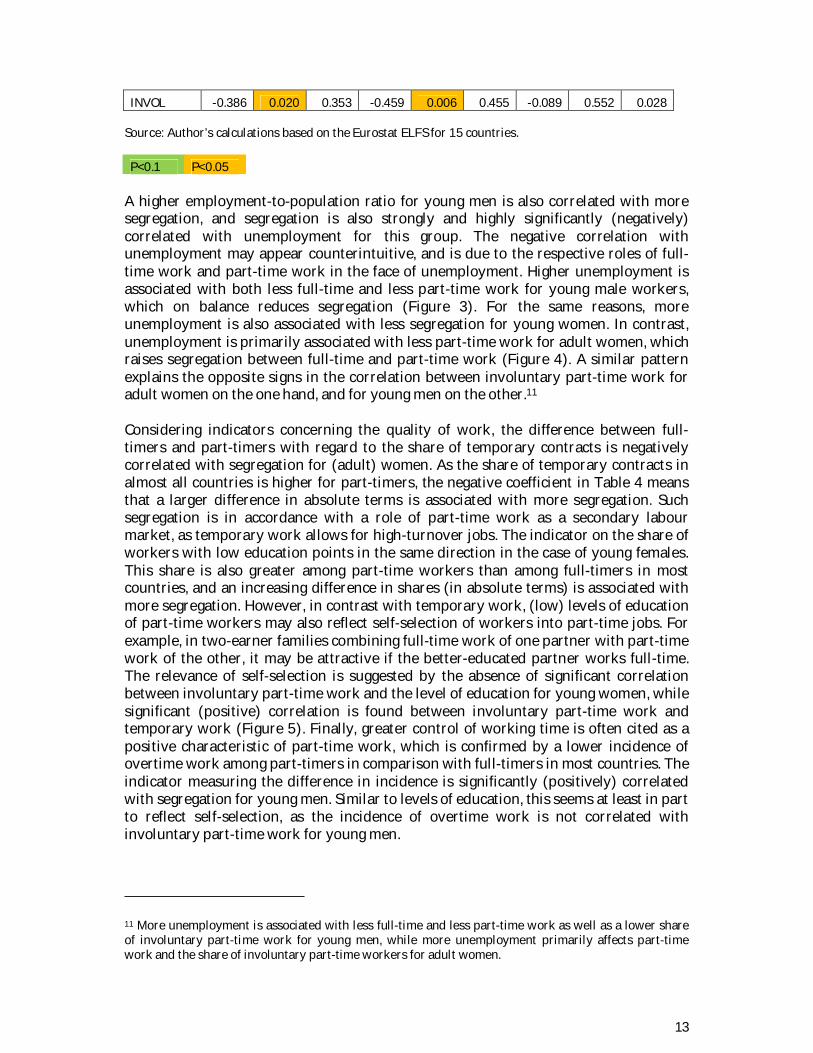
P<0.1 P<0.05 A higher employment-to-population ratio for young men is also correlated with more segregation, and segregation is also strongly and highly significantly (negatively) correlated with unemployment for this group. The negative correlation with unemployment may appear counterintuitive, and is due to the respective roles of full-time work and part-time work in the face of unemployment. Higher unemployment is associated with both less full-time and less part-time work for young male workers, which on balance reduces segregation (Figure 3). For the same reasons, more unemployment is also associated with less segregation for young women. In contrast, unemployment is primarily associated with less part-time work for adult women, which raises segregation between full-time and part-time work (Figure 4). A similar pattern explains the opposite signs in the correlation between involuntary part-time work for adult women on the one hand, and for young men on the other.11 Considering indicators concerning the quality of work, the difference between full-timers and part-timers with regard to the share of temporary contracts is negatively correlated with segregation for (adult) women. As the share of temporary contracts in almost all countries is higher for part-timers, the negative coefficient in Table 4 means that a larger difference in absolute terms is associated with more segregation. Such segregation is in accordance with a role of part-time work as a secondary labour market, as temporary work allows for high-turnover jobs. The indicator on the share of workers with low education points in the same direction in the case of young females. This share is also greater among part-time workers than among full-timers in most countries, and an increasing difference in shares (in absolute terms) is associated with more segregation. However, in contrast with temporary work, (low) levels of education of part-time workers may also reflect self-selection of workers into part-time jobs. For example, in two-earner families combining full-time work of one partner with part-time work of the other, it may be attractive if the better-educated partner works full-time. The relevance of self-selection is suggested by the absence of significant correlation between involuntary part-time work and the level of education for young women, while significant (positive) correlation is found between involuntary part-time work and temporary work (Figure 5). Finally, greater control of working time is often cited as a positive characteristic of part-time work, which is confirmed by a lower incidence of overtime work among part-timers in comparison with full-timers in most countries. The indicator measuring the difference in incidence is significantly (positively) correlated with segregation for young men. Similar to levels of education, this seems at least in part to reflect self-selection, as the incidence of overtime work is not correlated with involuntary part-time work for young men.
11 More unemployment is associated with less full-time and less part-time work as well as a lower share of involuntary part-time work for young men, while more unemployment primarily affects part-time work and the share of involuntary part-time workers for adult women.

14
Figure 3. Segregation, unemployment and employment of young male workers (percentages)
Source: Author’s calculations based on the Eurostat ELFS for 15 countries. Note: The x-coefficients of the three regression lines are significant at the 90 per cent confidence level. Figure 4. Segregation, unemployment, employment of adult female workers (percentages)

15
Source: Author’s calculations based on the Eurostat ELFS for 15 countries. Note: The x-coefficients of the regression lines for segregation and part-time workers are significant at the 90 per cent confidence level.
16
Figure 5. Involuntary part-time work, temporary contracts and education of young female workers (percentages)
Source: Author’s calculations based on the Eurostat ELFS for 15 countries. Note: The x-coefficient of the regression line for the share of workers with temporary contracts is significant at the 90 per cent confidence level. Institutional indicators seem primarily important for adult workers, and correlations are in line with expectations and the previous analysis. Union density is associated with less segregation for adult workers, which can be expected if unions aim to level the playing field between full-time and part-time work in terms of conditions of work. Marginal effective tax rates, which measure the extent to which taxes and benefits reduce the financial gain of increasing work hours, reduce segregation for adult women. In other words, a higher marginal effective tax rate makes it less attractive to switch from part-time to full-time, which reduces segregation between full-time and part-time work.12 Family benefits also lower segregation for adult women, which seems partly due to the positive correlation between family benefits and the EPR. Apart from raising the volume of employment for adult women, family benefits also appear to reduce the share of involuntary part-time workers and in this way widens occupational choice (Figure 6).13 In the case of young women, there is no relationship between family benefits and involuntary part-time work, but these benefits do affect (differences in) the share of workers with low education. As was noted before, a greater difference in this share is associated with segregation for young women (Figure 7).
12 The marginal effective tax rate is positively correlated with the part-time EPR for adult women. 13 The ‘involuntary’ element in involuntary part-time work refers to the number of hours of work, and not to the occupation of workers. Nevertheless, it seems likely that a reduction in the share of involuntary part-time work also involves occupational choices.

17
Figure 6. Segregation, family benefits and employment of adult female workers (percentages)
Source: Author’s calculations based on the Eurostat ELFS for 15 countries. Note: The x-coefficients of the three regression lines are significant at the 95 per cent confidence level. Figure 7. Segregation, family benefits and education of young female workers (percentages)
Source: Author’s calculations based on the Eurostat ELFS for 15 countries. Note: The x-coefficients of the regression lines are significant at the 90 per cent confidence level.

18
5. Conclusions This paper aimed to provide a systematic account of occupational segregation between part-time and full-time work in a sample of European countries. Monitoring such segregation is important because it helps explain disadvantages of part-time workers which in particular affect women and young workers, which are partly due to the limited occupational choices of part-time workers. On average, segregation by hours of work in the 15 countries examined in this paper amounted to 40 per cent, which is lower than the average level of segregation by sex in the European Union.14 Part-time work is more restrictive in terms of occupational choice for men than for women, and in most countries segregation is greater for youth than for adults. More generally, segregation tends to be more important for groups that are already in a disadvantaged labour market position. Segregation by hours may be explained by many factors, including some of the factors affecting segregation by sex such as differences in human capital and experience, preferences and stereotypes. The analysis in this paper demonstrated the relationships with three groups of indicators, which appear important for particular groups of workers but not for others. Such differences are likely to reflect differences in socioeconomic and labour market positions of these groups, including for example the level of part-time employment (the rate for a particular group). Given such differences, and the fact that segregation does not have a single-factor explanation, it is clear that the analysis does not identify causal mechanisms. Correlations between segregation and unemployment, for example, are dependent on which (additional) indicators are affected, which in turn may raise or lower segregation by hours. Opposite effects were also found with regard to institutional/policy indicators, which appear particularly relevant for women and younger workers, but do not have a uniform effect on segregation. In order for part-time to be freely chosen, as suggested by the ILO Part-Time Work Convention (No. 175), part-time work should be available in a broad range of sectors and occupations. The extent to which this is the case can be monitored using segregation by hours, which should be taken into account alongside other indicators capturing the quality of work. Gender differentials in current levels of segregation by hours suggest that a good starting point would be to promote the convergence of male and female part-time employment rates, particularly in countries in which the latter are relatively high. Such convergence can be expected to reduce both gender equality in terms of hours of work and segregation by hours of work.
14 For example, Bettio and Verashchagina (2009) report a level of occupational segregation by sex of 51.0 per cent in 2007 (based on a similar methodology as used in the current paper).
19
References Abhayaratna, J.; Andrews, L.; Nuch, H.; Podbury, T. 2008. “Factors affecting part time employment of young workers,” in Part Time Employment: the Australian Experience. Australian Government Productivity Commission. Melbourne. Andrews, M.; Bradley, S.; Stott, D. 2004. “Measuring pre‐and post‐labour market occupational segregation using careers service data,” Journal of Education and Work, Volume 17, No. 1, pp. 3-26. Antecol, H.; Cobb-Clark, D.A. 2010. “Do Non-Cognitive Skills Help Explain the Occupational Segregation of Young People?”, IZA Discussion Paper, No. 5093. Bonn. Bardasi, Elena; Gornick, Janet C. 2008. “Working for less? women’s part-time wage penalties across countries”, Feminist Economics, Vol. 14, No. 1, pp. 37–72. Bettio, Francesca; Verashchagina, Alina. 2009. Gender segregation in the labour market. Root causes, implications and policy responses in the EU. Luxembourg, Publications Office of the European Union. Buddelmeyer, H.; Mourre, G.; Ward, M. 2008. “Why Do Europeans Work Part-time? A Cross-country Panel Analysis”, European Central Bank Working Paper, No. 872. Frankfurt-am-Main. Charles, Maria; Grusky, David B. 1995. “Models for describing the underlying structure of sex segregation”, American Journal of Sociology, Vol. 100, No. 4 (Jan.), pp. 931–971. EHRC. 2010. The EHRC Triennial Review: How fair is Britain? Equality and Human Rights Commision. Manchester. ILO. 2013. Global Employment Trends for Youth 2013: A generation at risk. Geneva. ILO. 2015a. Global Wage Report 2014/15: Wages and income inequality. Geneva. ILO, 2015b. Non-standard forms of employment. Report for discussion at the Meeting of Experts on Non-Standard Forms of Employment (Geneva, 16–19 February 2015). Geneva. Kjeldstad, Randi; Nymoen, Erik H. 2012. “Part-time work and gender: Worker versus job explanations”, in International Labour Review, Vol. 151, No. 1–2, pp. 85–107. Manning, Alan; Petrongolo, Barbara. 2008. “The part-time pay penalty for women in Britain”, The Economic Journal, Vol. 118, No. 526 (Feb.), pp. F28–F51. Matteazzi, Eleonora; Pailhé, Ariane; Solaz, Anne. 2013. Does Part-Time Employment Widen the Gender Wage Gap? Evidence from Twelve European Countries. ECINEQ Working Paper 2013-293. Society for the Study of Economic Inequality. Verona.

20
Matteazzi Eleonora, Pailhé Ariane; Solaz, Anne. 2014, “Part-Time wage penalties for women in prime age: a matter of selection or segregation? Evidence from four European countries”, Industrial and Labor Relations Review, 67, Vol. 3, pp. 955-985. Mulekar, Madhuri S.; Knutson, John C.; Champanerkar, Jyoti A. 2008. “How useful are approximations to mean and variance of the index of dissimilarity?”, Computational Statistics & Data Analysis, Vol. 52, No. 4, pp. 2098–2109. OECD. 2010. “How Good is Part-Time Work,” Chapter 4 in OECD Employment Outlook 2010: Moving Beyond the Jobs Crisis. Paris. O'Reilly, Jacqueline; Fagan, Colette. 1998. Part-time Prospects: an international comparison of part-time work in Europe, North America and the Pacific Rim. Routledge. London. Sparreboom, Theo. 2014. ‘Gender equality, part-time work and segregation in Europe’, International Labour Review, Vol. 153, No.2, 2014, pp. 245-268. Tijdens, Kea G. 2002. “Gender roles and labor use strategies: Women’s part-time work in the European Union”, Feminist Economics, Vol. 8, No. 1, pp. 71–99. Van Bastelaer, A.; Lemaître, G.; Marianna, P. 1997. ‘The definition of part-time work for the purpose of international comparisons’, OECD Labour Market and Social Policy Occasional Papers, No. 22. Paris. World Bank. 2011. World Development Report 2012. Gender Equality and Development. Washington, DC.

21
Annex Table A. Incidence of part-time work, 2011
All Male Female Adult Male adult
Female adult
Youth Male youth
Female youth
Austria 18.3 6.2 32.3 18.6 5.3 33.8 16.6 11.9 22.2
Belgium 24.7 14.9 36.3 24.6 14.6 36.4 25.9 17.8 35.6
Denmark 18.5 13.0 24.6 11.3 6.6 16.5 59.8 51.1 68.6
Finland 11.9 8.6 15.4 9.3 6.7 12.0 34.2 25.8 42.2
France 13.8 6.0 22.4 13.2 5.4 21.8 19.8 12.4 29.1
Greece 9.3 5.9 14.2 9.0 5.7 13.8 16.1 11.1 23.6
Ireland 32.5 23.9 42.1 30.9 22.3 40.7 50.1 44.0 55.5
Italy 16.5 6.2 31.3 16.2 5.8 31.2 21.2 13.6 33.0
Luxembourg 15.6 4.6 29.8 15.6 4.2 30.3 16.5 12.3 21.6
Netherlands 36.6 15.9 60.3 31.2 8.7 57.6 65.9 57.9 73.9
Norway 20.4 11.2 31.1 15.4 7.2 25.0 53.1 39.3 67.2
Portugal 8.7 5.6 12.1 8.3 5.2 11.6 15.0 10.7 20.2
Spain 16.5 10.0 24.6 15.5 9.0 23.5 34.2 27.1 41.6
Sweden 12.6 8.2 17.3 9.6 6.0 13.5 36.4 26.3 46.9
United Kingdom 25.0 12.4 39.4 22.9 9.7 38.1 39.0 31.3 47.2
Source: Author’s calculations based on the Eurostat ELFS.