oct 10, 2019 jan 10, 2020
TRANSCRIPT

Authors Hardik Khatri, Analyst Sam Fenwick, Senior Analyst Ian Fogg, VP Analysis
Opensignal active userbase:
Opensignal is the independent global standard for analyzing consumer mobile
experience. Our industry reports are the definitive guide to understanding
the true experience consumers receive on wireless networks.
Total Devices
Total Measurements
Data Collection Period
37,836,754 128,131,428,824 Oct 10, 2019 – Jan 10, 2020

2
Mobile Network Experience Report The State of Mobile Games Experience in the 5G Era
Our Metrics
In Opensignal's unique new measure of
multiplayer mobile Games Experience,
Singapore took the gold medal with 85.5
It was followed by the Netherlands in second
with a score of 85.4 on a 100 point scale, and
Japan in bronze position scoring 85.3. Mobile
players enjoy an Excellent Games Experience
in only four countries. Besides Singapore, the
Netherlands and Japan, the Czech Republic
was the only other country where players
enjoyed a premiere mobile gaming experience.
28 out of 100 countries we analyzed
achieved an Excellent or Good mobile
Games Experience
But large esports markets, based on player
earnings, underperformed. Of the countries we
analyzed, the U.S. ranks top in esports
earnings, but placed 35th in mobile Games
Experience. Similarly, South Korea which is
second in esports earnings placed 14th, far
below the leading advanced markets.
Players in Asian countries have a more
varied Games Experience than in other
regions
31% of Asian countries rested in the Poor
category, 27% ended up in Fair, 15% achieved
Good status and 8% landed in the Excellent
category. Key Asian game markets are just
mid-table in Games Experience: In Hong Kong,
Malaysia, Thailand and Vietnam players’
Games Experience is Fair, while Indonesia
slipped into the Poor category with a score of
just 63.6.
Europe dominated the top twenty countries
Only Australia, South Korea, Singapore and
Japan were included from other regions.
However, large significant European markets
slipped down the rankings with Germany at
21st, the UK in 29th and Italy as low as 39th.
Opensignal has tested a range of mobile
game genres to quantify the impact of
different network conditions
Our testing basket included sports, multiplayer
online battle arena (MOBA), and battle royale
genres. In our research, we found game
designers try to mitigate poor network
connectivity issues through a number of
techniques which often means the game AI
(Artificial Intelligence) will take over from a
player to keep the game flowing, sometimes
without the player even realizing that this is
happening. But the precise sensitivity of the
user experience to underlying mobile network
conditions varies depending on the game
genre.
For battle royale games, the Netherlands
takes first place, knocking Singapore into
the silver position
In this genre — popularized by Fortnite, Garena
Free Fire, and PUBG — South Korea jumps
four places to 10th compared with its overall
mobile Games Experience. This highlights that
different game genres respond differently to
tricky mobile network conditions. Players in a
total of seven countries enjoyed an Excellent
battle royale mobile Games Experience.
Games Experience uses a scale of 0 to 100:
85<100 Excellent - The vast majority of users
deemed this network experience
acceptable.
75<85 Good - Most users deemed the experience
acceptable.
65<75 Fair - Users found the experience ‘average’.
40<65 Poor - Most users found this level of
experience unacceptable.
0<40 Very Poor - Nearly all users found this level
of experience unacceptable.

3
Mobile Network Experience Report The State of Mobile Games Experience in the 5G Era
Our Metrics
Across the world, mobile games generate vast amounts of revenue.
Ovum estimates mobile games represent the majority of total video game
revenue, this global trend is even greater in emerging mobile first
markets.
Apple App Store and Google Play store mobile game revenue amounted
to $9.2 billion in the third quarter of 2019 according to IHS Markit and
Priori Data. The U.S. generated the greatest share, with mobile game
revenue of over $2.5 billion, followed by Japan with just over $2 billion.
Despite having a population of just 51 million South Korea generated
over $500 million in mobile game revenue in this one quarter alone.
Including China, App Annie forecasts the mobile games industry will
generate revenues of $100 billion in 2020.
The mobile industry sees that 5G’s improved latencies, as well as higher
speeds, will greatly increase the appeal of real-time multiplayer mobile
gaming and perhaps eventually even lead to a shift to cloud gaming.
Already, we have seen break-out smartphone multiplayer games become
successful — for example Fortnite, Garena Free Fire, Pokemon Go, PUBG
— on today’s 4G networks as well as efforts to take multiplayer hits from
consoles or PC and translate those titles to mobile with games like
Minecraft, FIFA, Hearthstone, or Pro Evolution Soccer (PES). The
deployment of 5G will improve the responsiveness and reliability of
mobile networks which will make the experience of playing mobile
multiplayer games even more enjoyable.
When 4G launched, mobile operators routinely bundled video streaming
services such as Hulu and Netflix with mobile tariff plans to highlight the
advantages of 4G technology. Now, we are already seeing operators look
to mobile game services to fulfill the same role for 5G. Hatch — a spin-off
of Angry Birds maker Rovio — has signed mobile game deals with
numerous operators including, docomo (Japan); Deutsche Telekom
4
Mobile Network Experience Report The State of Mobile Games Experience in the 5G Era
Our Metrics
(Germany); Elisa (Finland); LG Uplus (Korea); SK Telecom (Korea); Sprint
(U.S.); Vodafone (Italy & others).
Indonesia’s Telkomsel promotes multiplayer mobile games like Arena of
Valor and Free Fire as a core part of its offering. It’s not alone, across Asia
operators are targeting the fast growing mobile game audience. A group
of six operators is working on the mobile game opportunity together,
including Airtel (India); AIS (Thailand); Globe (Philippines); Optus
(Australia); and Singtel (Singapore) and Singtel also has a separate bilateral
link-up with SK Telecom.
In 2019, Apple launched Apple Arcade, its own subscription mobile game
service. Google countered with the launch of its own mobile game and
app subscription service, Google Play Pass, while continuing to work on
the troubled Google Stadia cloud gaming service.
Device makers have had success with game-specific smartphone models.
While most have been offered by smaller makers such as Razer, Asus
(ROG) or Xiaomi subsidiary Black Shark, the arrival of high refresh rate
displays means we will see mainstream makers follow 2019’s Oneplus 7
Pro and Google Pixel 4 and also adopt gaming-friendly high refresh rate
technology in order to differentiate.

5
Mobile Network Experience Report The State of Mobile Games Experience in the 5G Era
Our Metrics
Opensignal’s unique new mobile Games Experience analyzes multiplayer
gaming across different game genres based on our testing of a range of
mobile games, including battle royale game Fortnite, Pro Evolution Soccer
(PES) and multiplayer online battle arena (MOBA) game Arena of Valor.
We conducted laboratory testing of popular mobile game titles. We
asked individuals to play each game under different mobile network
conditions and then score the experience on each occasion. From this
primary research, Opensignal created a mean opinion score (MOS) model
which characterizes the exact relationship between real-world technical
measurements and the real gaming experience. This is the first time that
an MOS model has been developed specifically to analyze multiplayer
mobile games at a global scale.
Our approach to multiplayer mobile games is similar to the ITU-based
MOS methodology Opensignal has previously developed to assess the
experience of mobile video and voice apps. It enables Opensignal to
quantify how the complicated interaction of different individual measures
of network conditions affects users’ overall mobile Games Experience.
Opensignal uses measurements of real-world mobile network conditions
to assess the Games Experience felt by users on different networks and
across countries. We quantify the real-world mobile Games Experience
users have on mobile networks around the world on a 0 to 100 point
scale, based on Opensignal’s real-world measurements of mobile network
conditions.

6
Mobile Network Experience Report The State of Mobile Games Experience in the 5G Era
Our Metrics
Opensignal mobile Games Experience has the following categories:
85<100 Excellent The vast majority of users deemed this network experience acceptable. Nearly all
respondents felt like they had control over the game, and they received immediate
feedback on their actions. There was not a noticeable delay in almost all cases.
75<85 Good Most users deemed the experience acceptable. Gameplay experience is generally
controllable, and the user receives immediate feedback between their actions and the
outcomes in the game. Most users did not experience a delay between their actions
and the game.
65<75 Fair Users found the experience ‘average’. In most cases the game is responsive to the
actions of the player with most users reporting that they felt like they had control over
the game. The majority of players reported that they noticed a delay between their
actions and the outcomes in the game.
40<65 Poor Most users found this level of experience unacceptable. The majority of users
reported seeing a delay in the gameplay experience and they did not receive
immediate feedback on their actions. Many users felt a lack of controllability in the
Games Experience.
0<40 Very Poor Nearly all users found this level of experience unacceptable. Almost all users
experienced a noticeable delay within the game, with most of them not feeling like
they had control of the the gameplay. The vast majority of players didn’t receive
immediate feedback on their actions.
The mobile Games Experience score focuses on the multiplayer Games
Experience. But no single measure is sufficient to record all the parts of
users’ mobile network experience. For example, Opensignal already has
two measures that are relevant for other aspects of mobile games:
• Video Experience quantifies game video streaming services like
Twitch or YouTube Gaming. When consumers wish to watch
recorded highlight streams of games our existing direct
measurement of mobile video quality is relevant. In a recent
survey, Opensignal found 18.7% of U.S. consumers watched
video streams of games. For more, see Opensignal’s recent
State of Mobile Video Experience report.
• Download Speed Experience helps to understand how quickly
game updates can be ready. Multiplayer games often require
every player to have the most recent version of the game. Often
with games like Call of Duty or Fortnite these updates can be
hundreds of megabytes in size, sometimes even gigabytes.

7
Mobile Network Experience Report The State of Mobile Games Experience in the 5G Era
Our Metrics
While Singapore and Japan occupy first and third place —
offering users an Excellent Games Experience — their East
Asian peers don’t make their presence felt until much
further down the rankings, with esports leader South
Korea ranked just 14th and Taiwan ranked 24th and each
being in the Good category.
This first look across 100 countries for mobile Games
Experience gives a sense of the extent to which mobile
gamers and developers need to focus on compensating
for latency, jitter and packet loss and other issues which
affect players’ experience when playing multiplayer
games or developing new games for each market. The
lower the Games Experience score, the harder it will be to
win in challenging multiplayer titles.
Eight out of the top 10 countries hail from Europe. This
trend continues as we move down the table with 19 out
of the top 25 hailing from Europe. The Baltic States are all
within the top 25, with Estonia and Latvia within two
places of each other (15th and 17th, respectively) and
Lithuania bringing up the rear in 23rd place. Central and
Eastern Europe is also well represented, with Bulgaria, the
Czech Republic, Hungary and the Slovak Republic all in
the top 20.
These countries appear to have squeezed out some of
Europe’s largest economies, with France, Italy, Germany
and the UK all absent from the top 20.
Similarly, North America is conspicuous by its absence
from the top quarter of the rankings, with Canada 0.3
points short of tying with Taiwan for 24th place. The U.S.
and Mexico fall short in comparison, coming 35th and
61th, respectively. 37.6
38.6
38.9
38.9
39.1
39.2
39.5
39.7
39.9
40.2
40.7
42.6
42.6
43.1
44.1
44.4
44.5
45.0
45.3
45.8
46.1
49.2
49.3
50.1
52.9
53.0
54.3
54.7
54.7
54.8
54.9
54.9
56.9
57.4
57.8
57.9
58.4
59.0
59.8
60.2
61.4
63.0
63.3
63.3
63.6
63.6
63.8
65.4
65.4
65.6
66.2
67.6
68.4
68.8
69.0
70.4
71.2
71.5
71.7
71.8
72.2
72.4
72.5
73.2
73.2
73.3
73.6
73.9
74.4
74.4
74.7
74.9
75.2
75.6
75.6
75.8
76.1
76.7
76.9
77.1
77.8
78.1
78.6
79.6
79.8
79.9
79.9
80.6
80.7
80.8
81.8
82.9
82.9
83.3
83.6
83.9
85.2
85.3
85.4
85.5
0 20 40 60 80 100
Uzbekistan 100
Pakistan 99
Kazakhstan 98
UAE 97
Ghana 96
Côte d'Ivoire 95
Cambodia 94
Philippines 93
Kenya 92
Peru 91
South Africa 90
Bahrain 89
Algeria 88
Ecuador 87
Kyrgyzstan 86
Paraguay 85
Bangladesh 84
Nigeria 83
Bolivia 82
Libya 81
Nepal 80
Saudi Arabia 79
Panama 78
Kuwait 77
Colombia 76
Azerbaijan 75
El Salvador 74
Senegal 73
Jordan 72
Egypt 71
Morocco 70
Chile 69
Costa Rica 68
Argentina 67
Sri Lanka 66
Guatemala 65
India 64
Russian Federation 63
Ukraine 62
Mexico 61
Turkey 60
Tunisia 59
Dominican Republic 58
Qatar 57
Georgia 56
Indonesia 55
Honduras 54
Brazil 53
Myanmar 52
Laos 51
Malaysia 50
Armenia 49
Belarus 48
Greece 47
Israel 46
Oman 45
Albania 44
Hong Kong SAR, China 43
Thailand 42
Cyprus 41
Vietnam 40
Italy 39
Uruguay 38
Romania 37
Serbia 36
USA 35
Portugal 34
Spain 33
Lebanon 32
Poland 31
Kosovo 30
UK 29
France 28
New Zealand 27
North Macedonia 26
Canada 25
Taiwan 24
Lithuania 23
Norway 22
Germany 21
Bulgaria 20
Slovenia 19
Sweden 18
Latvia 17
Slovak Republic 16
Estonia 15
South Korea 14
Croatia 13
Australia 12
Ireland 11
Hungary 10
Switzerland 9
Denmark 8
Finland 7
Belgium 6
Austria 5
Czech Republic 4
Japan 3
Netherlands 2
Singapore 1
Global mobile Game Experience
Exc
elle
nt
Go
od
Fai
rP
oo
rV
ery
Po
or
Mobile Games Experience
Data collection period: Oct 10, 2019 –Jan 10, 2020 | © Opensignal Limited
4G/5G Users Games Experience

8
Mobile Network Experience Report The State of Mobile Games Experience in the 5G Era
Our Metrics
However, unlike our State of Mobile Video Experience report, the U.S.
escaped falling into last place when compared to its G7 peers. Italy won
that dubious distinction for mobile Games Experience, ranking 39th and
placed in the Fair category.
Turning to emerging markets, where smartphone penetration and mobile
gaming is rapidly rising, it’s interesting to see that some of the most
promising countries in this regard, such as Malaysia (50th, 66.2) and Brazil
(53rd, 65.4) narrowly make it into the Fair category. This indicates most
users thought the gaming experience was average and the majority of
users noticed a delay between their actions and the outcomes in the
game — hurting their enjoyment and the prospects of winning.
Indonesia narrowly falls short of holding the same category with a score
of 63.6, but it has less work to do to earn a Fair category rating than India,
given the latter’s score of 58.4.
Thailand and the Philippines are both outliers, with Thailand surpassing
its immediate neighbors and 3.3 points away from securing a Good
category position while the Philippines ranks 93th with a score of 39.7
and a Very Poor category rating. With a low mobile Games Experience
score, mobile gamers are likely to either play solo games or seek out a
good quality Wifi network to play mobile games which defeats the point
of a mobile experience.

9
Mobile Network Experience Report The State of Mobile Games Experience in the 5G Era
Our Metrics
Esports have become a large spectator sport. We compared the countries
whose players have the largest esports winnings in U.S. dollars with the
mobile Games Experience of users. Perhaps surprisingly there is very little
correlation, because historically esports have been mostly played on fixed
networks. This is changing as mobile esports competitions are
becoming more popular. But for now, mobile players in many of these
countries lack the conditions to win in multiplayer mobile games unless
they travel abroad.
Among the top 30 countries by esports winnings, players in Philippines,
Pakistan, Russia and the Ukraine have a mobile Games Experience where
most users will find the service provided by the mobile network
unacceptable. While in both Brazil and Malaysia, most users will find the
experience only average.
Despite having gold, silver and bronze medal positions in terms of esports
winnings, users in the U.S., South Korea and Sweden all had a mobile
Games Experience below 80. Mobile gamers in many of these top 40
countries would be better placed to win games on mobile networks if
there was a better mobile Games Experience available. It’s especially
striking that South Korea, a country known for its Starcraft obsession
and for providing numerous esports players for teams based in the U.S.
and across Europe, does not enjoy a stronger mobile Games Experience.

10
Mobile Network Experience Report The State of Mobile Games Experience in the 5G Era
Our Metrics
Looking at how the different regions break down by category, it is
interesting to note that countries in the Excellent category are only
present in Asia Pacific and Europe, while these two regions combined
with North America account for all those in the Good category. No
European countries fell into the lowest category, Very Poor. The Asia
Pacific region is the most diverse of the five regions, with representation
from countries in all five categories, and more countries in the Very Poor
category than in Excellent. Consisting of three countries and with each
falling into a different category, North America is something of a mixed
bag with the Games Experience becoming worse as one travels from
North to South.
Turning to South & Central America, the region appears to be fairly
homogenous from a category perspective, with 87% of all of the featured
countries in the region falling into the Poor category and the remainder
being Fair. Despite this modest Games Experience, mobile games are still
popular. In Brazil over half the online population plays mobile games
indicating an opportunity for mobile operators that do offer a good
gaming experience. In both South & Central America, Africa and the
Middle East, the Games Experience in the vast majority of countries is

11
Mobile Network Experience Report The State of Mobile Games Experience in the 5G Era
Our Metrics
either mostly unacceptable or overwhelmingly so and the same holds true
for 50% of the countries we’ve studied in Asia Pacific.
In Asia, mobile games are extremely popular; across Indonesia over 70%
of the population plays mobile games. To meet the needs of players in
regions where the mobile games are popular but the multiplayer Games
Experience is Fair or Poor, game developers often have to design less
demanding versions of games. A good example was Tencent and PUBG
Corp.’s decision to launch PUBG Mobile Lite. This version has smaller
maps battlegrounds and limits the number of players to just 60 rather
than 100 players. This title launched in specific areas of Southeast Asia,
South Asia, North Africa, and South America.
One of the genres we tested was battle royale, an extremely popular type
of multiplayer games genre. For example, Fortnite hit 250 million users in
March 2019. Other titles in this genre include Call of Duty, Free Fire, and
PlayerUnknown's Battlegrounds (PUBG).
To win in battle royale games, players typically need a very good mobile
network because of the large number of players in the game, the resulting
large quantity of time-dependent network traffic, and the precision
needed to shoot other players and avoid being shot.
12
Mobile Network Experience Report The State of Mobile Games Experience in the 5G Era
Our Metrics
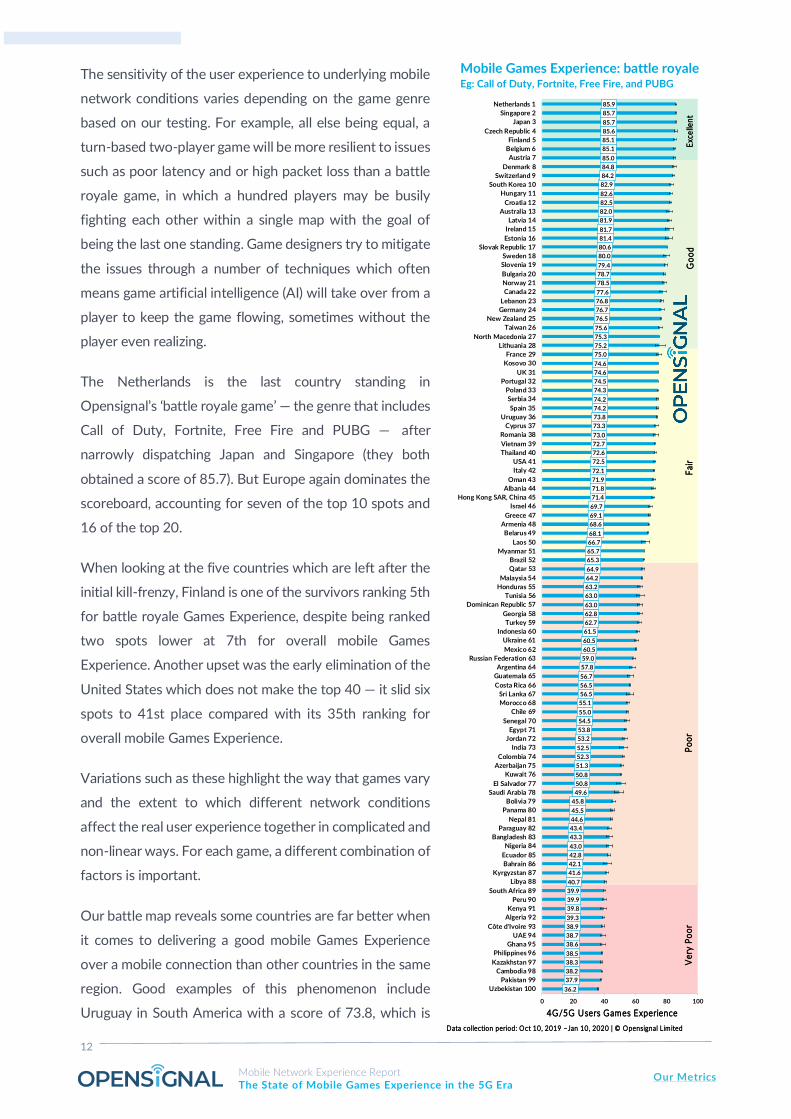
The sensitivity of the user experience to underlying mobile
network conditions varies depending on the game genre
based on our testing. For example, all else being equal, a
turn-based two-player game will be more resilient to issues
such as poor latency and or high packet loss than a battle
royale game, in which a hundred players may be busily
fighting each other within a single map with the goal of
being the last one standing. Game designers try to mitigate
the issues through a number of techniques which often
means game artificial intelligence (AI) will take over from a
player to keep the game flowing, sometimes without the
player even realizing.
The Netherlands is the last country standing in
Opensignal’s ‘battle royale game’ — the genre that includes
Call of Duty, Fortnite, Free Fire and PUBG — after
narrowly dispatching Japan and Singapore (they both
obtained a score of 85.7). But Europe again dominates the
scoreboard, accounting for seven of the top 10 spots and
16 of the top 20.
When looking at the five countries which are left after the
initial kill-frenzy, Finland is one of the survivors ranking 5th
for battle royale Games Experience, despite being ranked
two spots lower at 7th for overall mobile Games
Experience. Another upset was the early elimination of the
United States which does not make the top 40 — it slid six
spots to 41st place compared with its 35th ranking for
overall mobile Games Experience.
Variations such as these highlight the way that games vary
and the extent to which different network conditions
affect the real user experience together in complicated and
non-linear ways. For each game, a different combination of
factors is important.
Our battle map reveals some countries are far better when
it comes to delivering a good mobile Games Experience
over a mobile connection than other countries in the same
region. Good examples of this phenomenon include
Uruguay in South America with a score of 73.8, which is
Mobile Games Experience: battle royale
Exc
elle
nt
Go
od
Fai
rP
oo
rV
ery
Po
or
Data collection period: Oct 10, 2019 –Jan 10, 2020 | © Opensignal Limited
4G/5G Users Games Experience
Eg: Call of Duty, Fortnite, Free Fire, and PUBG
36.2
37.9
38.2
38.3
38.5
38.6
38.7
38.9
39.3
39.8
39.9
39.9
40.7
41.6
42.1
42.8
43.0
43.3
43.4
44.6
45.5
45.8
49.6
50.8
50.8
51.3
52.3
52.5
53.2
53.8
54.5
55.0
55.1
56.5
56.5
56.7
57.8
59.0
60.5
60.5
61.5
62.7
62.8
63.0
63.0
63.2
64.2
64.9
65.3
65.7
66.7
68.1
68.6
69.1
69.7
71.4
71.8
71.9
72.1
72.5
72.6
72.7
73.0
73.3
73.8
74.2
74.2
74.3
74.5
74.6
74.6
75.0
75.2
75.3
75.6
76.5
76.7
76.8
77.6
78.5
78.7
79.4
80.0
80.6
81.4
81.7
81.9
82.0
82.5
82.6
82.9
84.2
84.8
85.0
85.1
85.1
85.6
85.7
85.7
85.9
0 20 40 60 80 100
Uzbekistan 100
Pakistan 99
Cambodia 98
Kazakhstan 97
Philippines 96
Ghana 95
UAE 94
Côte d'Ivoire 93
Algeria 92
Kenya 91
Peru 90
South Africa 89
Libya 88
Kyrgyzstan 87
Bahrain 86
Ecuador 85
Nigeria 84
Bangladesh 83
Paraguay 82
Nepal 81
Panama 80
Bolivia 79
Saudi Arabia 78
El Salvador 77
Kuwait 76
Azerbaijan 75
Colombia 74
India 73
Jordan 72
Egypt 71
Senegal 70
Chile 69
Morocco 68
Sri Lanka 67
Costa Rica 66
Guatemala 65
Argentina 64
Russian Federation 63
Mexico 62
Ukraine 61
Indonesia 60
Turkey 59
Georgia 58
Dominican Republic 57
Tunisia 56
Honduras 55
Malaysia 54
Qatar 53
Brazil 52
Myanmar 51
Laos 50
Belarus 49
Armenia 48
Greece 47
Israel 46
Hong Kong SAR, China 45
Albania 44
Oman 43
Italy 42
USA 41
Thailand 40
Vietnam 39
Romania 38
Cyprus 37
Uruguay 36
Spain 35
Serbia 34
Poland 33
Portugal 32
UK 31
Kosovo 30
France 29
Lithuania 28
North Macedonia 27
Taiwan 26
New Zealand 25
Germany 24
Lebanon 23
Canada 22
Norway 21
Bulgaria 20
Slovenia 19
Sweden 18
Slovak Republic 17
Estonia 16
Ireland 15
Latvia 14
Australia 13
Croatia 12
Hungary 11
South Korea 10
Switzerland 9
Denmark 8
Austria 7
Belgium 6
Finland 5
Czech Republic 4
Japan 3
Singapore 2
Netherlands 1

13
Mobile Network Experience Report The State of Mobile Games Experience in the 5G Era
Our Metrics
more than 30 points above Paraguay, and 16 points higher than
Argentina. Similarly, in the Middle East, Oman’s score of 71.9 is streaks
ahead of Saudi Arabia’s 49.6.
Poor connectivity,
e.g. high packet loss or a connection break
The top player appears to have stopped moving, likely
because the game server is missing too many data packets.
By contrast, the lower player is moving as that player
intends.
If the animations above do not play please see the videos
published on our website.
Different type of poor connection
e.g. poor latency or jitter
The top player appears to jump around — likely because too
many data packets are arriving significantly out of order or
the latency of the connection is poor, or perhaps a
combination of both issues to a lesser extent but which
together still cause problems.
Portions of the materials used are trademarks and/or
copyrighted works of Epic Games, Inc. All rights reserved by
Epic.
To create Opensignal’s unique new mobile Games Experience measure,
we use a range of technical characteristics as inputs into our model which
characterizes the exact relationship between the various real-world
technical measurements and users’ perceived gaming experience. Our
inputs include the following, among other network characteristics:
• Packet loss is, in essence, the proportion of data packets that
never reach their destination. In a game, in effect this means the
player’s actions may never take effect, or that the state of the
game stops being communicated back to the player. This hurts a
player’s ability to enjoy a game, as well as making it harder to win.
Where a game detects small amounts of packet loss, a game may
even temporarily take control from the player, without notifying
14
Mobile Network Experience Report The State of Mobile Games Experience in the 5G Era
Our Metrics
players, to keep the game flowing. Of course, this makes winning
harder! For larger amounts of packet loss, this is impossible.
• Latency, which is a measure of the responsiveness of the
network connection. For real-time multiplayer gaming, latency
needs to be low, and consistently low. Even a few brief seconds
of poor latency can cause a player to miss a shot and ruin a game.
For mobile Games Experience, Opensignal has focused on
measures of User Datagram Protocol (UDP) latency rather than
Transmission Control Protocol (TCP), as UDP is the preferred
protocol for time-sensitive applications such as mobile gaming.
Historically, latencies on mobile networks have been significantly
poorer than on fixed broadband connections or on Wifi, but 4G
has significantly improved latency, and 5G will reduce latency
even further, likely meaning there will be little difference
between mobile network latency and other kinds of network in
the near future.
• Jitter is a measure of the variability of the arrival time of data
packets. All data packets take time to travel between locations —
for example between a player and the game server — but often
the amount of delay varies between packets. This variability is
jitter. In an extreme situation, if some packets have too much
delay, the system will have given up by the time they arrive as
they are too late to be useful. Higher jitter levels are often a sign
of network congestion, caused by routers struggling to pass on
data packets.
In a Mean Opinion Score (MOS) model methodology, there is often a non-
straightforward relationship between these inputs and their effect on a
player’s user experience. For example, once latency deteriorates above a
certain threshold, any further reduction in quality may have no further
effect on a player’s mobile Games Experience because the latency is
already terrible. But on a moderate connection, even a few milliseconds
of difference, could have a big impact. Similarly, small changes of latency
may only affect user experience if both packet loss and jitter are within a
fair range, else, the connection may be too bad already for latency to have
an impact on the player’s experience.
15
Mobile Network Experience Report The State of Mobile Games Experience in the 5G Era
Our Metrics
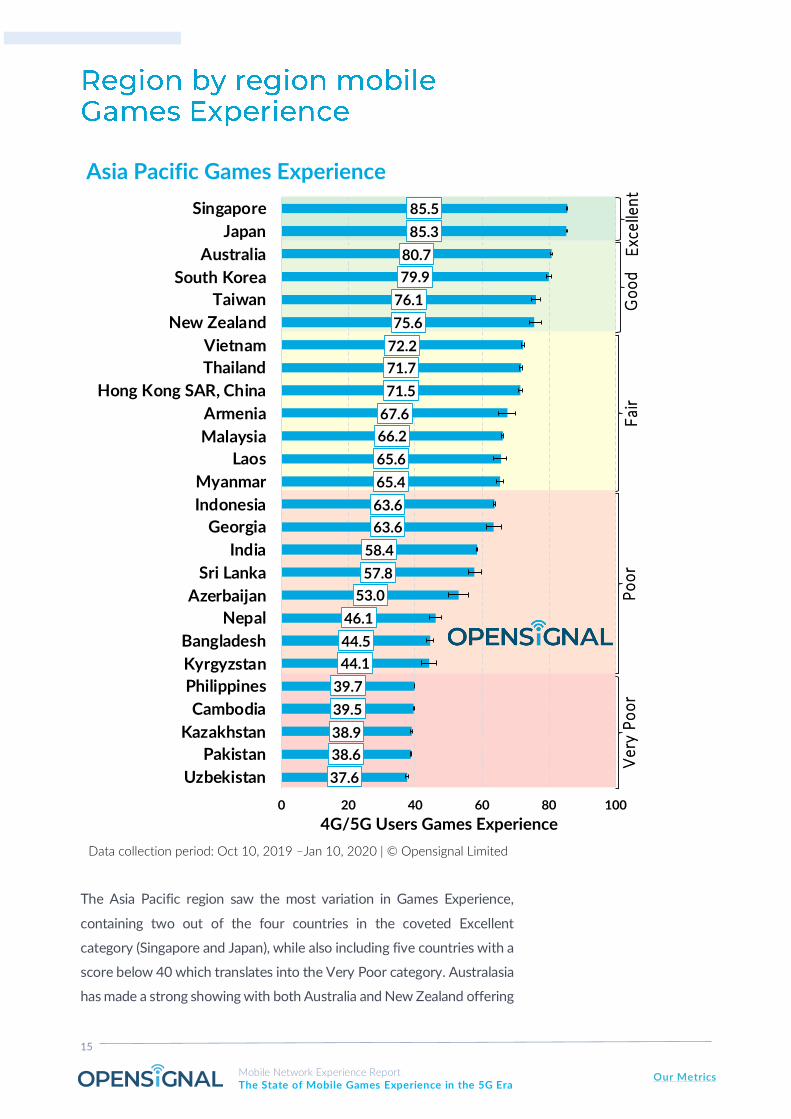
The Asia Pacific region saw the most variation in Games Experience,
containing two out of the four countries in the coveted Excellent
category (Singapore and Japan), while also including five countries with a
score below 40 which translates into the Very Poor category. Australasia
has made a strong showing with both Australia and New Zealand offering
85.5
85.3
80.7
79.9
76.1
75.6
72.2
71.7
71.5
67.6
66.2
65.6
65.4
63.6
63.6
58.4
57.8
53.0
46.1
44.5
44.1
39.7
39.5
38.9
38.6
37.6
0 20 40 60 80 100
Singapore
Japan
Australia
South Korea
Taiwan
New Zealand
Vietnam
Thailand
Hong Kong SAR, China
Armenia
Malaysia
Laos
Myanmar
Indonesia
Georgia
India
Sri Lanka
Azerbaijan
Nepal
Bangladesh
Kyrgyzstan
Philippines
Cambodia
Kazakhstan
Pakistan
Uzbekistan
Asia Pacific Games Experience
Data collection period: Oct 10, 2019 –Jan 10, 2020 | © Opensignal Limited
4G/5G Users Games Experience
Ve
ry P
oo
rP
oo
rF
air
Go
od
Exc
elle
nt

16
Mobile Network Experience Report The State of Mobile Games Experience in the 5G Era
Our Metrics
players a Good experience, with Australia being the stronger of the two
and ranking third in the region.
Turning to some of the countries that make up the fast growing Southeast
Asia gaming market, Singapore, Vietnam and Thailand are the strongest
performers with Singapore coming first both regionally and globally while
Thailand’s score of 71.7 means that it is not quite in the same league,
although it still outperforms all of its neighbours. Malaysia and Indonesia
score slightly higher than the average score observed for this region
(61.1), but of the two only Malaysia’s score elevates it from the Poor
category that applies to the regional average to the Fair category. Users
across India enjoy a much better mobile Games Experience than
neighbors Pakistan with scores of 58.4 and 38.6 respectively, and also
ahead of Bangladesh’s 44.5. However, India’s Games Experience is tied
with users in Sri Lanka.
Canada once again is the North American country to beat when it comes
to mobile experience, having previously come in top place for Voice App
and Video Experience in our reports on these metrics. For mobile Games
Experience, Canada’s impressive score of 75.8 nudges it into the Good
category, which means that most users deemed the service acceptable
and the gameplay experience is generally controllable.
75.8
73.3
60.2
0 20 40 60 80 100
Canada
USA
Mexico
North America Games Experience
4G/5G Users Games Experience
Data collection period: Oct 10, 2019 –Jan 10, 2020 | © Opensignal Limited
Go
od
Fai
rP
oo
r

17
Mobile Network Experience Report The State of Mobile Games Experience in the 5G Era
Our Metrics
While the United States’ score is only 2.5 points lower at 73.3 that is
enough to drop its average Games Experience down into the Fair
category, indicating that users found the service ‘average’ with most of
them noticing delays between their actions and the outcomes in the
game. However, with only 1.2 points between it and the Good category
there’s a good chance that it will rise above the 75-point threshold in the
coming year.
The South and Central America regions took fourth place compared with
other regions based on the average Games Experience score observed
for each region. The region lacks the giddy highs seen in Europe and Asia
Pacific, with Uruguay holding the top spot with a score of 72.5 — which
72.5
65.4
63.8
63.3
57.9
57.4
56.9
54.9
54.3
52.9
49.3
45.3
44.4
43.1
40.2
0 20 40 60 80 100
Uruguay
Brazil
Honduras
Dominican Republic
Guatemala
Argentina
Costa Rica
Chile
El Salvador
Colombia
Panama
Bolivia
Paraguay
Ecuador
Peru
South and Central America Games Experience
Data collection period: Oct 10, 2019 –Jan 10, 2020 | © Opensignal Limited
4G/5G Users Games Experience
Fai
rP
oo
r

18
Mobile Network Experience Report The State of Mobile Games Experience in the 5G Era
Our Metrics
places it in the Fair category — and Brazil narrowly falling within the same
category with a score of 65.4. This means that users in both countries
found the experience ‘average’ and the majority noticed a delay between
their actions and the game.
Aside from these bright spots, 13 out of the 15 countries in the region
that are featured in this report are in the Poor category, which means that
nearly all users found this level of service unacceptable. Peru narrowly
escaped falling into Very Poor, our lowest possible category, by just 0.2
points.
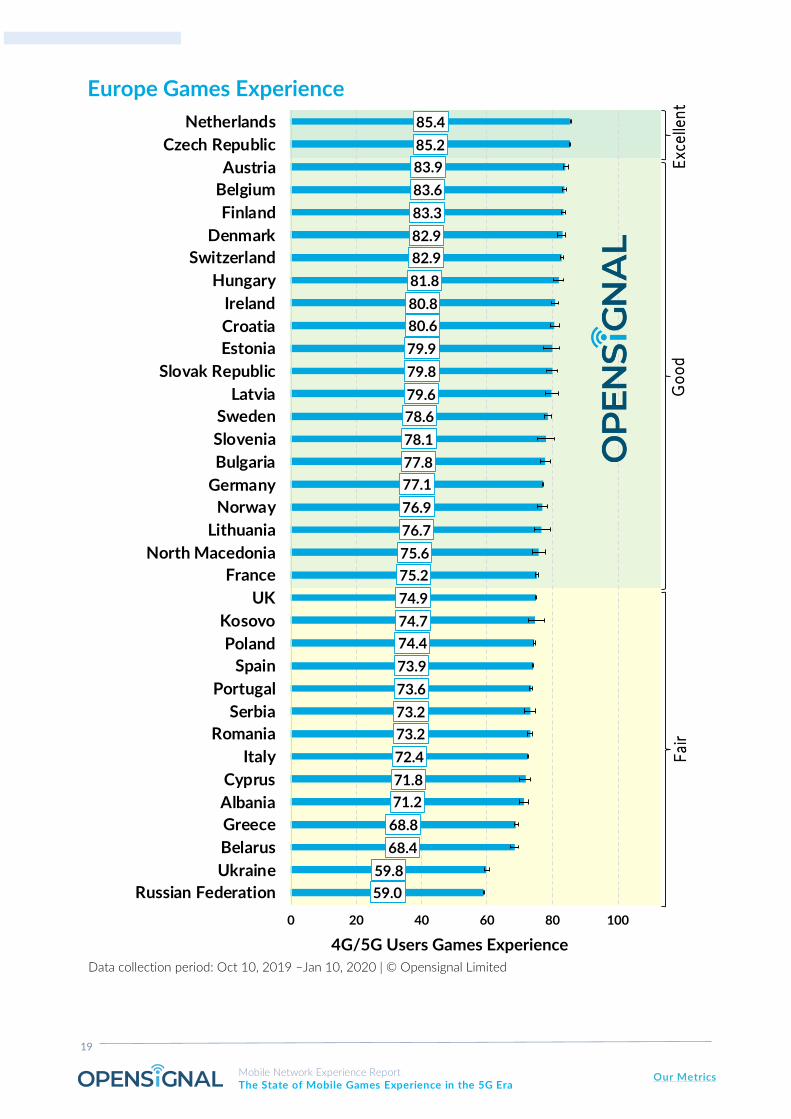
European countries have the highest average score out of all the regions
and also account for exactly 75% of the countries in our analysis that are
in either the Excellent or Good categories rankings. The region also holds
two out of the four countries in the world to be in the Excellent category,
which are the Netherlands and the Czech Republic. It’s also worth noting
that users in European countries also saw the least variation in scores
compared with other regions.
One take-away message is that big economic clout and large populations
doesn’t necessarily translate into a strong Games Experience. Out of the
four European members of the G7, only users in Germany and France
enjoyed a mobile Games Experience score which falls into the Good
category. The UK rates as Fair, and fell short by just 0.1 of a point, while
Italy is 2.6 points from reaching the Good category.
Both Germany and Italy did slightly better in terms of the overall Games
Experience metric than they did for our battle royale genre Games
Experience — they placed 21st versus 24th and 39th versus 42th,
respectively — while France dropped down one place for battle royale,
from 28th to 29th. Germany’s score of 77.1 was slightly above the
average European score of 76.4, but both fall into the Good category,
while Italy with a score of 72.4 is towards the lower end of the table but
has avoided falling into the bottom five European countries.
19
Mobile Network Experience Report The State of Mobile Games Experience in the 5G Era
Our Metrics
85.4
85.2
83.9
83.6
83.3
82.9
82.9
81.8
80.8
80.6
79.9
79.8
79.6
78.6
78.1
77.8
77.1
76.9
76.7
75.6
75.2
74.9
74.7
74.4
73.9
73.6
73.2
73.2
72.4
71.8
71.2
68.8
68.4
59.8
59.0
0 20 40 60 80 100
Netherlands
Czech Republic
Austria
Belgium
Finland
Denmark
Switzerland
Hungary
Ireland
Croatia
Estonia
Slovak Republic
Latvia
Sweden
Slovenia
Bulgaria
Germany
Norway
Lithuania
North Macedonia
France
UK
Kosovo
Poland
Spain
Portugal
Serbia
Romania
Italy
Cyprus
Albania
Greece
Belarus
Ukraine
Russian Federation
Europe Games Experience
4G/5G Users Games Experience
Data collection period: Oct 10, 2019 –Jan 10, 2020 | © Opensignal Limited
Exc
elle
nt
Go
od
Fai
r

20
Mobile Network Experience Report The State of Mobile Games Experience in the 5G Era
Our Metrics
Switzerland was ranked 9th both for Games Experience and when
looking at the battle royale genre and had the seventh highest Games
Experience score out of the European countries that made the top 100.
Africa and the Middle East includes 10 countries with scores of less than
50, with three slipping into Very Poor, our lowest possible category. In
fact, 86% of the reported countries in this region are in either the Poor or
the Very Poor category.
All in all, 14 countries in total offer a Poor experience, which means that
most users found this level of service unacceptable, with a majority of
users seeing a delay in the gameplay experience and many feeling a lack
of controllability in the Games Experience. While this may seem
discouraging, there are a few bright spots with Oman, Lebanon and Israel
pulling through to enter the Fair category. Surprisingly, of the three,
Lebanon is the strongest performer being just 0.6 points shy of the Good
category.

21
Mobile Network Experience Report The State of Mobile Games Experience in the 5G Era
Our Metrics
74.4
70.4
69.0
63.3
63.0
61.4
54.9
54.8
54.7
54.7
50.1
49.2
45.8
45.0
42.6
42.6
40.7
39.9
39.2
39.1
38.9
0 20 40 60 80 100
Lebanon
Oman
Israel
Qatar
Tunisia
Turkey
Morocco
Egypt
Jordan
Senegal
Kuwait
Saudi Arabia
Libya
Nigeria
Algeria
Bahrain
South Africa
Kenya
Côte d'Ivoire
Ghana
UAE
4G/5G Users Games Experience
Africa and Middle East Games Experience
Data collection period: Oct 10, 2019 –Jan 10, 2020 | © Opensignal Limited
Fai
rP
oo
rV
ery
Po
or

22
Mobile Network Experience Report The State of Mobile Games Experience in the 5G Era
Our Metrics
We collect billions of individual measurements every day from many
millions of smartphones worldwide. Our measurements are collected at
all hours of the day, every day of the year, under conditions of normal
usage, including inside buildings and outdoors, in cities and the
countryside, and everywhere in between. By analyzing on-device
measurements recorded in the places where subscribers actually live,
work and travel, we report on mobile network service the way users truly
experience it. We continually adapt our methodology to best represent
the changing experience of consumers on mobile networks and,
therefore, comparisons of the results to past reports should be
considered indicative only.
For every metric we calculate statistical confidence intervals indicated on
our graphs. When confidence intervals overlap, our measured results are
too close to declare a winner. In those cases, we show a statistical draw.
For this reason, some metrics have multiple operator winners.
In our bar graphs we represent confidence intervals as boundaries on
either sides of graph bars. In our supporting-metric charts we show
confidence intervals as +/- numerical values.

23
Mobile Network Experience Report The State of Mobile Games Experience in the 5G Era
Our Metrics
Measures the average video experience of
Opensignal users on 3G and 4G networks for each
operator. Our methodology involves measuring
real-world video streams and uses an ITU-based
approach for determining video quality. The metric
calculation takes picture quality, video loading time
and stall rate into account. We report video
experience on a scale of 0-100.
Measures the quality of experience for over-the-
top (OTT) voice services — mobile voice apps such
as WhatsApp, Skype, Facebook Messenger etc. —
using a model derived from the International
Telecommunication Union (ITU)-based approach
for quantifying overall voice call quality and a series
of calibrated technical parameters. This model
characterizes the exact relationship between the
technical measurements and perceived call quality.
Voice App Experience for each operator is
calculated on a scale from 0 to 100.
Measures how mobile users experience real-time
multiplayer mobile gaming on an operator’s
network. Measured on a scale of 0-100, it analyzes
how the multiplayer mobile Games Experience is
affected by mobile network conditions including
latency, packet loss and jitter to determine the
impact on gameplay and the overall multiplayer
Games Experience.
Measures the average proportion of time
Opensignal users spend with a 4G connection on
each operator’s network.
Measures the average download speed
experienced by Opensignal users across an
operator's 3G and 4G networks. It doesn't just
factor in 3G and 4G speeds, but also the availability
of each network technology. Operators with lower
4G Availability tend to have a lower Download
Speed Experience because their customers spend
more time connected to slower 3G networks.
Measures the average upload speed experienced by
Opensignal users across an operator's 3G and 4G
networks. Upload Speed Experience doesn't just
factor in 3G and 4G speeds, but also the availability
of each network technology. Operators with lower
4G Availability tend to have a lower Upload Speed
Experience because their customers spend more
time connected to slower 3G networks.
Measures the average latency experienced by
Opensignal users across an operator's 3G and 4G
networks. Latency, measured in milliseconds, is the
delay users experience as data makes a round trip
through the network. A lower score in this metric is
a sign of a more responsive network.
Measures how mobile subscribers experience 4G
coverage on an operator’s network. Measured on a
scale of 0-10, it analyzes the locations where
customers of a network operator received a 4G
signal relative to the locations visited by users of all
network operators.