october, 28,2016 3rd quarter, business results for the
TRANSCRIPT

目次
October, 28,20163rd Quarter, Business Results for the
Fiscal Year Ending December 31, 2016

CONTENTS
1
Progress of Earnings Forecast3
2 Marketing Business
FY2016Q3 Summary of Consolidated Financial Results
1
4
5 Reference Materials 2
Reference Materials 1“Road map & Medium and long term strategy”
*Unstated amounts are rounded down to the nearest one million yen unit, and percentages are rounded to the nearest unit.
FY2016Q3Summary of Consolidated Financial ResultsFinancial Results

Total
�Substantial increase Ordinary income and Net incomeRevenue :17,017 YoY+8.1%Operating income : 208 YoY(5.0%)Ordinary income : 375 YoY Substantial increaseNet income : 486 YoY Substantial increase
�Continuously growing revenue as planed
FY2016Q3 Executive Summary
3
Marketing Business
�Continuously growing revenue as planed
Revenue :16,668 YoY+7.9%Gross profit : 3,159 YoY+6.1%Operating income : 437 YoY(11.9%)Gross profit margin : 19.0% YoY(0.3p)Operating income margin : 1.5% YoY(0.6p)
Investment and Value Creation
BusinessOperating loss : 53 Overseas
BusinessRevenue : 354Operating loss : 31

FY2015 Q3 FY2016 Q3 YoY
Revenue 15,747 17,017 +8.1%
Gross profit 3,186 3,408 +7.0%
SGA 2,966 3,200 +7.9%
EBITDA 489 463 (5.4%)
[Consolidated]
FY2016Q3 Summary of Consolidated Financial Results
4
EBITDA 489 463 (5.4%)
Operating income 219 208 (5.0%)
Ordinary income 34 375 Substantialincrease
Net income 67 486 Substantialincrease
Gross profitmargin 20.2% 20.0% (0.2p)
Operating income margin 1.4% 1.2% (0.2p)
Net incomemargin 0.4% 2.9% +2.5p

FY2014 FY2015 FY2016
Q1 Q2 Q3 Q4 Q1 Q2 Q3 Q4 Q1 Q2 Q3 YoY
Marketing Business
Revenue 14,081 14,233 15,105 14,877 16,122 15,585 15,441 14,679 18,188 16,405 16,668 +7.9%
Operating income 125 178 298 289 633 340 496 345 1,052 463 437 (11.9%)
Investment and Value
Revenue 4,654 0 0 204 0 392 1 627 0 38 0 ―
[Consolidated Quarterly Revenue and Operating Income (Loss) by Segment]
FY2016Q3 Summary of Consolidated Financial Results
and Value Creation Business
Revenue 4,654 0 0 204 0 392 1 627 0 38 0 ―
Operating income 4,482 (15) (31) (60) (55) 310 (38) 392 (46) (34) (53) ―
Overseas Business
Revenue 349 416 503 480 309 358 372 383 363 355 354 (5.0%)
Operating income (46) (70) (2) 0 (29) (10) (34) (15) (16) (62) (31) ―
OtherRevenue 516 508 537 514 (34) (57 (68) (61) 0 2 (5) ―
Operating income (173) (216) (144) (143) (183) (186) (204) (139) (100) (92) (145) ―
TotalRevenue 19,602 15,158 16,145 16,077 16,397 16,278 15,747 15,628 18,551 16,802 17,017 +8.1%
Operating income 4,388 (123) 120 86 363 454 219 583 889 274 208 (5.0%)
5

274300
362
357348
4,654
204 392 1
38
16,000
17,000
18,000
19,000
20,000Marketing Business Overseas Business and Other Investment and Value Creation Business
〜〜
[Revenue]
FY2016Q3 Summary of Consolidated Financial Results
14,081 14,23315,105 14,877
16,12215,585 15,441
14,679
18,188
16,405 16,668
866 925
1,040995
300 304
322
204
627
10,000
11,000
12,000
13,000
14,000
15,000
16,000
Q1 Q2 Q3 Q4 Q1 Q2 Q3 Q4 Q1 Q2 Q3
FY2014 FY2015 FY2016
6

284
250 268343 4453,200
3,400
3,600
3,800
4,000Marketing Business Overseas Business and Other Investment and Value Creation Business
4,496
[Gross profit by segment]
〜〜
FY2016Q3 Summary of Consolidated Financial Results
1
12
2,3952,501
2,8072,652
3,004 2,945 2,9772,839
3,529
3,145 3,159421392
424
457
197152
206
234
2,000
2,200
2,400
2,600
2,800
3,000
3,200
Q1 Q2 Q3 Q4 Q1 Q2 Q3 Q4 Q1 Q2 Q3
FY2014 FY2015 FY2016
7

633496
1,052
463 437
310 392
200
300
400
500
600
700
800 Marketing Business Investment and Value Creation Business Overseas Business Other Adjustment
[Operating income by segment]
〜〜4,482
FY2016Q3 Summary of Consolidated Financial Results
125 178298 289 340 345
463 437
(15) (31) (60) (55) (38) (46) (34) (53)
(200)
(100)
0
100
200
Q1 Q2 Q3 Q4 Q1 Q2 Q3 Q4 Q1 Q2 Q3
FY2014 FY2015 FY2016
8
Totaloperatingincome
4,388 (123) 120 86 363 454 219 583 889 274 208
TotalOperating Income
Excluding Investmentand Value Creation
Business(94) (108) 151 146 419 143 257 190 935 308 261

Marketing BusinessMarketing Business

[Revenue]
15,000
16,000
17,000
18,000
YoY+7.9%
Continuously growing
YoY+7.9%
Marketing Business summary
10
10,000
11,000
12,000
13,000
14,000
Q1 Q2 Q3 Q4 Q1 Q2 Q3 Q4 Q1 Q2 Q3
FY2014 FY2015 FY2016
YoY+7.9%

18.6% 18.6%
18.9%
19.3% 19.3%
19.4%
19.2%19.0%
3,000
3,200
3,400
3,600[Gross profit/Gross profit margin]
YoY+6.1%
YoY +6.1%Strategic reduction
of gross profit
Marketing Business summary
17.0%
17.6%17.8%
2,000
2,200
2,400
2,600
2,800
Q1 Q2 Q3 Q4 Q1 Q2 Q3 Q4 Q1 Q2 Q3
FY2014 FY2015 FY2016
11
of gross profit margin

3.9%
5.8%
800
1,000
1,200[Operating income / Operating income margin]
Invest for improvement of profitability
Operating income
Marketing Business summary
0.9%1.3%
2.0%
1.9%2.2%
3.2%
2.4%
2.8%2.6%
0
200
400
600
Q1 Q2 Q3 Q4 Q1 Q2 Q3 Q4 Q1 Q2 Q3
FY2014 FY2015 FY2016
12
Operating income temporary decrease

1,000
1,200
1,400
2,800,000
Gross profit per person Number of employee
[Gross profit per person / Number of employee]
YoY+4.3%
Steadily increase
+4.3%
Marketing Business summary
(Unit:Yen)(Unit:person)
0
200
400
600
800
2,000,000Q1 Q2 Q3 Q4 Q1 Q2 Q3 Q4 Q1 Q2 Q3
FY2014 FY2015 FY2016
13
YoY +4.3%

40.0%
45.0%
50.0%
[Focus Products : Smartphone ads share]
Keep increasing
+30%
Marketing Business summary
20.0%
25.0%
30.0%
35.0%
Q1 Q2 Q3 Q4 Q1 Q2 Q3 Q4 Q1 Q2 Q3
FY2014 FY2015 FY2016
14
YoY +30%

[Focus Products: Infeed ads]
Accelerating growth
+60%
Marketing Business summary
Q1 Q2 Q3 Q4 Q1 Q2 Q3
FY2015 FY2016
15
YoY +60%

[Focus Products :Social ads]
Keep growing2.5times
Marketing Business summary
Q1 Q2 Q3 Q4 Q1 Q2 Q3 Q4 Q1 Q2 Q3
FY2014 FY2015 FY2016
16
YoY 2.5times

[Focus Products : Movie ads]
Steadily increase
+15%
Marketing Business summary
Q1 Q2 Q3 Q4 Q1 Q2 Q3
FY2015 FY2016
17
YoY +15%

[Focus Products :LINE]
Revenue
Enhanced revenue
share
Marketing Business summary
Q3 Q3
FY2015 FY2016
18
RevenueYoY Approx.
7timesshare
YoY 7times

Progress of Earnings ForecastProgress of Earnings Forecast

FY2016Forecast
FY2016Cumulative result Progress
Revenue 67,000 52,370 78.2%
FY2016 Progress of Earnings Forecast
�Revenue and Operating income : According to forecast �Ordinary income and Net income :Larger than the forecast by gain on
investments in partnership and gain on sales of investment securities
20
Revenue 67,000 52,370 78.2%
EBITDA 2,700 2,106 78.0%
Operating income 1,800 1,371 76.2%
Ordinary income 1,300 1,434 110.3%
Net income 500 761 152.3%

Investment andValue Creation
Business600
Marketing
FY2016 Forecasts 1,800FY2015:1,620
[Breakdown of Operating income]
FY2016Cumulative 1,371
FY2016 Progress of Earnings Forecast
MarketingBusiness
1,800
Overseas Business(90)
Other(700)
21
MarketingBusiness
2,450
Other(400)
Investment and Value Creation Business (150)
Overseas Business(100)
MarketingBusiness
1,953
Other(336)
Investment and Value Creation Business (134)
Overseas Business(110)
Reference Materials 1Reference Materials 1“Road map & Medium and long term strategy”

Road map to Vision
Establishment of digital business・Sharing Economy・Big Data
From an internal perspective, our vision is to generate revenue of ¥1 trillion and ordinary income totaling ¥100 billion. With 100 companies each employing 100 staff, an aggregate workforce of 10,000 employees each taking up one hundred challenges.
Corp
orat
e va
lue
■Aim to achieve net sales of 1,000 billion yen and ordinary income of 100 billion yen by expanding businesses from total support services in the digital business arena through our own efforts
Establishment of Investment and Value
Expansion of digital support business
・Big Data・E-Commerce
challenges.
FY2015 FY2020 FY20××
23
・Marketing Business
Before period Medium term policy Next Phase
FY2017
Establishment of Internet ad Agency
Investment and Value Creation Business
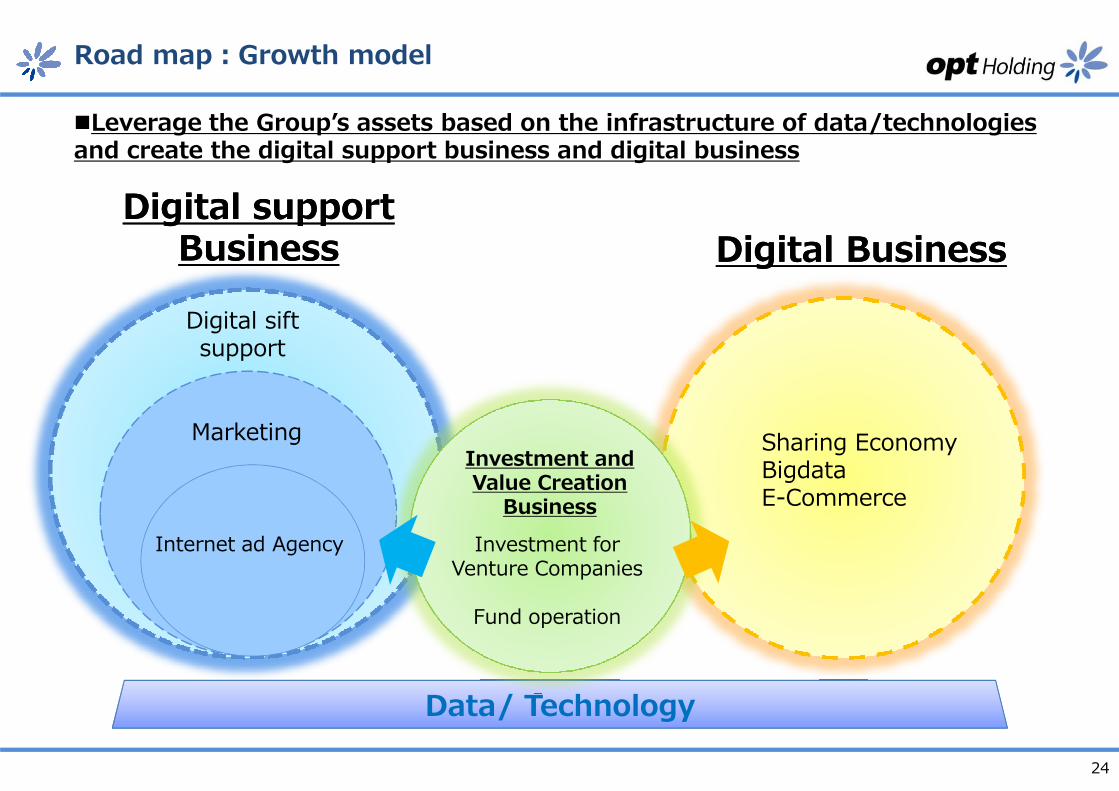
Road map:Growth model
�Leverage the Group’s assets based on the infrastructure of data/technologies and create the digital support business and digital business
Digital support Digital support BusinessBusiness Digital BusinessDigital Business
Digital sift support
Data/ Technology
ネット広告代理
MarketingInvestment and Value Creation
BusinessInvestment for
Venture Companies
Fund operation
Sharing EconomyBigdataE-Commerce
24
Internet ad Agency

Reference Materials 2Reference Materials 2

[SGA costs]
Reference Materials
1,500
2,000
2,500
3,000
26
Q1 Q2 Q3 Q4 Q1 Q2 Q3 Q4 Q1 Q2 Q3
FY2014 FY2015 FY2016
Total SGA 2,924 3,017 3,111 3,011 2,836 2,986 2,966 2,937 2,924 3,134 3,200
Personal expences 1,900 1,891 1,947 1,910 1,779 1,815 1,858 1,795 1,780 1,913 1,932
Rents 173 177 195 186 234 235 238 257 248 246 237
Advertising expences 95 65 88 75 25 37 37 47 35 53 59
Depreciation and amortization 78 161 184 176 172 174 180 183 149 161 167
Others 675 721 695 662 624 724 651 652 711 760 802
0
500
1,000

[Number of employees]
Reference Materials
1,000
1,250
1,500
27※Excluding temporary staff and dispatch workers
Q1 Q2 Q3 Q4 Q1 Q2 Q3 Q4 Q1 Q2 Q3
FY2014 FY2015 FY2016
1,408 1,626 1,608 1,459 1,425 1,470 1,453 1,381 1,366 1,430 1,444
0
250
500
750

Changes in the Scope of Consolidation(As of FY2016 Q3-End)
Marketing BusinessMarketing Business
Reference Materials
Opt VenturesJapan Fund 1
28
Investment and Value Investment and Value Creation Business Creation Business
Overseas BusinessOverseas Business OtherOther

Name Business Ownership Status
OPT, Inc. Marketing business 100.00% Consolidated subsidiary
CLASSIFIED Planning and sales of classifieds 66.01% Consolidated subsidiary
Crossfinity SEO and media consulting business 90.00% Consolidated subsidiary
SOLDOUT Advertising agency for mid-sized and venture companies 66.60% Consolidated subsidiary
s1o interactive Trading desk business 100.00% Consolidated subsidiary
SkillUp Video Technologies Digital contents platform business 92.50% Consolidated subsidiary
ConnectOM Omni-channel solution business 100.00% Consolidated subsidiary
Reference Materials
Major consolidated Companies (As of FY2016 Q3-End)
29
Search LIFE Internet advertising operation business (53.28%) Consolidated subsidiary
Writeup. Co., Ltd Internet-related business 40.00% Consolidated subsidiary
Grooover, Inc. Native Ad and media business (incl. consulting) of smart device 100.00% Consolidated subsidiary
TechLoCo, Inc. Marketing technology proposal business for mid-, small- and medium-sized as well as growth companies (66.66%) Consolidated
subsidiary
Growth Gear Co,.Ltd Human resource support services business for mid-, small- and medium-sized as well as growth companies (66.66%) Consolidated
subsidiary
Platform ID Database business 51.00% Consolidated subsidiary
eMFORCE Internet advertising agency in South Korea 92.82% Consolidated subsidiary
OPTSEA Marketing business and Investment businessin Taiwan, Hong Kong and South East Asia 94.19% Consolidated
subsidiary
OPT America Consulting, investment, and alliance business in the US 100.00% Consolidated subsidiary
OPT Ventures, Inc. VC business, investment business, public offering advisory business, management information service, other 100.00% Consolidated
subsidiary

OPT Holding, Inc. TSE 1st Section 2389
http://www.opt.ne.jp/holding/ For all IR-related inquiries including requests for interviews, please
contact the Group Management Planning Office as follows:
This document is based on information available and views held at the time of its preparation. Statements contained in this document that are not historical facts (including but not limited to plans, forecasts and strategies) are “forward-looking statements.” These forward-looking statements, both expressed and implied, may differ materially from actual results and future developments.
<Notice>
contact the Group Management Planning Office as follows:TEL: +81-3-5745-3611 Mail: [email protected]