oecd economic surveys: latvia 2015 number of reforms are in the pipeline concerning social spending,...
TRANSCRIPT

OECD Economic Surveys LATVIA February 2015 OVERVIEW
© OECD 2015

2
This document and any map included herein are without prejudice to the status of or sovereignty over any territory, to the delimitation of international frontiers and boundaries and to the name of any territory, city or area.
The statistical data for Israel are supplied by and under the responsibility of the relevant Israeli authorities. The use of such data by the OECD is without prejudice to the status of the Golan Heights, East Jerusalem and Israeli settlements in the West Bank under the terms of international law.
© OECD 2015

OECD Economic Surveys: Latvia
© OECD 2015
Executive summary
● Main findings
● Key recommendations
The statistical data for Israel are supplied by and under the responsibility of the relevant Israeliauthorities. The use of such data by the OECD is without prejudice to the status of the Golan Heights,East Jerusalem and Israeli settlements in the West Bank under the terms of international law.
9
1© OECD 2015

EXECUTIVE SUMMARY
Main findingsLatvia has made rapid progress in adjusting its economy since the economic crisis, as
illustrated by its successful entry to the euro area at the beginning of 2014, and hasimplemented wide-ranging structural reforms. The recovery has been strong with record-high growth rates. However, the economy is volatile and GDP is still below its pre-crisislevel. It is challenging to replace unsustainable and loan-financed domestic demandgenerated by the real estate bubble before 2008. Unemployment has come downconsiderably, but long-term unemployment and emigration remain issues. Latvia has atradition of providing “bridging” services between East and West and attracts non-residentdeposits mainly from countries outside the EU. It is important to acknowledge the volatilecharacter of a business model based on non-resident resources, not least because of thegeopolitical instability of the region.
Raising productivity and ensuring robust convergence
The economic recovery slowed as the global economic environment deteriorated. Thevulnerability of the economy to external developments highlights the need to improveresilience and to move domestic production and exports up the value chain. Despitesignificant improvement, informality, entry barriers and red tape, notably linked to thecomplexity of the permits and licenses system, still undermine Latvia’s attractiveness formanufacturing investors and the productivity of exporters. Public involvement in theeconomy is extensive and poses regulatory and competition challenges. Governance ofstate-owned enterprises could improve with the Public Persons Enterprises and CapitalShares Governance Law adopted in October 2014, but room for improvement remains.Energy security is fragile, reflecting high energy intensity and lack of interconnectedsupply networks. The vocational education and lifelong learning systems are critical tomoving up the global value chains but do not yet fully provide the skills students andemployers need.
Improving public sector efficiency for more inclusive growth
Latvia is one of the most unequal societies when compared with OECD countries anda high share of the population is at risk of poverty. The social safety net is underdevelopedand not well targeted at those most in need. The tax structure is skewed towards distortivetaxes on labour, with relatively low property and environmental taxes. In particular, the taxwedge is high for low-income earners and contributes to the elevated level of long-termunemployment. The efficiency of tax administration and collection stands well belowinternational standards, not least due to a prevalent grey economy. In the long term, thereis a risk that spending allocated to key public services (education, health, pensions) willprove inadequate in view of desired outcome improvements.
Limiting the risk of repeated boom-bust cycles
Latvia experienced a boom-bust cycle between 2004 and 2009. Since 2007, macro-prudential policies have been implemented to reduce the risk of instability in the financialsector. Major improvements in the fiscal framework have also been achieved with theintroduction of a structural budget balance rule, medium-term budgeting, bindingexpenditure ceilings, a restriction on expenditure growth and oversight by a fiscal council.Nevertheless, cases of extreme market turbulence may generate access barriers tointernational financial markets, thereby hampering the implementation of countercyclicalfiscal policy. Also, some risks related to features of the financial sector, such as the largeshare of non-resident deposits, might be difficult to eliminate.
OECD ECONOMIC SURVEYS: LATVIA © OECD 201510
2© OECD 2015

EXECUTIVE SUMMARY
Key recommendations
Raising productivity and ensuring robust convergence
● Make regulation more competition-friendly by reducing entry barriers.
● Continue reducing red tape, by simplifying the permits and licenses system and taxpayments.
● Bring the governance of state-owned enterprises further in line with the OECDGuidelines on Corporate Governance of State-Owned Enterprises.
● Continue improving the connectivity of energy networks with the rest of theEuropean Union.
● Proceed with the reform of vocational education and training, including the plannedextension of work-based learning.
● Encourage lifelong learning and training by improving information about trainingopportunities and adult learning while ensuring the portability of skills.
Improving public sector efficiency for more inclusive growth
● Strengthen efforts to tackle tax fraud and improve tax collection.
● Evaluate the current benefit system and make universal social benefits more targeted atlow-income households.
● Gradually withdraw benefits targeted at low-income earners when they take up a job.
● Decrease the labour tax wedge for low-income earners.
● Raise additional revenues by increasing property and environmentally related taxes.
Limiting the risk of repeated boom-bust cycles
● Reinforce countercyclical liquidity buffers.
● Continue using leverage ratios, together with risk-weighted capital ratios, for gaugingthe strength of bank balance sheets.
● Continue monitoring non-resident banking businesses to identify and address financialstability risks at an early stage.
OECD ECONOMIC SURVEYS: LATVIA © OECD 2015 11
3© OECD 2015

4© OECD 2015

OECD Economic Surveys: Latvia
© OECD 2015
Assessment and recommendations
● A volatile economy
● Strong recovery clouded by weakening regional prospects
● Limiting the risk of repeated boom and bust cycles
● Improving public sector efficiency for more inclusive growth
● Raising productivity and ensuring robust convergence
13
5© OECD 2015

ASSESSMENT AND RECOMMENDATIONS
PPPs).
183569
13
Latvia is a small open economy with a population of around 2 million that has made
significant progress in catching-up to the income levels of the more advanced economies
over the past twenty years. After re-gaining its independence in 1991, Latvia joined the
WTO in 1999, the European Union (EU) in 2004 and most recently the euro area in
January 2014. Since 2011, economic growth has been one of the highest in Europe.
Nevertheless, there remains a large convergence potential both in terms of income and
well-being. In 2013, GDP per capita was 55% below the best performing OECD countries
(Figure 1). Were the current speed of convergence to be maintained, 1½ generations would
be needed to catch up with the above average performing OECD countries. However,
population ageing and migration constrain future growth prospects. The working age
population has already started to shrink and will fall by 16% by 2060 according to long-term
projections (’no policy change’ scenario, European Commission, 2012). Much of the
remaining catching-up thus needs to come from productivity increases.
Latvia lags behind the OECD and its regional peers in a number of social and economic
dimensions measuring the quality of life (Figure 2). While the employment rate and the
level of skills is close to the OECD average, life expectancy and life satisfaction are relatively
low even when compared with countries with similar income levels. Around 35% of the
population is at risk of poverty (vs. 24.5% in the EU) and the level of income inequality
ranks as one of the highest when compared with OECD countries. The environmental
quality in urban areas is also a concern, notably air pollution, with a level of particulate
emissions exceeding the OECD average by around 40%.
Figure 1. The gap in GDP per capita remains wideGap to the upper half of OECD countries,1 %
1. Percentage gap with respect to the simple average of the highest 17 OECD countries in terms of GDP per capita (in constant 2005Source: OECD National accounts database and World Bank, WDI database.
1 2 http://dx.doi.org/10.1787/888933
1995 1996 1997 1998 1999 2000 2001 2002 2003 2004 2005 2006 2007 2008 2009 2010 2011 2012 20- 80
- 70
- 60
- 50
- 40
- 30
- 20
- 10
Latvia Czech Republic Estonia Slovenia Slovak Republic
OECD ECONOMIC SURVEYS: LATVIA © OECD 201514
6© OECD 2015

ASSESSMENT AND RECOMMENDATIONS
etweenositivesures a1.atisticsHealth
183572
Policymaking in recent years has been marked by substantial reform activity in
response to the legacy of the 2009 global crisis. The macroeconomic framework has been
improved substantially: new medium-term based fiscal rules and macro-prudential tools
have been adopted. A number of reforms are in the pipeline concerning social spending,
the judiciary, vocational education and training.
Nevertheless, further reforms are needed to address structural vulnerabilities, to
maintain a high and sustainable pace of convergence and to make the economy more
resilient. The Survey finds that main priorities should be directed at the following policy
areas:
● To prevent a repeat of the build-up of internal and external imbalances, Latvia has
introduced a prudent counter-cyclical fiscal policy framework as well as strong financial
sector supervision. Nevertheless, fiscal liquidity buffers should be reinforced to address
adverse future macroeconomic shocks. Also, the existence of foreign-owned branches
and non-resident deposits in the banking sector could pose challenges for financial
sector oversight.
● The composition of public spending and the taxation system should be revised to reduce
the high level of inequality and structural unemployment. Social benefits should be
better targeted and barriers to low-wage employment, in particular the high tax wedge,
should be reduced.
Figure 2. Well-being indicators suggest a large scope for catching up
Note: These indicators are not comparable with the OECD How’s Life’s? well-being indicators. The figure shows the difference bthe values of the variable for the country with respect to the average of OECD countries, normalised by the standard deviation. A pdifference means that the country does better than the average of OECD countries in terms of this variable. When a variable meanegative component of well-being (air pollution, homicide rate and housing expenditure), the difference has been multiplied by -Source: OECD National accounts database, Eurostat database, World Development Indicators Database, OECD Labour Force Stdatabase, OECD PISA 2012 database, International Institute for Democracy and Electoral Assistance (IDEA) database, OECDStatistics database, Central Statistical Bureau of Latvia, WHO Mortality database and Gallup World Poll.
1 2 http://dx.doi.org/10.1787/888933
-4
-3
-2
-1
0
1
2GNI per capita
Employment rate
Student skills
Air pollution
Voter turnout
Life expectancy
Homicide rate
Life satisfaction
Housing expenditure
Quality of support network
Latvia
Estonia
Slovak Republic
OECD average
OECD ECONOMIC SURVEYS: LATVIA © OECD 2015 15
7© OECD 2015

ASSESSMENT AND RECOMMENDATIONS
● To make the most of Latvia’s openness, growth has to be underpinned by a better
business environment and enhanced human capital accumulation. These require a
reduction in red tape, the elimination of entry barriers and an improvement in the
competition environment. Lifelong learning should be further supported to ensure
jobseekers and low-productivity workers obtain the skills needed on the labour market.
The annex provides an overview of Latvia’s ranking for some indicators with respect to
OECD countries and its peers. OECD policy indicators suggest that Latvia has still some way
to go to catch up with OECD best performing policies. This is to some extent related to the
heritage from several decades of central planning. The focus of this accession review is
therefore not so much on documenting gaps, but more on the assessment of policy settings
with respect to supporting the process of catching-up with more advanced countries.
A volatile economyThe economy is marked by high volatility (Figure 3). In recent years, Latvia passed
through four major economic downturns: the collapse of the central planning system
in 1991; the local banking crisis in 1995; spill-overs of the Russian financial crisis in 1998,
and the most recent boom-bust episode starting with the EU accession in 2004 and
bursting in the late 2000s. The macroeconomic aggregates, including GDP, inflation,
unemployment rates, have displayed particularly large fluctuations in the last decade.
● Between 2000 and 2007, annual GDP growth reached 10% on average. Low interest rates,
an inflow of cheap credit and a belief in fast convergence led to a rapid expansion of the
financial sector and of non-financial sector indebtedness accompanied by high current
account deficits (Blanchard et al., 2013). Banking sector assets grew from 57% to 150% of
GDP and the private sector debt from 35% to 116% of GDP. The economy experienced an
inflationary spiral, with a doubling of unit labour costs and a real estate bubble.
● Between 2007 and 2010, the bursting of the domestic demand bubble coincided with the
international financial crisis, leading to a decrease in GDP by about a fourth. Credit
growth came to a halt by 2009 and in the context of the international financial crisis a
sudden stop in capital flows put a strain on the banking system. As a result of a maturity
mismatch, Parex, the second largest bank in the country with a significant business in
non-resident services, was nationalised in 2008 after being subject to a bank run.
The economy adapted swiftly to these macroeconomic shocks. Most of the imbalances
accumulated during the boom years, including the excessive increase in private sector
indebtedness, unsustainable current account deficits and oversized public spending
programmes, were addressed, backed by an international financial assistance programme
(EUR 7.5 billion, i.e. 30% of GDP, of which 4.5 billion was used). Latvia maintained the
currency peg with a view to joining the euro area. Thus, a significant internal devaluation
was implemented to rebalance the economy. The budget deficit was reduced significantly
within four years by implementing austerity measures amounting to 17% of GDP (Ministry
of Finance, 2014). Consolidation was made mainly on the expenditure side, including a
20% decrease in public sector wages, thus only moderately increasing the tax burden.
Internal devaluation came also from productivity increases stemming from labour
shedding. Unit labour costs decreased, restoring external competitiveness and supporting
an export-led recovery.
OECD ECONOMIC SURVEYS: LATVIA © OECD 201516
8© OECD 2015

ASSESSMENT AND RECOMMENDATIONS
183589
4
The adjustment has been rapid and impressive, but has come at a cost. Empirical
studies suggest that high volatility reduces trend growth and welfare, notably by
restraining investment in physical and human capital and raising economic insecurity
(OECD, 2012). A significant part of the adjustment in Latvia happened through massive
emigration flows, depriving the economy of qualified resources. On average 30 000 people
left every year during 2008-13 and the country lost some 8% of its population, mainly of
working age. The emigrants have been disproportionally young and relatively well
educated (OECD, 2013a). Despite the strong recovery since 2011 and recent overall
economic improvements, the legacy of the bust, in the form of bank credit contraction and
high long-term unemployment, still needs to be addressed.
Latvia is particularly exposed to external shocks because of its small size and tight links
with volatile neighbouring economies. Energy intensity is high and energy supply largely
depends on imports from Russia. The banking sector is mostly foreign-owned (mainly by
companies of Nordic origin) and around a third (35%) of banking assets come from non-
resident deposits, exposing the financial sector to risks linked to a volatile client base.
Furthermore, Latvia lags behind in terms of its integration into global-value chains,
investment in knowledge-based capital and innovative capacities. It exports mostly goods
with a low technological content (agricultural, food, wood, metals products). This is a
concern as productivity gains will be essential to move up the value chain and secure robust
convergence.
Strong recovery clouded by weakening regional prospectsGDP growth reached 4.2% in 2013, the highest rate in the EU (Figure 4, Panel A). It was
mainly driven by private consumption on the back of improved labour market
developments. The unemployment rate has decreased significantly from its peak of 20% at
the beginning of 2010, reaching 10.7% in the third quarter of 2014 (Figure 4, Panel C).
Figure 3. The economy is highly volatileGDP, Growth rate compared to the same quarter previous year, sa, %
Source: OECD Quarterly national accounts database.1 2 http://dx.doi.org/10.1787/888933
-20
-15
-10
-5
0
5
10
15
20
Q11996
Q11997
Q11998
Q11999
Q12000
Q12001
Q12002
Q12003
Q12004
Q12005
Q12006
Q12007
Q12008
Q12009
Q12010
Q12011
Q12012
Q12013
Q1201
Latvia Czech Republic EstoniaSlovak Republic Euro Area (18 countries) Slovenia
OECD ECONOMIC SURVEYS: LATVIA © OECD 2015 17
9© OECD 2015

ASSESSMENT AND RECOMMENDATIONS
, OECD
183593
- 6
- 3
0
3
6
9
12
15
18
50
70
90
110
130
- 10
0
10
20
30
40
50
Figure 4. Main short and medium-term economic indicators
Source: Central Statistical Bureau of Latvia, Eurostat, OECD National accounts database, OECD Main Economic Indicators databaseHousing prices database and OECD Economic Outlook 96 database.
1 2 http://dx.doi.org/10.1787/888933
C. Unemployment rate (%, sa)
A. Real GDP, sa, 2007 = 100 B. Inflation (CPI Harmonised, %, year-on-year)
D. Nominal house prices (2008 = 100)
E. Export performance for goods and services (2007 = 100) F. Fiscal balance and public debt (% of GDP)
Jan 07 Jan 08 Jan 09 Jan 10 Jan 11 Jan 12 Jan 13 Jan 14
CZE ESTSVN SVKLatvia
75
80
85
90
95
100
105
110
115
120
Q12007
Q3 Q12008
Q3 Q12009
Q3 Q12010
Q3 Q12011
Q3 Q12012
Q3 Q12013
Q3 Q12014
Q3
Latvia CZE EST
SVN SVK
0
5
10
15
20
25
Q12007
Q3 Q12008
Q3 Q12009
Q3 Q12010
Q3 Q12011
Q3 Q12012
Q3 Q12013
Q3 Q12014
Q3
Latvia CZE EST
SVN SVK
Q12007
Q3 Q12008
Q3 Q12009
Q3 Q12010
Q3 Q12011
Q3 Q12012
Q3 Q12013
Q3 Q12014
Q3
Latvia CZE EST
SVN SVK
85
90
95
100
105
110
115
120
125
130
135
Q12007
Q3 Q12008
Q3 Q12009
Q3 Q12010
Q3 Q12011
Q3 Q12012
Q3 Q12013
Q3 Q12014
Q3
Latvia CZE EST
SVN SVK
2005 2006 2007 2008 2009 2010 2011 2012 2013
Government netlending
Gross public debt,Maastrichtcriterion
OECD ECONOMIC SURVEYS: LATVIA © OECD 201518
10© OECD 2015

ASSESSMENT AND RECOMMENDATIONS
-profitr than
183602
2
Increases in net wages, from low levels, amounting to around 5% on average over the past
two years, supported household purchasing power. As the government deficit declined to
below 1% of GDP and the Medium-Term Objective was reached, fiscal consolidation
softened, decreasing the tax burden of households (Figure 4, Panel F).
Growth was also stimulated by the housing sector recovery. In 2012 and 2013, a new
policy providing temporary resident permits to investors attracted EUR 505 million
(over 2% of GDP). House prices recovered to around 70% of their pre-crisis level (Figure 4,
Panel D). Despite large increases in wages and house prices, inflation remained low, mainly
driven by falling global commodity prices and changes in indirect taxes and administered
prices (European Central Bank, 2013). The adoption of the euro at the beginning of 2014 did
not have much of an impact (Eglitis et al., 2014).
By contrast, productive investment (excluding housing) remained subdued as a
consequence of the significant on-going debt reduction and tightened credit conditions.
Private sector debt increased substantially during the boom years, with the credit-to-GDP
ratio more than doubling between 2000 and 2010 to 60% GDP for non-financial corporations
(Figure 5). After the bust, domestic loan portfolio continuously diminished (Figure 6,
Panel B), with an annual decline of around 5% over the past two years (Figure 6, Panel A).
Non-performing loans (NPL) have been declining steadily and stood at 7.5% in June 2014.
In 2014, economic growth slowed and is estimated to have fallen below 3% (Table 1).
The deterioration of the global environment, in particular growing regional geopolitical
tensions and their indirect impact on the outlook of the EU and Russia (which account
respectively for around 70% and 10% of total Latvian goods exports) has reduced external
demand and weaken business confidence. The direct impact of sanctions imposed by
Russia on the economy is limited, as the share of banned goods in total exports is low
(around 0.5% of total goods exports). Also, Latvian exporters have shown an ability to
Figure 5. Debt is being significantly reducedPrivate sector debt
Note: The private sector debt is the stock of liabilities held by the sectors non-financial corporations and households and noninstitutions serving households. The instruments that are taken into account to compile private sector debt are securities otheshares, excluding financial derivatives and loans.Source: Eurostat database.
1 2 http://dx.doi.org/10.1787/888933
1995 1996 1997 1998 1999 2000 2001 2002 2003 2004 2005 2006 2007 2008 2009 2010 2011 2010
20
40
60
80
100
120% of GDP
Households
Non-financial corporations
OECD ECONOMIC SURVEYS: LATVIA © OECD 2015 19
11© OECD 2015

ASSESSMENT AND RECOMMENDATIONS
183617
Q3
Oct
14
diversify their export markets and increase their export market shares in the unfavourable
external environment. Nevertheless, the slowdown of the Russian economy, the falling
transit of goods to and from Russia, increasing competition on the food market and
heightened uncertainty will all weigh significantly on short-term growth prospects.
The recovery is projected to gain momentum in 2015 and 2016, assuming improving
exports prospects and a rebound in investment (Table 1). Capacity utilisation has already
reached historical highs (at around 72%). In the absence of a further deterioration in the
regional economic environment, business confidence should progressively firm over the
next two years. Financial conditions are set to gradually improve supported by an
accommodative monetary policy. Credit should also benefit from the positive confidence
effect of euro adoption, the progressive reduction in non-performing loans and the
decrease in the debt burden in the private sector. Economic activity will also be sustained
by household spending, though less than in the past. Private consumption growth should
soften as the improvement of labour market outcomes will moderate. After a sharp
recovery from relatively low levels, wage growth is projected to slow as firms will have to
limit the rise in labour costs to preserve competitiveness. Fiscal policy is expected to
Figure 6. Credit is falling
Source: Bank of Latvia.1 2 http://dx.doi.org/10.1787/888933
B. End of period, million EUR
A. Percentage change, year-on-year
0
2 000
4 000
6 000
8 000
10 000
12 000
Q12007
Q3 Q12008
Q3 Q12009
Q3 Q12010
Q3 Q12011
Q3 Q12012
Q3 Q12013
Q3 Q12014
Loans to non financial corporations
Loans to households
-15
-10
-5
0
5
10
15
20
25
30
35
40Ja
n 08
Apr 0
8
Jul 0
8
Oct
08
Jan
09
Apr 0
9
Jul 0
9
Oct
09
Jan
10
Apr 1
0
Jul 1
0
Oct
10
Jan
11
Apr 1
1
Jul 1
1
Oct
11
Jan
12
Apr 1
2
Jul 1
2
Oct
12
Jan
13
Apr 1
3
Jul 1
3
Oct
13
Jan
14
Apr 1
4
Jul 1
4
Loans to households
Loans to non financial corporations
OECD ECONOMIC SURVEYS: LATVIA © OECD 201520
12© OECD 2015

ASSESSMENT AND RECOMMENDATIONS
remain relatively accommodative, in line with the Medium Term Objective (structural
balance at 1% of GDP in 2015 and 0.9% 2016). Inflation should progressively increase and
exceed 2% in 2016, due to the deregulation of electricity prices for households in 2015 and
wage growth.
The growth outlook is increasingly clouded by ongoing geopolitical tensions, the
uncertainty surrounding the recovery in the euro area and the economic outlook in Russia.
Risks are mainly on the downside and relate to an intensification of regional tensions and
subsequent lower growth in regional trading partners. A further decline in confidence
could lead to delays in investment, tightened credit conditions and increasing
precautionary savings. A long-lasting disruption of imported energy supply would
significantly affect the economy. Persistent stagnation and declines in inflation
expectations in the euro area could also cut growth significantly as it is a destination for
around a third of exports. A lower share of exports is destined to Russia (around 10%), but
the deterioration of the Russian economic outlook might also reduce growth prospects in
Latvia, by affecting the transport sector in particular. The steep fall in oil prices aggravated
by the limited access to international financial market will lead to a decline in the Russian
economic activity and the depreciation of the rouble will further curb imports. According
to recent estimates by the Bank of Latvia, a 10% decline in Russia’s imports would reduce
Latvian GDP growth by 0.66 percentage point, but these estimates do not take into account
the positive impact of the fall in oil prices on GDP.
Growth could also surprise on the upside. Should the accommodative monetary policy
in the euro area become more effective with the progressive move towards banking union
and should planned structural reforms be implemented swiftly in the euro area, the
recovery could accelerate more than expected with positive spill-overs to Latvia. A restart
of steel production at Liepajas Metalurgs, a large industrial conglomerate and employer,
in 2015 could also result in higher growth.
Table 1. Macroeconomic indicators and projections
2011 2012 2013 2014 2015 2016
Current pricesEUR billion
Percentage changes, volume (2010 prices)
GDP at market prices 20.3 4.8 4.2 2.5 3.2 3.9
Private consumption 12.7 3.0 6.2 2.7 3.0 3.7
Government consumption 3.7 0.4 -4.2 2.7 2.8 2.8
Gross fixed capital formation 4.5 14.5 -5.2 2.4 2.7 5.2
Stockbuilding1 0.4 -2.6 1.8 -0.8 0.4 0.0
Total domestic demand 21.3 2.3 3.4 1.8 3.2 3.8
Exports of goods and services 11.7 9.8 1.5 1.9 3.1 5.2
Imports of goods and services 12.7 5.4 0.3 1.7 3.2 5.0
Net exports1 -1.0 2.3 0.7 0.1 -0.1 0.0
Memorandum items:
GDP deflator - 3.6 1.1 1.7 1.8 2.4
Harmonised index of consumer prices - 2.3 0.0 0.8 1.9 2.3
Unemployment rate - 15.0 11.9 10.9 9.7 8.8
General government financial balance2 - -0.8 -0.9 -1.3 -1.0 -0.8
General government debt, Maastricht definition2 40.9 38.2 40.2 36.8 35.0
Current account balance2 - -3.3 -2.3 -2.3 -2.3 -2.2
1. Contributions to changes in real GDP, actual amount in the first column.2. As a percentage of GDP.Source: OECD EO96 database.
OECD ECONOMIC SURVEYS: LATVIA © OECD 2015 21
13© OECD 2015

ASSESSMENT AND RECOMMENDATIONS
Limiting the risk of repeated boom and bust cyclesTo limit the risk of repeated boom and bust cycles, Latvia should ensure fiscal and
financial policy settings are leaning against the wind. Pro-cyclicality of the financial sector
and fiscal policy played an important role in the volatility of the economy over the previous
decade. The fiscal policy response to overheating during the boom years was limited. The
currency peg encouraged borrowing in euro with short-term refinancing rates close to the
low European Central Bank lending rate, while increases in reserve requirements had a
limited impact (Blanchard et al., 2013). Following the bust, the currency peg was
maintained – avoiding large capital losses on loans denominated in euro – and the
adjustment was made through internal devaluation and fiscal austerity reducing domestic
demand by about one third.
The macroeconomic policy framework has been improved
The fiscal and financial stability policy frameworks have undergone significant
improvements in recent years. Tools available now should allow the authorities to manage
a more sustainable growth path and make the economy more resilient. Yet, the
effectiveness of the framework remains to be tested. The authorities need to remain
vigilant to limit the risk of repeated boom and bust cycles.
Improved counter-cyclicality and sustainability of fiscal policy
In 2013, a rules-based fiscal framework was adopted based on structural budget
balance, three-year budgeting, binding expenditure ceilings, a restriction on expenditure
growth (to not exceed potential growth) and oversight by a fiscal council. This institutional
set-up should be an effective means of keeping public expenditure growth consistent with
fiscal sustainability and of avoiding the slippages that occurred in previous upturns.
In 2013, at 38% of GDP the government debt ratio (Maastricht definition) was one of the
lowest when compared to OECD countries and the fiscal deficit declined below 1% of
GDP. Having achieved the short-term goals of consolidation, the challenge now is to lock in
the gains.
Latvia, as a volatile economy, needs a precautionary buffer to cope with adverse
domestic and international shocks. Since during extreme turbulences borrowing at
reasonable costs may be restricted, a fiscal reserve should be made available. With the
accession in the euro area, Latvia can benefit from the European Stability Mechanism,
a permanent crisis resolution mechanism, which can issue loans and other forms of
financial assistance to euro area countries with severe liquidity problems or threatened
by them. Also, the establishment of a banking union should limit the impact of banking
crises on public finances. The Single Resolution Mechanism (SRM) backed by a Single
Resolution Fund has introduced resolution tools that involve private bank investors and
the banking sector as a whole in covering bank losses before involving public finances
(OECD, 2014a).
Nevertheless, there is scope to build-up additional fiscal liquidity buffers over time,
not least because Latvia’s exposure to external shocks is higher than in the average EU
country. The Fiscal Discipline Law introduced two counter-cyclical reserves. The first one,
the Long-Term Stabilisation Reserve, is set to accumulate government budget surpluses,
i.e. saving in good times in order to soften budget constraints in bad times, but no
resources have actually been accumulated yet. The second one, the Fiscal Security Reserve,
OECD ECONOMIC SURVEYS: LATVIA © OECD 201522
14© OECD 2015

ASSESSMENT AND RECOMMENDATIONS
has been established to mitigate the negative impact of small adverse macroeconomic
developments on the budget and fiscal risks (e.g. risks related to loans repayments, loan
guarantees, public-private partnerships). The size of this reserve is set annually; it shall not
fall below 0.1% of GDP from 2017 onward.
Strengthened macro-prudential oversight
Euro adoption in January 2014 followed the peg to the euro since 2005 and to the
Special Drawing Right since 1993. In the early 2000s an excessive credit cycle developed,
which created severe distortions and involved large costs to the economy and society.
There is thus a case for the timely use of macro-prudential tools. The evolution of
international regulatory frameworks (Basel III, the European Systemic Risk Board, and the
Capital Requirements Directive and Regulation) has increased awareness and
mainstreaming of such tools. In Latvia, a newly set up Macro-prudential Council with all
the main stakeholders, including the Central Bank, the Ministry of Finance and the
Financial and Capital Market Commission, meets at least twice a year.
The three above-mentioned local institutions are charged with financial stability and
macro-prudential policies. The Central Bank is assigned overall responsibility for macro-
prudential oversight and the Financial and Capital Markets Commission (FCMC) is tasked with
micro-prudential tools and is designated authority for macro-prudential tools. The Macro-
prudential Council, chaired by the Governor of the Central Bank, has a consultative role and
the power to issue non-binding recommendations on the principle of “comply or explain”.
Banking sector assets have fallen from a peak in 2010 of 172% of GDP to 124% at the
end of 2013, well below the EU average of around 300% of GDP. Capital adequacy and
liquidity ratios are above the minimum requirements and a 2.5% capital conservation
buffer has been applied (FCMC, 2014). The recent asset quality review and stress tests
carried out by the European Central Bank did not identify capital adequacy problems for
the three Latvian banks covered (ABLV Bank, Swedbank, and SEB; European Central
Bank, 2014). A new counter-cyclical buffer, mandated by the EU by 2016, is likely to be set
at zero. Leverage ratios are also monitored to gauge the strength of bank balance sheets,
and have to be disclosed by banks since January 2015. Taxes are also used, including a tax
on capital gains from real estate transactions and an increase in property taxes rates (that
remain modest though). A 90% ceiling of the loan-to-value ratio on housing loans has been
introduced to limit the build-up of imbalances in the banking and real-estate sectors. It will
have to be seen whether these tools will discourage retail real estate investments betting
on perceived capital gains.
Following the bursting of the credit boom, banks tightened lending standards
(IMF, 2014). Risk aversion has increased; the banks now rely more on collateral-based lending
with loans of short maturity and personal guarantees are common (World Bank, 2012).
Micro-enterprises can have difficulties providing adequate collateral. Moreover, there seems
to be a lack of strategic interest by lenders for this segment as well as deficiencies in credit
information (World Bank, 2012). The capital market in Riga is small, with few trades and
listings: currently some 30 companies are listed with a market capitalisation equivalent to
just under 4% of GDP in 2012. An alternative capital market, First North, is operational under
the Nasdaq Baltic stock exchange, but only one Latvian company is listed. A public credit
information registry, run by the Central Bank, exists with a relatively high coverage in terms
of population. Standard credit bureaus will be developed, as a new legislation allowing for
this was passed in September 2014. The authorities provide public guarantees and other
OECD ECONOMIC SURVEYS: LATVIA © OECD 2015 23
15© OECD 2015

ASSESSMENT AND RECOMMENDATIONS
instruments to ease access to credit. To improve access to finance further, micro-finance
institutions could provide services for micro-enterprises (World Bank, 2012). Currently such
institutions exist only in limited consumer credit markets (providing loans to their
members). Before developing institutions for business-oriented loans, the necessary
regulatory changes and risks would have to be carefully considered.
Supervision adapted to the particular features of the financial sector
The Latvian financial sector is dominated by banks. There are two distinct business
models in the banking sector, the first focused on Latvian clients and the second on non-
resident banking services. Just over a half (54%) of banking sector assets are held by foreign
banks, most of them of Nordic origin. The parent banks tend to rely on short-term
financing, and while during the 2009 downturn, they maintained funding and absorbed
losses, maturity mismatches have been increasing in their Latvian operations. It poses a
potential risk that requires further monitoring (Bank of Latvia, 2014). Cooperation between
the home and host authorities on cross-border financial stability, crisis management and
resolution is in place as part of the Nordic-Baltic Cross-Border Stability Group that includes
supervisory colleges.
In the wake of the 2009 global crisis, supervisory powers of EU host authorities were
strengthened. The host regulator is now involved more closely in the supervision of so-called
significant branches. There is a mandatory reciprocity for countercyclical capital buffers (it
must be recognised up to 2.5% in all EU member states and can be recognised also above that)
and a possibility for recognition of a systemic risk buffer rate set by the other member state.
The authorities need to ensure that supervision and application of macro-prudential tools is
not compromised by the banking structure. Whether this is achieved by unilaterally
imposing specific regulation on systemically important branches or whether enhanced co-
operation with mother-bank supervisory institutions is the right approach should depend on
how to best protect financial sector stability while preserving capital mobility and the
freedom of providing financial services within the EU.
Another policy challenge, both in terms of supervision and financial sector stability,
arises from the relatively high share of non-resident deposits in the banking sector. They
amount to 40% of GDP and account for just under a half of all bank deposits. Estimates of the
contribution of this sector to the domestic economy vary between 0.8% and 1.5% of GDP
(KPMG, 2014). The recent global financial crisis was a reminder of the potential burden of a
financial sector dependent on foreign deposits which can be very mobile. Most non-resident
deposits in Latvia are short-term and invested in short-term high-quality liquid assets
abroad.
The nature of the non-resident deposits business is to be less transparent, requiring well-
developed supervision and enforcement of ’know-your-client’ policies. Responding to this
challenge the authorities have strengthened such measures. Also, banks focusing on business
with non-residents face stricter prudential capital and liquidity requirements under Pillar II of
the Basel framework. Individual minimum capital requirements range up to 20% depending on
the share of non-resident deposits, loans to non-residents and growth rates of these indicators,
with liquidity ratios up to 60% (as compared to 30% of regulatory minimum) depending on the
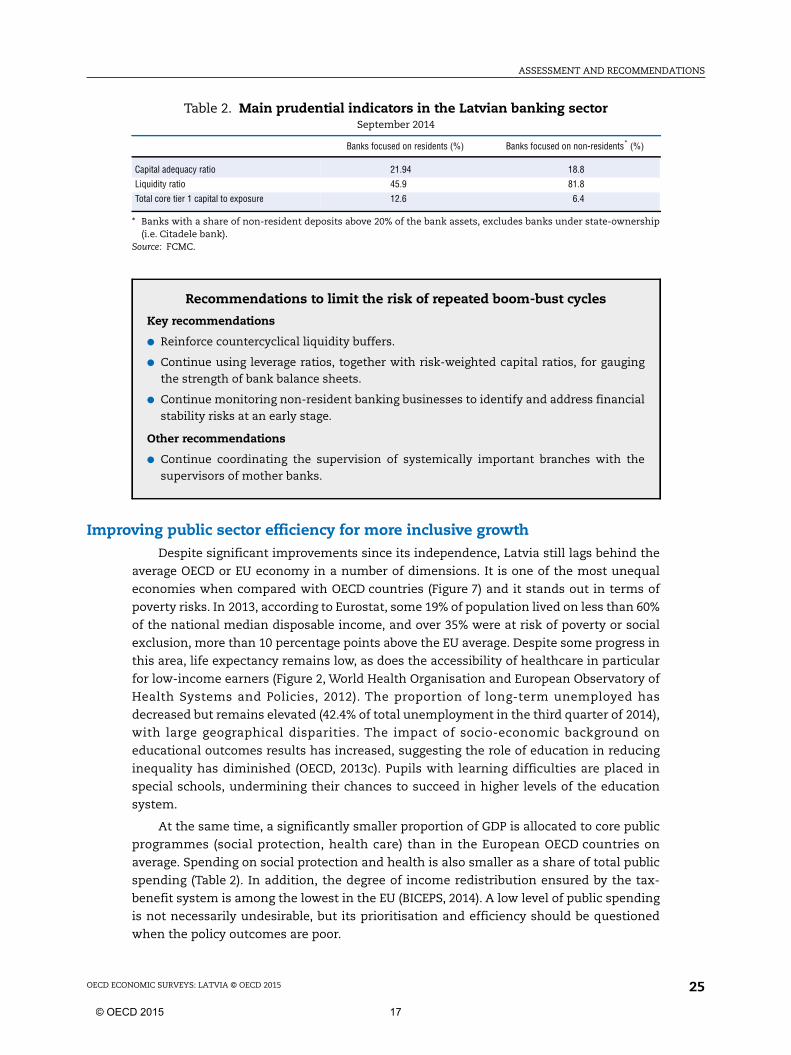
share of non-resident deposits (Table 2). According to the authorities, the business model of
these banks is to a large extent separated from the domestic economy and thus should not
pose a threat to the stability of the domestic financial sector. Nevertheless, the authorities
should continue to monitor this sector carefully.
OECD ECONOMIC SURVEYS: LATVIA © OECD 201524
16© OECD 2015
ASSESSMENT AND RECOMMENDATIONS
Improving public sector efficiency for more inclusive growthDespite significant improvements since its independence, Latvia still lags behind the
average OECD or EU economy in a number of dimensions. It is one of the most unequal
economies when compared with OECD countries (Figure 7) and it stands out in terms of
poverty risks. In 2013, according to Eurostat, some 19% of population lived on less than 60%
of the national median disposable income, and over 35% were at risk of poverty or social
exclusion, more than 10 percentage points above the EU average. Despite some progress in
this area, life expectancy remains low, as does the accessibility of healthcare in particular
for low-income earners (Figure 2, World Health Organisation and European Observatory of
Health Systems and Policies, 2012). The proportion of long-term unemployed has
decreased but remains elevated (42.4% of total unemployment in the third quarter of 2014),
with large geographical disparities. The impact of socio-economic background on
educational outcomes results has increased, suggesting the role of education in reducing
inequality has diminished (OECD, 2013c). Pupils with learning difficulties are placed in
special schools, undermining their chances to succeed in higher levels of the education
system.
At the same time, a significantly smaller proportion of GDP is allocated to core public
programmes (social protection, health care) than in the European OECD countries on
average. Spending on social protection and health is also smaller as a share of total public
spending (Table 2). In addition, the degree of income redistribution ensured by the tax-
benefit system is among the lowest in the EU (BICEPS, 2014). A low level of public spending
is not necessarily undesirable, but its prioritisation and efficiency should be questioned
when the policy outcomes are poor.
Table 2. Main prudential indicators in the Latvian banking sectorSeptember 2014
Banks focused on residents (%) Banks focused on non-residents* (%)
Capital adequacy ratio 21.94 18.8
Liquidity ratio 45.9 81.8
Total core tier 1 capital to exposure 12.6 6.4
* Banks with a share of non-resident deposits above 20% of the bank assets, excludes banks under state-ownership(i.e. Citadele bank).
Source: FCMC.
Recommendations to limit the risk of repeated boom-bust cycles
Key recommendations
● Reinforce countercyclical liquidity buffers.
● Continue using leverage ratios, together with risk-weighted capital ratios, for gaugingthe strength of bank balance sheets.
● Continue monitoring non-resident banking businesses to identify and address financialstability risks at an early stage.
Other recommendations
● Continue coordinating the supervision of systemically important branches with thesupervisors of mother banks.
OECD ECONOMIC SURVEYS: LATVIA © OECD 2015 25
17© OECD 2015

ASSESSMENT AND RECOMMENDATIONS
0111
perfect
183624
Improving public sector efficiency requires developing strategic and evaluation
capacities. The new three-year expenditure planning framework is an important step
towards greater policy continuity. The establishment of a new planning unit under the
authority of the Prime Minister, the Cross-Sectoral Coordination Centre (PKC), should
improve strategic co-ordination and counteract the prior tendency to strong ministerial
silos and policy fragmentation. The PKC’s mandate is to produce mid- and long-term
planning documents, such as the National Development Plan, and to ensure that policies
are effective and appropriate. The body can also be engaged in the early planning phase of
new policies, and has been tasked with analysing transversal issues, such as evaluating the
management of state-owned enterprises, demographics or income disparities. However,
the PKC is not properly resourced to meet line ministries’ demands and has no possibility
to engage outside expertise on specific substantive issues.
Figure 7. Income inequality is among the highest compared with OECD countriesGini coefficient of equivalised household disposable income, scale from 0 “perfect equality” to 1 “perfect inequality”, 2
Note: The Gini index is a measure of income inequality. A Gini index of 0 represents perfect equality, while an index of 1 impliesinequality. Equivalised household disposable income refers to income after tax and transfers adjusted for household size.1. 2009 for Japan, 2010 for Belgium, 2012 for Australia, Finland, Hungary, Korea, Mexico, Netherlands and the United States.2. OECD Secretariat calculations from EU-SILC – preliminary results.Source: OECD Income Distribution database and OECD calculations.
1 2 http://dx.doi.org/10.1787/888933
0.0
0.1
0.2
0.3
0.4
0.5
0.6
Table 3. Components of public spending, 2012
General publicservices
Economicaffairs
Health EducationSocial
protectionOther3
Percentage of total
Latvia 12.3 14.5 10.7 15.1 30.7 16.7
Peers1 12.0 10.3 15.4 12.6 33.8 16.0
OECD Europe2 14.1 9.5 14.1 11.9 38.1 12.2
Percentage of GDP
Latvia 4.5 5.3 3.9 5.5 11.2 6.1
Peers1 5.1 4.4 6.5 5.4 14.4 6.8
OECD Europe2 6.8 4.6 6.8 5.7 18.3 5.8
1. “Peers” is an average of Czech Republic, Estonia, Slovenia, and Slovak Republic.2. OECD Europe includes all European OECD countries except Turkey.3. “Others” includes defence, public order and safety, environmental protection, housing community amenities,
recreation, culture and religion.Source: Eurostat.
OECD ECONOMIC SURVEYS: LATVIA © OECD 201526
18© OECD 2015

ASSESSMENT AND RECOMMENDATIONS
Increasing the efficiency of public spending in the short and long term
Social spending
The level of spending allocated to protect the most vulnerable is low, with social
spending amounting to only about 15% of GDP, compared with an EU average of 28% of GDP.
Certain spending programmes were increased during the downturn (e.g. on labour market
policies, social safety net) and helped to cushion its impact. Nevertheless, this spending
was generally from a very low base, often temporary and with patchy coverage. It is crucial
to ensure limited resources are used in an efficient way to make growth more inclusive and
reduce the poverty risk.
A guaranteed minimum income benefit – the main poverty-targeted tool – more than
tripled during the downturn in real terms, but still reached only about 14% of the poor
in 2010 because of restrictive eligibility criteria and limited financing (World Bank, 2013).
The benefit has been scaled back since then. A reform of the social benefit system is
currently under discussion and would introduce a new minimum income threshold of 40%
of national median income by 2017. It will be important to pay attention to the incentive
effects of increasing social benefits. The German labour and social assistance reforms,
which managed to combine an increase in labour force participation and fiscal efficiency
gains, are a good example to be followed (Hüfner et al., 2013).
A number of important benefits are universal (state family benefit, child care benefit,
child birth grant) and the degree of income redistribution is relatively low. Less than 20% of
all social benefits go to the poorest quintile, the richest quintile receives almost 27%. In the
EU, the poorest quintile received on average more than 40%, while the richest less than 10%
(World Bank, 2013). This suggests the need for better targeting.
At the same time, a large proportion of employees have salaries close to the minimum
wage and targeting social benefits can create disincentives to take-up a formal job for low-
income earners. This trade-off needs to be balanced carefully. A planned gradual withdrawal
of certain social benefits (guaranteed minimum income and housing benefit) is welcome and
would significantly increase the income gain of taking a low-paid job in the formal economy
(BICEPS, 2014). Given the widespread underreporting of salaries (Putnins and Sauka, 2014),
this measure needs to be coupled by further actions against undeclared work.
Active labour market policies
The elevated level of poverty is closely linked with the relatively high long-term
unemployment rate, which exceeds the OECD average by 8 percentage points. A recent
World Bank study shows that men in particular are affected by persistent labour market
difficulties, often those poorly educated and/or disabled (World Bank, 2013). During the
downturn, mothers at home with small children also became at risk of unemployment or
low-paid unstable jobs. Meanwhile, some 13% of youths were not in employment,
education or training in 2013. Young men seem to be at a higher risk of so-called scarring
(i.e. failing to form a labour market attachment early on in their working life), as they are
over-represented among early-school leavers and have lower higher education attainment.
Minorities also encounter difficulties on the labour market. For instance, their
unemployment rate in 2012 was 6 percentage points higher (Lehmann and Zaiceva, 2015,
forthcoming). This could be partly related to the uneven distribution of the unemployment
rate across the country, being higher in the eastern part of the country with a larger
proportion of minorities.
OECD ECONOMIC SURVEYS: LATVIA © OECD 2015 27
19© OECD 2015

ASSESSMENT AND RECOMMENDATIONS
The labour market is quite flexible and characterised by a high level of informality,
notably an under-reporting of salaries (Putnins and Sauka, 2014). While, according to OECD
indicators, employment protection legislation (EPL) is stricter than OECD average, it did not
impede adjustment through massive layoffs during the 2009 downturn. The
unemployment rate rose by 14 percentage points in two years (from 6% in 2007 to 20% at
the beginning of 2010) and then decreased below 11%. However, recent increases in the
minimum wage are likely to be a barrier to the employment of low-productivity workers in
the formal sector, as a large share of workers are already officially paid at the minimum
wage level (Lehmann and Zaiceva, 2015, forthcoming).
Active labour market policies targeted at at-risk groups can contribute to reducing
under-employment. In Latvia, a number of measures were recently implemented to
improve the public employment service (e.g. profiling of jobseekers) but spending on
labour market programmes remains low by international comparison. In 2011, with a 16%
unemployment rate, overall spending on labour market policies was only 0.7% of GDP.
Ireland, which had a similar level of unemployment at the time, spent five times more.
Participation in active labour market programmes is also below OECD standards, although
Latvia performs better than its Baltic neighbours (IMF, 2014). Countries with a relatively
successful labour market performance during the crisis, like Germany and Austria, have a
high level of spending on such programmes and could provide some inspiration for policy
changes.
Ageing-related spending
According to current long-term projections, Latvia’s public finances do not face strong
ageing-related spending pressures (European Commission, 2013c). This is mainly because
replacement rates are projected to remain modest which ultimately raises the risk of
future spending pressures. Regular reporting on long-term spending trends and the
adequacy of social programmes such as pensions and healthcare should be introduced. In
addition, spending efficiencies will be needed to achieve stated objectives in terms of
health and education.
● The share of old-age population at risk of poverty is high by international comparison
(34% in 2012, around 15 percentage points more than the EU average) suggesting that the
pension system does not contribute enough to old age poverty prevention (European
Commission, 2013c). Recent pension reforms improve long-term financial sustainability
and the adequacy of the pension system by increasing the statutory retirement age and
minimum contributory period for old-age pension rights as well as changing pension
indexation rules. Nevertheless, it is unclear how much improvement this will bring
in terms of eliminating poverty risks. The replacement ratio of the public system is
set to decline and will remain among the lowest in the EU (43.6% in 2050). Unless
private pensions expand significantly, old age poverty may not be properly addressed,
and future political pressures may force higher pension spending than currently
foreseen.
● Health care spending is among the lowest when compared with OECD countries (6% vs.
9.3% of GDP in 2012). Funding by the public sector is also well below the OECD average,
as out-of-pocket payments account for 40% of spending. Tight public resources have led
to queuing and privately funded treatment. Life expectancy is among the lowest by
OECD standards and the quality of care is not well perceived. Reforms are improving
efficiency by shifting from expensive hospitals to less costly ambulatory care and
OECD ECONOMIC SURVEYS: LATVIA © OECD 201528
20© OECD 2015

ASSESSMENT AND RECOMMENDATIONS
ncomepaid by
183633
te
putting a higher priority on primary care. However, only a small increase in public health
care resources (around 0.6 percentage point of GDP) has been factored into fiscal
sustainability calculations. At the same time, improvements in life expectancy to levels
above those currently seen in any OECD member country are expected.
● Vocational and tertiary education needs to continuously improve in order to ensure it
meets the requirements of a catching-up economy. Any efficiency-enhancing reforms
will be difficult without far-reaching interventions, like implementing a new financing
model that rewards quality and strengthens links with market needs and research
institutions. Achieving this in a revenue-neutral way will be a challenge.
Making the tax system more progressive and employment friendly
The tax system is skewed toward labour taxes and is relatively regressive. In particular,
it is characterised by a relatively high tax wedge for low-income earners which undermines
their employability in formal jobs. The labour tax wedge stems from high social security
contributions: the combined employer and employee contribution rate is 34.09%, while the
personal income tax is flat (23%). The tax wedge was recently reduced for low-income
earners with children (European Commission, 2014a). The tax allowance for dependants
was increased in 2014 and the personal income tax rate is gradually decreasing by one
percentage point annually to 22% in 2016. Despite these measures, the tax wedge is
projected to remain significantly above the OECD average, in particular for single earners
(Figure 8). Moreover, a ceiling on the base for social security contributions reintroduced
in 2014 effectively increases the regressivity of the tax system.
The tax wedge is one of the main factors behind the elevated structural
unemployment rate in Latvia (IMF, 2014). The policy issue now is how to reduce the
labour tax wedge further, in particular for low-income earners. In this vein, one
possibility would be to decrease social security contributions on low wages. Such
measure has been implemented in 14 OECD countries, with a generally positive impact
Figure 8. The tax wedge on low-income earners is set to remain highMinimum Wage, single person without children, % of total labour compensation, 2013
Note: The figure shows the impact on the tax wedge for a single person without children of planned reform of the personal itaxation (PIT) in 2016, i.e. the reduction of the PIT tax rate to 22%, and of this reform combined with social security contributionemployees set to zero.Source: OECD Tax-Benefit Models (2013 provisional).
1 2 http://dx.doi.org/10.1787/888933
22% PIT ra22% PIT rate +0% employee social security
contribution (SSC) rate
0
10
20
30
40
50
OECD ECONOMIC SURVEYS: LATVIA © OECD 2015 29
21© OECD 2015

ASSESSMENT AND RECOMMENDATIONS
eticallycounts
tates”,
183649
LD
on the employment of low-skilled workers (OECD, 2011a). To avoid increases in the share
of low paid jobs and associated deadweight costs, the decrease could be targeted at
particular groups (such as low skilled workers, long-term unemployed, first-time job
applicants). At the same time, tax enforcement should be strengthened. The reduction in
the social security contribution rate should not lead to a reduction in already low social
coverage (e.g. pension replacement rates). Another possibility, already on the agenda of
the authorities, is to increase the personal income tax allowance, which ideally should be
phased out for higher incomes.
Revising the tax mix requires additional revenues. They should come from better tax
collection in the first place. Tax evasion is substantial and the economy is marked by
informality, with estimates of the shadow economy reaching some 24% of GDP (Putnins
and Sauka, 2014). This is well above the levels estimated for Estonia and Lithuania, though
measuring unreported activity is inherently difficult and results depend on the source and
the method used. Underreporting of business profits and salaries is particularly
pronounced, while firms state that approximately 10% of their revenue is spent on bribery
(Putnins and Sauka, 2014). Hidden activity should be tackled as it reduces tax revenues and
excludes part of the population from the social security system, contributing to the high
level of inequality and increasing poverty risks.
Evidence of entrenched tax evasion can also be found in the high “VAT compliance
gap” (Figure 9). The efficiency of the VAT system has been greatly affected by the 2009
downturn and there is significant scope for improvement as the economy recovers, in
particular if supported by policy action to improve tax collection. The potential revenue
that could be collected if tax collection improved is quite large, amounting to around 3.5%
of GDP (European Commission, 2014b). While the issue has been on the agenda of the
authorities for some time, it is not clear whether sufficient resources are being allocated
for measures against tax fraud.
Figure 9. Improved tax collection offers revenue potential2012, VAT gap,1 % of GDP
1. The VAT Gap is the difference, in any given year, between the VAT Collections (as recorded by Eurostat) and the amount theordue, i.e. VTTL (VAT Total Tax Liability). The latter is the total amount of estimated VAT payments on the basis of national acaggregates and the existing structure of rates and exemptions.
Source: European Commission, “2012 Update Report to the Study to quantify and analyse the VAT Gap in the EU-27 Member SSeptember 2014 and Eurostat database.
1 2 http://dx.doi.org/10.1787/888933
0.0
0.5
1.0
1.5
2.0
2.5
3.0
3.5
4.0
4.5
SVK LVA GRC HUN ITA POL CZE EST EU26 FRA ESP AUT DNK GBR DEU BEL IRL SVN PRT SWE LUX FIN N
OECD ECONOMIC SURVEYS: LATVIA © OECD 201530
22© OECD 2015
ASSESSMENT AND RECOMMENDATIONS
Another potential revenue source is the better pricing of environmental externalities.
New passenger cars in Latvia have the highest CO2 emissions per kilometre in the EU
(Dreblow et al., 2013) and high levels of particulate matter (PM10) have been recorded along
some busy roads in Riga (European Commission, 2014a). 84% of municipal waste is
landfilled two and a half times more than the EU average. Environmentally-related
taxation has been extended. In 2010, a registration tax for passenger cars differentiated by
CO2 emissions per km and an annual tax on vehicles depending on the capacity and
volume of engine were introduced. This has led to a decrease in the average emissions of
new cars but it would be more effective if applied to all motor vehicles. There is also some
evidence of tax evasion through car registration in neighbouring Estonia, which could be
remedied by tax harmonisation. A new road toll tax (so-called euro vignette) for trucks
using the highways was introduced in July 2014.
Nevertheless, fuel taxes are among the lowest in the EU and do not reflect the relative
negative impact of fuel consumption on the environment. There are also tax exemptions
or reductions on fuels for agriculture and for heat generation. An 80% VAT tax deduction is
applied on corporate passenger cars, which are often used for private purposes, on both
purchase price and operating costs (e.g. fuel, Lamine and Lohmuste, 2014). These
environmentally harmful subsidies should be phased out. To preserve the competitiveness
of sectors exposed to international competition, time-limited cash transfers compensating
for the cost of taxation but not linked to energy consumption could be provided. Despite
recent increases, taxes related to waste management are not effective enough to divert
waste from landfill to recycling (European Commission, 2014a) and should thus be revised.
Property taxes, which are low by international standards, could be increased. In 2013,
local governments were given more leeway to adjust the rates within a pre-defined bracket
of 0.2-3%. However, they are not motivated to do so, as they compete for taxpayers.
According to recent estimates, doubling the residential and land tax rates could increase
revenues by around EUR 100 million, i.e. 0.4% of GDP (BICEPS, 2014). By contrast, there is
little need to increase the value added tax rate, which is already 21%, comparable to the
levels in high-income countries, and brings a large portion of revenues, although
potentially large revenue increases could be reaped by reducing the VAT gap.
Recommendations to improve public sector efficiency
Key recommendations
● Strengthen efforts to tackle tax fraud and improve tax collection.
● Evaluate the current benefit system and make universal social benefits more targeted atlow-income households.
● Gradually withdraw benefits targeted at low-income earners when they take up a job.
● Decrease the labour tax wedge for low-income earners.
● Raise additional revenues by increasing property and environmentally related taxes.
Other recommendations
● Allocate adequate staff and resources to the Cross-Sectoral Coordination Centre.
● Phase out environmentally harmful fuel subsidies.
● Introduce regular reporting on long-term spending trends and the adequacy of socialprogrammes, such as pensions and healthcare.
OECD ECONOMIC SURVEYS: LATVIA © OECD 2015 31
23© OECD 2015

ASSESSMENT AND RECOMMENDATIONS
other
183654
0
20
40
60
80
100
Raising productivity and ensuring robust convergenceThe gap in productivity vis-à-vis the top OECD performers is substantial, which means
that much of the catching-up in incomes needs to come from productivity increases. For a
small open economy, a competitive domestic environment is key to securing a competitive
position internationally. Domestically, strong competition would stimulate a reallocation of
resources and raise productivity. Yet, Latvian firms do not perform as well as their peers.
Exports as a share of GDP, foreign direct investment inflows and participation in global value
chains are all lower than in other open catching-up economies, such as the Czech Republic,
Estonia and the Slovak Republic (Figure 10). Moreover, according to a survey of managers
reported in the World Economic Forum’s Competitiveness Report, Latvia ranks 34th world-
wide with respect to perceived competition.To better identify and build support for solutions
to domestic productivity challenges effective coordination of the various bodies dealing with
productivity issues (i.e. the Large and Strategically Important Investments Coordination
Council, the National Economy Council) is necessary. Some countries have established an
independent advisory body tasked with reviewing these issues regularly (such as the
Australian Productivity Commission), have set up a government co-ordination unit or found
other ways to ensure a whole-of-government approach.
The following section looks at the main aspects of the business environment: the
regulatory burden, competition, the judiciary and access to finance. It concludes by
exploring the potential for innovation and the deepening of skills.
Cutting red tapeRegulation can hamper competition and investment. Overall, product market
regulation (PMR) in Latvia is not very pro-competitive. De jure, businesses face red tape, as
regulatory procedures seem complex, notably in terms of permits and licenses (Figure 11).
Figure 10. Latvia is less competitive than its peers
1. Average 2009-11 for Czech Republic and Slovak Republic.2. Financial sector refers to financial and insurance activities and real estate activities.3. Backward participation shows the use of foreign intermediates in a country’s exports and forward participation the use by
countries of a country’s inputs in their exports.Source: OECD Economic Outlook database, Eurostat database and OECD Global Value Chains indicators – May 2013.
1 2 http://dx.doi.org/10.1787/888933
B. FDI inward stocks, average 2009-12¹, % of GDP
C. Global Value Chain participation indices³. % of gross exports, 2009
A. Exports of goods and services, % of GDP, 2013
0
20
40
60
80
100
LVA SVN CZE EST SVK LVA SVN EST SVK CZE
Forward participation
Backward participation
SVN LVA SVK CZE EST
Non-financial sector
Financial sector²
OECD ECONOMIC SURVEYS: LATVIA © OECD 201532
24© OECD 2015

ASSESSMENT AND RECOMMENDATIONS
ry
183661
0
1
2
3
4
5
6
0.0
0.5
1.0
1.5
2.0
2.5
3.0
State involvement in the economy is considerable, notably in the network sectors. The
administrative burden on start-ups, sole proprietors and corporations is above the OECD
average. The cost of tax compliance is relatively high, in part because of time-consuming
tax filing (PWC and World Bank, 2014). Furthermore, there are barriers to foreign direct
investment, in particular in areas of agriculture and forestry, real estate investment and
financial services (OECD, 2015a forthcoming). Latvia ranks 23th in the 2015 World Bank’s
Doing Business survey measuring de facto ease of the business environment across the
world. Though this is a good position, it lags behind Estonia and ranks just above Lithuania,
with whom it ultimately competes for foreign investment.
An annual exercise, whereby the public can signal burdensome regulations, is in place
and based on its outcomes the authorities prepare an action plan for the following year.
Also, regulatory impact assessments, essential for effective policy evaluation, are being
strengthened. At present the scope of investigation is often restricted to financial,
budgetary, and administrative costs. Procedures can often be fast-tracked by ministries
and there are no specific sustainability checks. Moreover, there is no threshold test for the
preparation of more in-depth analyses of legislative and policy proposals with significant
economic, social or environmental impacts. Such a test would help the public
administration to prioritise resources better and to conduct more robust in-depth
assessments for those proposed policies and laws that are likely to have the greatest costs
and benefits for the economy.
Figure 11. Product Market Regulation is more restrictive than in the average OECD count2013, index scale of 0-6 from least to most restrictive
Source: OECD (2013), Product Market Regulation database.1 2 http://dx.doi.org/10.1787/888933
A. Overall indicator
B. Government involvement in network sectors C. Licenses and permits system
0
1
2
3
4
5
6
CZE SVK EST LVA SVN OECDaverage
0
SVK CZE EST SVN LVA OECDaverage
0.0
0.5
1.0
1.5
2.0
2.5
3.0
OECD average
OECD ECONOMIC SURVEYS: LATVIA © OECD 2015 33
25© OECD 2015

ASSESSMENT AND RECOMMENDATIONS
Transparency in administrative procedures and integrity in administration both
contribute to good business environment. Latvia is making important progress in tackling
corruption and has one of the lowest levels of administrative corruption in the transition
region (EBRD, 2011 Life in Transition Survey). To limit conflicts of interest in public
procurement, innovative tools to streamline and centralise procurement procedures have
been introduced. Local governments are obliged to use centralised procurement for a range
of services and publish small contracts online. The share of published calls for public
tenders is one of the highest in the EU. The “one-stop-shop” principle for the provision of
state and local government services is also being developed. Nevertheless, there have been
cases of insufficient follow up by the procuring agencies and ensuring the independence
and capacity of the KNAB, the agency in charge of preventing and combating corruption,
remains a challenge.
Strengthening competition enforcement
The competition framework is sound but the independence of oversight and
enforcement with respect to the Competition Law need strengthening. Competition
enforcement lies with the Competition Council, which is independent in its decision-
making, but administratively falls under the Ministry of Economy. Subject to the Civil
Servants Law, the government can interfere with the operations of the Council by
transferring civil servants. By this, it can also effectively by-pass an open-selection process
for appointments to the Council, undermining its independence. To secure full
independence, the Competition Council should be made financially independent and
government involvement in transferring civil servants should be minimised.
Large public involvement in the economy poses regulatory challenges and a number of
state-owned enterprises have been involved in competition cases. More than 6% of total
dependent employment is in state-owned enterprises (SOE), which would rank Latvia just
after Norway, France and Slovenia, the OECD countries with the highest shares of
employment in public companies. SOEs have sub-par governance structures, not least
because boards of directors for all SOEs were – with a few exceptions – abolished in 2009.
The state enterprise ownership function is decentralised and the separation between
ownership and other functions is blurred, making oversight and ensuring a level playing
field challenging. No regular aggregate reporting is in place and monitoring mechanisms
are weak (OECD, 2015b forthcoming). Some SOEs are “strategic”, i.e. not to be privatised
(e.g. Riga airport authority, Latvian Post, Latvian Railways). They maintain a monopoly
position and are prone to abuse it, as illustrated in rulings of the competition authority.
A legislative package of reforms of SOEs that came into force this year (“Public Persons
Enterprises and Capital Shares Governance Law”) goes some way towards addressing these
shortcomings. Notably, it reintroduces boards to the biggest SOEs; establishes an entity
coordinating state enterprise ownership (the Coordination Institution) and requires annual
aggregate reporting. Nevertheless, the implementation of the new SOE corporate governance
function will be key (OECD, 2015b forthcoming). Besides, in line with the OECD Guidelines on
Corporate Governance of State-Owned Enterprises, boards of directors should be re-introduced
for all commercially-oriented companies, with clear selection and nomination procedures;
annual aggregate reporting should become the norm, and large or listed SOEs should
adhere to high quality internationally recognised accounting and auditing standards.
OECD ECONOMIC SURVEYS: LATVIA © OECD 201534
26© OECD 2015

ASSESSMENT AND RECOMMENDATIONS
Competition issues in the network industries mainly result from poor connectivity of
the infrastructure and incumbents that continue to dominate the market. Most of the
network sectors remain concentrated and have a high degree of public ownership (Karnitis
and Virtmanis, 2011), but progress is being made:
● In the electricity sector, liberalisation resulted in the legal separation of generation and
distribution from the network operator. Most of electricity is produced by a state-owned
incumbent Latvenergo, which owns the biggest distributor. Business customers and
households that decided to become market participants have been able to choose their
suppliers since 2007, while for other customers, in fact majority of the households,
market opening started this year. Recently, the country has been connected to Nord Pool
Spot, the Nordic- Baltic electricity exchange, and there are 12 electricity traders active
in the domestic market. Yet, prices for businesses remain higher than for Nordic
customers. This can be mainly explained by insufficient transmission capacity and
limited connectivity.
● In the gas sector, a privatisation deal made in the late 1990s resulted in a vertically
integrated monopoly. Third-party access to the network became legally possible in 2014
and supplier choice for end-users will be allowed in 2017, or as soon as the natural gas
system is directly connected to the interconnected system of any EU member state other
than Estonia, Lithuania and Finland, or as soon as the share of the main supplier of
natural gas is less than 75% (at the moment, 100% gas is supplied by Russia).
Effective competition in both the electricity and gas sectors is conditional on
improving infrastructure connectivity and this will take time. Nevertheless, to strengthen
the competitive environment in the near term, non-discriminatory access to the natural
monopoly elements of the industries is needed. Moreover, the risk that vertically
integrated firms will engage in strategic under-investment in infrastructure in order to
circumvent access obligations needs to be considered (OECD, 2011b). If on-going breaches
of competition rules are linked to a vertically integrated market structure, and regulation
alone proves inefficient, ownership unbundling should be considered.
Competition in other markets is often marked by a rural-urban divide. The broadband
telecom market is a case in point. A true digital divide exists both in terms of coverage and
access to broadband services. While a plethora of data providers compete in urban areas,
in the countryside only 44% of population is covered by the standard broadband coverage,
one of the lowest in the EU. A publicly funded development of the next generation network
is underway in rural areas, carried out by the public broadcaster. It will establish local
broadband connection points that will allow third-party access once it is completed. The
Competition Council has raised issues in waste management, where some local
governments use an in-house procurement exemption to provide these services, resulting
in a market that is closed to new entrants.
Improving judicial processes
An inefficient judiciary can diminish competition, firm growth, investment and
specialisation by hampering the reallocation of resources and raising capital costs. A
comprehensive reform of the judiciary is being implemented and includes reorganisation
of judicial districts, a bigger role for court presidents in managing the case-flow and wider
use of electronic record keeping. Some of the measures are starting to bear fruit, as the
length of proceedings and the clearance rate are improving. Yet, efficiency indicators for
OECD ECONOMIC SURVEYS: LATVIA © OECD 2015 35
27© OECD 2015

ASSESSMENT AND RECOMMENDATIONS
civil and commercial cases are starting to stall. Out-of-court settlements, an alternative to
the overburdened judiciary, have not worked well, because the arbitration institutions have
not been seen as independent (FILC, 2012). Reforms of laws on mediation and arbitration
have been passed. Both aim at tightening qualification requirements, thereby rebuilding
the effectiveness of these tools.
The insolvency regime, which is crucial for an efficient reallocation of resources as
well as for the cost of credit, has undergone a substantial overhaul in recent years.
Discharge of debt is now possible within one year following the sale of assets and an US-
style walk-away clause for mortgages has been recently introduced. Announced personal
insolvencies increased following the reforms but completion is still a challenge. Corporate
insolvencies have also picked up, though they appear to have peaked in 2009/2010. It
remains to be seen whether the recent slowdown is because of improved economic
environment or due to the introduction of a deposit (EUR 640) to be paid by the insolvency
applicant. Restructuring is possible also via protected out-of-court settlements, but these
have been infrequent, with only 4 cases concluded out of over 100 initiated in 2013.
Reducing energy intensity and dependency
Latvia is an energy intensive economy when compared with other OECD countries
(Figure 12). This is worrisome, as the economy is vulnerable to supply disruptions: gas
accounts for a large share of energy supply and is provided by one supplier. Also, the
relatively high level of energy consumption per unit of GDP has an impact on the
greenhouse gas emission intensity of the economy. This is only partly compensated by a
favourable energy mix which includes a large share of low-carbon energy sources.
Greenhouse gas (GHG) emissions have decreased significantly since 1990, and the
country’s GHG profile is unique since, thanks to large forest areas, it has negative absolute
emissions. However, abstracting from the natural endowment (i.e. excluding negative
emissions from land use, land-use change and forestry) Latvia ranked among the ten most
GHG intensive economies when compared with OECD countries in 2010 (Figure 13). As
defined by the EU Effort Sharing Decision, Latvia should not increase GHG emissions from
sectors not covered by the EU Emissions Trading System by more than 17% by 2020
compared to 2005. Reaching this target will be a challenge and additional measures are
planned to limit non-ETS emissions increase to 14.5% by 2020. Given expected increases in
carbon prices in the long term, ensuring competitiveness and sustainable growth requires
reducing energy intensity.
Transport and the household sector are the biggest energy users, with industry playing
a smaller role. In the transport sector there is scope for improved pricing of environmental
externalities as fuel taxes are among the lowest in the EU (OECD, 2015c forthcoming). In the
household sector, energy intensity reflects a large stock of inefficient housing and
centralised heating systems. Recent evidence suggests that households’ propensity to
invest in clean energy technologies depends mainly on home ownership, income, social
context and households’ information (Ameli and Brandt, 2014). Latvia has a high home-
ownership but income levels are low, which could explain part of the under-investment in
energy efficiency. A number of initiatives have been launched to improve the energy
efficiency of buildings. In 2013, the government introduced building energy certification
rules in order to facilitate comparisons of energy efficiency. Subsidies and public
guaranties for loans were also offered for improving housing insulation, energy-efficient
lighting and replacing fossil fuel heating systems with renewable energy heating systems.
OECD ECONOMIC SURVEYS: LATVIA © OECD 201536
28© OECD 2015

ASSESSMENT AND RECOMMENDATIONS
183675
house
183685
0.25
Energy-efficient investment in housing should be further supported. To increase the
efficiency of these programmes, subsidies should be directed to credit-constrained
households. Energy efficiency in district heating also remains a challenge. The regulation
of heat networks should provide stronger incentives to improve efficiency, for instance by
defining stricter requirements for heat supply systems.
With good natural conditions for hydropower and biomass, renewable energy sources
accounted for 36.3% of total primary energy supply in 2012, one of the highest shares in the
EU (Central Statistical Bureau of Latvia). Renewables reduce dependency on foreign energy
suppliers and mitigate GHG emissions. Nevertheless, developing them further from the
currently high level could be costly and the cost-effectiveness of the policy tools used to
reach renewables targets should be carefully assessed. Feed-in tariffs are in place to
promote renewable energy in the electricity sector, but as in many OECD countries they
have not been adapted to developments in electricity market price or to falling investment
Figure 12. Energy intensity is highTotal final energy consumption per unit of GDP (toe per thousand 2005 USD of GDP calculated using PPPs), 2012
Source: IEA (2014), World Energy Statistics and Balances database.1 2 http://dx.doi.org/10.1787/888933
Figure 13. Greenhouse gas emissions intensity is above the OECD averageTonnes CO2 eq per 1000 USD, including positive emissions from LULUCF1 sources
1. Land use, land-use change and forestry; i.e. including sources of GHG emissions and excluding removals/sequestration of greengas. Regarding what emissions from LULUCF are included and which ones are not, the model used is EDGAR.
Source: OECD/IEA Energy database.1 2 http://dx.doi.org/10.1787/888933
0.00
0.03
0.06
0.09
0.12
0.15
0.18
0.0
0.5
1.0
1.5
2.0
2.5
3.0
3.5
4.02010 1990
OECD ECONOMIC SURVEYS: LATVIA © OECD 2015 37
29© OECD 2015

ASSESSMENT AND RECOMMENDATIONS
183697
costs. The generosity of the scheme was reduced in January 2014 with the introduction of
a tax on subsidised electricity production. The feed-in tariffs were suspended for new
entrants in 2011 and are currently under revision. A cost-benefit analysis of the scheme
should be carried out as they entail generally the highest costs for abating carbon
emissions (OECD, 2013b). If the scheme is continued, feed-in tariffs should be adjusted to
electricity market prices and technology developments on a regular basis.
Deepening skills and innovation
Educational attainment and skills have a strong influence on labour market outcomes
and effective investment in youth skills determines the capacity of countries to face
various shocks and to get the most out of globalisation, technological changes and
innovations. The education system has undergone significant reforms during the
transition and Latvian students perform relatively well by international comparison. PISA
results show that literacy, numeracy and science scores are close to the OECD average.
Overall, the population is well educated: 80% of the working-age cohort has upper
secondary education or higher; tertiary education attainment has been increasing over the
years to 27% in 2013, with more women attaining degrees than men: 34% versus 20%.
Employment rates of tertiary education graduates are comparable to the top OECD
performers. Yet, graduates of lower levels of education lag behind (Figure 14).
Vocational education and training (VET) is to play an increasing role. The authorities
aim is for half of students to attain VET and half a general education by 2020; the current
share being 40 to 60. To date, the VET has not had a particularly good image; the share of
those who consider that VET provides high-quality learning was well below the EU average
(Eurobarometer, 2011). A comprehensive reform is currently under way that includes
consolidating VET institutions; creating so-called multi-functional competence centres;
setting up new occupational standards in cooperation with employers; and revising school
programmes and teaching methods. A pilot programme of work-based-learning, inspired
by the German, Austrian and Swiss apprenticeship models is also being developed.
Figure 14. Employment rates differ widely by educational levelEmployment rates among 25-64 year-olds, 2013, %
Source: Eurostat database.1 2 http://dx.doi.org/10.1787/888933
20
30
40
50
60
70
80
90
100Tertiary education Upper secondary or post-secondary non-tertiary Below upper secondary
OECD ECONOMIC SURVEYS: LATVIA © OECD 201538
30© OECD 2015

ASSESSMENT AND RECOMMENDATIONS
Turkey.
183705
This reform is welcome, as it covers many important aspects of a well-balanced skills
strategy, but could go even further in some areas. Four ministries are involved in VET,
though most of the schools fall under the Ministry of Education, and in addition some
municipalities have taken over smaller VET institutions. Coordination across these bodies
should therefore ensure that national standards are enforced in order to reach the same
quality of education. While modular programmes that can also serve the purpose of
lifelong learning are being developed in the VET, it is important that there are also modules
for enhancing basic literacy and numeracy skills.
The participation of the working-age population in both formal and non-formal forms
of education and training is low (Figure 15). According to the Programme for the
International Assessment of Adult Competencies (PIAAC) survey, in most OECD countries,
adults with already-high levels of literacy and numeracy are much more likely to participate
in further adult education and training. In combination with generally lower employment
rates, this means that involving the low-skilled should be a priority. Minorities were hit by
the downturn in terms of employment, suggesting that these groups should also be in the
policy focus. Factors behind these outcomes have not yet been fully identified but a relatively
lower educational level and the lack of Latvian language skills certainly play a role.
Figure 15. Participation in lifelong learning is lowParticipation rate in formal or non-formal education and training, 25-64 years-olds, 2011, %
Note: Based on the adult education survey (AES). The reference period for AES is the 12 months before the interview. 2007 data forSource: Eurostat database.
1 2 http://dx.doi.org/10.1787/888933
A. Formal education and training
B. Non-formal education and training
0
2
4
6
8
10
12
14
16
0
10
20
30
40
50
60
70
80
OECD ECONOMIC SURVEYS: LATVIA © OECD 2015 39
31© OECD 2015

ASSESSMENT AND RECOMMENDATIONS
183711
Insufficient public supply of general and professionally oriented Latvian language courses
for the adult population was identified as one of the barriers to better integration of the
ethnic minorities (Hazans, 2011). Language training is now offered by the public employment
service, as well as for employed under risk of job-loss as a part of lifelong learning
programmes. Efforts to help minorities to acquire the skills needed on the labour market
should continue, combined with professionally-oriented Latvian language courses.
Current measures to support lifelong learning, including a deduction from personal
income tax for employees, might not be sufficient to develop adult education and training.
As part of the ongoing VET reform, the authorities plan that selected VET institutions will
play a bigger role in the provision of lifelong learning, once the new curricular and modules
are in place. Labour unions and employers are currently involved in discussions about the
settings of the occupational standards under the so-called Sector Expert Councils. This is
welcome, as experience of countries like France, Finland, Austria and Germany shows that
involvement of social partners is useful in designing the content of training and supervision
of the provision (Bassanini et al., 2005). Nevertheless, as with VET, policy responsibility is
fragmented: ten different institutions are involved in implementing lifelong learning. The
authorities have an important role to play in improving information about training
opportunities, adult learning and ensuring the portability of skills. In addition, improving
access to good quality education and preventing poor educational outcomes in the first place
should increase training and adult learning demand in the long run.
Innovation activity has been limited. Only about a third of local enterprises were
innovative prior to the 2009 global economic crisis, one of the lowest shares in the EU
(Eurostat, 2013). The share of high-technology products in exports is small; and Latvia lags
behind its neighbours in patenting and commercialisation of research (Cunska et al., 2013).
Furthermore, overall spending on research and development (R&D) is low, both in terms of
public and private expenditure. The authorities have an ambitious goal of more than
doubling the R&D spending, from current 0.6 to 1.5% of GDP by 2020 (Figure 16). Though a
number of policies have been developed to this end, it will be a challenging task.
Figure 16. R&D expenditure is among the lowest compared with OECD countriesGross domestic expenditure on R&D, % of GDP, 2012 or latest year available
Note: 2011 for Iceland, New Zealand and Mexico. 2010 for Australia. 2008 for Switzerland.Source: OECD Main Science and Technology Indicators database and Eurostat database.
1 2 http://dx.doi.org/10.1787/888933
Target 2020
0.0
0.5
1.0
1.5
2.0
2.5
3.0
3.5
4.0
4.5%
OECD ECONOMIC SURVEYS: LATVIA © OECD 201540
32© OECD 2015

ASSESSMENT AND RECOMMENDATIONS
The R&D policy framework involves both direct and indirect support measures. A
number of direct support measures, such as business incubators are available, largely
subsidised by the EU structural funds. A new tax incentive has been recently introduced to
stimulate investment in research, development and innovation. It allows decreasing
corporate income tax liability by three-times the costs of purchased intangibles with no
cap. The impact of such measures should be carefully assessed. In particular, there is a risk
that the tax incentives will not influence innovative activities in young firms. Tax
incentives that do not involve immediate cash refunds are less favourable to new market
entrants, which do not typically make much profit in their early years and so are not able
to benefit from tax concessions.
A consolidation of the existing public research infrastructure is under way. With some
exceptions, existing research activities are not very well tuned to business needs and
Latvian research lags behind in terms of internationalisation. The ongoing comprehensive
reform includes cutting down the number of research institutions and units, bringing
research into the tertiary education sector and improving links between the research and
business sectors. This could help local enterprises to become more innovative and
productive. At the same time, incentives for international cooperation in local research and
innovation activity are needed, as well as a regular external evaluation exercise.
Recommendations to raise productivity and ensure robust convergence
Key recommendations
● Make regulation more competition-friendly by reducing entry barriers.
● Continue reducing red tape, by simplifying the permits and licenses system and taxpayments.
● Bring the governance of state-owned enterprises further in line with the OECDGuidelines on Corporate Governance of State-Owned Enterprises.
● Continue improving the connectivity of energy networks with the rest of theEuropean Union.
● Proceed with the reform of vocational education and training, including the plannedextension of work-based learning.
● Encourage lifelong learning and training by improving information about trainingopportunities and adult learning, while ensuring the portability of skills.
Other recommendations
● Strengthen the independence of the Competition Council and enforcement ofcompetition policy by giving it more financial and administrative autonomy.
● Ensure that feed-in tariffs for renewable energy production are cost-effective.
● Offer financial support to foster energy efficiency gains in the housing sector, inparticular to credit-constrained households.
● Provide stronger incentives to improve efficiency in district heating.
● Continue helping minorities to acquire skills needed on the labour market.
● Continue offering programmes enhancing basic literacy and numeracy skills.
OECD ECONOMIC SURVEYS: LATVIA © OECD 2015 41
33© OECD 2015

ASSESSMENT AND RECOMMENDATIONS
Bibliography
Ameli, N. and N. Brandt (2014), “Determinants of Households’ Investment in Energy Efficiency andRenewables: Evidence from the OECD Survey on Household Environmental Behaviour andAttitudes”, OECD Economics Department Working Papers, No. 1165, OECD Publishing.
Bank of Latvia (2014), Financial Stability Report 2013/2014, Bank of Latvia.
Baltic International Centre for Economic Policy Studies, (2014), “Tax Reform in Latvia”, BICEPS, Riga.
Bassanini A., A. Booth, G. Brunello, M. De Paola, E. Leuven (2005), “Workplace training in Europe”, IZADiscussion Paper No. 1640, June 2005.
Blanchard O., M. Griffiths, and B. Gruss (2013), “Boom, Bust, Recovery Forensics of the Latvia Crisis”.BPEA paper, Economic Studies at Brookings.
Cunska, Z., C. Ketels, A. Paalzow and A. Vanags, (2013), Latvia Competiveness Report, Stockholm Schoolof Economics in Riga and Baltic International Centre for Economic Policy Studies.
Dreblow, E., M. Duwe, T. Wawer, L. Donat, E. Zelljadt, A. Ayres, I. Upatniece (2013), “Assessment ofclimate change policies in the context of the European Semester, Country Report: Latvia”, EcologicInstitute, eclareon, June.
Eglitis G., R. Krastev and C. Weise, (2014), “Latvia: benefiting from the euro, facing new challenges”,ECFIN Country Focus, European Commission, Vol. 11, Issues 12, November 2014.
Eurobarometer (2011), Attitudes towards vocational education and training, Special Eurobarometer 369,European Commission, Brussels.
European Bank for Reconstruction and Development (2011), Life in Transition Survey, EBRD Publications.
European Central Bank (2013), “Convergence report June 2013”.
European Central Bank (2014), “Aggregate Report on the Comprehensive Assessment”, October 2014.
European Commission (2012), 2012 Ageing Report: Economic and budgetary projections for the EU27Member States (2010-60), EC, Brussels.
European Commission (2013a), “EC Staff Report from the Third Post-programme Surveillance Mission”,Brussels.
European Commission (2013b), “Member States’ Energy Dependence: An Indicator-basedAssessment”, Occasional Papers No 145, Brussels.
European Commission (2013c), “Adequacy and Sustainability of Pensions”, European Commission paper.
European Commission (2014a), “Assessment of the 2014 National Reform Programme and StabilityProgramme for Latvia”, Commission staff working document, Brussels.
European Commission (2014b), “2012 Update Report to the Study to quantify and analyse the VAT Gapin the EU-27 Member States”, September 2014.
Foreign Investors’ Council in Latvia (FILC) (2012), Position paper on proposals for the improvement ofthe Insolvency process, Riga.
Recommendations to raise productivity and ensure robust convergence (cont.)
● Carry out coordinated and regular assessment of productivity challenges as an input forregulatory reform.
● Reinforce regulatory impact assessments by reducing fast-tracking, establishing specificsustainability checks and introducing threshold tests for the preparation of more in-depth analyses.
● Evaluate the newly reformed tax incentives for R&D, also in view to reaching youngfirms.
● Develop incentives for international cooperation in local research and innovation aswell as a regular external evaluation exercise.
OECD ECONOMIC SURVEYS: LATVIA © OECD 201542
34© OECD 2015

ASSESSMENT AND RECOMMENDATIONS
Hazans M. (2011), Labour market Integration in Latvia, in M. Kahanec and K.F. Zimmermann, EthnicDiversity in European Labour Markets, Edward Elgar Publishing.
Hüfner F., A. Wörgötter, and C. Klein (2013), “The German Labour Market in the Great Recession,Lessons for Other Countries”, in Learning from the World : New Ideas to Redevelop America, edited byJoe Colombano and Aniket Shah.
IMF (2014), “Republic of Latvia: 2014 Article IV Consultation, International Monetary Fund”.
Karnitis E., A. Virtmanis (2011), Multi-sectoral regulation of services of general economic interest – Tenyear experience of Latvia, Public Utilities Commission of Latvia, Riga.
KMPG (2014), “Estimated Macroeconomic Impact on the Non-resident Segment of the Banking Sectoron the Latvian economy”, KMPG, Riga.
Lamine B. and E. Lohmuste, (2014), “Do the Baltics States need to tax passenger cars more”, ECFINCountry Focus, Vol. 12, Issue 11, November 2014.
Lehmann H. and A. Zaiceva (2015), Key Labour Market Trends in Latvia, forthcoming.
OECD (2011a), Taxation and Employment, The Taxation of Low-Income Workers, OECD Publishing.
OECD (2011b), “Report on Experiences with Structural Separation”, OECD Publishing.
OECD (2012), OECD Economic Surveys, Estonia, OECD Publishing.
OECD (2013a), Migration Outlook, OECD Publishing.
OECD (2013b), Effective Carbon Prices, OECD Publishing.
OECD (2013c), PISA 2012 Results: Excellence through Equity Giving Every Student the Chance to Succeed,Vol. II, PISA, OECD Publishing.
OECD (2014a), OECD Economic Surveys: Euro Area 2014, OECD Publishing.
OECD (2015a), Market Openness Review, OECD Publishing, forthcoming.
OECD (2015b), Review of Latvia’s position relative to the OECD guidelines on corporate governance of state-owned enterprises, OECD Publishing, forthcoming.
OECD (2015c), “Climate Change Mitigation in Latvia”, Technical background paper, OECD Publishing,forthcoming.
Putniņš T.J. and A.Sauka, (2014), “Shadow Economy Index for the Baltic countries, 2009 – 2013”, TheCentre for Sustainable Business, SSE Riga.
PWC and World Bank (2014), Paying taxes 2015: The Global Picture, World Bank, Washington.
World Bank (2012), Financial Sector Assessment – Republic of Latvia, June 2012, World Bank,Washington.
World Bank (2013), “Latvia: Who is Unemployed, Inactive or Needy? An Assessment of Post-CrisisPolicy Options”, World Bank, Washington.
World Health Organisation and European Observatory of Health Systems and Policies (WHO andEOHSP) (2012), Latvia: Health System Review, Health systems in Transition, Vol. 14, No. 8.
OECD ECONOMIC SURVEYS: LATVIA © OECD 2015 43
35© OECD 2015

36© OECD 2015

OECD Economic Surveys: Latvia
© OECD 2015
ANNEX
Selected policy indicators
45
37© OECD 2015

38© OECD 2015

ASSESSMENT AND RECOMMENDATIONS
183725
0.0
0.5
1.0
1.5
2.0
2.5
3.0
0.00.51.01.52.02.53.03.54.0
0.0
0.5
1.0
1.5
2.0
2.5
3.0
0.0
0.5
1.0
1.5
0.00
0.05
0.10
0.15
0.20
0.25
Figure A1. Product Market Regulation (PMR) and FDI Regulatory Restrictiveness Index
Source: OECD (2013), Product Market Regulation Database and www.oecd.org/investment/index.1 2 http://dx.doi.org/10.1787/888933
E. FDI Regulatory Restrictiveness Index (2013, index scale of 0-1 from open to closed)
A. PMR, Overall indicator (2013, index scale of 0-6 from least to most restrictive)
B. PMR, State control (2013, index scale of 0-6 from least to most restrictive)
C. PMR, Barriers to entrepreneurship (2013, index scale of 0-6 from least to most restrictive)
D. PMR, Barriers to trade and investment (2013, index scale of 0-6 from least to most restrictive)
0.0
0.5
1.0
1.5
2.0
2.5
3.0
OECD average
0.00.51.01.52.02.53.03.54.0
OECD average
0.0
0.5
1.0
1.5
2.0
2.5
3.0
OECD average
0.0
0.5
1.0
1.5
OECD average
0.00
0.05
0.10
0.15
0.20
0.25
OECD average
OECD ECONOMIC SURVEYS: LATVIA © OECD 2015 47
39© OECD 2015

ASSESSMENT AND RECOMMENDATIONS
183731
0.0
0.5
1.0
1.5
2.0
2.5
3.0
3.5
0.0
1.0
2.0
3.0
4.0
5.0
0.0
1.0
2.0
3.0
4.0
5.0
Figure A2. OECD indicators on Employment Protection Legislation (EPL)2013, index scale of 0-6 from least to most restrictive
Source: OECD Employment Protection Database, 2013 update.1 2 http://dx.doi.org/10.1787/888933
B. Specific requirements for collective dismissal
C. Regulation on temporary forms of employment
A. Protection of permanent workers against (individual) dismissal
0.0
0.5
1.0
1.5
2.0
2.5
3.0
3.5
OECD average
0.0
1.0
2.0
3.0
4.0
5.0
OECD average
0.0
1.0
2.0
3.0
4.0
5.0
OECD average
OECD ECONOMIC SURVEYS: LATVIA © OECD 201548
40© OECD 2015

ASSESSMENT AND RECOMMENDATIONS
183742
183751
5
ian
ublic
Figure A3. Student performance and equity
Source: OECD (2014), Education at a Glance, Chart A9.4.1 2 http://dx.doi.org/10.1787/888933
Figure A4. Science and innovation indicatorsNormalised index of performance relative to the median values in the OECD area (Index median = 100)
Source: OECD (2014), OECD Science, Technology and Industry Outlook.1 2 http://dx.doi.org/10.1787/888933
AUSAUT
BEL CAN
CHL
CZEDNK
EST
FIN
FRA
DEU
GRCHUN
ISLIRL
ISR ITA
JPN
KOR
LUX
MEX
NLD
NZL
NOR
POL
PRTSVK
SVN
ESPSWE
CHE
TUR
GBRUSA
Latvia
400
450
500
550
600
10152025
Mean mathematics score
Percentage of variation in performance explained by the PISA index of economic, social and cultural status
Above-average mathematics performanceBelow-average equity in education outcomes
Above-average mathematics performanceAbove-average equity in education outcomes
Below-average mathematics performanceBelow-average equity in education outcomes
Below-average mathematics performanceAbove-average equity in education outcomes
Greater equity
OEC
D a
vera
ge
OECD average
020406080
100120140160180200
Public R&D expenditure (perGDP)
Business R&D expenditure(per GDP)
Triadic patent families (perGDP)
Fixed broadbandsubscriptions (per population)
E-government developmentindex
International co-invention (%)
Tertiary educationexpenditure (per GDP)
Adult population at tertiaryeducation level (%)
Doctoral graduate rate inscience and engineering (%)
Latvia
OECD med
Estonia
Slovak Rep
OECD ECONOMIC SURVEYS: LATVIA © OECD 2015 49
41© OECD 2015

ASSESSMENT AND RECOMMENDATIONS
183762
g
0
3
6
9
2
5
8
1
0
5
0
5
0
5
Figure A5. Environmental indicators
Source: OECD/IEA Energy database and World Bank, WDI database.1 2 http://dx.doi.org/10.1787/888933
A. Greenhouse gas emissions per unit of GDP (tonnes CO2 eq per 1000 USD), 2010
B. Energy intensity (total final energy consumption per unit of GDP, toe per thousand 2005 USD of GDP calculated usinPPPs), 2012
C. PM10 emissions (micrograms per cubic meter, 2011)
0.
0.
0.
0.
1.
1.
1.
2.
0.0
0.3
0.6
0.9
1.2
1.5
1.8
2.1
OECD average
0.0
0.0
0.1
0.1
0.2
0.2
0.00
0.05
0.10
0.15
0.20
0.25
OECD average
0
10
20
30
40
50
60
70
0
10
20
30
40
50
60
70
OECD average
OECD ECONOMIC SURVEYS: LATVIA © OECD 201550
42© OECD 2015

ASSESSMENT AND RECOMMENDATIONS
183778
0.0
1.0
2.0
3.0
4.0
5.0
6.0
7.0
8.0
9.0
0.0
1.0
2.0
3.0
4.0
5.0
6.0
7.0
8.0
9.0
0
5
10
15
20
25
30
Figure A6. Public spending
Source: OECD National Accounts at a glance database and Eurostat database.1 2 http://dx.doi.org/10.1787/888933
A. Health expenditure, % of GDP, 2011
B. Education expenditure, % of GDP, 2011
C. Social protection expenditure, % of GDP, 2011
0.0
1.0
2.0
3.0
4.0
5.0
6.0
7.0
8.0
9.0
OECD average
0.0
1.0
2.0
3.0
4.0
5.0
6.0
7.0
8.0
9.0
OECD average
0
5
10
15
20
25
30
OECD average
OECD ECONOMIC SURVEYS: LATVIA © OECD 2015 51
43© OECD 2015

ASSESSMENT AND RECOMMENDATIONS
183782
Figure A7. Income redistributionGini coefficient, scale from 0 “perfect equality” to 1 “perfect inequality”, 2011¹
1. 2009 for Japan, 2010 for Belgium, 2012 for Australia, Finland, Korea, Netherlands and the United States.2. OECD Secretariat calculations from EU-SILC – preliminary results.Source: OECD Income Distribution database and OECD Secretariat calculations.
1 2 http://dx.doi.org/10.1787/888933
0.0
0.1
0.2
0.3
0.4
0.5
0.6
Before taxes and transfers After taxes and transfers
OECD ECONOMIC SURVEYS: LATVIA © OECD 201552
44© OECD 2015

1
© OECD 2015

On 29 May 2013, the OECD Council decided to open discussions with Latvia on accession to the
Organisation and, on 15 October 2013, an Accession Roadmap, setting out the terms, conditions and process
for accession was adopted [C(2013)122/FINAL].
In the Roadmap, the OECD Council requested a number of OECD Committees to provide it with a
formal opinion. The Economic and Development Review Committee was requested to provide a formal
opinion evaluating Latvia’s policies and practices as compared to OECD best policies and practices. In light
of the formal opinions received from OECD Committees and other relevant information, the OECD Council
will decide whether to invite Latvia to become a member of the Organisation.
The present Economic Survey was prepared for the purposes of the accession review of Latvia. The draft
report was discussed by the Economic and Development Review Committee on 18 December 2014, revised in
the light of the discussions and finalised on 22 January 2015. The draft report was prepared for the
Committee by Caroline Klein and Zuzana Smidova under the supervision of Andreas Wörgötter. It also
benefitted from consultancy work by Robert Price. Research assistance was provided by Corinne Chanteloup.
Heloise Wickramanayake formatted and produced the layout of the document.
This is the first OECD Economic Survey of Latvia. It is published on the responsibility of the Secretary-
General of the OECD.