oeg -0 -70 -4797 (607) 32p
TRANSCRIPT
DOCUMENT RESUME
ED 083 618 CS 200 769
AUTHOR Charrow, V. R.; Fletcher, J. D.TITLE English as the Second Language of Deaf Students.
Psychology and Education Series.INSTITUTION Stanford Univ., Calif. Inst. for Mathematical Studies
in Social Science.SPONS AGENCY Bureau of Education for the Handicapped (DHEW/OE) ,
Washington, D.C.REPORT NO TR-208PUB DATE 20 Jul 73GRANT OEG -0 -70 -4797 (607)NOTE 32p.
EDRS PRICE MF-$0.65 HC-$3.29DESCRIPTORS Deaf Children; *Deaf Research; *English (Second
Languagp); *Foreign Students; Language Development;Language Proficiency; *Language Tests; *YoungAdults
IDENTIFIERS Stanford Achievement Test; Test of English as aForeign Language
ABSTRACTThe Test of English as a Foreign Language (TOEFL) was
administered to 26 deaf students (approximately 18 years of age) todetermine (1) whether deaf children of deaf parents (DP),, as users ofAmerican Sign Language and as possessors of a shared code, wouldoutperform deaf children of hearing parents (HP); (2) whether theperformance of DP subjects, if they do learn English as a secondlanguage, would resemble the performance of hearing, foreign students-on their item-by-item performance; and (3) whether the performance ofDP subjects on the TOEFL test and on the Stanford Achievement Test(SAT) would be less related than the performance of HP subjects.Results showed that the DP group was superior to the HP group ofthree of the four TOEFL subtests and on two SAT subtests and that theparentage variable accounted for 53 percent of the variance in totaltest scores. The item-by-item comparisons showed the DP groupperformance to more like that of the hearing, foreign students thanwas the performance of the HP group. Whereas the correlations of theParagraph Meaning SAT subtest scores with the TOEFL scores failed todiscriminate between the DP and HP subjects; the DP subjects' scorescorrelated better than HP group scores on the Language subtest of theSAT. (HOD)
U.S. DEPARTMENT CF HEALTH,EDUCATION & WELFARENATIONAL INSTITUTE OF 0
EDUCATION;HIS DOCUMENT HAS BEEN REPRO.DUCED EXACTLY AS PrCEIVED FROMCO 7 ,L rERSON OR ORGANIZATION ORIGIN.A WI; IT POINTS or VIEW OR OPINIONSSTATED DO NOT NECESSARILY REPROr.4',ENT OFFICIAL NATIONAL INSTITUTE 01,
,4) EDUCATION. POSITION OR POLICY.
ff.\
ENGLISH' AS THE SECOND LANGUAGE OF DEAF STUDENTSCDCn by.
A.LXV..R. Charrow and J. Fletcher
n.
TECHNICAL REPORT NO, 208
July 20, 1973
PSYCHOLOGY AND EDUCATION SERIES
Reproduction in Whole or in Part Is Permitted for
Any Purpose of the United States GOvernment
ResearCh:reported has been supported by theBureau of the Handicapped,, U. S. Office of Education
through Grant OEG-0-70-4797.(607)
INSTITUTE FOR MATHEMATICAL STUDIES IN THE SOCIAL SCIENCES
STANFORD UNIVERSITY.
STANFORD, CALIFORNIA
. _
FILMED FROM BEST AVAILABLE COPY
tn
ENGLISH AS THE SECOND LANGUAGE OF DEAF STUDENTS1
2V. R.,Charrow and J. T. Fletcher
Stanford University, Stanford, California 94305
Education for. hearing impaired, or 'deaf', students centers on
language skills such as speech, vocabulary, composition, grammar, read-
ing, speech-reading; and, in high school, remedial' English. In spite
of-this emphasis upon their presumed. native language the deaf, _in
numerous measures of English language ability, consistently score lower
than hearing controls (Goetzinger & Rousey 1959; Miller, 1958; Moores,
1970). In tests of writing ability, deaf subjects evince large vocab
ulary deficits relative to hearing subjects (Templin, 1966, 1967), and
the grammatical correctness and complexity of their writings are far
below those of hearing controls (Eunagan,. 1969; MarShall,& Quigley, 1970;
Stuckless & Marks, 1966).
It is doubtful that this language deficit can be. ascribed to a more
general cognitive deficit (Furth, 1964). Recent reviews of the literature
Challenge earlfer claims_of a cognitive deficit and strongly indicate
that the distribution of intelligence is similar for deaf and hearing
populations-(apnvillian-& Charrow, 1972; Mindel & Vernon; 1971; Vernon,
1967 .1968). An alternative to the coghitive deficit explanation is
that English is not the native language of the prelingually deaf child
and that he learns English as a-second language.
In the case of the deaf child of deaf parents, this explanation.
seems quite plausible. His first language.may_be, American Sign Language

(ASL), or Ameslan (Fant, 1972), learned from his parents who are likely
to be fluent signers. Signs do not necessarily bear a one-to-one rela-
tionship to English vocabulary, and the syntax of ASL is radically
different from the syntax of English (McCall, 1965; Stokoe, 1960, 1971).
Therefore, the deaf child of deaf parents may experience difficulties in
learning English that are similar to those encountered by anyone learning
English as a second language.
In the case of the deaf child of hearing parents, the second lan-
guage explanation seems less plausible. Until he enters a school for
the deaf, learns signs from his peers, and is taught English, a deaf
child of hearing parents may have no native language in the strict sense
of a code shared by many users. The deaf child of hearing parents may
devise a set of idicisyncratic gestures that communicate basic needs and
ideas to his parents, but his vocabulary and grammar will have little in
common with anyone other than his parents. If one assumes with Lenneberg
(1967) and others that the optimal time for learning language ends at an
early age, one might expect the deaf child of hearing parents, because
he has no common first language as a basis, to encounter even more dif-
ficulties in learning English than the deaf child of deaf parents. This
assumption is supported by Meadow (1968) who found the reading ability of
deaf children of deaf parents to be superior to that of deaf children of
hearing parents.
That the prelingually deaf child learns English as a second language
is supported by observations of educators of the deaf (Stokoe, 1971) and
of deaf people themselves (Williams, 1968). However, no empirical studies
have been undertaken to substantiate these observations. A natural
2

design for such an investigation is to administer a test of English as
a second language to prelingually deaf subjects divided into two groups,
deaf children of hearing parents and deaf children of deaf parents. Per-
formance by the two groups on the test can then be compared with each
other, with the performance of hearing subjects for whom English is a
foreign language, and with the performance of the two groups on standard
English skills.
This design was used in the present study to investigate three
general hypotheses. First, deaf children of deaf parents, as users of
ASL and as possessors of a native language in the sense of a shared code,
should outperform deaf children of hearing parents on any test involving
language skills and, particularly, on a test of English as a second lan-
guage Second, if deaf children of deaf parents learn English as a
second language, their item-by-item performance on a test of English as
a second language should resemble the performance of foreign students
taking the test more than the performance of deaf children of hearing
parents. Third, performances by deaf children of deaf parents on a test
of English as a second language and on a standard test of English skills
should be less related than performances by deaf children of hearing
parents on the two tests.
Procedure
An appropriate standardized test of English, the Test of English as
a Foreign Language (TOEFL) published by Educational Testing Service (ETS)
of Princeton (1970), was administered to 26 students at the California
School for the Deaf in Berkeley, California.
3
The manual for the TOEFL describes it as a test of English pro-
fi:dency divided into five parts, each measuring an important language
skill: Listening Comprehension, English Structure, Vocabulary, Reading
Comprehension, and Writing Ability. The test was reviewed by Chase and
Domino in Buros (1972). Both reviews questioned the utility of the
separate subtests as reliable sources of diagnostic information because
of substantial intercorrelation between them. On the other hand, both
reviews indicated that the TOEFL demonstrates sufficient concurrent
validity when other measures of English proficiency are used as criteria.
Another aspect of the TOEFL is its construct validity; it should
discriminate between individuals for whom English is a second language
and those for whom English is a native language. Angoff and Sharon
(1971) administered the TOEFL to 71 American undergraduates who scored
below the 30th percentile on the American College Testing Program (ACT)
English Test. These students achieved scores on the TOEFL that were far
above those observed for foreign students, and many earned maximum or
near-maximum scores. All but .17 items on the TOEFL were easier for the
American students than for foreign students. Further, the correlation
of ACT scores with TOEFL scores in the Angoff and Sharon data was only
.64. As the TOEFL manual indicates, this correlation is fairly low for
two reliable tests measuring the same skill. The implication of the
Angoff and Sharon study is that the TOEFL measures language skills dif-
ferent from those in the ACT English Test and that these different skills
are particularly relevant to individuals who must learn English as a
second language.
4
In administering the TOEFL to the deaf subjects all references to
English as a foreign language in the directions and on the printed portion
of the test were omitted. It was presented. simply as a test of English.
The Listening Comprehension subtest was omitted from the test adminis-
tration. The standardized test instructions were given in Signed English,
or sign language with English. word order (Fant; 1972), which is the nor-
mal medium for classroom instruction at the school. Additionally, the
sample questions for the TOEFL were written on a blackboard, signed, and
fingerspelled. Responses to the sample questions were elicited from all
the subjects who were allowed to begin each subtest only after they had
demonstrated an understanding of both the directions and the sample
questions. Because extra time Was required to present the instructions
to the deaf subjects, a lunch break was permitted between the Reading
Comprehension and Writing Ability subtests. The test was graded by ETS
and the TOEFL data fbr this study were the transformed scores ordinarily
used by ETS in reporting TOJ±JFL results. These scores are scaled to a
distribution with a mean of 50 and a standard deviation of 10..
Additionally, grade placement scores from the Stanford Achievement
Test (SAT) Paragraph. Meaning (PM) and Language (L) subtests were avail-
able for. all 26 subjects and were used in this study. According to the
SAT manual (Kelley; Madden, Gardner, and Rudman, 1964), the. PM subtest
measures subjects' ability to comprehend and draw references from con,
netted written discourse and the L subtest measures subjects' proficiency
in usage, punctuation, capitalization, dictionary skills; and sentence
sense'.
5

Subjects
The subjects for this study were 13 children (5 females and 8 males)
of hearing parents (HP) and 13 children (4 females and 9 males) of deaf
parents (DP). All subjects in the DP group and 10 subjects in the HP
group were congenitally deaf. Three HP subjects were identified as deaf
at 18 months of age. Hearing loss for all subjects in the experiment was
at least 65 db in the better ear in the 500 to 2,000 frequency range.
In order to assign a numerical value to the hearing loss experienced by
all the subjects, a value of 115 db was arbitrarily assigned to subjects
whose hearing loss had been diagnosed as total. The mean age over all
subjects in the experiment was 17 years and 9 months, which is comparable
to the normal age for college entrance in the United States. However,
the average age of the HP subjects was significantly higher than that
of the DP subjects. Table 1 displays the means and standard deviations
of age, WISC Performance IQ, and hearing loss for the two groups of
subjects.
Results and Discussion
Comparisons of the HP and DP groups' performance on the TOEFL are
shown in Table 2, together with means and standard deviations for a
standard group of 113,975 hearing, foreign students who took the TOEFL
between February 1964 and June 1966. These standard data were taken
from the TOEFL manual (Test of English, 1970, p. 6).
The most striking aspect of these data is the clear superiority
shown by the DP students over the HP students in the English Structure,
(ES), Vocabulary (V), and Writing Ability (WA) subtexts and in total
test performance. It is doubtful that this superiority wax due to
6
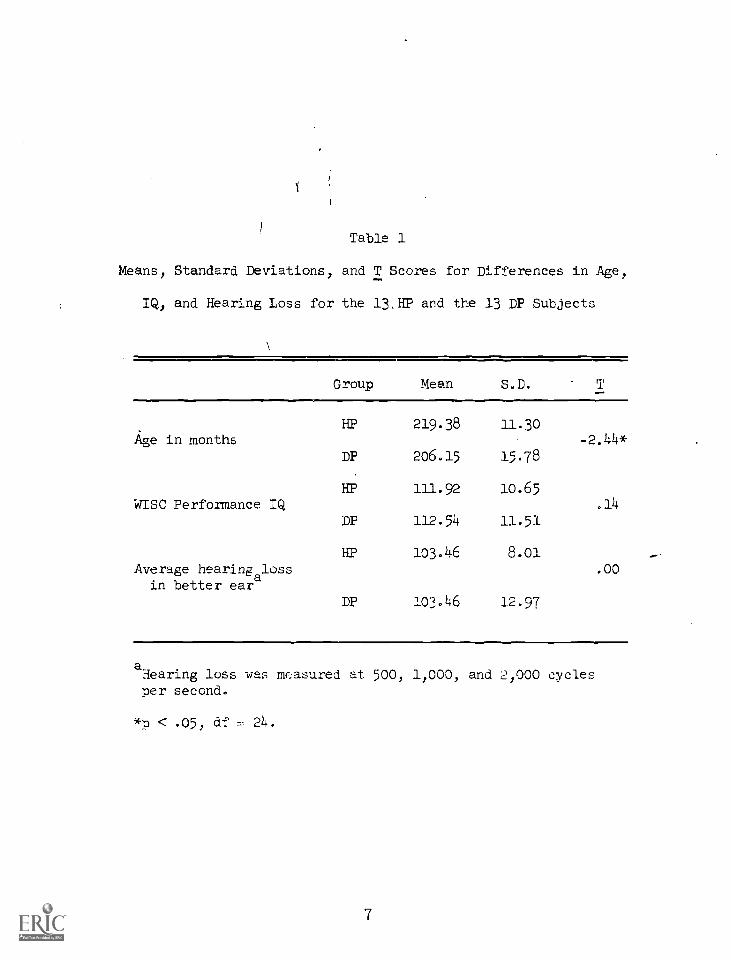
Table 1
Means, Standard Deviations, and T Scores for Differences in Age,
IQ, and Hearing Loss for the 13,HP and the 13 DP Subjects
Group Mean S.D. T
HP 219.38 11.30Age in months -2.44*
DP 206.15 15.78
HP 111.92 10.65WISC Performance IQ .14
DP 112.54 11.51
HP 103.46 8.01Average hearingaloss
in better ear.00
DP 103.46 12.97
aHearing loss was measured at 500, 1,000, and 2,000 cyclesper second.
*p < .05, df = 24.
7
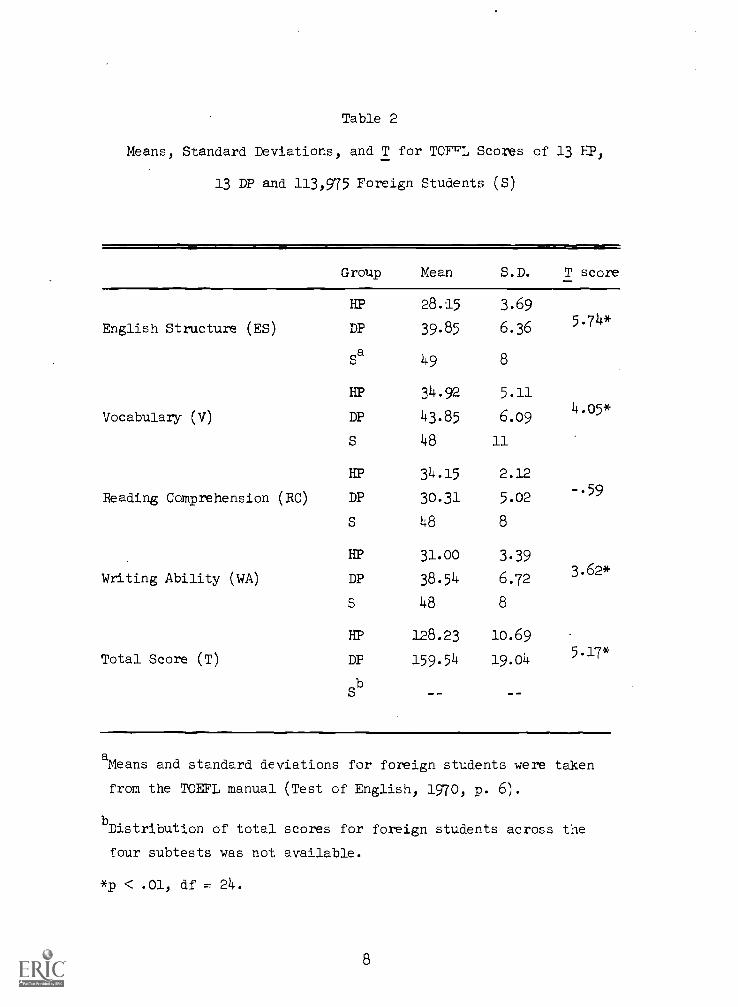
Table 2
Means, Standard Deviations, and T for TOFvL Scores of 13 HP
13 DP and 113,975 Foreign Students (S)
Group Mean S.D. T score
HP 28.15 3.69
English Structure (ES) DP
a
39.85
49
6.36
8
5.74*
HP 34.92 5.11
Vocabulary (V) DP 43.85 6.094.05*
48 11
HP 34.15 2.12
Reading Comprehension (RC) DP 30.31 5.02 --59
48 8
HP 31.00 3.39
Writing Ability (WA) DP 38.54 6.723.62*
48 8
HP 128.23 10.69
Total Score (T) DP 159.54 19.045.17*
Sb
alvleans and standard deviations for foreign students were taken
from the TOEFL manual (Test of English, 1970, p. 6).
bDistribution of total scores for foreign students across the
four subtests was not available.
*p < .01, df = 24.
8

socioeconomic differences between the groups. Reports from the school
indicate that, if anything, the DP'subjects came from lower socioeconomic
backgrounds than did the HP subjects. It is also doubtful that this
superiority was due to factors related to personality adjustment. Although.
Meadow (1968) concluded that the.social functioning of her DP subjects
was superior to that of her HP subjects, both Stuckless and Birch (1966)
and Vernon'and Koh (1970) reported no significant differences. in the
personality adjustment of students who had used manual communication be-
fore attending school'and students who had note
Table 2 also shows that means for both the HP and DP groups are well
below those for the 113,975 subject population reported by ETS. The
deaf students are clearly at a disadvantage when compared with students
for whom English is a foreign language, and this disadvantage is greater
for deaf children of hearing parents than for deaf children of deaf
parents.
Comparisons of the HP and DP groups' performance on the two SAT sub-
tests are shown in Table 3. The DP group scored significantly higher
than the HP group on both the Paragraph Meaning (PM) and Language (L)
subtests. These results together with those in Table 2 amplify earlier
findings.by Meadow (1968) who reported significantly superior performance
by DP subjects over HP subjects on SAT reading and arithmetic subscores.
Point biserial correlations were calculated for the binary parentage
variable, which was arbitrarily assigned the value 0 for deaf parents and
1 for hearing parents, with the English Structure (ES), Vocabulary (V),
Reading Comprehension (RC), and Writing Ability (WA) TOEFL subtest scores,
with total TOEFL score (T), with the Paragraph Meaning (PM) and Language
9
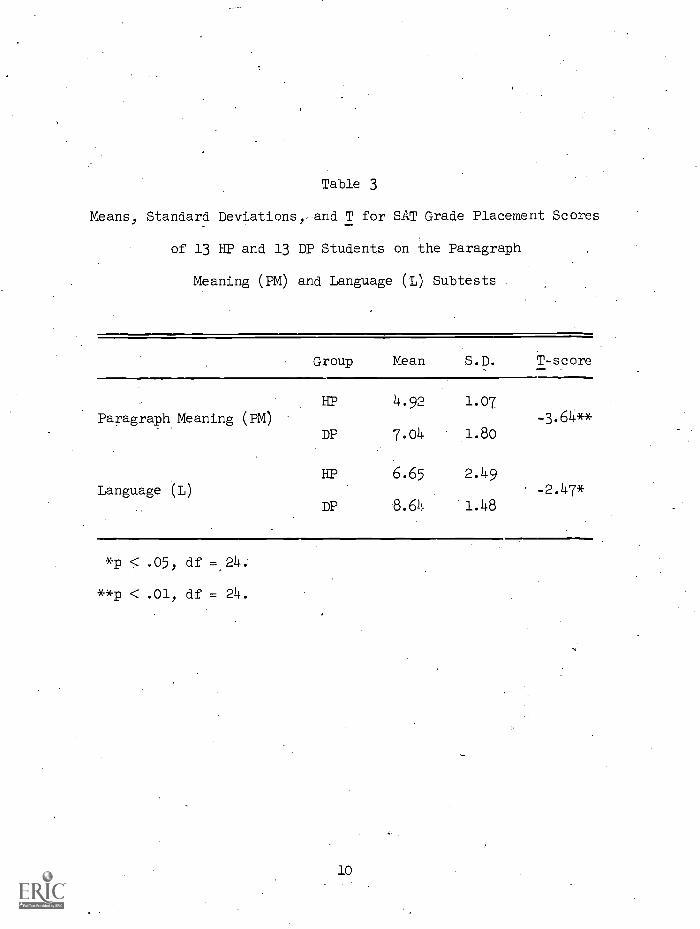
Table 3
Means, Standard Deviations, and T for SAT Grade Placement Scores
of 13 HP and 13 DP Students on the Paragraph
Meaning (PM) and Language (L) Subtests
Group Mean S.D. T-score
HP 4.92 1.07
Paragraph Meaning (PM) -3.64**DP 7.04 1.80
HP 6.65 2.49Language (L) -2.47*
DP 8.64 1.48
4q) < .05, df = 24.
**p < .01, df = 24.
10
(L) SAT subtest scores, and with age, Weschler Intelligence Scale for
Children Performance, IQ, and average hearing loss (HL) in the better
ear. These correlations are reported in Table 4. As might be expected
from the significant difference in age reported for the HP and DP groups
ih Table 1, age correlates significantly with the parentage variable.
This correlation may reflect school policy. Students often continue at
the school until they qualify for admission to college or they reach a
maximum age. Students, such as the HP students who experience diffi-
culties with English, are likely to remain at the school longer. Corre-
lation of parentage with IQ and hearing loss is effectively zero as we
might expect it to be.
An interesting aspect of the Table 4 data obtains from the negative
correlations of the parentage variable with the TOEFL and SAT scores.
The correlations are negative because we assigned a parentage value of
0 to the DP group and 1 to the HP group, Lut the magnitudes of the cor-
relations are notable. It is significant that the parentage variable
accounts for over 53% of the total TOEFL score variance, and that it
even accounts for 15% of the RC subtest-score variance. The superior
performance of the DP students over the HP students reported in Table 2
is corroborated by the Table 4 correlations. The data in Table 4 are
useful because they provide numerical estimates of the importance of the
parentage variable in accounting for TOEFL performance.
Table 5 continues the correlational analyses. These data constitute
a matrix of simple intercorrelations for the TOEFL subtests, total TOEFL
score (T), age, IQ, hearing loss (a), and a 0,1 variable for sex of the
subject. Zero was arbitrarily assigned to females and 1 to males. Each
entry in the table comprises a pair of numbers--the upper number is the
11
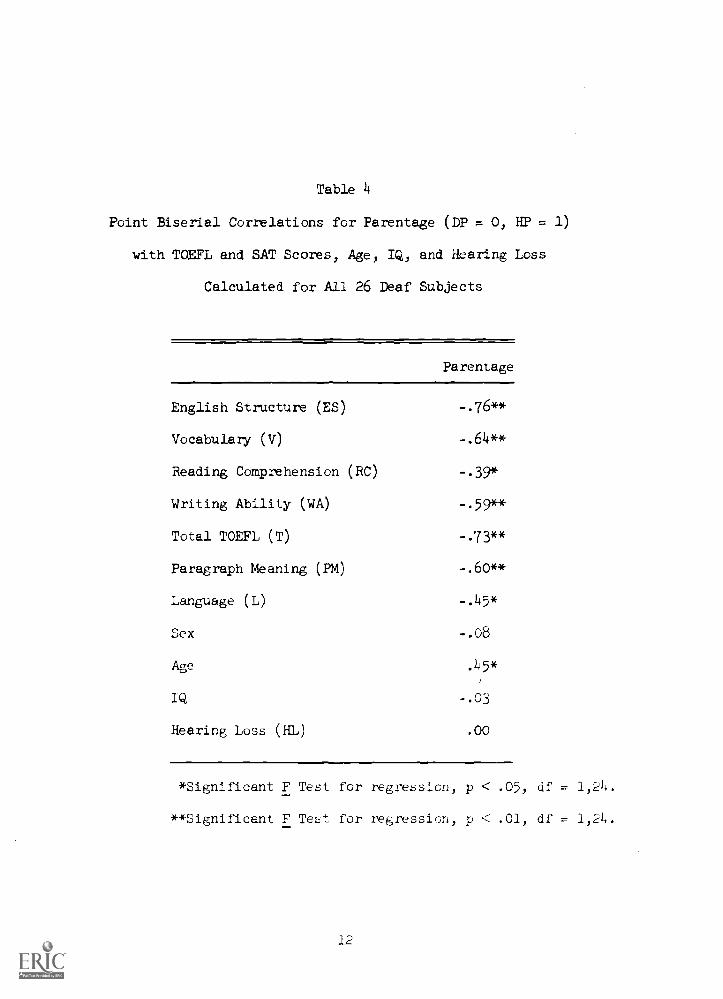
Table 4
Point Biserial Correlations for Parentage (DP = 0, HP = 1)
with TOEFL and SAT Scores, Age, IQ, and Hearing Loss
Calculated for All 26 Deaf Subjects
Parentage
English Structure (ES) -.76**
Vocabulary (V) -.64**
Reading Comprehension (RC) -.39*
Writing Ability (WA) _.59**
Total TOEFL (T) _.73**
Paragraph Meaning (PM) -.60 **
Language (L) -.45*
Sex -.08
Age .45*
IQ -.03
Hearing Loss (HL) .00
*Significant F Test for regression, p < .05, df = 1,21.
**Significant F Test for regression, p < .01, df =
12
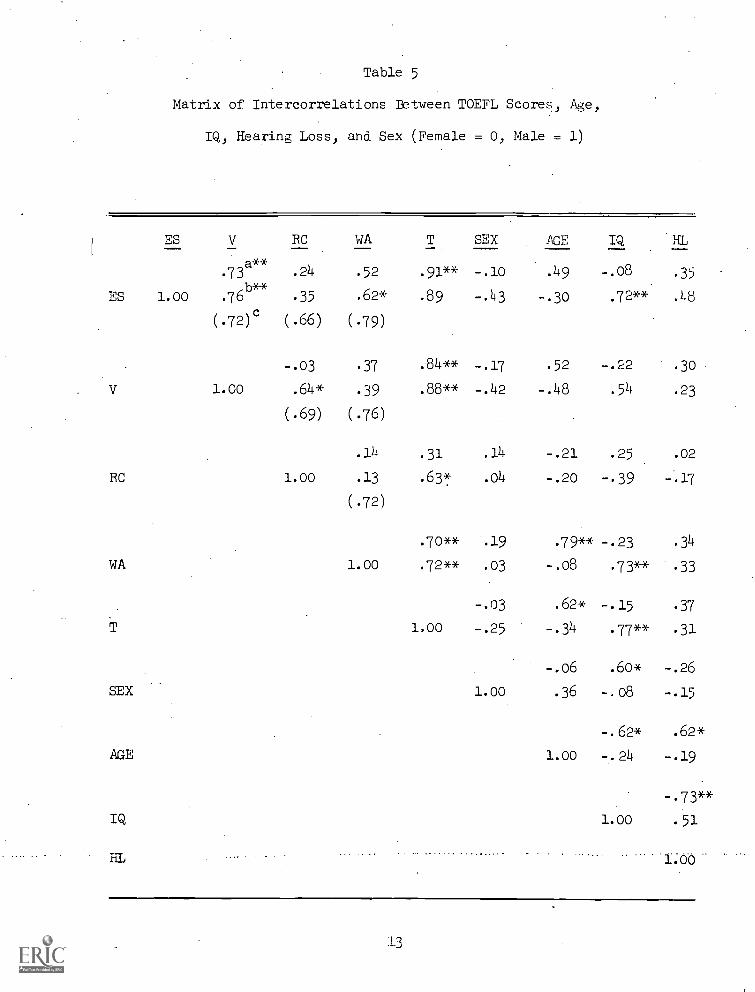
Table 5
Matrix of Intercorrelations Between TOEFL Scores, Age,
IQ, Hearing Loss, and Sex (Female = 0, Male = 1)
ES
ES 1.00
V
RC
WA
SEX
AGE
IQ
V RC
.73a** .24
.76/3** 35
(.72)c (.66)
-.03
1.00 .64*
(.69)
1.00
WA
.52
.62*
(.79)
.37
.39
(.76)
.14
.13
(.72)
1.00
T
.91**
.89
.84**
.88**
.31
.63*
.70**
.72**
1.00
SEX ACE IQ
-.08
.72**
-.22
.54
.25
-.39
-.23
.73**
-.15
.77**
.60*
-.08
-.62*
-.24
1.00
HL
.35
.48
.30
.23
.02
-.17
.34
.33
.37
.31
-.26
-.15
.62*
-.19
.51
-.10
-.43
-.17
-.42
.14
.04
.19
.03
-.03
-.25
1.00
.49
-.3o
.52
-.48
-.21
-.20
.79**
-.08
.62*
-.34
-.06
.36
1.00
1.00

Table 5 (cont!d)
aUpper entries are for the 13 HP subjects.
bSecond entries are for the 13 DP subjects.
cLower entries in parentheses are for foreign students and are
taken from the TOEFL manual (Test of English, 1970, p. 4).
*Significant F Test for regression, p < .05, df = 1,11.
**Significant F Test for regression, p < .01, df = 1,11.
11
.........
correlation obtained within the HP group and the lower number is the
correlation obtained within the DP group. There are additional entries
in parentheses for the subtest introorrelations; these are the corre-
lations reported by the TOEFL manual for hearing subjects (Test of
English, 1970, p. 14).
In general, the intercorrelation among the TOEFL subtests indicate
that they measured distinct abilities. One possible exception to this
rile is the_subtest pair composed of the English Structure (ES) and the
Vocabulary (V) subtests. Correlations between these two subtests were
fairly high and to some extent they may have measured the same abilities
in the two groups of deaf subjects.
Correlations with the sex variable obtained from the HP group are
nearly all small. it seems safe to.conclude that the subjects' sex did
not account for any significant portion of the TOEFL score variance.
The two negative correlations for age and IQ are indicative of the
school practice of releasing students when they are ready for college,
Older students in the HP group scored lower on the IQ measure and exper-
ienced greater hearing loss than did younger students, but there are
fairly high positive correlations for the HP students between age and
the WA and total TOEFL scores. If we assume that age reflects how long
the students have been in school, the simplest explanation for these
data is that the school is doing the students considerable, measurable
good. The DP students meet criteria for college admission sooner and
the effect of the extra schooling is not observable in their data,. . ....... _
The extra schooling effect in the HP group probably explains the
low correlations observed in this group for IQ-subtest comparisons.
15

The fairly high negative correlation of IQ with hearing loss was expected
and has been reported by other investigators. The correlations for the
DP groUp with IQ are another matter however. Fairly high.positive cor-
relations were observed in this group for IQ with ES, WA, and total TOEFL
scores. The implication of these data is probably that the extra
schooling is not as important a variable for the DP group's TOEFL per-
formance as it is for the performance of the HP group.
The technique of stepwise multiple regression, assuming intrinsically _
linear relationships between.dependentand.independent variables, is also
useful in determining how the variables-of sex, age, IQ, hearing loss,
and parentage are related to TOEFL scores. The basic model for the
multiple regressions used in this study is the. following:
E(Si) = a0 al SEXi a2 AGE1 a3 IQi. HLi a5 Pi
wheredenotes'aTOEFLscore,andthea.(i = 0,...,5) are parameters
of the model. In stepwise regression the order in which independent
variables are entered into the model is'of interest because it can in-
dicate the relative' importance of the independent variables. Results
from the stepwise multiple regressions performed in this investigation
are reported in Table 6. Multiple correlation coefficients and inde-
pendent variables are reported for each step in the five regressions
performed--one .regression for each subtest plus one for total TOEFL
score. The parentage variable 'is represented. by P.
As might be .expected, the parentage (P) variable was clearly the
most important of the five independent variable's- 1h accounting for
variance in the dependent variable in all five regressions. It was the
16
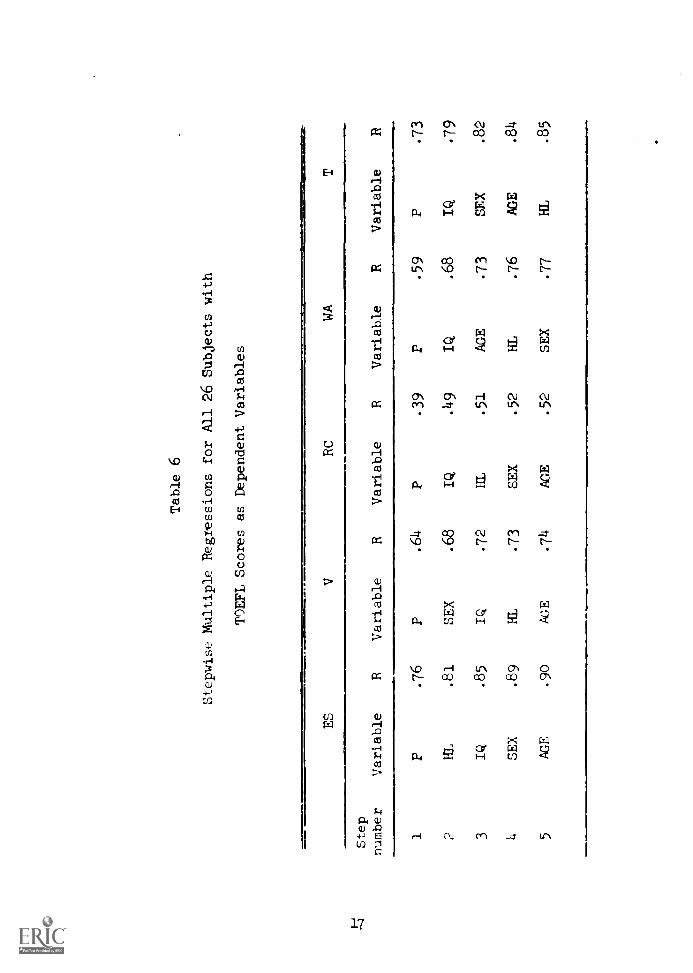
Table 6
Stepwise Multiple Regressions for All 26 Subjects with
TOEFL Scores as Dependent Variables
ES
VRC
WA
-4
Step
number
Variable
RVariable
RVariable
RVariable
RVariable
R
1P
.76
P.64
P.39
P.59
P.73
2H
L.81
SEX
.68
IQ
.49
IQ
.68
IQ
.79
3IQ
.85
IQ
.72
HL
.51
AGE
.73
SEX
.82
4SEX
.89
HL
.73
SEX
.52
HL
.76
AGE
.84
5AGE
.90
AGE
.74
AGE
.52
SEX
.77
HL
.85

first variable entered in every case and by itself accounted for 15% to
58% of the variance in the dependent variable. Also significant was IQ
which was the second variable entered in the regressions using RC, WA,
and total scores as the dependent variables and the third variable
entered into the regressions onto ES and V subtest scores. Beyond the
significance of these two variables, there seems to be little systematic
information to be gained from these multiple regressions. In general,
they are consistent with the results reported in Tables 4 and 5.
A final aspect of the multiple regressions worth noting is that in
all five regressions, when the residuals were plotted against the ob-
served values for the dependent variable, an obvious linear effect
occurred. Such scatter plots should be roughly horizontal; ours were
not, and clearly indicated that our models overestimate large values of
the dependent variable and underestimate small values of the dependent
variable. Evidently, an important independent variable was missing
from these data.
One major hypothesis for this investigation was that deaf children
of deaf parents, as users of ASL and as possessors of a native language
in the sense of a shared code, should Gut-perform deaf children of hearing
parents on any test involving language skills in general. Ttris hypothesis
was supported by the preceding data which showed significantly :-,uperior
performance by DP subjects on both SAT subtests and on three of the four
TOEFL subtests. Further, tnese data demonstrated the primary inlportance
of the parentage variable in regression models of the subject:-' test
p2rformance.
18

The second major hypothesis was that the item-by-item performance
by DP subjects on the TOEFL should resemble the performance of hearing,'
foreign students for whom. English is a second language more than the
performance by HP subjects. Two analyses in support of this second
hypothesis were undertaken. First a comparison based on the number of
correct answers to each item; and second, a comparison based on the most
likely wrong answer to each problem, One analysis was undertaken for
each of the four TOEFL subtests used in this study, and within each
analysis four groups of subjects were considered--a standard group (S)
of 495 foreign students for whom item analysis results were available,
26 subjects (C) comprising all the deaf subjects used in this study, the
13 deaf children of hearing parents (11P), and the.13 deaf children of
deaf parents (DP).
The correlations from the correct answer analysis are given in Table
7. The model for these regressions is of the form
E(Si) = ao Gi
wl-le! Si is the number of correct answers obtained on item i by the 495
member S group, Gi is the number of correct answers obtained on item i
by members of the group being considered (C, HP, or DP), and the ai
(i = 0,1) are parameters of the model.
The correlations from the wrong-answer analysis are given in Table
8. The model for these regressions is of the form
E(Si) = ao t al Gi
where S. is the number of answers made by the 495 subject group on the
wrong answer choice to item i that attracted the greatest number of

Table 7
Intercorrelations for Item-by-itemNumber of Correct Answers
Scored
by 495 Foreign Students
(S), all 26 Deaf Subjects
(C), the 13 HP
Subjects, and the 13 DP Subjects on
the Four TOEFL Subtests
aES
bV
RCc
WAd
SC
HP
DP
SC
HP
DP
SC
HP
DP
SC
HP
DP
S1.00
C
Ire
DP
.66*
1.00
.44*
--
1.00
.68*
--
.53*
1.00
S1.00
C
HP DP
.66*
1.00
.53*
--
1.00
.65*
--
.65*
1.00
S1.00
C
HP DP
.25
1.00
.11
--
1.00
.29
.51*
1.00
S1.00
C HP
DP
.62*
1.00
.50*
--
1.00
.61*
.581
1.00
*Significant F Test for regression
(p < .01).
adf = 1,68
bdf =
1,58
cdf.
.1,28
ddf --
1,58
responses, Gi is the number of wrong answers attracted by the choice in-
dicated in the S. group for item i by the group under consideration (C,
HP, or DP), and the txi 0,1) are parameters of the model.
If the second hypothesis is true, then item correlations of the S
group with the DP group should be larger than the correlations of the S
group with the HP group. This result is evident in Table 8 as well as
in Table 7, and it seems reasonable to conclude that the item-by-item
performance of the DP group more closely resembles the performance of
the hearing S group than does the HP group. The implication is that
English in some sense, is more of a second language for the DP group
than it is for the HP group.
On first glance, then, the correct-answer and most likely wrong-
anSwer correlations support the second hypothesis. There are, however,
some ambiguous results in these correlations. This hypothesis would
predict higher correlations between the S group and the.DP group than
between the DP group and the.HP group. This result is evident in the
correlation matrices for the ES and WA subtests in both Tables 7 and 8,
but it is not evident.in the correlation matrices for the V and RC sub-
tests. Certainly, the opposite is the case for the RC subtest. Per-
formance by both groups of deaf subjects is essentially random with
respect to the standard group of hearing, foreign students and it is
significantly similar for the HP and DP groups. .Evidently the RC sub-
test measured, to some extent, the same thing in the two groups of deaf
subjects, and it measured something quite different in the standard group
of hearing subjects.
21

j
Table 8
InterCorrelations for Item-by-itet Number of Responses to the Most
8'
Likely Wrong Answer Made by 495 Foreign Students (S), All 26
Deaf Subjects (C), the 13 HP Subjects; and the 13 DP
Subjects on the Four TOEFL Subtests
ESa
Vb
RCc
CAd
SC
HP
DP
SC
HP
DP
SC
HP
DP
SC
HP
DP
S1.00
C
HP
DP
'
.36*
1.00
.10
--
1.00
.48*
.42*
1.00
S1.00
C
HP DP
.40x-
1.00
.28
--
1.00
.43*
--
.67*
1.00
S1.00
C
HP
DP
-.04
1.00
.01
--
1.00
-.09
--
.48*
1.00
S1.00
C
HP
DP
.32
1.00
.12
--
1.00
.40v
--
.31
1.00
*Significant F Test for regression (p < .01).
adf
1,68
bdf=
1,58
.
cdf = 1,28
ddf = 1,58

Because deaf students are poorer readers thah are hearing students
of comparable ages (Furth, 1966) and because the HC subtest was designed
to measure reading ability ranging from that of college undergraduates
to doctoral students, it probably has different validity for deaf and
hearing students. The deaf student's knowledge of the world is limited
by his reading deficit and he may lack the necessary experience to cope
with difficult reading passages. Less difficult passages may reveal more
similarities between deaf and foreign students than the-BC subtest did.
A further investigation seemed appropriate for the correct- answer
and most likely wrong-answer analyses. Where the F Test for regression
was significant, it appeared reasonable to examine the residuals and
identify items that. were significantly easier or significantly harder
for the S group than the HP group, for the S group than for the DP group,
and for the HP group than for the DP group. Although a number of appro-
priate items were identified, no linguistically reasonable commonalities
or distinctive features among the items were found. For every reasonable
example there appeared an equal and opposite counterexample. The major
impression gained from this effort, aside from the extreme complexity of
it; was that the foreign students seemed more facile with what could be
called 'literary' English, and that the deaf students appeared more',
facile with text that resembled 'spoken' English.
The third major hypothesis implied that performance3by DP subjects
on the TOEFL and SAT subtests should correlate more poorly than should
performances by HP subjects on the same tests. These correlations are
presented in Table 9. The hypothesis is well supported by corieitiOris
between the TOEFL and Language test scores. With the exception of the
23
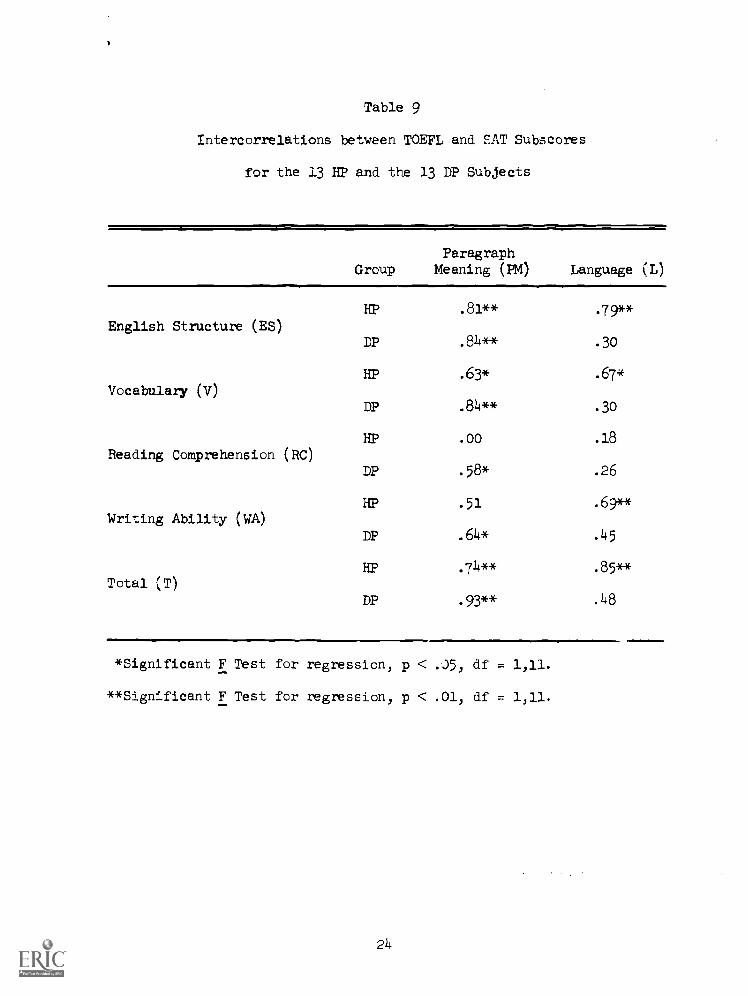
Table 9
Intercorrelations between TOEFL and SAT Subscores
for the 13 HP and the 13 DP Subjects
GroupParagraph
Meaning (PM) Language (L)
HP .81** .79"English Structure (ES)
DP .84** .30
HP .63* .67*
Vocabulary (V)DP .84** .30
HP .00 .18
Reading Comprehension (RC)DP .58* .26
HP .51 .69**Writing Ability (WA)
DP .64* .45
HP .74** .85**Total (T)
DP .93** .48
*Significant F Test for regression, p < .J5, df = 1,11.
**Significant F Test for regression, p < .01, df = 1,11.
21+

RC subtest in which both correlations were essentially zero, the cor-
relations of the HP subjects' Language scores with TOEFL scores were
much larger than were similar correlations for the DP subjects' scores.
This result is not evident, however, in the correlations of TOEFL with
Paragraph Meaning scores. In every case these correlations are higher
for the DP subjects than for the HP subjects. With respect to the third
hypothesis, then, the results are mixed. The SAT Language subtest ap-
peared to measure something different among the DP subjects than the
TOEFL did, and it appeared to measure the same thing among the-HP subjects
as the TOEFL did. The Paragraph Meaning subtest appeared to measure the
same abilities among both the DP 'and HP subjects as did the TOEFL.
Conclusions
The DP group was clearly superior to the HP group on three of the
four TOEFL subtests and on the two SAT subtests, despite the advantage
of age and extra schooling in the HP group. The parentage variable
accounted for 53% of the variance in total test scores, and the indicated
importance of parentage was corroborated by stepwise multiple regression
which entered it first in all the multiple regressions performed in the
study.
Item-by-item comparisons within the TOEFL subtests for number of
responses-to the correct-answer choice and to the most likely wrong-
answer choice in a standardization group of hearing, foreign students
showed the DP group performance to be more like that of the standard-
ization group than was the performance of the HP group, For the ES and
WA subtests, these comparisons also showed that the performance of the
DP group resembled the performance of the standardization group more
25

than it resembled the performance of the HP. group; this result was not
evident in the comparisons for the V and. RC subtexts. For that matter,
the RC subtest appeared to measure something quite different among the
standardization group than it did among the deaf subjects.
An effort to identify linguistically reasonable commonalities or
distinctive features among items that were significantly harder or
significantly easier for the deaf subjects than for the hearing subjects
proved futile.
The DP subjects' scores on the Language subtest of the SAT were
poorly correlated with their TOEFL scores, but the EP subjects' scores
on the Language subtest were fairly well correlated with their TOEFL
scores. This result indicates that standard tests of English skills
measure different abilities among DP subjects than among HP subjects who
presumably are not as likely as DP subjects to be learning English as a
second language. However, correlations of the Paragraph Meaning SAT
subtest scores with the TOEFL scores were all fairly high and failed to
discriminate between DP and HP subjects.
The results of this study suggest, that deaf students learn English
as a second language. The question remains open, however,.and more
sensitive measures must be devised to provide more conclusive results.
The significantly better performance by the DP subjects on the TOEFL may
be related to their early. competence in ASL. If this is true, hearing
parents of deaf children should learn sign language and use it to com-
municate with their deaf children. Studies of bilingualism by'Lambert
(1972) have shown no adverse effects in second-language learning and
have shown numerous benefits. Delaying first-language learning until
26
school age appears to have a permanent negative effect cn
language capabilities (Lenneberg, 1967). Thus, even though the language
learned by deaf children of hearing parents using oral means is English,
very little English may be learned. A conscientious effort to teach
deaf children ASL as a first language may be far more effective in pro-
ducing later facility with language tasks.
27
References
Angoff, W., & Sharon, A. A comparison of scores earned on the TOEFL by
native American college students and foreign applicants to U. S.
colleges. TESOL.QUarterly 1971, 5(2), 129-136..
Bonvillian, J., & Charrow, V. Psycholinguistic implications of deafness:
A review. Technical Report No. 188, Institute for-Mathematical
Studies in the Social Sciences, Stanford University, 1972.
Buros, O. N. The seventh mental measurements yearbook. Vol. I.
Highland Park, N. J.: Gryphon Press, 1972.
Dunagan, W. L. A comparison of written language skills of deaf children
and normal-hearing children who have achieved a similar reading
level. Unpublished master's thesis, University of Tennessee, 1969.
Educational Testing Service. Test of English as a foreign language:
Interpretive information. Princeton, N. J.: Author, 1970.
Fent, L. J., Jr. Some preliminary observations on the grammar of Ameslan
(American Sign Language). Unpublished paper presented at the
California School for the Deaf, Berkeley, California, 1972.
Furth, H. G. Research with the deaf: Implications for language and
cognition. Psychological Bulletin, 1964, 62, 145-164.
Furth H. G. A comparison of reading test norms of deaf and hearing
children.. American Annals of the Deaf, 1966, 111, 461-462.
Goetzinger, C. P., & Rousey, C. L. Educational achievement of deaf
children. American Annals of the Deaf, 1959, 104, 221-231.
Kelley, T. L., Madden, R., Gardner, E. G., & Rudman, H. C. Stanford
Achievement Test: Directions for administering. New York: Harcourt
Brace Jovanovich, 1964.
28

Lambert, W. E. Language, psychology and culture. Stanford: :..,.ford
University Press, 1972.
Lenneberg, E. H. Biological foundations _f language. New York: Wiley,
1967.
Marshall, W. J. A., & Quigley, S. P. Quantitative and qualitative
analysis of syntactic structure in the written language cf hearing
impaired students. Institute for Research on Exceptional Children)
University of Illinois, 1970.
McCall, E. A. A generative grammar of sign. Unpublished master's thesis,
University of Iowa, 1965.
Meadow, K. P. Early manual communication in relation to the deaf child's
intellectual, social, and communicative functioning. American
Annals of the Deaf, 1968, 122, 29-41.
Miller, J. Academic achievement. The Volta Review, 1958, 60, 302-304.
Mindel, E. D., & Vernon, M. They grow in silence. Silver Spring,
Maryland: National Assciation of the Deaf, 1971.
Moores, D. Psycholinguistics and deafne::s. American Annals of the Deaf,
1970, 115, 37-48.
Stokoe) W. C., Jr. Sign language structure: An (.;utline cf the visual
communication systems of the American deaf. Studies in LinguicticL,
Occasional Papers 8, 1960.
Stokoe, W. C., Jr. The study of sign language. Silver Spring, Maryland:
National Association of the Deaf, 1971.
Stuckless, E. R., & Birch, J. W. The influence of early manual comnuni-
cation in relation to the deaf childt6 intellectual, social, and
communicative functioning. American Annals of the Deaf, 1966,
111) 452-462.29
Stuckless, E. R., & Marks, C. H. Assessment of the written language of
deaf students. Cooperative Research Project 2544, 1966, U. S.
Office of Education, Departure'.'. cf Health, Education, and Welfare,
Contract 0E-5-10-123.
Templin, M. C. Vocabulary problems of the deaf child. International
Audiology, 1966, 2, 349.354
Templin, M. C. Methodological variations in language research with deaf
subjects. Proceedings of the International Conference of Oral
Education of the Deaf, 1967, 2. Pp. 1428-1440.
Vernon, M. Relationship of language to the thinking process. Archives
of General Psychiatry, 1967, 16, 325-333.
Vernon, M. Fifty years of research on the intelligence of deaf and hard-
of-hearing children: A review of literature and discussion of
implications. Journal of Rehabilitation of the Deaf, 1968, 1, 1-12.
Vernon, M., & Koh, S. D. Early manual communication and deaf children's
achievement. American Annals of the Deaf, 1970, 112, 527-536.
Williams, J. Bilingual experiences of a deaf child. Unpublished paper,
Gallaudet College, 1968.
30
Fcotnctes
s research was supported by the Bureau of Handicapped, U. S. Office
of Education, through Grant 0EG-0-70-4797(607). V. R. Charrow was also
supported by a Canada Council Doctoral Fellowship.
2The authors wish to express their gratitude to Educational Testing
Service, to the administrator:: and teachers of the California School
for the Deaf, Berkeley, California, and to John Bonvillian, Robert
Charrow, and Keith Nelson for providing invaluable assistance in
support of this study.
31