of compressed hydrogen
TRANSCRIPT

NASA CR- 72116
NOLTR 6 6 - 2 0 2
GPO PRICE $
CFSTl PRICE(S) $
Hard copy (HC) ($OD Microfiche (MF) . b’x
ff 653 July 65
OPACITY OF HOT, HIGHLY COMPRESSED HYDROGEN
G. T. Lalos a n d G. L. H a m m o n d
p r e p a r e d for
N A T I O N A L AERONAUTICS A N D SPACE A D M I N I S T R A T I O N
interagency Number C-80708
N
7 ID
(ACCESSION NUMBER) ( T H R U ) - a
> c (PAGES)
e
2 r (CATEGORY)
$&$A C C - ~ ~ J / L ( N A S A CR OR TMX OR AD NIJMBER)
U.S. NAVAL ORDNANCE LABORATORY

Requests for copies of this report should be referred to
National Aeronautics and Space Administration Office of Scientific and Technical Information Attention: AFSS-A Washington, D. C. 20546
NOTICE
This report was prepared as an account of Government sponsored work. Neither the United States, nor the National Aeronautics and Space Administration (NASA), nor any person acting on behalf of NASA:
A.) Makes any warranty or representation, expressed or implied, with respect to the accuracy, completeness or usefulness of the information contained in this report, or that the use of any information, apparatus, method, or process disclosed in this report may not infringe privately owned rights; or
B.) Assumes any liabilities with respect to the use of, or for damages resulting from the use of any infor- mation, apparatus, method or process disclosed in this report.
As used above, "person acting on behalf of NASA" includes any employee or contractor of NASA, or employee of such con- tractor, to the extent that such employee or contractor of NASA, or employee of such contractor prepares, disseminates,or provides gccess to, any information pursuant to his employment or contract with NASA, or his employment with such contractor.

NASA CR- 721 16 NOLTR 66-202
FINAL REPORT
OPACITY OF HOT, HIGHLY COMPRESSED HYDROGEN
G . T. Lalos and G .L . Hamrnond
prepared for
NATIONAL AERONAUTICS AND SPACE ADMINISTRATION
November 16 , 1966
Interagency Number C-80708
Techn ica I Management NASA Lewis Research Center
Cleveland, Ohio Nuclear Systems Division
R .W. Patch
NAVAL ORDNANCE LABORATORY White Oak, Maryland

ABSTRACT
The rapid gas compression technique employing a ballistic piston compressor was adapted to the study of the opacity of hydrogen at elevated pressures and temperatures. helium mixtures were compressed for short times to pressures and temperatures exceeding 2500 atmospheres and 5000°K, and the emission spectra were recorded and analyzed. The discrete line spectra were identified as due to metallic impurities, but the strong background continua could not be ascribed unequivocally to hydrogen. Computer calculations of the specie concentrations that comprise hot, highly compressed hydrogen/helium mixtures were made, and possible opacity producing mechanisms were advanced to explain the observed continua.
Hydrogen/
i

TRBLE OF CONTENTS
Sec t ion Page
i ABSTRACT . . . . . . . . . . . . . . . . . . . . LIST OF ILLUSTRATIONS . . . . . . . . . . . . .
1.0 INTRODUCTION . . . . . . . . . . . . . . . . . . 2.0 BALLISTIC PISTON COMPRESSOR EXPERIMENTS . . . .
2.1 Basic Technique . . . . . . . . . . . . . . 2.2 Equilibrium Concentrations . . . . . . . . 2.3 Experimental Techniques . . . . . . . . . .
2.3.1 Gas Sample Production . . . . . . . 2.3.2 Emission Experiments . . . . . . . . 2.3.3 Absorption Experiments . . . . . . .
3.0 EXPERIMENTAL RESULTS . . . . . . . . . . . . . . 3.1 Pure Hydrogen Experiments . . . . . . . . . 3.2 Hydrogen/Helium Mixture Experiments . . . .
3.2.1 Emission Experiments with
3.2.2 Absorption Experiments with Mixtures . . . . . . . . . . . . . . Mixtures . . . . . . . . . . . . . .
4.0 DISCUSSION AND CONCLUSIONS . . . . . . . . . . . REFERENCES . . . . . . . . . . . . . . . . . . . FIGURES . . . . . . . . . . . . . . . . . . . .
iii
1
2
2 5 7
7 10 12
14
1 4 15
16
18
21
25
27
ii

LIST OF ILLUSTRATIONS
Figure
1
2
3
4
5
9
10
11
12
13
14
15
16
17
18
Ballistic Piston Compressor . . . . . . . . . . . . 27 Ballistic Piston Compressor (Reservoir End) . . . . 28 Ballistic Piston Compressor (High Pressure End) . . . . . . . . . . . . . . . . . . . . . . . 29
Details of Side Window Test Section . . . . . . . . 30 Oscilloscope Record of Test Gas Pressure versus Time . . . . . . . . . . . . . . . . . . . . 31
Temperature versus Neutral Particle Density . . . . 32 Particle Density versus Pressure for Pure H2 . . . 33 Particle Density versus Mixture Ratio f o r P = 3000 Atmospheres . . . . . . . . . . . . . . . 34 Particle Density versus Pressure f o r 10/90
Piston with Seals and High Temperature Resistant Head . . . . . . . . . . . . . . . . . . 36
€$/He Mixture Ratio . . . . . . . . . . . . . . . . 35
Telescopic Minimum Separation Gage . . . . . . . . 37 Optics f o r Emission Experiments . . . . . . . . . . 38 Optics for Absorption Experiments . . . . . . . . . 39
Time Resolved Spectra f o r Pure Helium and
Densitometer Tracings of the l O / g O %/He
f o r lo$ Hydrogen Mixture at 6 0 0 0 " ~ . . . . . . . . 40 Mixture Ratio Spectrogram . . . . . . . . . . . . . 41 Continua Intensities versus Wavelength . . . . . . 46 Oscilloscope Records for Line Opacity Measurements . . . . . . . . . . . . . . . . . . . 47 Oscilloscope Records f o r Continuum Opacity Measurements . . . . . . . . . . . . . . . . . . . 48
iii

1.0 INTRODUCTION
An order of magnitude increase i n s p e c i f i c impulse i s required f o r f u t u r e space missions. One advanced concept f o r achieving th i s i s the gaseous core nuclear rocket engine using f i s s ion ing uranium plasma as the energy source and hydrogen gas as the propel lant . The transparency of hydrogen t o r ad ia t ion from the core cons t i t u t e s a c r i t i c a l design problem. The a b i l i t y t o impart opacity t o the hydrogen i s necessary both from the standpoint of keeping r a d i a t i v e heat t r a n s f e r t o the engine walls t o a minimum, and f o r f u r t h e r heat ing of t he hydrogen gas before it e x i t s the nozzle. Tempera- t u r e s upward of 5000°K are general ly regarded as necessary t o produce s u f f i c i e n t concentrations of H, H-, and free e l ec t rons t o r e s u l t i n u se fu l l e v e l s of opacity. An add i t iona l operating requirement i s a working pressure of as much as 1000 atmospheres t o insure core c r i t i c a l i t y . T h i s high working pressure r e s u l t s i n high p a r t i c l e d e n s i t i e s and consequently i n an increase i n opacity.
Conventional methods of experimentally determining gas opac- i t i e s , i.e., methods employing furnaces, flames, and a r c s (high temperatures, low pressures) and s t a t i c gas compression (low temperature, high pressure) are inadequate for m a k i n g the required measurements. Recourse must be made t o a rap id gas compression technique that produces simultaneous values of gas temperature and pressure of over 5000°K and 1000 atmospheres (Reference 1). technique, cu r ren t ly being employed i n s p e c t r a l l i n e shape s tud ie s (References 2, and 3), u t i l i z e s a f r e e , t i g h t - f i t t i n g p i s ton i n a closed-end tube as the gas container. F i r ing the free p i s ton toward the end-plug compresses the trapped gas momentarily and allows high gas pressures and temperatures t o be a t t a i n e d f o r t i m e s of about
T h i s
1

=$ millisecond. enough to permit measurements of the physical state of the gas to be made, but are not of sufficient duration to result in severe damage to the apparatus. By suitably choosing the experimental parameters the rapidity of the compression process can be made suf- ficiently high to result in an essentially adiabatic compression of the gas while not exceeding the compression rate that produces shock waves.
The high pressures and temperatures persist long
W s report describes the adaption of the rapid gas compression technique to the study of gas opacities at high pressures and tem- peratures. The approach was to Increase the peak pressures and temperatures of pure hydrogen and hydrogedhelium mixtures progress- ively in the ballistic piston compressor until measureable hydrogen opacity was attained.
2.0 BALLISTIC PISTON COMPRESSOR EXPERIMENTS
2.1 Basic Technique
The Ballistic Piston Compressor used in this investigation is shown in Figure 1. It consists of a high pressure gas reservoir containing the piston driver gas, a piston release section, a 5 centimeter bore diameter tube 4 meters long, and a Ugh pressure section. The basic apparatus is designed for a maximum pressure of 10,000 atmospheres. A cross-sectional view of the reservoir and piston release section is shown in Figure 2, and of the high pres- sure section in Figure 3. figure can be replaced with a piezoelectric pressure gage for pressure-time measurements. high pressure section designed with diametrically opposite windows for studies requiring attenuation of a test beam as in the present
The radiation viewing window in this
A cross-sectional view (end-on) of a
~
studies is shown in Figure 4. When this high pressure section IS
2
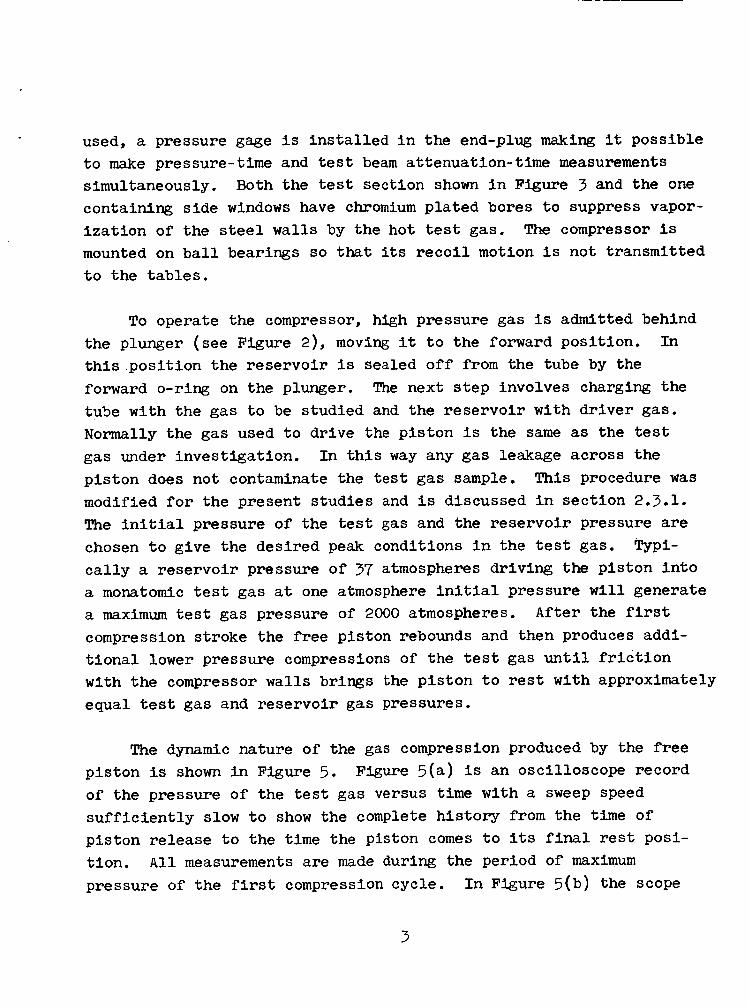
used, a pressure gage is installed in the end-plug making it possible t o make pressure-time and test beam attenuation-time measurements simultaneously. Both the test section shown in Figure 3 and the one containing side windows have chromium plated bores to suppress vapor- ization of the steel walls by the hot test gas. The compressor is mounted on ball bearings so that its recoil motion is not transmitted t o the tables.
To operate the compressor, high pressure gas is admitted behind the plunger (see Figure 2), moving it t o the forward position. this position the reservoir is sealed off from the tube by the forward O-ring on the plunger. The next step involves charging the tu5e with the gas t o be studied and the reservoir with driver gas. Normally the gas used to drive the piston is the same as the test gas under investigation. In this way any gas leakage across the piston does not contaminate the test gas sample. modified for the present studies and is discussed in section 2.3.1. The initial pressure of the test gas and the reservoir pressure are chosen to give the desired peak conditions in the test gas. cally a reservoir pressure of 37 atmospheres driving the piston into a monatomic test gas at one atmosphere initial pressure will generate a maximum test gas pressure of 2000 atmospheres. After the first compression stroke the free piston rebounds and then produces addi- tional lower pressure compressions of the test gas until friction with the compressor walls brings the piston to rest with approximately equal test gas and reservoir gas pressures.
In
This procedure was
Typi-
The dynamic nature of the gas compression produced by the free piston is shown in Figure 5. Figure 5(a) is an oscilloscope record of the pressure of the test gas versus time with a sweep speed sufficiently slow t o show the complete history from the time of piston release to the time the piston comes t o its final rest posi- tion. All measurements are made during the period of maximum pressure of the first compression cycle. In Figure 5(b) the scope
3

sweep speed was increased t o show the pressure profile of the first two compression strokes in more detail. Pressure pulse half-widths are typically a few milliseconds and can range from 4 to 10 milli- seconds by proper selection of piston mass and reservoir pressure. A further increase in scope sweep speed was made in Figure 5(c). The multiple traces on this record show the pressure-time history of the first compression cycle. A voltage pulse indicating the opening of a spectrograph slit by a high-speed electromechanical shutter can also be seen. This shutter is used in emission studies t o allow gas radiation t o enter the spectrograph only during the time interval during which the gas pressure is greater than 90% of its peak value. These times are typically 300 microseconds long.
A comparison of the ranges of temperature and density that can be produced by the ballistic piston compressor and by the more con- ventional statZc compression and shock tube techniques is shown in Figure 6. Although the ballistic piston compressor and the shock tube both rely on rapid gas compression to overcome the limitations imposed by the melting point of the container the former is char- acterized by high neutral particle densities, whereas the latter is generally used where high charged particle densities are important.
The isentrope that a gas follows when compressed in the ballistic piston compressor is determined by its initial pressure and tempera- ture. Isentropes corresponding t o initial gas pressures of $, 1 and 2 atmospheres and an initial temperature of 2 9 8 ' ~ are shown. Low initial pressures produce conditions approaching those generated by the shock tube, whereas high initial pressures result in conditions approaching those generated by static compression. Intermediate initial gas pressures such as the 1 atmosphere value used in this study will produce quite respectable values of neutral and charged particle density simultaneously. The computer program described in the next section was written to facilitate the computation of the number density of the various species that comprise gases and gas mixtures at elevated pressures and temperatures.
4

2.2 Equilibrium Concentrations
A computational technique for determining chemical equilibrium in complex mixtures of neutral chemical species (Reference 4) was extended to include systems involving charged particles (Reference 5). This method is based on the minimization o€ the Gibbs free energy function as opposed to the older methods which require knowledge of equilibrium constants and which expressed the abundance of certain chosen species in terms o f the abundances of other arbitrarily chosen species. The present method is applicable to all equilibrium reactions and makes possible the computation of equilibrium con centrations of neutral and charged product species of complex gas mixtures with relative ease. The basic computational scheme calculates equilibrium concentrations for any given pressure and temperature. A variation of this permits the calculation to be made as a function of pressure and energy added to the system in the form of a chemical reaction or mechanical work performed by a piston compressing a gas. A.second variation consists of calculating equi- librium along an isentrope. The basic scheme (vs P and T) and the first variation ( v s P and AE) have been programmed in Fortran N. The computer program has been named PLASMA.
Rapid compression of hydrogen gas along the NTP isentrope to progressively higher pressures will ultimately result in sufficient concentrations of dissociated and ionized species to produce opacity. Because of the low ratio of specific heats of a diatomic gas, i.e., 7 of 1.4, very high pressures must be reached before the temperature becomes sufficiently high to produce appreciable dissociation or ionization of the gas. PLASMA program calculations of specie concentration versus total gas pressure were made and are shown in Figure 7. The temperatures used in these calculations are those of an ideal non-dissociating it should be sufficiently dissociation involved. A
gas. Although admittedly an approximation, accurate in view of the low fractional pressure of 3,000 atmospheres results in

21 a €I2 concentration of 7.38 x 10 1.74 x ~ ~ ~ ~ c r n - ~ .
cm'3 and a H concentration of The free electron concentration is less than
cm- 3.
An additional shortcoming of using a pure diatomic gas ( y = 1.40) as opposed to a monatomic gas ( y = 1.67) is the much smaller minimum volumes that accompany a given pressure ratio. This effect will ultimately interfere with any measurement involving attenuation of a test beam because of the blocking of the test beam by the piston. The first problem (low temperature) is solved and the second prob- lem (low volume) is alleviated by using hydrogen/helium mixtures. Figure 8 gives the PLASMA program specie concentration results as a function of hydrogen/helium mixture ratio for a total gas pressure of 3000 atmospheres. This plot was used to determine the mixture ratio that optimized the concentration of atomic hydrogen. A 20/80 hydrogen/heliwn mixture ratio is seen to result in the optimum atomic hydrogen concentration, namely 3.5 x 1020cm-3. twenty-fold increase over the pure hydrogen case for the same maximum pressure. The He, H2, and free electron concentrations are 2.9 x 10 21 cm -3 , 5.4 x 1020cm-3, and 6.5 x 10 14 ~m'~, respectively.
Some of the experiments described in sections 2.3.2 and 2.3.3 were made using this mixture ratio. ratio was also used. This gives an increase in calculated tempera- ture of about 700°C and results in approximately the same atomic hydrogen and helium concentrations as in the 20/80 mixture ratio, but with a decrease in H2 concentration to 1.6 x 1020cm-3, and an increase in free electron concentration to 2.8 x 10 cm .
This represents a
A l O / g O hydrogen/helium mixture
15 -3
Examination of the computer results of particle density versus mixture ratio for pressures from 1000 atmospheres to 5000 atmospheres (plotted as in Figure 8) revealed a very weak dependence on pressure (and temperature) of the value of the mixture ratio for optimum atomic hydrogen concentration. The non-dissociating gas approxima- tion in the calculation of the temperature mentioned earlier thus
6

does not have a significant effect on the choice of mixture ratio. Although a more accurate temperature calculation could have been made the approximation used gives specie concentrations that are within the accuracy required for the present investigation.
Figure 9 shows Ni plotted versus total gas pressure for a lO/gO mixture ratio. densities are relatively insensitive to pressure, whereas the H and especially the free electron densities have an appreciable pressure dependence. The cross-over point, i.e., equal densities of two species, occurs at 2000 atmospheres for H2 and H.
Above 1000 atmospheres the H2 and He particle
2.3 Experimental Techniques
2.3.1 Gas Sample Production
The experimental investigations of this report were made by compressing pure hydrogen, 20/80 and lO/gO hydrogen/helium m i x - tures, and pure helium in the ballistic piston compressor assembled with the side-window high pressure section with chromium-plated bore. The initial test gas conditions were 1 atmosphere pressure and room temperature, 2 9 8 " ~ . Sixty compressor shots were made at pressures up t o 3170 atmospheres. check out the opacity measuring optics and t o evaluate various oper- ating parameters, while the remaining 20 were made to record emission and absorption spectra.
Of these approximately 40 were made t o
The regular procedure of using the same gas as test gas and piston driver gas was discarded in these experiments for safety as well as economy purposes. A large reservoir filled with high pres- sure hydrogen would constitute an unnecessary safety hazard in the mixture shots, whereas dumping all the reservoir gas each time the test gas mixture ratio was changed would be an unnecessary expense. Commercial helium of 99.99$ purity was used as the driver gas in all
7

of the experiments. I n addi t ion, two indepenb.ent gas flow systems were constructed f o r evacuating, f l u sh ing , and f i l l i n g the com- pressor with d r i v e r gas and w i t h t e s t gas. This was done i n order to eliminate any p o s s i b i l i t y of error i n the composition of the test gas due to leaky valves o r to operator e r r o r . The flow system f o r the test gas was supplied w i t h e i t h e r canmercial helium o r commercial hydrogen of 99.s pur i ty , and the system was capable of f i l l i n g the t e s t s ec t ion wi th a mixture of these two gases to an estimated accuracy of 1% i n the mixture r a t i o .
Cleaning procedures were employed before each shot, and pre- cautions were taken to prevent undue contamination of the t e s t gases. The bore of the s t e e l tube and the chromium pla ted tes t sec t ion were cleaned by drawing acetone soaked swabs through them. Other solvents occasionally used included water and methanol. Brass and bronze ab la t ion deposits were removed by soaking the tes t sec t ion bore i n w a r m chromic ac id f o r about twelve hours. Fi l ters which remove p a r t i c l e s la rger than 25 microns were i n s t a l l e d a t a l l supply tank o u t l e t s and at a l l gas i n l e t po r t s i n the compressor.
I n order t o prevent r e se rvo i r gas from leaking across the p i s t m during the compression s t roke and a l t e r i n g the tes t gas mixture r a t i o , a cup-type Teflon p i s ton s e a l was designed and i n s t a l l e d on the rear-end of the p is ton . Assembly i s made w i t h the open end of the cup seal facing the r e se rvo i r . When the r e se rvo i r gas impPnges on the r e a r o f the p i s ton the Teflon cup i s forced to expand radi- a l l y reducing the clearance with the tube bore to zero and producing an e f f e c t i v e gas seal. This s t e p accomplished i t s purpose but of course resu l ted i n a test gas sample a t the end of the compression s t roke deprived of any ga in i n mass from the r e s e r v o i r gas, but s t i l l vulnerable t o gas leakage across the p i s ton and Teflon seal and into the reservoi r during the high pressure p a r t of the compression cycle. Visual inspection of the walls of the high pressure sec t ion imme- diately a f t e r a low-temperature compressor shot revealed dust

patterns that suggested abnormally small minimum separations between the end-plug and piston. On high-temperature shots small deposits of brass ablated from the side window jackets were found on the side walls of the forward part of the piston, again indicating smaller minimum separations than expected. These observations were followed by placing a second cup-type Teflon seal on the piston just forward of the rear seal. In this case the open side of the seal faces the test gas and its sealing action is actuated as the test gas pressure begins to grow. Figure 10 shows the phosphor-bronze piston body assembled with the two cup seals and with the solid molybdenum, high- temperature resistant piston head. The outer diameter of all the components of the piston are undercut a few mils from the 1.968 inch diameter of the four parts of the piston body that bear on the 1.972 inch diameter tube walls. The diameter of the bearing surfaces of the Teflon seals is made approximately equal to the bore diameter of the tube. Results of tests with both seals installed showed that the forward seal functioned properly and increased the minimum piston/end-plug separation over the value obtained with the single rear seal. Although the performance of the piston seals appears satisfactory, some seal failures did occur on compressor shots with peak pressures over 2000 atmospheres. Some further developmental work on the seals seems desirable.
Accurate information on the m i n i m u m piston/end-plug separation is necessary in shots involving the attenuation of a test beam by the test gas. A decrease in test beam s ignal strength due to the partial blockage of the test beam by the piston at the end of the compression stroke can easily be interpreted as a sign of gas opacity. In order to guard against this happening, a telescopic minimum separation gage was designed and constructed. When in use it is installed in the end-plug in place of the pressure gage as shown in Figure 11. It consists of two concentric interference-fit tubes, the outer one imbedded in a steel plug which is mounted flush with the face of the end-plug. The inner tube is slotted
9

along i t s length and i s f r e e t o move i n t o the outer tube when s u f f i c i e n t force i s applied, i.e., by the p i s ton a t the end of the first compression s t roke. The in t e r f e rence fit i s adjusted so that the force necessary t o produce r e l a t i v e motion between the two tubes i s not s u f f i c i e n t t o a f f e c t t he b a l l i s t i c s of the pis ton, nor so loose that the inner tube continues i t s motion r e l a t i v e t o the outer tube a f t e r the p i s ton has reversed d i r e c t i o n s a t the end of the compression stroke. A s shown i n Figure 11 th ree p a i r s of tubes of the lengths indica ted give a usefu l measuring range of 46.25 m i l l i - meters down t o 5.00 m i l l i m e t e r s . A c a l i b r a t i o n of the compressor cons i s t s of measuring the minimum piston/end-plug separat ion a s a funct ion of pressure f o r a given gas mixture and p i s ton configura- t i o n . plug ca l ibra t ion . It i s removed and replaced by the pressure gage when emission o r absorpt ion s tud ie s are being made.
The telescopic gage i s used only f o r obtaining the piston/end-
Immediately i n f r o n t of t he spectrograph s l i t a high speed s h u t t e r (Reference 6) was mounted f o r time-resolved spectroscopy. This s h u t t e r cons i s t s of a s l o t t e d p l a t e dr iven quickly pas t the spectrograph s l i t i n such a way that light can e n t e r t he s l i t only during the s h o r t I n t e r v a l when the s l o t i s al igned w i t h the s l i t .
I Shu t t e r open times are cont ro l led by varying the energy s tored i n
2.3.2 Emission Experiments
I 10
Emission spectrography of pure H2, H2/He mixtures and pure He was performed w i t h the o p t i c a l setup shown i n Figure 12. Radia- t i o n emerging from the test sec t ion through the unsupported a rea of t h e fused quartz window w a s focused by quartz lenses 1 and 2 a t the s l i t of the s t igmatic Bausch and Lomb medium quartz prism spectro- graph i n such a way that the spectrograph col l imator l ens w a s f i l l ed . The f r o n t surface mirror w a s mounted on a r o t a r y table so that it could be turned 90" t o d i r e c t the r a d i a t i o n toward a monochromator f o r another type of experiment described below.

the capacitor discharge unit which activates the driving mechanism. The shutter open time is synchronized with the time of maximum pressure and temperature in the test section by triggering the capacitor discharge at a predetermined value of the voltage analog of the pressure generated by the quartz crystal pressure transducer located in the end-plug of the test section. A pulse from the trigger unit is superimposed on the pressure signal to indicate the initiation of shutter action. Further details of shutter action, calibration, and associated electronics can be found in Reference 6, and details of the pressure recording instrumentation can be found in Reference 7.
Because the compressor is free to move rearward as the piston travels forward, there is only a short period of time during which the quartz window is in alignment with the optical axis of the spectrograph. The compressor motion is monitored by a precision linear motion potentiometer whose output as a function of time is displayed on the oscilloscope along with the pressure signal. It was found that by properly prepositioning the compressor, the window will come into alignment and be relatively stationary during nearly the entire first compression cycle. A typical motion and pressure record is shown in Figure 18(a).
Spectra were recorded on Kodak 103-F emulsions which are sensi- tive from 2000 the detection range to 9000 1. order of 300 microseconds and slit widths varied from 100 to 25 microns. in a temperature regulated processor. Emulsion calibrations were performed using a step slit uniformly illuminated by carbon arc radiation for submillisecond exposure times to minimize reciprocity failure. Heterochromatic photometry was accomplished using the carbon arc as a standard light source and assuming that the anode crater of the arc radiated as a 3800"~ blackbody.
to 7000 H and on Kodak I - N emulsions which extend Typical exposure times were of the
Films were developed in Kodak D-19 for 4 minutes at 2 O o C
The arc used is
11

i d e n t i c a l t o the a r c described i n Reference 8, and National Carbon Co. through the same o p t i c a l paths as that followed by the compressed gas radiat ion.
inch type SPK anodes were used. The a r c r a d i a t i o n was passed
2 . 3 . 3 Absorption Experiments
Measurements of absorption c o e f f i c i e n t s can be made i n a r e l a t i v e l y straightforward manner by passing a beam of l i g h t through the gas sample under study. The re levant physical theory i s b r i e f l y reviewed below .
If the gas sample can be assumed t o be uniform i n temperature, densi ty , and chemical composition, w e can use Beer's L a w :
(1) I = I o e - 7 ,
where T is the dimensionless quant i ty ca l l ed o p t i c a l depth o r o p t i c a l th ickness ; Io i s the i n t e n s i t y of the test beam as it e n t e r s the gas sample, and I i s the emerging, a t tenuated i n t e n s i t y of the beam a f t e r i t has t raversed the sample. The o p t i c a l depth is o f t e n expressed as:
T = k4,
where k i s the absorpt ion coe f f i c i en t (and includes the e f f e c t of induced emission), and 4 i s the path length o r thickness of the sample. The microscopic proper t ies of the absorbing gas render 7
wavelength dependent, and, therefore , the experiment must be done monochromatically.
Figure 13 i l l u s t r a t e s the o p t i c a l scheme designed and con- s t r u c t e d f o r absorption experiments. L i g h t from the carbon a r c anode c r a t e r mentioned above i s focused a t the plane of the chopper by quartz lens L4, and i s then refocused by quartz l ens L a t the center of t he test sect ion. The beam traversing the test sec t ion i s narrow, having a maximum diameter of 5 millimeters. Quartz l ens
3
12
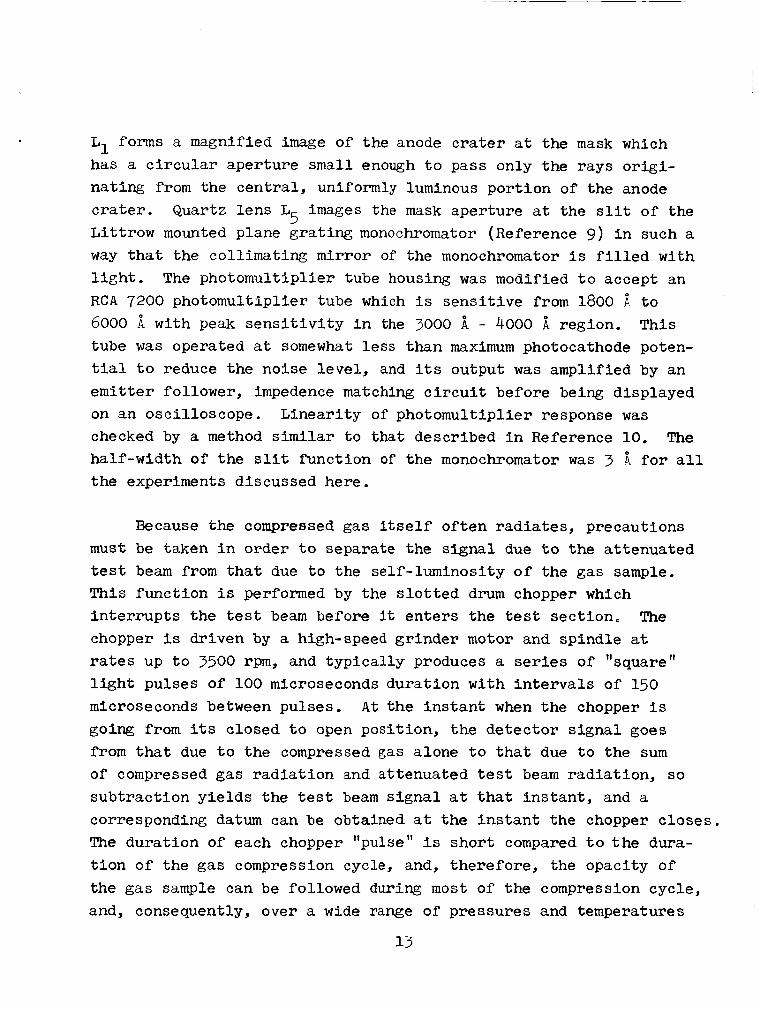
L1 forms a magnified image of the anode c r a t e r a t the mask which has a c i r c u l a r aper ture small enough t o pass only the rays o r i g i - nat ing from the cen t r a l , uniformly luminous por t ion of the anode c r a t e r . Quartz l ens L images t h e mask aper ture a t the s l i t of the L i t t r o w mounted plane grating monochromator (Reference 9 ) i n such a way that the coll imating m i r r o r of the monochromator i s f i l l e d with l i g h t . The photomultiplier tube housing was modified t o accept an RCA 7200 photomultiplier tube which i s s e n s i t i v e from 1800 d t o 6000 i w i t h peak s e n s i t i v i t y i n the 3000 tube was operated a t somewhat l e s s than maximum photocathode poten- t i a l t o reduce the noise leve l , and i t s output w a s amplified by an emi t t e r follower, impedence matching c i r c u i t before being displayed on an osci l loscope. Linear i ty of photomult ipl ier response was checked by a method similar t o t ha t described i n Reference 10. The half-width of t he s l i t funct ion of t he monochromator w a s 3 i. f o r a l l the experiments discussed here.
5
- 4000 1 region. This
Because the compressed gas itself o f t en radiates, precautions must be taken i n order t o separate the s igna l due t o the a t tenuated t e s t beam from that due t o the self- luminosi ty of the gas sample. This funct ion i s performed by t h e s l o t t e d drum chopper which i n t e r r u p t s the t e s t beam before it en te r s the test sec t ion , The chopper i s dr iven by a high-speed gr inder motor and spindle a t r a t e s up t o 3500 rpm, and typ ica l ly produces a s e r i e s of "square" l i g h t pulses of 100 microseconds dura t ion with i n t e r v a l s of 150 microseconds between pulses. A t t he i n s t a n t when the chopper i s going from i t s closed to open posi t ion, the de t ec to r s igna l goes from t h a t due t o the compressed gas alone t o t h a t due t o the sum of compressed gas r ad ia t ion and at tenuated tes t beam radia t ion , so subt rac t ion y i e l d s the t e s t beam s i g n a l a t t h a t i n s t a n t , and a corresponding datum can be obtained at the i n s t a n t the chopper c loses . The dura t ion of each chopper "pulse" i s sho r t compared to t h e dura- t i o n of the gas compression cycle, and, therefore , the opacity of the gas sample can be followed during most of the compression cycle, and, consequently, over a wide range of pressures and temperatures

during a single compressor run. However, the present spectroscopic instrumentation allows opacity measurements at only one wavelength per run.
A further refinement of the optical scheme shown in Figure 13 involves the use of the diaphragm at lens L1. beam subtends at lens L1 a larger solid angle than does the carbon arc beam. Therefore, by stopping down this lens to the point where the extreme rays of the carbon arc beam just begin t o be inter- cepted we are assured that the aperture in the mask subtends equal solid angles of both carbon arc radiation and compressed gas radiation. "he signals due t o carbon arc radiation and to gas radiation can then be directly compared. Furthermore, if the radi- ation from a standard light source, such as a blackbody or a calibrated tungsten lamp, can be passed through the same optical train as does the gas radiation, then such a calibration will permit intensities t o be measured in absolute units.
The gas radiation
3.0 EXPERIMENTAL RESULTS
3.1 Pure Hydrogen Experiments
Survey spectra were made by compressing pure H2 from an initial pressure of one atmosphere up to maximum pressures of 2315 atmo- spheres. The intent was to search for emission spectral features for which opacity measurements could then be made.
A single Teflon cup seal was used on the piston to prevent forward leakage of the helium driver gas, and the molybdenum piston head was used. Wide slit widths of 100 microns were used, and the high-speed shutter was not employed in these experiments, thereby enhancing the probability of detection.
c
14

No spectra could be detected in these pure H2 experiments. At the maximum pressure attained, the calculated gas temperature was approximately 2700°K and the degree of dissociation was approx- imately 0.1%. It was found that the piston face came to within 3 millimeters of the end-plug at these pressures. Such a small separation made attempts to attain higher.pressures and temperatures with pure H2 risky, and precluded the possibility of absorption measurements using the test beam of 5 millimeter diameter cross- section. Additional experiments with pure H2 test gas have been postponed until means are found to increase the volume of the compressed gas sample.
3 . 2 Hydrogen/Helium Mixture Experiments
As indicated above in section 2.2, appreciable concentrations of both H2 and H can be produced at high pressures and temperatures by compressing a mixture of hydrogen and a monatomic gas such as argon or helium. If the monatomic gas concentration is high, the thermodynamics of the compression process is largely controlled by the adiabatic exponent of the monatomic gas, and, consequently, for a given pressure, the gas temperature will be higher than for compression o f a pure diatomic gas. The principal result of such a mixture experiment is a quantity of partially dissociated diatomic gas immersed in a monatomic gas heat bath.
Helium was chosen f o r the monatomic gas f o r several reasons. At a given temperature and pressure, it supplies fewer electrons to the mixture than any other gas. It will not contribute any important sources of opacity except f o r its role in broadening spec- tral lines, and even in this role it is the least effective of all foreign gases because of its extremely small polarizability. produces small and often negligible wavelength shifts in collisional line broadening processes, and thus the peak of a spectral feature can be expected to remain within the frequency passband of the monochromator during the entire compression cycle. The compression
It

process using helium is free from the affects of shock waves which are often found in the compression of other gases which have slower sound velocities.
- 3.2.1 Emission Experiments with Mixtures
Preliminary mixture experiments with 20/80 and l O / g O hydrogen/helium mixture ratios were performed using time-integrated spectroscopy and wide slit widths for survey purposes. These spec tra revealed metal impurity lines, some OH bands, and background continua extending from the red limit of 103-F emulsion sensitivity (7000 1) to approximately 2200 A in the ultraviolet. These spectra were not greatly different from earlier spectra recorded with this and an earlier compressor at lower pressures using pure helium as the test gas except that on a shot which attained 3170 atmospheres and a calculated temperature of 6 5 0 0 " ~ , using a lO/gO mixture ratio, the metal lines appeared quite weak superimposed on a very strong continuum.
1 I Subsequent emission experiments consisted of a careful attempt
to produce two spectrograms on the same emulsion, at the same exposure time and slit width, and at the same values of calculated temperatures, with one spectrogram displaying the spectra from a pure helium compression, the other showing the results of a lO/gO mixture ratio. The resulting spectrograms are shown in Figure 14. The experimental conditions for these two spectra are as follows: 103-F emulsion, high speed shutter exposure times = 300 microseconds, slit widths = 25 microns. The measured pressures, calculated tem- peratures and compositions are, for the pure He spectra: average pressure during the shutter open time, Pave = 1830 atmospheres, average temperature, Tave = 6040°~ , average helium density, NHe = 2.2 x 1021cm'3. For the 10/90 mixture ratio spectra:
'ave = 2630 atmospheres, Tave = 61600~, and NHe = 2.6 x 10 21 cm -3 ,
= 1.6 x 1020cm'3, and = 2.5 x 1C20cm-3. Elecsron "2
16

11 - 3 cm concentrations are, f o r the pure helium experiment, Ne = 2 x 10 from the ion iza t ion of helium, and, for the l O / g O mixture r a t i o experiment, Ne = 1 .2 x 10 metal vapors may make s i g n i f i c a n t cont r ibu t ions t o Ne.
15 i n both cases, i on iza t ion of
Each of the compressor spectra i n Figure 14 has narrow mercury l i n e s superimposed f o r wavelength ca l ib ra t ion , a rough wavelength sca l e i s shown i n the lower s t r i p , and the upper three narrow spec t ra are the carbon a r c exposures used f o r s tandard iza t ion i n the heterochromatic photometry procedure mentioned earlier. ure l 5 ( a ) , ( b ) , ( c ) , (d) , and ( e ) show densitometer t rac ings of the lO/gO mixture r a t i o spec t ra shown i n Figure 14. photographic dens i ty versus wavelength on non-linear s c a l e s and l i n e i d e n t i f i c a t i o n s f o r both the narrow mercury l i n e s and the most prominent metal impurity l i n e s . on these cha r t s a r e lines of Fe I. The metal vapors producing these l i n e s come from various compressor p a r t s exposed t o hot gas during the compression cycle. The l a rge arrows on these cha r t s i nd ica t e regions where background continuum i n t e n s i t y measurements have been made on both spec t ra displayed i n Figure 14.
Fig-
These t r aces show
Most of the l i n e s not i d e n t i f i e d
The results of the in t ens i ty measurements are displayed i n Figure 16. The measurements a r e obtained by means of conventional emulsion c a l i b r a t i o n and s tandardizat ion procedures, and the i n t e n s i t i e s obtained from each spectrogram can be compared d i r e c t l y because of i d e n t i c a l op t ics , exposure times, and s l i t widths. It i s d i f f i c u l t t o determine accurately the e r r o r s present i n photo- graphic photometry because of the numerous s t eps i n the data reduct ion process. The most accurate and painstaking photographic i n t e n s i t y measurements y i e l d e r r o r s of t he order of *2$ (see Refer- ence 11). r e c i p r o c i t y f a i l u r e and the Eberhard e f f e c t , weak molecular bands i n the carbon a r c s tandardizat ion spectra , and uncer ta in ty i n the carbon a r c temperature, it is felt t h a t the data i n Figure 16 are accura te t o wi th in *l5$, except the poin ts a t 3330 w f o r which the
Because of the possible presence of such e f f e c t s as

e r r o r s are la rger because o f an add i t iona l uncertainty i n the placement of the 3330 -!. emulsion c a l i b r a t i o n curve re la t ive t o the curves f o r the other wavelengths due t o the almost undetectable i n t e n s i t y of the carbon a r c a t t h a t wavelength. The fundamental problem of locat ing the t r u e continuum l eve l i n the presence of many broadened spec t r a l l i n e s w i l l be t r e a t e d i n a la te r sec t ion .
The f i n a l emission experiment performed w a s a survey spectro- gram made from a l O / g O mixture r a t i o a t nearly the same pressure and temperature as that f o r the l O / g O mixture r a t i o spec t ra d i s - played i n Figure 14, except i t was made on a Kodak I-N emulsion sens i t i ve t o near- infrared wavelengths as w e l l as t o v i s i b l e and u l t r a v i o l e t rad ia t ion . The resonance "D" l i n e s of potassium (an everpresent impurity) a t 7665 and 7699 A appeared blended and one of the resonance I'D" l i n e s of cesium a t 8521 w a s i d e n t i f i e d near the long wavelength cutoff f o r th i s emulsion. These l i n e s were superimsosed on a weak continuum, but t he wavelength r e so lu t ion of the prism spectrograph i s so poor i n th i s s p e c t r a l region that i n t e n s i t y measurements were deemed impract ical .
3.2.2 Absorption Experiments with Mixtures /
The opaci ty measuring technique described above was f i rs t tested a t moderate pressures w i t h pure helium tes t gas, and w i t h the monochromator set a t the peaks of severa l prominent metal impurity l ines . These experiments not only enabled operat ional checks of the scheme to be made, but a l s o allowed estimates of the abundance of impurity metal vapors t o be made.
One operational d i f f i c u l t y was apparent upon inspect ion of the f irst f e w records of the chopped photomultiplier s ignal , namely, an apparent source of opacity made an appearance severa l mill iseconds after the f i r s t compression and expansion of the tes t gas, but, nevertheless, before the o p t i c a l alignment was destroyed by com- pressor motion. This apparent opaci ty w a s found to have no
18
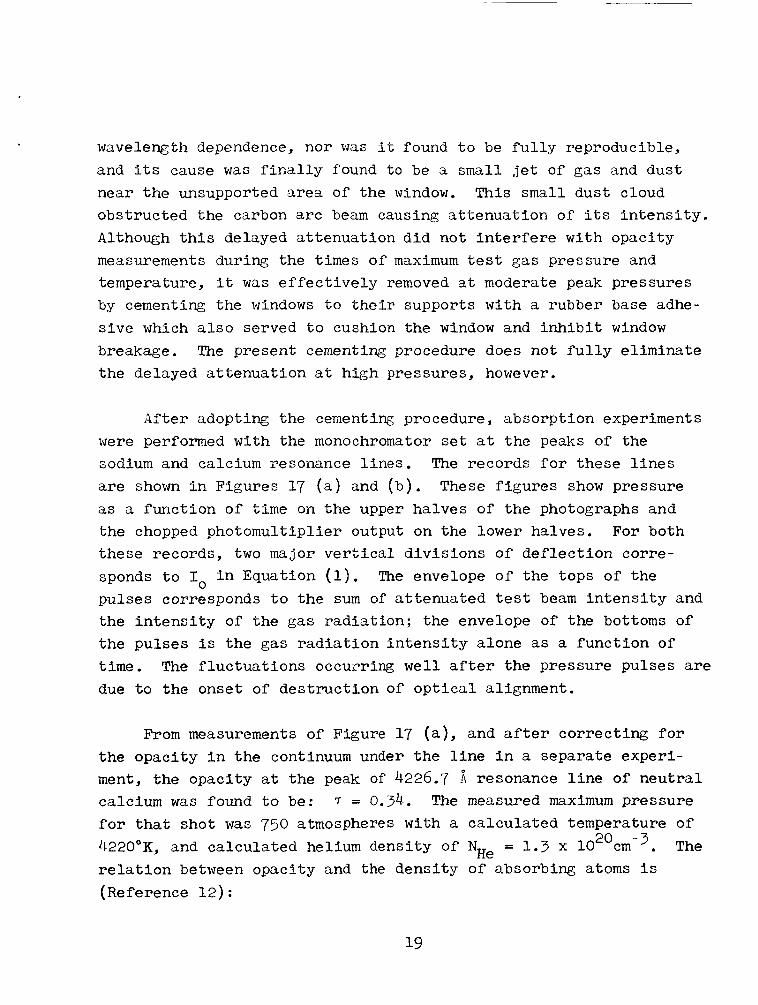
wavelength dependence, nor was i t found t o be f u l l y reproducible, and i t s cause was f i n a l l y found t o be a s m a l l jet of gas and dust near the unsupported a rea of the window. This s m a l l dust cloud obstructed the carbon a r c beam causing a t t enua t ion of i t s in t ens i ty . Although t h i s delayed a t tenuat ion d id not interfere w i t h opacity measurements during the times of maximum t e s t gas pressure and temperature, it was e f f e c t i v e l y removed a t moderate peak pressures by cementing the windows t o their supports w i t h a rubber base adhe- s i v e which also served t o cushion the window and i n h i b i t window breakage. The present cementing procedure does not f u l l y e l iminate the delayed a t t enua t ion a t high pressures, however.
After adopting the cementing procedure, absorpt ion experiments were performed w i t h the monochromator set a t the peaks of the sodium and calcium resonance l i nes . The records f o r these l i n e s are shown i n Figures 17 (a) and ( b ) . These f igu res show pressure as a funct ion of time on the upper halves of the photographs and the chopped photomultiplier output on the lower halves. For both these records, two major v e r t i c a l d iv i s lons of de f l ec t ion corre- sponds t o Io i n Equation (1). pulses corresponds t o the sum of a t tenuated tes t beam i n t e n s i t y and the i n t e n s i t y of the gas rad ia t ion ; the envelope of the bottoms of the pulses i s t h e gas r a d i a t i o n i n t e n s i t y alone as a funct ion of t i m e . The f luc tua t ions occurring w e l l a f ter the pressure pulses are due t o the onset of des t ruc t ion of o p t i c a l alignment.
The envelope of the tops of the
From measurements of Figure 17 ( a ) , and a f te r cor rec t ing for t he opaci ty i n t h e continuum under the l i n e i n a separate experi- ment, the opaci ty a t the peak of 4226.7 calcium was found t o be: T = 0.34. The measured maximum pressure f o r t h a t shot was 750 atmospheres with a ca lcu la ted temperature of 4220"K, and ca lcu la ted helium densi ty of NHe = 1.3 x 1020cm--3. r e l a t i o n between opaci ty and the dens i ty of absorbing atoms i s (Reference 12) :
resonance l i n e of neu t r a l
The

W ---I ( Aw ) 2+W2 , ( 3 )
where ro is the c l a s s i c a l e l ec t ron rad ius and i s 2.82 x 10⁻¹³cm., f i s the o s c i l l a t o r strength, Nn i s the number of atoms i n the lower s t a t e of the l i n e , 4, is the path length, the induced emission term and where hv i s the absorbed photon
(1 e hv/kT) is
energy, Aw i s the d is tance from the l i n e center i n u n i t s of cm-', and W i s the half half width of the assumed Lorentzian broadened l i n e i n un i t s of cm-l. The value of W i s taken from the l i n e broadening d a t a of Hindmarsh (Reference 13). experimental data f o r t h i s shot y i e lds a calcium abundance of
= 8.5 x 10 cm . A similar ca l cu la t ion f o r the blended N C a I sodium "D" l i nes from the data of Figure 17 (b) y ie lds a sodium abundance of NNa = 1.0 x 10 cm .
Subs t i tu t ion of the
11 -3
12 -3
Figure 18 ( a ) i l l u s t r a t e s a pressure-time record f o r a pure helium shot f o r which the i n i t i a l conditions and maximum pressure are iden t i ca l to the shot that produced the pure helium spectrogram i n Figure 14, and the pure helium i n t e n s i t y data i n Figure 16. Also shown on this record is the output o f the motion transducer, the s l i g h t l y curving l i n e j u s t below the c e n t r a l gradicle l i n e which serves t o ind ica t e the exact alignment pos i t i on of the center of the side window w i t h the a x i s of the ex terna l op t ics . Exact alignment during the e n t i r e pressure pulse was achieved t o within 0,050 inch, a negl ig ib le e r r o r .
Figure 18 (b) displays the chopped output of the monochromator- photomultiplier a t a wavelength of 5000 f o r t h i s pure helium shot a t a maximum pressure of 1890 atmospheres and ca lcu la ted temperature of 6 0 8 0 ' ~ . A t th i s wavelength, the spec t ra of Figure 14 shows only continuum radia t ion . U s i n g equation (1) f o r Fig- ure 18 (b) a t maximum conditions, the opaci ty w a s found to be
= 0.39. 5000 A 7
20

4.0 DISCUSSION AND CONCLUSIONS
The principal findings of' this investigation are the continua intensities shown in Figure 16, the opacity measurement at 5000
in the pure helium experiment, and the absence of any bound-bound Balmer line opacity. The failure to detect emission features in pure hydrogen is undoubtedly due to the low gas temperatures and short observation times. Although the red wing of the Lyman alpha (L,) transition and the effects of such mechanisms as pressure- induced transitions in molecular hydrogen might have been observable in absorption, such experiments must await compressor modifications which will result in larger compressed test gas volumes.
This section of the report suggests possible mechanisms which may explain the observed wavelength dependence of the continua. It is felt that, due to the presence of the impurity lines, the preci- sion of the measurements is not high enough to permit resolution of small scale fluctuations in the continua curves. However, the measurements are reliable enough to permit the following observa- tions.
The intensity of the pure helium continua is greater than that for the lC$ hydrogen mixture over the wavelength range of 3300 k to 6300 from the same mechanism, this fact may be explainable by a tempera- ture difference between the two experiments and a resulting difference in the abundance of the continuum producers.
by a factor ranging from 2 to 3. If both continua arise
The intensity of both continua increases with decreasing wave- length. In view of the fact that both continua exhibit the same general properties, it is possible they both arise from the same mechanism. Since helium is the major constituent of both gas mixtures several helium related mechanisms should be considered.
21

Molecular r a d i a t i o n from He2. Although t h i s molecule shows several bands i n the v i s i b l e and u l t r a v i o l e t p a r t s of the spectrum, t he i r pos i t ion does not correspond wi th tha t of any f e a t u r e s i n the compressor spectra . Furthermore, s ince the ground state of He2 i s unstable, a v e r y high gas temperature i s required t o produce the exc i t ed He atoms which form He2.
____--_-I_.- Negative He ion, He- . This ion e x i s t s and has an e l e c t r o n binding energy o f 0.075 eV (Reference 1 4 ) . Its only bound s ta te i s metastable and is 19 e V above the He ground state, s o that only free-free t r a n s i t i o n s are of i n t e r e s t here. However, the free-free absorpt ion coef f ic ien t for He- increases toward longer wavelengths (Reference 15) and cannot be a s u i t a b l e candidate here.
Two o the r possible continuum mechanisms are assoc ia ted w i t h
I the impuri t ies present i n both mixtures.
Metallic negative ions. I n add i t ion t o He- (and the w e l l known H-) many metals form negative ions whose binding energies and con- tinuum absorpt ion cross-sect ions are of the same order of magnitude as those f o r H- (Reference 1 6 ) . the me ta l l i c negative ions as a poss ib le source of the observed continua i s Cu- . r e s u l t s i n a threshold wavelength of approximately 6880 .;i w i t h in ten- s i t y increasing toward the W, and i s possibly high enough t o s h i f t the peak of its bound-free absorpt ion c o e f f i c i e n t t o wavelengths sho r t e r t h a n 4000 ?.. A s m a l l amount of copper vapor i s produced i n the compressox' by t h e heating of the phosphor-bronze p i s ton body and window jackets by the hot t e s t gas.
The most l i k e l y candidate among
I t s binding energy of 1.80 e V (Reference 1 '7)
I ------.--L--.--Jp- Many broad weal! impurity __--- l i n e s . Systematic e r r o r s i n measure- merits of continuous background i n t e n s i t i e s are o f t en caused by the presence of many broad, weak, impurity l i n e s w i t h overlapping w i n g s . 111 the compressor spec t ra presented here, several Fe I mul t ip l e t s
22

have been ident i f ied , and i n v i e w of the f a c t tha t the Fe I spec- trum has many closely spaced l i nes i n the blue and near u l t r a v i o l e t p a r t s of the spectrum, these r e l a t i v e l y weak, broadened l i n e s may c o n s t i t u t e a pseudo-continuum which may p a r t i a l l y account f o r the i n t e n s i t y increase w i t h decreasing wavelength.
The experiments performed t o date do not reveal whether the continua of Figure 16 o r ig ina t e from the same or from qu i t e d i f -
f e r e n t mechanisms. Although hel ium i s the major const i tuent of both gas mixtures, the compositions of the two mixtures a r e qu i t e d i f f e r e n t . There are lo2' hydrogen molecules and atoms per cubic centimeter, as w e l l as 4 orders of magnitude greater e l ec t ron dens i ty i n the l O / g O H2/He mixture. above mechanisms which may explain the pure helium continuum, the following mechanisms must be included i n a discussion of the hydro- gen mixture continuum.
Therefore, i n addi t ion t o the
Negative hydrogen ion, H-. This well-known source of opaci ty a t moderate gas temperatures has a bound-free absorpt ion coe f f i c i en t which peaks i n the near in f ra red and a f ree- f ree absorpt ion coef f i - c i en t which is t o o s m a l l t o be of i n t e r e s t i n the wavelength range of t h i s study. Consequently, it alone cannot account f o r the proper t ies of t h e observed hydrogen mixture continuum.
Red w i n g of the Lyman alpha (La) l i n e . Pressure broadening of the spec t r a l l i n e s of atomic hydrogen can be employed t o increase the opaci ty of the gas. per turber ) f o r broadening the La l i n e i s atomic hydrogen. This type of broadening, commonly ca l led rssonance o r self-broadening, occurs when the upper or lower l eve l of a s p e c t r a l l i n e has an allowed dipole t r a n s i t i o n to the ground state, and when the absorbing atom is surrounded by like atoms i n the ground state. I n the range of pressure and temperature where the impact theory of s p e c t r a l l i n e broadening i s va l id , t h i s broadening mechanism produces an unshif ted, temperature insens i t ive , Lorentzian l i n e whose half-width i s
.-----I ---- - -
The best ' 'foreign gas" addi t ive (i .e. ,
23

proportional t o the atomic hydrogen densi ty . Van der Waals broad- ening, on the other hand, occurs when the absorbing atom i s surrounded by unl ike atoms, i .e. w i t h H2 or He. mechanism i s much less important than resonance broadening, and can be neglected.
This broadening
Although the peak of La occurs a t 1216 i, the high dens i ty of hydrogen a toms used i n these experiments may r e s u l t i n a n intense, long wavelength w i n g with de tec tab le opaci ty i n the near u l t r a v i o l e t and v i s i b l e spectrum. Unfortunately, unce r t a in t i e s i n the l i n e broadening theory a t such large d is tances from the l i n e center and a t such high dens i t i e s , coupled w i t h unce r t a in t i e s i n the atomic hydrogen abundance i n the compressor experiments, do not permit t h i s possible opacity source t o be e i ther disregarded or treated i n f u l l e r d e t a i l a t t h i s t i m e .
To summarize then, the f indings of th i s inves t iga t ion , hydro- gen/helium mixtures were compressed t o pressures and temperatures exceeding 2500 atmospheres and 5000°K, and the r e su l t i ng emission was recorded i n the wavelength range of 2000 - 9000 and analyzed. Although the d i s c r e t e spec t ra that were observed could not be ascr ibed t o hydrogen, the continuum may have contr ibut ions a t t r i b - utable t o hydrogen. The strong continuum tha t w a s observed i n the pure helium experiments, continuum due t o helium and m e t a l impuri- t i e s , and present i n the mixtures experiments i n an unknown amount, precludes a determination a t t h i s t i m e of the role that hydrogen plays i n the formation of the continuum observed i n the mixtures experiments.
24

REFERENCES
11 1. Lalos, 0. T., "Laboratory Production of Hot, Dense Gases, Rev. Sci. Instr. 33,214, 1962.
2. Lalos, G. T. and Hammond, G. L., "Emission Spectra of Hot, Dense Gases," Astroph. J. =,616, 1962,
3. Hammond, G, L., "The Shift and Broadening of the Resonance Doublet of Ba I1 Caused by He and Ar Collisions," Astroph. J. 136,431, 1962.
4. White, W. B,, Johnson, S. M., and Dantzig, Q , B., "Chemical Equilibrium in Complex Mixtures," J. Chem. Phys. 28,751, 1958.
5. Burke, B. A., and Lalos, G. T., "Ionic Equilibria in Hot, Highly Compressed Gases,'' NOLTR 65-64 (in preparation).
6. Kendall, P . A., "High Speed Electromechanical Shutter for Time Resolved Spectroscopy," Applied Spectroscopy l8,33, 1964.
7. Kendall, P. A., "NOL 100,000 psi Adiabatic Compressor, Elec- tronic Instrumentation, " MOLTN-4541, 1958,
8. Null, M. R. and Lozier, W. W., "Carbon Arc as a Radiation Standard, 'I JOSA !j2,1156, 1962,
9. Diffraction Products, Inc., Model S-05-02, distributed by E n g i s Equipment Co . , Chicago, I11 . Produced by Magnetically Driven Shock Waves," Phys. Fluids
11. Wright, K. O . , "Spectrophotometry, 'I in Astronomical Techniques,
12. Qriem, H. R., Plasma Spectroscopy, McQraw-Hill Book Co.,
13. Hindmarsh, W. R., "Collision Broadening and Shift in the Reso-
11 10. McLean, E., et al, Spectroscopic Study of Helium Plasmas
2,843, 1960
W. A. Hiltner, ed., Chicago Univ. Press 1962, Chapt. 4.
Mew York 1964, Chapt. 7.
nance Line of Calcium," Monthly Notices Roy. Astron, SOC.
14. Smirnov, B. M., "Atomic Negative Ions," High Temperature =,11, 1959.
2,716, 1965; English translation by Consultants Bureau/ Plenum Press, New York, of Teplof izika Vysokikh Temperatur Zn5 , 1965.
25

REFEXENCES (Cont'd)
15. Somerville, W. B., "The Continuous Absorption Coefficient of He-," Astroph. J. m,811, 1965.
16. Branscomb, L. M., in D. R. Bates (ea.), Atomic and Molecular Processes, Academic Press, Inc., New York 1962, Chapt. 4.
17. Clementi, E., "Atomic Negative Ions: The Iron Series," Phys. Rev. z, A 980, 1964.

I
U
Z 0 C"
u C
I-
LL
I-
-I
27

n Z Lu
v, v, Lu
U
28

h
n Z w
29

HIGH PRESSURE
FIG. 4 DETAILS OF SIDE WINDOW TEST SECTION
30

1.03
w O 0.69 X (4 0.34 z
- cT>
.c/ 2 0 - 0 200 400 LL
t (Mi LLIS EC ONDS)
e 0 40 80 t (MI LLlSECONDS)
n I
X 0.69-1
I vu 3UV
t (MICROSECONDS)
FIG. 5 OSCILLOSCOPE RECORD OF TEST GAS PRESSURE VERSUS TIME
31

> k 2 C
U
U
U - c I- P 4 n
. U e - I- < U n a i 4
U I-
.(

101; 0 1,000 2,000 3,000 4,000 5,000
TOTAL GAS PRESSURE (ATM)
FIG. 7 PARTICLE DENSITY VERSUS PRESSURE FOR PURE H2. INITIAL CONDITIONS: Po = 1 ATM, To = 298'K
33

HYDROGEN/HELIUM MIXTURE RATIO
FIG. 8 PARTICLE DENSITY VERSUS MIXTURE RATIO FOR P = 3000 ATM. INITIAL CONDITIONS: Po = 1 ATM, To=298 O K
34

TOTAL GAS PRESSURE (ATM)
FIG. 9 PARTICLE DENSITY VERSUS PRESSURE FOR 10/90 HZ/He MIXTURE RATIO. INITIAL CONDITIONS: Po = 1 ATM, To = 298 O K
35

(3 7 L n - c
9 w I L
n Z a 3 a w v)
Z 0 z2 t-
LL
0 c
(3 - L
36

TELESCOPIC MINIMUM SEPARATION GAGE I
I I I
*m SECTIONS I- - - - - --- RANGE, 46+20mm 25mm SECTIONS I----- RANGE, 29-lhm 2 h m SECTIONS I--- RANGE, 20-5mm
FIG. 11 TELESCOPIC MINIMUM SEPARATION GAGE
37

C.R.O.
TEKTRONIX TYPE 551
PRE- A
AMPLIFIER
- - - - - FRONT SURFACE
- - - -
I - 1 ; I TRIGGER
UNIT I \ I SLOTTED 1 ' I ' . SHUTTER
SPEED SHUTTER / DRIVING
COIL *
PLATE
BAUSCH 8, LOMB MEDIUM QUARTZ SPECTROGRAPH
(NOT TO SCALE)
J
FIG. 12 OPTICS FOR EMISSION EXPERIMENTS
38

TO EMITTER FOLLOWER PREAMP. AND C.R.O.
LITTROW MOUNTED GRATl NG MONO-
CHROMATOR RCA 7200 PHOTO-
K MULTIPLIER 5 + \TUBE
!' MASK
TO PREAMP. AND C.R.O.
HIGH PRESSURE A 4 TEST SECTION U
kt'$TiRR0R w L4 F.S.
S LOTTED DRUM
"CHOPPER "
FIG. 13 OPTICS FOR ABSORPTION EXPERIMENTS
39

10/90 H*/He
PURE He
FIG. 14 TIME RESOLVED SPECTRA FOR PURE HELIUM AND 10% HYDROGEN MIXTURE AT 6000 O K
103-F PLATE, 25 pSLIT, 300pSEC EXPOSURE
40

I 1 I i I 1 1 1 I I I I I
I 1 I ' I I I I I 1
1 I
FIG. 15g) DENSITOMETER TRACINGS OF THE 10/90 H2/He MIXTURE RATIO SPECTROGRAM
41

I I 1 i I .I 1 I i I I 1 I I i 1 s t 4 . 1 I I 1 I I I I I 1 I I I I I I i
m- 171i.i I i i i i
FIG. 15(b) DENSITOMETER TRACINGS OF THE 10/90 H2/He MIXTURE RATIO SPECTROGRAM
42
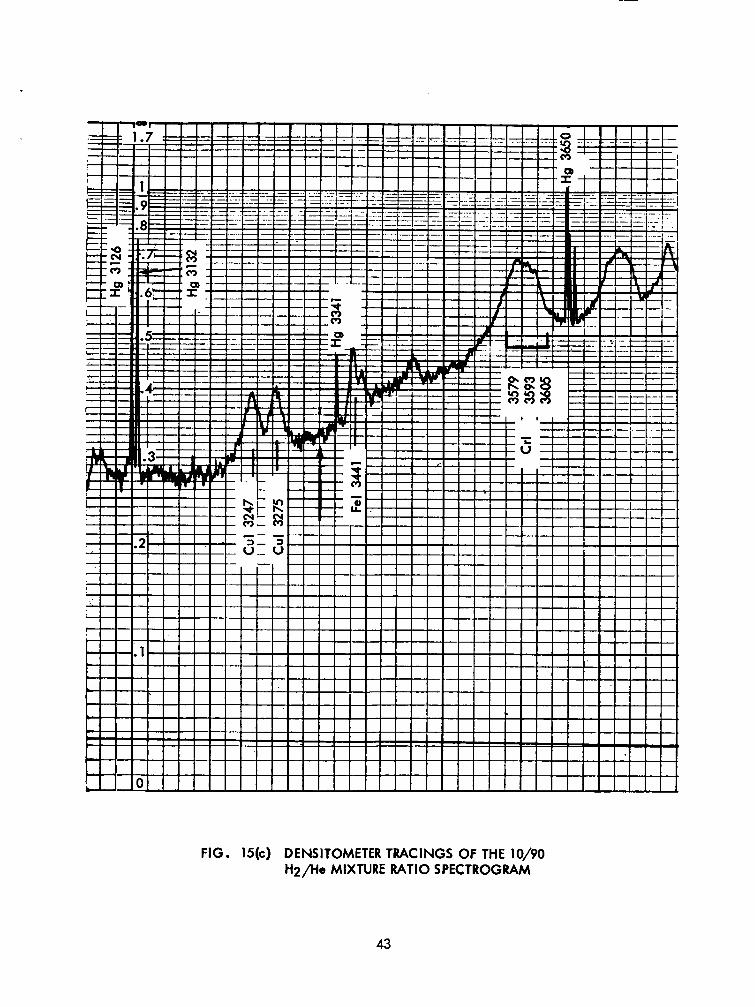
FIG. 15(c) DENSITOMETER TRACINGS OF THE 10/90 H 2 P e MIXTURE RATIO SPECTROGRAM
43

FIG. 15(d) DENSITOMETER TRACINGS OF THE 10/90 H2/He MIXTURE RATIO SPECTROGRAM
44

FIG. 15(e) DENSITOMETER TRACINGS OF THE 10/90 H2/He MIXTURE RATIO SPECTROGRAM
45

2 5 0 - 200 -1; 150
100
50
0 3000 4Ooo 5000 6000
WAVELENGTH (K)
FIG. 16 CONTINUA INTENSITIES VS. WAVELENGTH PURE HELIUM AT 1830 ATM. A N D 6040 O K
10/90 H*/He AT 2630 ATM. A N D 6160 OK. (a) @)
46

PRESSURE - SIGNAL
CHOPPED TEST BEAM SIGNAL
PRESSURE - SIGNAL
CHOPPED TEST BEAM SIGNAL
PRESSURE SIGNAL CALIBRATION MARKS
+ PRESSURE SIGNAL CALIBRATION MARKS
FIG. 17 OSCILLOSCOPE RECORDS FOR LINE OPACITY MEASUREMENTS (a) Cal,A4227 Ad MAXIMUM PRESSURE = 750 ATM (b) Nol, A5893 A, MAXIMUM PRESSURE = 750 ATM SWEEP SPEEDS = 2 MILLISEC/MAJOR DIVISION
47

PRESSURE SIGNAL CALIBRATION MARKS
' d l
PRESSURE SIGNAL CALIBRATION MARKS
INITIAL COMPRESSOR POS IT ION
COMPRESSOR POSITION .DURING COMPRESSION CYCLE
- PRESSURE SIGNAL
- PRESSI
-CHOP
PM
FIG. 18 OSCILLOSCOPE RECORDS FOR C 0 NT I NUUM 0 PAC I TY ME AS UR EM E N T S (a) PRESSURE AND MOTION RECORD (b) MAXIMUM PRESSURE = 1890 ATMOSPHERES
PRESSURE AND TEST BEAM SIGNAL (5000 i) SWEEP SPEEDS = 500 ~SEC/MAJOR DIVISION
J R E
PED SIG
SIGNAL
TEST "AL
48