of magnetic 78,186-1 1 988) - spin.niddk.nih.govspin.niddk.nih.gov/bax/lit/spdf/98.pdfjournal of...
TRANSCRIPT
JOURNAL OF MAGNETIC RESONAN= 78,186-1 9 1 ( I 988)
Improved Resolution and Sensitivity in %-Detected Heteronuclear Mnltiple-Bond Correlation Spectroscopy
AD BAX AND DOMINIQUE MARION*
Laboratory of Chemical Physics, National Institute of DiaBmes md Dipstive and Kidney Diseases. Nufionul InstifUtes of Health, Beihsda, Maryland 20892
Received Deoernber 14, 1987; revised February I , t988
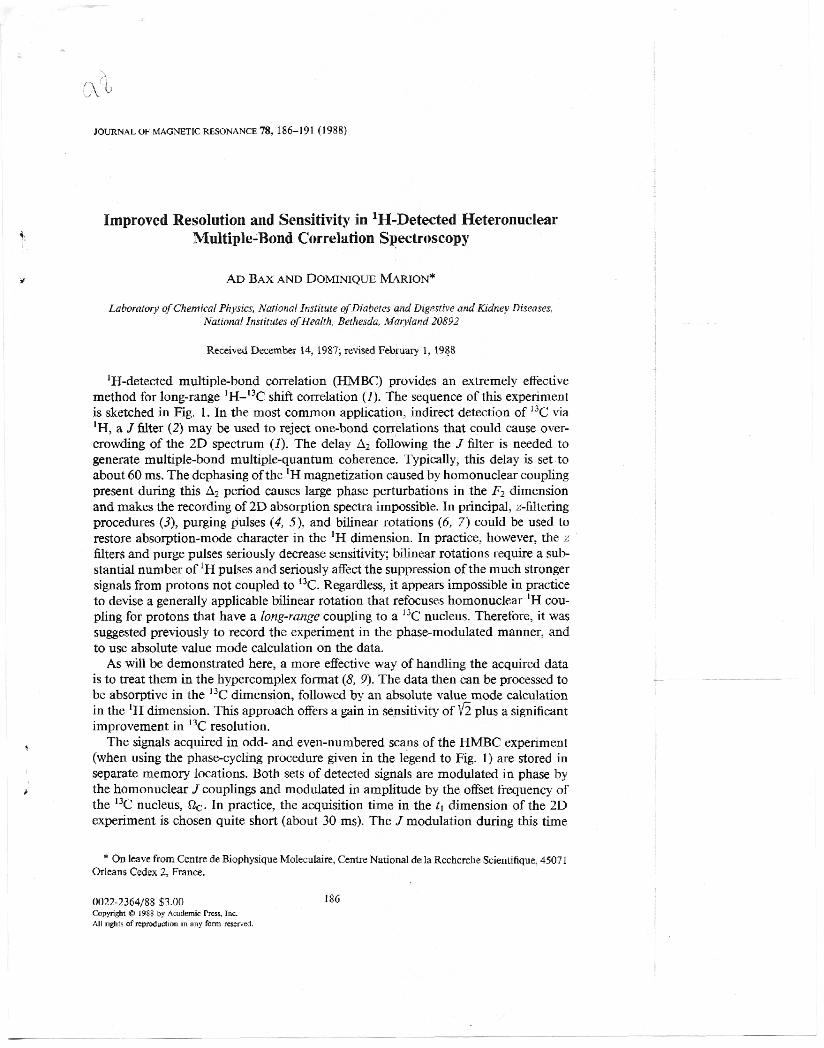
'H-detected multiplebond comIation (HMBC) provides an extremely effective methd for long-range 'H-I33c shift correlation ( I ) . me sequence of this expaiment is sketchd in Fig. 1. In the most mmmon application, indirect detection of I3C via 'H, a J filter (2) may be used to reject onebond correlations that could cause over- crowding of t h e 2D spectrum ( I ) . The delay AI following the .3 filter is needed to generate multiplebond multiplequantum coherence. Typically, this delay is set to about 60 ms. The dephasing of the 'H magnetization caused by homonuclear coupling present during this A2 period causes large phase perturbations in the F2 dimension and make the recording of 2D absorption spectca impossible. In principal, z-filtering procedures (3), purging pulses (4, 5), and bilinear rotations (6, 7 ) could be used to restore absorption-mode character in the 'H dimension. In practice, however, the z filters and purge pulses seriously decrease sensitivity; bilinear rotations require a sub stantid number of 'H PUIS= and seriously affect the suppression of the much stronger signals from protons not coupled to I3C. Regardless, it appears impossible in practice to devise a generally applicable bilinear rotation that refocuses homonuclear 'H cou- pling for protons that have a long-range coupling to a I3C nucleus. Therefore, it was suggestd previously to record the experiment in the phasemodulated manner, and to use absolute value mode calculation on the data.
As will be demonstrated here, a more effective way of handling the acquired data is to treat them in the hypercomplex format (8, 9). The data then can be processed to be absorptive in the 13C dimension, followed by an absolute value mode calculation in t h e 'H dimension. This approach offers a gain in sensitivity of plus a significant improvement in '32 resolution.
The signals acquired in odd- and even-numbered scans of the HMBC experiment (when using the phasecycling procedure given in the legend to Fig. 1) are stored in separate memory locations. Both sets of detected signaIs are modulated in phase by the homonuclear J couplings and modulated in amplitude by the oaet frequency of the I3C nucleus, dlc. In practice, t h e acquisition time in the E l dimension of the 2D experiment i s chosen quite short (about 30 ms). The J moduhtion during this time
* On leave from Centre de Biophysique Mdeculaire, Centre National de la Recherche Scientifique, 4507 I Orleans Cedex 2, France.
0022-2364/88 $3.00 I86 Copyright Q I988 by Academic Pms, Ync. All righe of repr&uction in any form r e s e d .
- . . . - .. . . . -
COMMUNICATIONS 187
FIG. 1. Pulse scheme of the HMBC expe*iment. The delay AI is set to l /(Zr,) and Q is set to 1/(2bJc& where Jm is the onebond and “Jm is the long-ran@ ‘H-’v coupling To minimize the effmts ofrelaxation, a shorter compromise value of about 60 ms is typically used for A?. The phase cycling used is p = x, x, x, x, -x, -5 -x, --n; $ = x, y , -x, -y, Aoq. = x, x, -x, -x. Data for odd- aad even-numhred smm are stored in separate locations.
will be smal l and is negl-ed in the following discussion. Assurnkg all pulses are irhitely narrow, the odd-numbered scans are modulated by cos(& t l ) , the even-num- bered s a n s by sin(Qctr). Adhtion or subtraction of these two sets of data (after in- crementing the phase of the signals of even-numbered scans by 90°> followed by 2D Fourier transformation yields either the coherence transfer echo or the antiecho spec- trum (10, I I ) , aIso known as n-type or ptype spectra (22). The noise in these two spectra is uncarrelated and it has been proposed previously that reversing the F1 d;- mension of one of the two spectra followed by addition to the second spectrum will increase sensitivity (13). This communiation demonstrata a more efficient way to treat the data, calculating a spectrum that is absoMon mode in the Fl dimension and absolute value mode in the F7 dhension. Such mixed-mode representations have been used before, mainly for reasons of convenience (14-16). As mentioned above, pure 2D absorption spectra cannot be obtained in the HMBC experiment and therefore the mixed-made representation is the best alternative. For completeness, the hyper- complex approach will be briefly discussed below.
The timedomain data formally are described by what is generally referred to as a hypercomplex or fow-component signal (1 71,.
s(ti , 12) Srr(t1, td + isrilt~ t2) + iSr(tl, 12) + jiSrlt~ 7 t2), [I1 where i and j are the imaginary units in the t2 and tl dimension, rapectively. Hence, every data point in the time domain consists of four components that can be represented by a 2 X 2 matrix:
The first index refers to tl and the second to t 2 . Horizontal pairs in this matrix are the complex data points acquired during t 2 . Thus, in the phaseqcling scheme of Fig. 1, S, and S, correspond to the complex data points acquired during the odd-numbered scans. Vertical pairs concern the quadrature detection in the t l dimension. Thus, S, and Si, correspond to the x component of magnetization measured in odd- and even-
I88 CUMMUMCATIONS
numbered scans, respectively. Therefore, if S, is modulated by cos&t,), S;, i s mod- ulated by sin(!&tl).
Fourier transformation of Eq. [2] with respect to tz yields
Subsequent tl Fourier transformation gives
131
[41
Below, the frequency variables Fl and F2 will be omitted from the matrix notauou. This process of hypercomplex Fourier transformation, first introdud by Muller and Ernst (8) and States et a]. (P), now is widely used in 2D NMR (17). As mentioned before, the phase in the F2 dimension is affected by homonuclear Jrnodulation during the relatively long interval A2 and cannot be restored to ahemon in this dimension. If all pulses were 6 pulses, the phase of S, and S, would be purely absorptive in the Fi drmension. The finite widths of the 'H 180" pulse and the '3C 90" pulses cause a frequency4ependent phase shift in the F, dimension which may be quite large and can be Gifficult to adjust interactively. To a good approximation, the 90; pulse a n be replaced by a S pulse followed by a delay of 4 ~ 9 0 0 / 2 ~ ( = 0 . 6 4 ~ ~ ~ ) . Similarly, the last 90" I3C pulse can be replaced by a 6 pulse preceded by a delay of dura- tion 0 . 6 4 ~ ~ ~ . The first real value of tl is therefore equal to T = T,so.('H) + 2 X 0 . 6 4 ~ ~ ~ ~ ( ' ~ C ) . The linear phase correction needed in the tl dimension is therefore 2r/T per hertz (18). The phase at the center of the spectrum in the Fi dimension should be zero. Phase adjustment in the FI dimension is then described by
Instead of CalcuIating the regular magnitude spectrum, defined as
sin, = (S$ + s; 4- s& + sy2 ,
Smm = (S$ + sy2.
[61
we propose to calculate the mixed-mode spectrum
VI Figure 2a shows such a mixed-mode spectrum, recorded for the antibiotic deser-
tomycin (MW 1 192)' the structure of which was recently determined by NMR (19). To eliminate the absolute value mode tl noise from the contour pIot, a "skyline pro- jectim",onto the Fz axis is made of a region in the 2D spectrum whem no 13C reso- nances are present, from 165 io 145 ppm in the spectrum of Fig. 23. This "skyline projection'* is then subtracted from each of the Fz traces of the 2D matrix, resulting in an improved appearance of the spectrum (Fig. 2b). Of course, the improvement resulting from this type of nodinear processing is ody cosmetic. As i s the case for symmetrization of 2D spectra, &-noise subtraction has inherent pitfaIls; but unlike symmetrization, it may be impossible to telI whether tl-noise subtraction has been

COMMUNICATIONS 189
' t e -. : - ~
-- ~. . -
$ 4 3 2 1 PPM 5
E2
-- ,a SLY-* t
.. -100
. .
. , . - r20 - - c - - e -- - - ---- -?40
, . I
-160 - .-- .+.
--- . , . ' . " 1 . - --1- 4 3 2 1 PPY
FIG. 2. Mixed-mode (F, absorption, F2 absolute value) BMBC spxm of the antibiotic desertamycin (la, (a) without and (b) with t i noise subtraction. The spectnrm is Feoorded at 270 MHz 'H frequency and results from a 2 X 330 X 5 I 2 data matrix. Acquisition times were 27 and 160 ms in the Ft and Fz dimension, respectively; 128 scans wete recorded per tI value and the total measuring time was I3 h. spectra were recordd uing 15 mg of desertomycin (MW I 192) in 0.5 ml DMSO-&, at 55°C.
used. Therefore, it is recommended that aII published spectra Using this type of tt- noise subtraction acknowledge this procedure. The improvement in resolution & h i n d with this new data processing is demon-
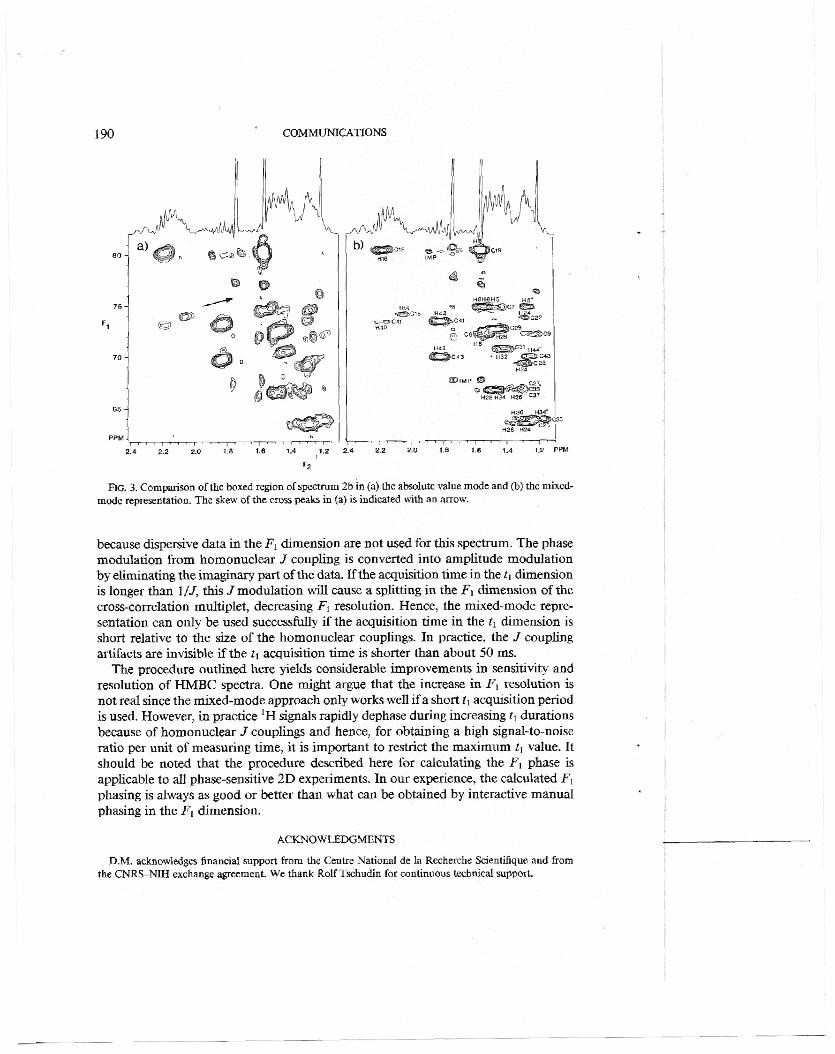
strated in Fig. 3, comparing the absolute value mOde spectrum and the mixed-mode spectrum for the boxed region of Fig. 2b. Both spectra are derived from the same set of acquired data. In the F2 dimension, sine-bell multiplication was wed for both spectra. For the spectrum of Fig. 3a, 20 Hz Lorentzian line nmuwing folluwed by 40 Hz Gaussian line broadening was used in the tl dimension, maximizing El resolution of the absoIute value mode spectrum. For Fig. 3b, 25 Hz Gaussian broadening was used to suppress truncation artifacts in the Fi dimension.
The correlation peaks in Fig. 3a show a skew that is due to p k modulation from 'H-'I3 J coupling This skew is not present in the mixedmode spectrum of Fig. 3b
190
80
75
F1
70
65
PPh
.1 In4
-15 e c 4 1 H40
H24
2.4 2.2 2.0 1.8 1.6 1.4 , l . P 2 4 2.2 20 1 1.6 1.4 1 2 PPM
Fa
FIG. 3. Comparison of the boxed &on ofspectnlm 2b in (a) the absolute d u e mode and (b) the mixed- mode representation. The skew of the cross peaks in (a) k indicated with an arrow.
because hpm$ve data in the Fl dimension are not used for this spectrum. The phase modulation from homonuclear J coupling is converted into amplitude modulation by eliminating the imaginary part of the data. If the acquisition time in the tl dimension is longer than I/J, this J modulation will cause a splitting in the F, dimension of the cross-correlation mdtiplet, decreasing F1 mlution. Hence, the mixed-mode repre- sentation can only be used successfully if the acquisition time in the tl dimension is short relative to the size of the homonuclear coupIings. In practice, the J coupling artifacts are invisible if the t1 acquisition time is shorter than about 50 ms.
The procedure outlined here yields considerable improvements in senshivity and reohtion d H M B C spectra. One might argue that the increase in F, resolution is not real since the mixed-mode approach ody works well if a short tl acquisition m o d is used. However, in practice 'H signals rapidly dephase during increasing tl durations because of homonuclear J couplings and hence, for obtaining a high signal-to-noise ratio per unit of measuring time, it is important to restrict the maximum 11 value. It should be noted that the procedure described here for calculating the PI phase is applicable to all phase-sensitive 2D experiments. In our experience, the calculated F, phasing is always as good or better than what can be obtained by interactive manual phasing in the Fl dimension.
ACKNOWLEDGMENTS
D.M. acknowledges financial support from the C e n h National de la Racherche Scieati6que and from the C N R S N E l exchange agreement. We thank Rolf k h u d i n for cantinuow technicaI support.

COMMUNICATIONS 191
REFERENCES
1. A. BAX AND M. E SUMMERS, X A m chem. Soc. 108,2093 (1986). 2. a. KOGLER, 0. w. S&ENSEN, G. B O D ~ A W S E N , ANI) R. R. ERNST, J. Mugn. Reson 55,157 (1983). 3, 0. W. MRENSEN, M. RANCE, AND R. R ERNST, J. M e Reson. 56,527 (1984). 4. 0. w. wR€NSEN AND R. R. E R N S , 5. &fm. ReSOJl. 51,477 (1983). 5. M. H. FRFI, G. WAGNER, M. VASAK, 0. W. S#ENSEN, D. NEUHAUS, E. W ~ K W ~ E R , J. H. R KXGI,
R. R ERN=, AND K. WUl’HRICH, J. Am. Chm. SCX. 107,6847 (1985). 6. J. R. GARBOW, D. P. WEITEKAMP, AND A. PMS, Chm. Phys. Leu. 93,504 (1982). 7. A. BAX, J. Magn. Resun. 52,330 (1983). 8. L MULLER AND R. R. ERNST, Mol. J‘hys. 38,963 (1979). 9. IS. J. STATES, R. A. HMERKoRN, AND D. J. RUBEN, J. Magn. Reson 48,286 (1982).
10. A. BAX, R. FIWEMAN, A N D G. A MORRIS, J. Magn Resun 42, 162 (1981). I I . A. BAX, Bull. Magn. Reson. 7, 167 (1986). 12. K. NAGAYAMA, P. BACHMANN, K. WVrHRIM, AND R. R. ERNST, J. M a g . Reson. 4 , 3 2 1 (1980). 13. V. SK~ENAR AND A. BAx, J. M e Reson. 71,379 (1987). 14 V. SKLEfdlt, H. MIYASHIRO, G. ZON, H. T. MILES, A N D A. BAX, FEBS ,!At. ZDs,94 (1986). 15. K. NAGAYAMA, J. Ma@. Reson. 69,508 (1986). 16. L. LERNER AND A. BAX, J. Magn. Reson. 69, 375 (1986). 17. R. R. ERNST, G. B Q D m m N , AND A. WOUW, "Principles of Nuclear Magnetic Resonance in
18. Incufientv~~ofBrukersoftware~IinearphasecoITBctionsh~ PHZ1,differsfromthemrrection
19. A. BAX, A. AszALos , Z. DINYA, AND K. S W , J. Am. Chm. Soc. 1Q8, 8056 (1986).
One and Two Dimensions,” p. 301, Oxford Univ. Pres (Clarendon), Londonflew York, 1987.
applied in the Ft dimension by SItfiFZ.
i
. .