of oceanography
TRANSCRIPT

of
OCEANOGRAPHY
A COMPILATION OFOBSERVATIONS FROM MOORED
CURRENT METERS
VOLUME XII
WIND, CURRENTS ANDTEMPERATURE OVER THE
CONTINENTAL SHELF AND SLOPEOFF PERU DURING JOINT II
March 1976 - May 1977
byD. B. EnfleidR. L. Smith
A. Huyer
April 1978
National Science FoundationOCE 76-00132
LIBRARY JUN 1978
Marine Science LaboratOr"Oregon State University
OREGON STATE UNIVERSITYData Report 70 Reference

School of OceanographyOregon State UniversityCorvallis, Oregon 97331
A COMPILATIONOF OBSERVATIONS
FROM MOORED CURRENT METERS
VOLUME XII
WIND, CURRENTS AND TEMPERATUREOVER THE CONTINENTAL SHELF AND SLOPE OFF PERU
DURING JOINT II
March 1976 — May 1977
by
D. B. EnfieldR. L. SmithA. Huyer
Data Report 70Reference 78-4
April 1978
National Science FoundationGrant OCE 76-00132

Abstract
Oregon State University installed and recovered mooringsalong the coast of Peru during the period late March 1976through mid-May 1977. A mid-shelf mooring near 15°S (MILA)was maintained for the full duration of the experiment, throughfive successive installations. This site was complementedby six other moorings in the first half of 1976 and by ninein the March-April-May 1977 period. These simultaneousmoorings were arranged in onshore—offshore arrays near 15°Sand in alongshore arrays at midshelf from lO°S to 15°30'S.
The data described in this report consists of the hourly• processed and filtered values of wind and current velocity,
air and water temperature, and pressure from the 1976-1977Peru installations. We describe the data through installationsummaries, statistics tables, progressive vector diagrams,speed and direction histograms, rotary spectra and time seriesplots.

TABLE OF CONTENTS
Introduction
The JOINT II Aanderaa Current Meter Program
Instrument Recovery and Performance . .
Calibration . . . . . . .
Processing and Description of the Data .
Acknowledgments
References
Installations
Leg I Moorings (MAM 76)
AGAVE
MILA .
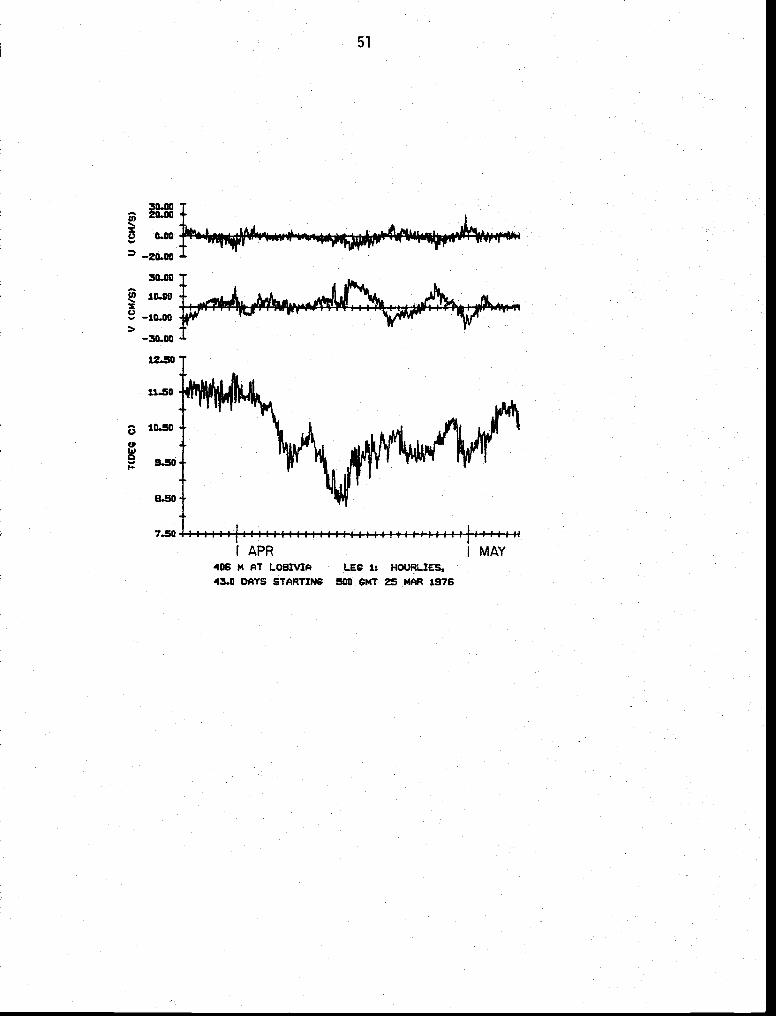
LOBI VIA
ISLAVA
SOUR .
Leg II Moorings
MILA .
LAGARTA
YUCA .
Leg III Mooring
MILA .
Leg IV Mooring
MILA .
1
• 7
• . • • • . 8
• • • . . . 10
13
14
15
17
25
41
59
71
81
99
113
123
139
• • • • . . . • . .
(JAS 76)

Leg V Moorings (MAM 77)
A GAVE
- MILA
- IRONWOOD
LAGARTA..
LOBI VIA
EUPHORBIA
P ARODIA .
YUCCATOO.
OPUNTIA . . .
PEYOTE
IMARPE Meteorological Installation
Appendix I . . . . . . . . . . .
Appendix II . .
. . S • • S • 215
• . S • S S • 229
• 245
• 273
• 285
• • 315
• . . • • • • 331
. • • S • S 5 337

Introduction
An interdisciplinary experiment called JOINT II was conducted in the
coastal upwelling region off the Peru coast from late March 1976 through
late May 1977. This experiment was the culmination of a series of field
efforts carried out in various upwelling regions (Oregon, Baja California,
Northwest Africa) as part of the NSF International Decade of Ocean
Exploration Coastal Upwelling Ecosystems Analysis Program (CUEA). The
Program goal is to understand the coastal upwelling ecosystem well enough
to predict its response far enough in advance to be useful to mankind.
The JOINT II effort contributes to this goal by extending the range of
natural conditions observed in coastal upwelling systems.
This report is concerned with data from the Aanderaa current meters
and meteorological data loggers installed during JOINT II by Oregon State
University (OSU, Corvallis). Compilations of JOINT II hydrographic data for 1976
have been prepared by Codispoti et al. (1976), Barton (1977) and Huyer
et al. (1978). Compilations for 1977 are in preparation.
The JOINT II OSU Current Meter Program
The JOINT II Aanderaa moorings were set and recovered for five
contiguous periods:
Leg I: late March to early May 1976
Leg II: early May to late July 1976
Leg III: late July to 30 September 1976
Leg IV: 30 September 1976 to 4 March 1977
Leg V: early March to mid May 1977

2
The time and space distribution of the Aanderaa current meter data during
the first phase of JOINT II are shown graphically in Figure 1 for Legs I -
IV, and in Figures 2 and 3 for Leg V. During Legs I, II and V moorings
were arranged in cross-shelf arrays from nearshore to the upper slope
and in alongshore arrays at midshelf from as far south as 15°30'S to as
far north as lO°S. Intense coverage took place during Legs 1 and 2 from
late March through most of July; monitoring of currents at midshelf was
continued at l5°S (MILA) through February 1977; and the most intensive
measurements were taken during March, April and May, 1977.
Table 1 sunniiarizes the positions, water depths and accepted instrument
depths by legs for the JOINT II Aanderaa moorings (only instruments from
which data were obtained are included). Several navigation charts were
used during JOINT II and their coastlines were found subsequently to be
mutually inconsistent. Since most fixes were made by radar references to
coastline points, this has created some confusion and inconsistency in
geographically relating the moorings to each other, to the bathymetry
and to the station positions of research vessels. The problem is discussed
in greater detail in Appendix 1, and the charts used for the moorings are
noted in Table 1.
All of the moorings were subsurface taut-wire installations as
described (in principle) by Pillsbury, Smith and Tipper (1969). Railroad
wheels were used for deadweight in conjunction with AMF acoustic releases
at the base of each vertical current meter string. Over the continental
shelf (250 m or less) flotation was provided by iF' diameter Viny floats
(above each instrument) and a 29" steel sphere (at the top of each mooring).

V
3
MAR
IMARPEMET.
Figure 1. Time—depth distributions of Aanderaa current meter data during JOINT—TIfrom March 1976 to March 1977, and locations of current meter moorings(inset). Lines are dashed where speed and/or direction data are missing0Mooring location symbols are: A-Agave; M-Mila; L-Lobivia and Lagarta;I—Islaya; S—Sour; Y—Yuca.
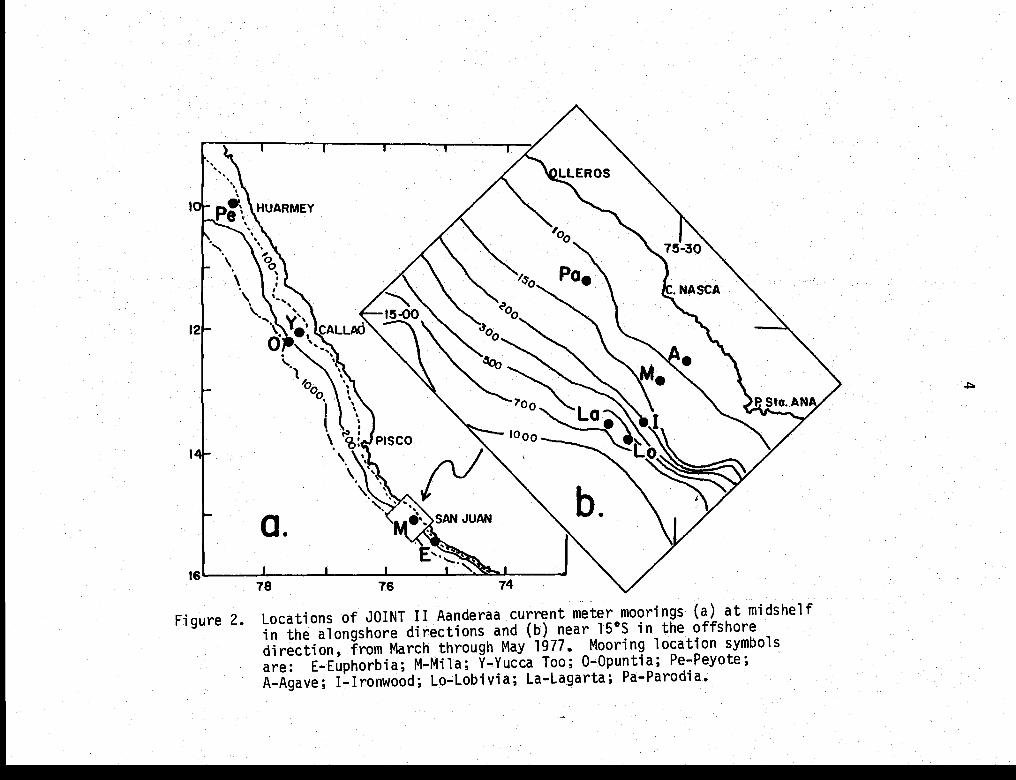
Figure 2. Locations of JOINT II Aanderaa current meter moorings (a) at midshelf
in the alongshore directions and (b) near l5°S in the offshoredirection, from March through May 1977. Mooring location symbolsare: E-Euphorbia; M-Mila; V-Yucca Too; O-Opuntia; Pe-Peyote;A-Agave; 1-Ironwood; Lo-Lobivia; La-Lagarta; Pa—Parodia.

OFFSHORE ARRAYS(15°S)
- MARf
APRf
MAYI464Vt -
I -
ALONGSHORE ARRAYS(tO°—16°S)
I APR 1 MAYI
I I
-I
£VPHOR8/A
I I I—-I --4 -
PARODIAI— -I
_) _____j
- I- -
- YUCCA Too -
- I —I-H i
'I
too -
200 —
300 -
I- — ——.4
Figure 3. Time-depth distributions of JOINT II Aanderaa current meterdata from March through May 1977. Lines are dashed wherespeed and/or direction data are missing.
5
0-
25 -
50 -
75 -
0-25 —
50 -
75 -
100 -
-. MILAI ——-.4
0
25
50
75
100
25
50
75
100
25- II -
50- I -
75 - -100-
I -25
- IRON WOOD -ISO- —
175- I -200 - -
a,
II-a-wa
25
50
75
100
I IU -------- —--
too — I I, —
200- -
300- r- -
L08/ V/A400- 8 -
LAGAR TA500- -
GOC
OPt/NT/A400 -
500 -
600 -
o_j____ I— I
25 -
-I
50-75 - PEYOTE
I
IMARPEMET.

6
Table 1. Summary of positions, water depths and instrument depthsfor instrument arrays deployed by OSU in JOINT II. Thepositions of the meteorological buoysgiven in the installation summaries.from which data were obtained areM: Meteorological buoy; T: Tide
listed.gauge
WaterStation Position Depth (m) Instrument Depths (m)
May — July 1976 (Leg 11)2
July — Sept. 1976 (Leg 111)3
Mila—3 l5°05.8'S 75°30.2'W 28,53,79,104
Oct. 1976 -
Mila-4
March 1977 (Leg IV)3
15°06.O'S 75°30.2'W 119 23,48,73,99
March - May 1977 (Leg V)3
March 1976 - May 1977 (Legs II - V)
IMARPE 12°03.9'S 77°O9.3'W (Height: 25 m above ground)
1 Radar fixes and the German chart DHI2 Satellite Navigator fixes
Radar fixes and theRadar fixes and theRadar fixes and U.S.
6 Radar fixes and U.S.
(not listed) areOnly instruments
March — May 1976 (Leg I)'
Agave 15°02.6'S 75°26.6'W 40 10,29Mjla—1 15°05.PS 75°31.4'W 123 M,28,53,78Lobivia l5°1O.O's 75°39.2'W 656 106,206,406,556,626Islaya l5°OO.O's 75°39.O'W 136 41,66,116Sour 13°55.2'S 76°29.4'W
75°3O.5'W
120
128
80,100
M,33,62,84,109Mila—2 l5°07.2'SLagarta 15°08.7'S 75°39.5'W 465 115,212,312,412Yuca5 l2°04.7'S 77°21.7'W 120
123
80,100
Mila-5 15°06.O'S 75°30.8'W 121 M,19,39,59,80,100,l15Ironwood 15°09..9'S 75°32.g'w 205 M,24,44,63,l05,155,l80,TLobivia 15°11.5'S 75°34.3'W 580 58,83,183,283Lagarta l5°10.O'S 75°36.O'W 620 M,92,115,214,512Euphorbia 15°31.2'S 75°0O.8'W 123 M,25,63Parodia l4°55.7'S 75°39.8'W 124 M,24,64,104Qpuntia2Yucca-Too5
l2°l4.2'S12°04.6'S
77°35.9'W77019.5'W
620117
129,224,324,52437,57,97
Veyote6 9°57.8'S 78°24.3'W 117 37,56,96,T
721
Peruvian chart DHNM 2200Peruvian chart DHNM 2100
chart H.O. 22173chart H.0. 22008

7
Moorings deeper than 250 m followed the Woods Hole Oceanographic Institution
mooring scheme for intermediate depths (Heinmiller and Walden, 1973) with
glass Corning floats for flotation and double acoustic releases.
All of the current meters moored were Aanderaa RCM4's. They recorded
temperature, speed and direction at 15, 20, 30 and 60 minute intervals in
the manner described by Pillsbury et al. (1974). Some current meters also
recorded pressure to monitor the mooring motion and the true mean depths
of the deployed instruments; a few of the instruments were equipped with
conductivity sensors as well.*
Meteorological buoys were moored at MILA during Leg I and Leg II,
and again at MILA, IRONWOOD, LAGARTA, EUPHORBIA and PARODIA during Leg V.
Each buoy consisted of a vertical tower with three toroids for flotation.
The buoys were tethered to concrete blocks and connected by ground lines
to the main anchors of the associated current meter arrays. The buoys were
equipped with Aanderaa data loggers which recorded wind speed and direction,
air temperature, and water temperature three meters below the surface.
A meteorological tower with an Aanderaa data logger was installed
on the roof of the Instituto del Mar del Peru (IMARPE) from May 1976
through part of June, 1977. Wind speed and direction and air temperature
were measured. Data segments between servicings correspond approximately
to Legs II, III, IV, and V of the current meters.
Instrument Recovery and Performance
Twenty-three moorings with a total of 88 RCMts were set during
all the phases of JOINT II (Legs I - V). In 1976 a shelf-break mooring
near 15°S (not shown) was completely lost (four RCM's), as was the deepest
* The conductivity data have not been fully processed and are not presentedin this report.

8
current meter at MILA (Leg 1). In 1977 (Leg V) two moorings (not shown)
were completely lost (8 RCM's). The 75 recovered RCM's successfully
recorded 95% of the possible water temperature data and 87% of the pos-
sible velocity data. The partial data records (no velocity) are indicated
by dashed time-lines in Figures 1 and 2. Table 2 summarizes the data
losses due to and causes of partial or complete instrument failures.
The data logger was replaced at the MILA meteorological buoy during
Leg I. The first data logger recorded no data during a four week period,
and the second one recorded satisfactorily for the remaining 13 days of
the Leg I current meter mooring. The Leg II buoy tore free from its
tether about mid-June 1976.* Thirty-seven days of data were recorded
prior to breakaway (which was determined from the changed behavior of
the buoy orientation sensor).
Calibration
When Aanderaa instruments were first acquired by Oregon State
University, they were subjected to tests to evaluate sensor stabilities.
The initial results (Pillsbury et al., 1974) and subsequent experience
indicate that speed and direction sensors, if not obviously damaged, are
stable in time and adhere reasonably well to the manufacturer's specifi-
cations. Current meter thermistors exhibit (at most) a slight linear
drift with time, correctable through successive calibration. Pressure
and conductivity must be kept in calibration.
In-house calibration procedures have been developed by OSU (Pillsbury
et al., 1974) and the direction, temperature and pressure
* A Peruvian fisherman found it beached just south of the river mouthat Rio Ica, northwest of Cabo Nazca (15°S).

Table 2. Data losses due to instrument failures or fouling, and causes.
AffectedStation Depth (m) Days Lost Cause Channels
0 31 7 clock failure 1, Ta
Yuca II 100 46 3 compass malfunction e
Mila IV 23 20 0 speed sensor malfunction S
Mila IV 73 29 4 rotor fouled S
Mila V 0 64 0 data logger leaked SW, 0W' 1, Ta
Mila V 19 14 9 rotor fouled S
Ironwood V 0 58 6 orientation sensor failure
Lagarta V 0 68 4 compass, air temperature sensor failure Ta
Lagarta V 313 59 4 tape encoder malfunction S, 0, T
Lobivia V 83 19 9 tape encoder malfunction S, o, T, P, C
Lobivia V 383 56 4 tape encoder malfunction S, 0, T
Euphorbia V 103 51 8 tape transport failure S, e, T
Parodia V 24 23 5 rotor fouled S
Parodia V 24 54 5 pressure sensor failure P
Opuntia V 129 66 3 compass failure o
Opuntia V 324 17 7 battery failure 5, e, IYucca Too V 57 40 8 tape encoder malfunction 5, 0, T
S, 0:T, Ta:P, C:
wind speed, directioncurrent speed, directionwater and air temperaturepressure, conductivity

10
sensors are usually calibrated between major experiments (i.e. at about
1-2 year intervals). Undamaged and unfouled rotors are assumed to measure
speed correctly within the manufacturer's limits (calibration is considered
redundant and impractical). Appendix 2 presents a discussion of the status
of water temperature calibrations for the JOINT II Aanderaa current meters
and buoys.
Processing and Description of the Data
The data described in this report were first read from the Aanderaa
magnetic tapes and preliminary plots and statistics generated to aid in
error detection. The data recorded at 15, 20 or 30 minute intervals
(Legs I - III, V) were low passed so as to preserve information at tidal
and smaller frequencies, while reducing point-to—point scatter. The low
passed data were then decimated to hourly values. The details of the
data processing are discussed by Pillsbury et al. (1974). Due to the
long duration of the Leg IV mooring at MILA, the data were recorded at a
one hour sampling interval and were not filtered.
The descriptive materials in this report are ordered depthwise from
top to bottom in a separate section for each mooring; the mooring sections
are ordered by leg, offshore distance and south-to—north distance,
respectively. The header page for each mooring section summarizes
information about the position, offshore distance, bottom depth, and
intervals for each mooring installation. A short table lists pertinent
information about the instruments with columns as follows:
Intended Depth: based on mooring wire lengths and the intended bottom depth.

11
Accepted Depth: based on mooring wire lengths and the mean depth(s)
of one or more instruments as given by pressure sensors.
Serial/Tape Number: serial number assigned by the manufacturer and
the sequence number of the magnetic tape recorded by the
instrument (thus, 485/10 is the tenth tape recorded by
machine #485).
Measured variables: S, 0 = current speed and direction; ow = wind
speed and direction; 1, Ta = water and air temperature;
I', C = pressure and conductivity
A section for comments provides specific information (if any) about
malfunctions and/or the duration, kind and quality of data subsets.
Following the header page is a figure with the progressive vector
diagrams (PVD's) -for the current meters in the mooring. Each current
meter in turn is described by a statistics table; a figure with histo-
grams of speed and direction and the rotary spectrum; and a figure with
time series of onshore (u) and alongshore (v) velocity components,
temperature and pressure (if any).
The PVDts represent pseudo-trajectories referred to East-West and
North—South axes, in kilometers. Each dot on a PVD refers to 0000 GMT
on the corresponding day. Information given in the summary tables can be
used to assign dates to the dots, if necessary.
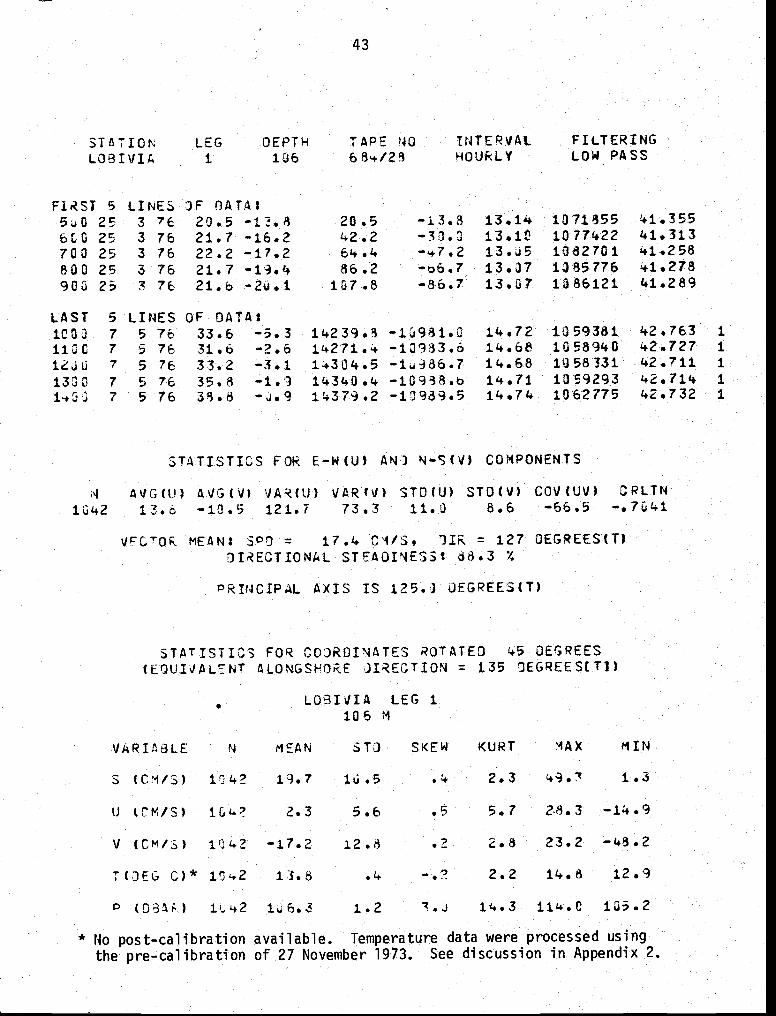
The statistics tables give the following types of information:
Header: identification, time interval, filtering.

12
First/Last 5 Lines: line image listing of first and last five lines of
the data file, to illustrate the format.*
Statistics for E-W (U) and N-S (V) velocity components: velocities are
taken as positive toward the East (U) and North (V).
Vector mean speed and direction
Directional steadiness: the ratio of the vector mean speed to the scalar
mean speed, i.e. the current stability of Neumann (1968).
Principle axis (of variation): given as a compass direction (°T).
Statistics for rotated data: the velocity components are rotated into
the onshore/alongshore coordinate system as defined by the
JOINT II hydrographic sections, and basic statistics are given
for scalar speed, onshore velocity (U), alongshore velocity
(V, positive toward NW), temperature (1), and pressure (P, if
any).
The rotary spectra were computed when the length of a time series
permitted, and are presented with the histograms. The rotary spectrum
was generated from the hourly velocity components (E—W and N—S), typically
for a 2 or 3 month period. The series were divided into detrended segments
(usually two), raw spectral estimates were computed for each segment, and
the results were hanned (once). The procedure was modified according
to record length so as to consistently induce about 10 degrees of
freedom. Rotary spectra and their interpretation are discussed by
Gonella (1972), Mooers (1973) and O'Brien and Pillsbury (1974).
* These normally give GMT hour, date, month, year, east-west velocity (U),north-south velocity (V), cumulative velocities (Eu, Ev), water tempera-ture (T). pressure (P) and conductivity (C). Units are: U, V (cm/secfor currents, rn/sec for wind); T (°C); P (pascals); C (mrnhos). Theactual format will vary depending on the data channels recorded by theinstrument.

13
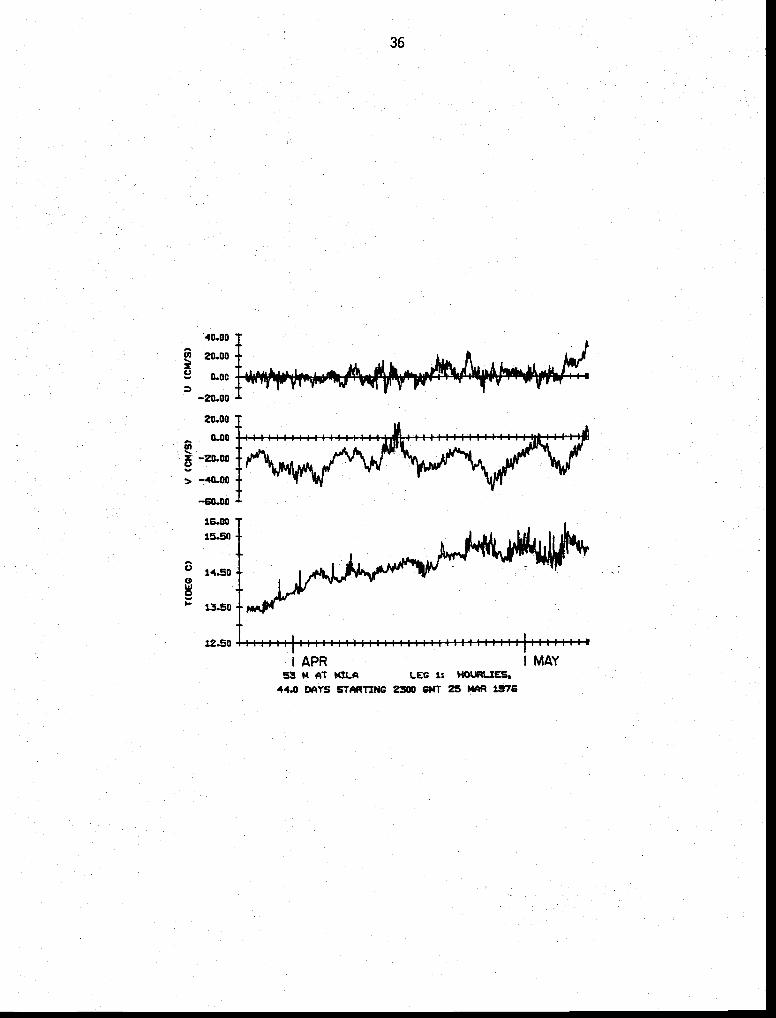
The time series plots are grouped by instruments. These figures
give the onshore and alongshore velocity components, temperature, and
pressure (if any) with time. Abcissa tics are at 0000 GMT on each day
(the first day of each month is indicated).
AC KNOWLEDGMENTS
We gratefully acknowledge the support for this program which came
from the National Science Foundation grant OCE 76-00132. The field
program was managed by R. Still with the aid of B. Moore; D. Baratow
and B. Moore were principally responsible for the calibration; mainten-
ance and preparation of the instruments; and J. Bottero and D. Root
processed the data. Our special thanks and recognition go to these
people for their indispensable assistance.

14
References
Barstow, D. 1978. Calibration of the Aanderaa current meters fortemperature. Exposure. In press.
Barton, Eric D. 1977. JOINT II - R/V THOMAS G. THOMPSON Cruise 108,Leg 1: CTD measurements off the coast of Peru near Cabo Nazca,April—May 1976. IDOE Coastal Upwelling Ecosystems Analysis.Data Report 39.
Codispoti, L. A., D. D. Bishop, M. A. Friebertshauser, and G. E. Friederich.1976. JOINT II — R/V THOMAS G. THOMPSON Cruise 108: Bottle data,April - June 1976. IDOE Coastal Upwelling Ecosystems Analysis.Data Report 35.
Gonella, J. 1972. A rotary component method for analyzing meteoro-logical and oceanographic vector time series. Deep-Sea Res.,19:833-846.
Heinmiller, R. G. and R. G. Walden. 1973. Details of Woods Holemoorings. Woods Hole Oceanographic Institution Technical Report73—71. 19 pp.
Huyer, A., W. E. Gilbert, R. Schram, and 0. Barstow. 1978. Temperatureand Salinity Observations off the Coast of Peru, R/V EASTWARD.23 July - 16 August 1976. School of Oceanography, Oregon StateUniversity. Data Report 69. Reference 78-3.
Mooers, C. N. K. 1973. A technique for the cross spectrum analysisof pairs of complex-valued time series, with emphasis on propertiesof polarized components and rotational invariants. Deep-Sea Res.,20:1129—1141.
Neumann, G. 1968. Ocean Currents. Elsevier Oceanography SeriesVol. 4. Elsevier Scientific Publishing Company, New York.
O'Brien, J. J. and R. D. Pillsbury. 1974. Rotary wind spectra in asea breeze regime. J. App. Met., 13(7):820-825.
Pillsbury, R. D., R. L. Smith and R. C. Tipper. 1969. A reliablelow cost mooring system for oceanographic instrumentation.Limnol. Oceanogr.,, 14:307-311
Pillsbury, R. D., J. S. Bottero, R. E. Still, and W. E. Gilbert. 1974.A Compilation of Observations from Moored Current Meters, Vol. VI,Oregon Continental Shelf, April — October 1972. Oregon StateUniversity, School of Oceanography, Corvallis. Data Report 57.Reference 74-2.
Preller, R. 1977. Nearshore bathymetry map and contoured bottomtopography map. CUEA Newsletter, 6(4):48-50. Coastal UpwellingEcosystems Analysis Program, Duke University Marine Laboratory,Beaufort, N.C.

15
INSTALLATIONS: Leg I (MAM '76)

17
JOINT—Il 1976 Installation
AGAVE I
Posi tion*:Distance Offshore:Bottom Depth:Set:Retrieved:Longest Data Interval:Longest Record Length:
15°02.6'S, 75°26.6'W1.5 km40 m1854 GMT1651 GMT0300 GMT44 days,
Comments:
The mooring position (above) was determined when deck work started.By the time of anchor release (set time) the R/V ALPHA HELIX haddrifted considerably shoreward but a new position was not logged.Accounts of observers suggest that the ship was about one kilometeroffshore when the installation was completed.
* Navigation: radar fixes and German chart DHI—721.
Instrumentation
23 March 1976 by R/V ALPHA HELIX7 May 1976 by R/V THOMPSON24 March to 0900 GMT 7 May7 hours
Intended Accepted Serial Sampling MeasuredDepth Depth Tape # Interval Variables
20 m 10 m 687/20 30 mm S,o,T,P,C40 m 29 m 501/35 30 mm S,O,T,P

—100—240 60
—125
—150
10 METERS AT AQAVE. 44.8 DAYS STARTINC. 2041 23 MAR 76. 2P METERS AT ACAVE. 44.8 DAYS STARTING 2011 23 76.
300 25
180
50
120
75 100 125 150
—120
—'5
—60

STATISTICS FOR E—W(U) AN) COMPONENTS
N AVG(U) AVG(V) VAR•(U) VAR(V) 513(0) STO(V) COV(UV)318.5 22.1 —15J.2 —.3813
VECIOP MEAN: 5P3 = g.e ciis, OIR = —35DIRECTIONAL ST!A3I4ESS 32.0 7.
AXIS IS DEGR€ES(T)
FOR COOROINATES ROTATED '.5
DIRECTION 135 OFGREES(T))
AGA'JF• r
LEG I
N MEAN KURT MAX MIN
S 2.9 53.1 .8
U 1q63 15.9 —.1 2.6 '.1..2 -42.1
V (Cr1/5) 1363 8.9 23.5 —.4 1.8 58.1 —43.5
(DEfl C) 15.5 .7 —.3 2.8 17.4 13.8
rD 13.2 .3 3.6 11.1 9.3
19
STATION LEG JEPTH TAPE 40 INTERVAL FILTERINGMGLVE I HOURLY LOW PASS
FIRST 5 OF DATA:30C 3 76 23.7 —12.'. .23.7 13.97 99296 '+1.910
3 7 26.3 4.9 49.7 —7.5 13.97 100690 '+1.898
2., 3 76 11.1 59.2 3.6 13.97 101306 41.91424 7b —5.9 —14.1 53.4 —13.'. 13.97 1U1276 '+1.92124 3 76 —21.8 —3.1 31.5 —18.5 13.94 101823
LAST 5 LINES OF JATA500 7 5 7b —28.4 16.+ -5522.9 7656.4 16.OL. 101711 43.902bOO 7 5 7o —16.6 —5539.5 7651,4 16.02 131144 '+3.861
5 7 —30.8 19.1 —5570.3 7700.5 16.i4 10i690 43.899
800 7 5 76 —18.3 23.2 —5588.6 7723.7 15.99 130875 '+3.870
903 7 5 7b 7.0 .31.9 —5581.5 7755.6 15.97 100567 '+3.544
2 9.9 —.5

0.16
0.14
0.12
,. 0.10
00.08
II.
0.06
0.04
0.02
0.00
10000
20
10 METERS Al ACAVE. 23 lIAR 76 TO 7 MAY 76. TAPE 687/20.
—3 —2.5 —2 —1.5 —1 —0.5 0 0.5 1 1.5 2 2.5 3
FREOI.UICY, CYCLES PER DRY
,LIICAN
0 7.4 13.4 19.4 25.3 31.1 36.9 42.5 48.1 53.6 59.1 64.4
SPEED, Cr1/SEC
0.06
0.05
0.04
0.03
0.02
0.01
0.000 20 40 60 80 100 120 140 160 180 200 220 240 260 280 300 320 340 360
DIRECTION, DEGREES TRUE
1000
100
10

50.00
30.00
10.00E
-10.00
-30.00
-50.00
60.0050.00
30.00
10.00 -
—10.00>—30.00
17.50
21
iLk.
17.00
16.00
15.00
14.00
UCDw0I-
00.
12.00
10.00I.
I I I IIIJ I I I I I 11111 I I I I 11111
I APR10 M AT AGAVE LEG 1: HOURUESI
44.0 DAYS STAR'rxNG 300 QMT 24 1876
fil IiI MAY

STATISTICS FOR E—W(tJ) AN:J
N
1
AVG(U) AVG( VAR ST)(U) $10 CV) COV(UV) CRLTN—2.3 135.5 11.5 13.6 —79.0 —.4983
VECTOR SPO = .2 GuS, 123 OEGREES(T)STEADI4ESSt 23.5 Z
AXIS IS 143.8 3€GREES(T)
STATISTICS FOR CGOROp'4ATES ROTATED 45 DEGREES(EQUIVALENT ALONGSHORE 135 )EGREEStTJ)
MG AVE
29 MLEG 1
N MEAN SID SKEW KURT MAX MIN
3.7 31.3
Li (CM/S) 163 2.6 28.6
" 4.1 15.5 .5 1.7 30.2 —27.5
T(DE(, C) 163 1. .6 —.6 2.9 16.5 13.4+
P .2 .8 3.5 28.8
22
FIRST 524
4+Ou 2'+500
700 24
STATION LEG CEPTH TAPE INTERVAL FILTERING1 29 531/35 HOURLY LOW PASS
LINES OF flATA:3 7 —13.7 —14.8 —13.7 13.82 294798 13 76 —10.0 —12.3 —24.8 —22.9 294785 23 2.2 —22.5 13.o7 294807 33 7t 16.u 8.5 —6.5 13.51 294796 43 76 11.5 —12.6 4.9 —46.6 13.46 294801 5
5 LINES OF DATAI7 5 76 —10.8 13.4 3746.9 —2471.0 15.59 292931 10597 5 76 —5.5 16.8 3741.4 —2454.1 15.57 292827 10637 5 7t —7.2 3134.2 —2438.9 293344 10617 5 —7.9 3726.3 —2422.8 29333k 1062
5 —8.2 17.6 3718.1 —24U5.3 15.60 293272 1063
LA ST0
6U3'U.803900
S 17.7 5.0 — 1.8

0.14
0.12
0.10
0.08
0.06
30.04
0.02
0.00
0.07
0.06
0.05
0.04
0.03
0.02
0.01
0.00
2329 METERS AT AGAPE. 23 APR 76 TO 7 tIAT 76. TAPE 501/35.
0 4.3 7.4 10.4 13.4 16.4 19.4 22.4 25.3 28.2 31.1 34.0 36.9
SPEED. CA/SEC
IiiI''I-w
a
a
0 20 40 60 80 100 120 140 160 180 200 220 240 260 280 300 320 340 360
DIRECTION. DECREES TRUE
1000
100
10
—3 —2.5 —2 —1.5 —1 —0.5 0 0.S• CYCLES PER OAT
1.5 2 2.5 3

10.00z
-10.003
-30.00
40.0030.00
10.00
—10.00
-30.00
24
30.00
U)
C.) I
17.00
16.50
15.50
WI
14.50
13.50
12.50
APR
1 I i AA
28 M R7 A6AVE LEC 1 HOURUES,44.0 DAYS STARTXNC 300 QMT 24 MAR 1876
I MAY

25
JOINT—Il 1976 Installation
MILA I
Position*: 15°05.l'S, 75°31.4'WDistance Offshore: 12.0 kmBottom Depth: 123 mSet: 1351 GMT 25 March 1976 by R/V ALPHA HELIXRetrieved: 1533 GMT 9 May 1976 by R/V THOMPSONLongest Data Interval: 1700 GMT 25 March to 1300 GMT 9 MayLongest Record Length: 44 days, 21 hours
Instrumentation
Intended Accepted Serial Sampling MeasuredDepth Depth Tape # Interval Variables
0 m 0 m Dl 26/8 20 mm Sw,Ow,Ta,T25 m 28 m 752/21 20 mm S,e,T,P,C50 m 53 m 486/29 30 mm S,o,T75 m 78 m 490/27 30 mm S,O,T
Coments:
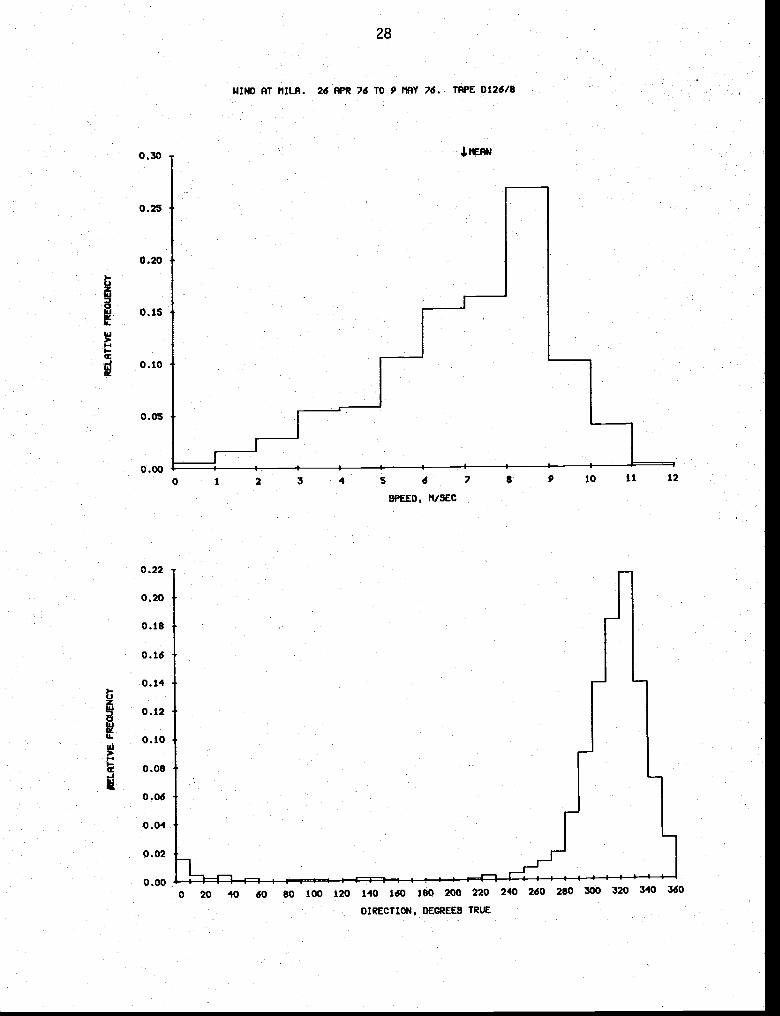
The met buoy at MILA was serviced on 26 April, data logger D129 beingreplaced by D126. While the latter recorded satisfactorily for theremaining 12½ days of the mooring, the data from D129 was unusabledue to a clock failure. The current meter near 100 meters was loston retrieval (fouled in the screw of the R/V THOMPSON).
RCM 490 was installed with the clock cycling every 30 minutes. When itwas recovered the instrument was cycling at 60 minute intervals. Processingwas done assuming that the interval changed from 30 to 60 minutes at asingle point and remained at 60 for the remainder of the record. Thistiming change point was chosen so that the in situ period agrees with thenumber of cycles on the data tape and occurs at 0521 2 April. The 30minute section was decimated to every other point and combined with the60 minute portion to create a single raw file with = 60 minutes.
* Navigation: radar fixes and German chart DHI—721. The position of theMILA I meteorological buoy was estimated to be within ½ n.m. of thesubsurface array.

26
WIND AT tIILA. 13.0 DAYS STARTING 1342 26 APR ?6
5400
2200
1800
-5400 —4500 —3600 —1800 —900
—900

LEG )FPTH
LAST S LINES OF DATAI300 9 5 76400 9 5 76 _7•55QQ 9 5 —7.8600 9 5 76 —7.5700 9 5 7E
TAPE INTERVALHO Ii RI V
FILTERINGLOW PASS
STATISTICS FOR E-W(U) N—S(V) COIPCNENTS
N AVG(\/) VAR(U) VAR(V) 3T0(U) 510(V) COV(UV) C9LTN
3011 —-.3 -,.7 4.0 2.8 '.0 1.7 —.8 —.2419
VECTOR 4EANt = = —+2 CEGREES(T)JIQECTIONML 7.
PRINCIPAL AXIS IS JEGREES(T)
STUCS FOR COORDINATES ROTATED )EGREESALONGSI4JRE DIRECTION = 136
MILAGM
I
VARILY3IE. N MEAN Sb SKEW KURT MAX MIN
7.1 —4.0
'.W 300 16.9 .5 —.1 2.7 18.1 15.7
A (CEG) 300 1.1 .5 .1 2.1+ 1.3 16.7
27
0 !)126/3STAT TO NMILA 1.
FIRST 5 LINES OF DATA!2000 262100 26 4 —3.32200 4 76 —6.62300 26 4 7f.. —5.3
0 27 4 —7.0
1.2 —4.017.81 22.0 —7.8 '.2 18.83
36.0 9.2 18.71 17.5917.32 45.8 —19.7 15.0 18.50
53.8 —26.7 1.9 18.33
5.2 —1274.3 1381.2 17.64 16.8116.73
2962974.8 —1281.3 1336.0 17.53
16.70 2986.3 —1289.6 1392.2 17.5116.71 299—1297.1 1393.o
6.65 303
U (MiS) 300
'I (M/S) 300
2.0 —.6
.2 1.6 .3 3.9
3.0 .8
2.1 —.7 10.3 —1.0
0.22
0.20
0.18
0.16
0.14
0 • 12
0.10
0.08
0.06
0.04
0.02
0.00
28
WIND AT PIILA. 26 APR 76 10 9 MAY 76. TAPE 0126/8
,I,IIERN0.30
0.25
0.20
0.15
0.10
0.05
0.00
g
U
Ii
0 1 2 3 4 S 6 7 8 9 10 11 12
SPEED, N/SEC
0 20 40 60 80 100 120 140 160 180 200 220 240 260 280 300 320 340 360
DIRECTION, DEGREES TRUE

6.00 -r
4.00T
34.
-4.00
12.0010.00
IllIlIlIllIlD
I..
I MAYLEG 1:
2000 GP4T 26 APR 1976
29
—2.00
16.50
16.00
U)I
CDw0I-
(Pw0C
17.00
16.00
15.00
19.50
19.00
17.00
16.00
0 t4 AT P4ILA13 DAYS STARTING

125
25 ft AT 44.p CAV$ 1523 25
-125
125
-'2$
53 11 AT ftILA. 44.5 25 74
375 SCO 425 750
75 ft AT AILS. 44.9 VATS 1421 25 74

31
STATISTICS FOR E—W(U) AN) N—S(V) COMPONENTS
N AVG(U) VARCU) V4R(V) STO(V) COV(U\I) CRtTN1065 17.C —10.2 86.1 191.3 9.3 13.8 —67.5 —.5253
VECTOR MEAM SPO = 19.8 CM/S, DIR = 121OIRECTIONAL STEADINESS: 82.C X
PRINCIPAL IS 154.3 OEGREES(T)
STATISTICS FOR COORDINATES ROTATED DEGREES(EDUI'JALENT 135 £EGRE€S(T1)
H IL A28 M
LEG 1.
VARIA3LE N MEAN STO SKEW KURT MAX MIN
S (CM/S) i.065 9.3 .6 2.9 50.3 1.7
Li (Cr/S) lGbS 8.4 2.7 27.2 —19.0
.4 —50.3
T(0E6 C) tC6S 15.5 .7 —.3 2.6 17.2 13.5
icss 23.3 .5 3C.i+
LEG TAPE NO INTERVAL FILTERINGtIILA 1 28 752/21 HOURLY LOW PASS
FIRST 5 LINES OF DATA:220C 25 3 75 20.5 20.5 —12.6 14.45 289350 '+2.576
25 3 76 16.1 —14.9 36.7 —27.5 14.32 287996 42.390C 26 3 75 15.4 —13.2 52.1 14.23 281487 42.286
2o 3 75 14.7 —13.2 66.8 14.28 278340 42.32526 3 76 14.6 -15.5 81.4 -69.5 14.38 278109 42.413
LAST 5 LINEs OF DATA:20C 9 5 76 —2.5 22.9 18105.9 —10961.5 15.95 278670300 9 5 76 —0.9 21.2 18105.0 15.9C 279760 43.9C3
9 76 1.6 23.b 181ub.6 —10919.7 15.31 279825 '+3.812SuJ 9 5 76 3.Li 20.2 19109.6 10. 99.5 15.35 230613 43.8296CC 9 5 2.3 18112.0 15.33 2822.42 '+3.908
V 1065 —19.2

0.09
0.08
0.07
0.06
0.05
0.04
0.03
0.02
0.01
0.00
0.18
0.16
0.14
0.12
0.10
0.08
0.06
0.04
0.02
0.00
3228 P1 AT PIILA. 25 76 TO P 76. Tf%PE 752/21
1.5 2 2.5 3
6.5 11.7 16.8 21.9 26.9 31.9 36.0 41.? 46.5 51.2 55.9
SPEED, CM/SEC
20 40 60 80 100 120 140 160 180 200 220 240 260 280 300 320 340 360
DIRECTION. DECREES TRUE
1000
100
10
0.1—3 —2.5 —2 —1.5 —1 —0.5 0 0.5
FREQUENCY. CYCLES PER DAY

30.00 -20.00-
—20.00
30.0020.00
0.00
-20.00
> -40.00
-60.00
33
, F, lu-I
17.5017.00
16.00
15.00
U
UiCI-
14.00
31.0030.00
C
9 L8.00
L26.00
I APR28 N AT MILA LEG 1: HOURLIES1
44.0 DAYS STARTING 2200 GP4T 25 MAR 1976
I MAY

STATISTICS FOR E—W(U) ANJ N-S(V) COMPONENTS
N AVG(J) VAR(V) STO(U) 510(V) GOV(UV)1C6'+ 17.1 66.6 93.9 8.2 9.7 —28.9
VECTOR lEAN: SPO = 22.1. CMIS, OIR = OEGREES(T)UIRECTIONAL 92.3
PRT'%JGIDAL AXIS IS j'+7.7 JEGREES(T)
ROTATEO 1+5 DEGREES(EQUIVALENT 135 DEGREESCI))
MILA LEG 1.
53 '1
VARIP3LE N MEMN 313 S$(EW MAX NUN
S (Cl/S) lCo4 2s.0 8.7 .3 2.7 51.1 1.2
U 1C61+ 2.1 7.2 .3 4.5 32.8 —15.1+
.4 .3 3.5 1.4.0
C) 1C6.+ 2.8 15.9 13.3
34
LEG OE°TH TAPE NOSTATION INTERVAL FILTERINGIIILA 1 53 1+36/29 LOW PASS
FIRST 5 LINES OF DuTA .
25 3 7 21.R 18.0 21.8 —18.0 13.38 1
0 2b 376 18.6 —18.8 —36.8 13.36 2100 26 3 76 19.6 —13.3 60.0 —50.2 13.37 3
26 3 76 16.t —16.3 76.1 13.40 4303 26 3 76 17.8 —i.L+.1- 93.8 —80.6 13.51 5
LAST 5 LINES OF DATAZ .
20J 9 5 76 17.8 28.6 18082.3 —15)94.7 15.16 10609 5 76 15.9 29.9 13098.2 —15064.8 15.15 1061
4u3 9 5 76 17.3 27.7 —15Q37.0 15.18 10€250j 9 5 76 17.5 18133.0 15.14 1063b3u 9 5 76 16.i+ 22.2 13149.'. 1L+969.1 15.11 1064
CRLTN—.3651
V (CM/S) lOoL.e

0.03
0.02
0.24
0.22
0.20
0.18
0.16
0.14Ida
0.12I.-
0.10
0.08
0.06
0.04
0.02
0.00
1000
100
10
0.1
35
53 M AT (lILA. 25 ?V(R Pd TO 9 (lAY 76. TAPE 486/29
—3 —2.5 —2 —1.5 —1 —0.5 0 0.5 1 1.5 2 2.5 3
• CICLES PER OAT
0.08
0.07
0.06
0.05
lEAN
0.04
0.01
0.000 6.5 11.7 16.8 21.9 27.0 31.9 36.9 41.7 46.5 51.3 56.0
SPEED, Cr1/SEC
0 20 40 60 80 100 120 140 160 180 200 220 240 260 280 300 320 340 360
DIRECTION. DECREES TRUE
36
40.00
!20.00
0.00
-20.00
-40.00
—60.00
16.00
15.50
6 14.500
13.50
12.50
r' V
I—
______
MAYAPR53 N AT MILA LEG 1: I4OURLIES,
44.0 DAYS STARTING 2300 GMT 25 MAR 1976

5 LINES1700 ?5 3 76
25 3 761900 25 3 76
25 3 76
2130 25 3 76
OF OATA*17.0 —17.3j9•i+
17.5 —15.511.7 —1'j.913.3 —19.8
STATISTICS FOR E—W(U) Ar'4i) N-3(V) COMPCNENTS
N AVG(U) VAR(U) VARW) 310(U) STD('1) COV(t!V)1u77 6'.0 68.7 8.3 —31.9
VECTOR SPO fUR = 13? OEGREES(T)DIRECTIONAL 7.
AXIS IS OEGREES(T)
COORDINATES ROTATED '+5 DEGREESIRECTION = 135 JEGREESCT))
L F N STO SKEW KURT MAX MIN
S 1Z•77
T(DEG &) 1077 .5 —.7 2.9 15.5 13.3
STATION LEGMILA I
DEPTH
37
TAPE '10
78 1+93/27
17.030.1+53.965.678.9
INTERVAI_
—17.3
•
0b.7—86.5
OFLAST S
9uJ 91_000 9
•
1200 q
9
5 765 765 765 765 76
18 • 0
15.512.6
15.3
13.3013.3013.3013.3313.33
lk.8414.3214.311+ • 3714.36
2.22.35. 8
7.
15087.0 —13718.3—13715.6—13709.8
15128.L+
1
2
3
1+
5
10731074107513761077
CRLTN—.1+642
U (CM/S) 1077
7.9
1.0 6.1
'I (CNI/S) —13.9 lu
.3 3.'+ '+6.9 2.9
.0 2.9 17.6 —14.9
.2 3.9 14.7 —(.6.9

0.24
0.22
0.20
0.18
0.16
0.14U0
0.12$1.
0.10
d 0.08
o .os
0.04
0.02
0.00
3878 fl AT fuR. 25 liAR 76 10 9 my 76. TaPE 490/V
0.09
0.08
0.07
0.06
0.05
0.04
0.03
0.02
0.01
0.00
IS.
o 5.7 10.0 14.3 18.6 22.8 27.0 31.2 35.3 39.3 43.4 47.4 51.3
SPEED, Cf/SEC
0 20 40 60 80 100 120 140 160 180 200 220 240 260 280 300 320 340 360
DIRECIII*1, 0EC8Et5 TRUE
1000
100
10
0.1..3 —2.5 —2 —1.5 —1 —0.5 0 0.5 1 1.5 2 2.5 3
FREQUENCY • CYCLES PER OAT

15.50
12.50 111111,11111111111)1111111 111111 I I
I MAY
39
L L.. L Ldi.20.00
0.00
—20.00
20.0010.00
—10.00
;-30.00
-50.00
\t
14.50
wU
I- 13.50
I APR78 M AT MILA LEG 1: HOURUES,
44.0 DAYS STARTING 1700 CV4T 25 MAR 1876

41
JOINT-Il 1976 Installation
LOBI VIA I
15°lO.O'S, 75°39.2'W28.5 km656 m2140 GMT2122 GMT1000 GMT43 days,
* Navigation: Radar fixes and German chart DHI—721
Posi tion*:Distance Offshore:Bottom DepthSet:Retrieved:Longest Data Interval:Longest Record Length:
Instrumentation
24 March 1976 by R/V ALPHA HELIX7 May 1976 by R/V THOMPSON25 March to 1400 GMT 7 May10 hours
IntendedDepth
50 m150 m350 m500 m570 m
AcceptedDepth
106 m206 m406 m556 m626 m
SerialTape #
684/28749/23452/32500/37488/23
SamplingInterval
20 mm20 mm30 mm30 mm30 mm
MeasuredVariables
S,O,T,P,CS,e,T,CS,o,TS,e,TS,e,T

-too
104 NT L(SIVIR. 43.9 OATS STARTING 2224 24 OAR .'d.
206 IETORS AT LORLYtA. 43.9 DOTS STARTING 2229 24
—100 •'?S —50 —25
—25
404 Il AT LOBIVIA. 43.9 DAYS STARlING 2243 24 74—24
504 N AT lAILVIA. 43.9 OATS STaRTING 2341 24 IV& 74
626 0 NT LONIVIA.
—e
12
-d
-U
—24
—DP
-40
—I.
STATISTICS FOR
A\/G(V1—10.5 121.7
E—W(U) AN) N—S(V) COMPONENTS
STOCU) STO(V) COV(UV) CPLTN73.3 11.) 8.6 —66.5 —.7U'+1
MEAN: SOD = 17.'. C'1fS, DIR = 127 OEGREES(T)STEAOINESS' V.
AXIS IS 125.)
STATISTICS FOR COJROI'4ATES ROTATED '+5 DEGREES(EOUIdALThT ALONGSHORE = 135 OEGREESCTI)
I LEG 1106 M
VARIAaLE N SKEW MAX MIN
S (CM/S) 142 19.7 lu.5 2.3 1.3
U 2.3
V (CM/a) —17.2
T(JEG C)* 13.8
5.6 .5 5.? 2.8.3
12.8 .2 2.8 23.2 —48.2
2.2 14.8 12.9
1.2 1'..3 11'+.C
* No post-calibration available. Temperature data were processed using
the pre-calibration of 27 November 1973. See discussion in Appendix 2.
43
TAPE rioLEG OEPTHLOBIVIA I 106
INTERVAL FILTERINGLOW PASS
S LINES OF OAIA25 3 76 20.5 20.5 —13.8 13.14 1071855 '#1.355
bCG 25 3 76 21.7 -16.2 '+2.2 1077422 41.313700 25 3 76 22.2 —17.2 6L+.'+ 13.d5 1082701800 25 3 76 21.7 —13.4 86.2 1.385776
90u 7€ 21.b —2u.1 107.8 —8o.7 13.U7 1086121 41.289
LAST 5 LINES OF DATA:IC3U 7 5 76 33.6 —3.3 14239.8 —10981.0 14.72 1059381 '+2.763 1
11.00 7 3 76 31.6 —2.6 1'+271.'+ —10983.6 14.68 1058940 '+2.727 1
120ü .5 76 33.2 —3.1 14304.5 14.68 1058331 42.711 1
1330 7 5 76 35.8 —1.9 14340.'. —i0988.b 14.71 1059293 42.714 1
7 5 76 38.8 1'+373.2 —10989.5 14.74 1062775 42.732 1

0.08
0.06
0.05
0.04
0.02
0.01
0.00
0.26
44106 tEIERS AT LOBIVIA. 24 APR 36 10 7 APt 76. TAPE 604/28.
0.03
0 5.0 10.4 14.9 19.4 23.0 20.2 32.5 36.8 41.1 45.3 49.5 53.6SPEED. WI/SEC
0.24
0.22
0.20
0.18
0.16
0 20 40 60 80 100 120 140 160 180 200 220 240 260 280 300 320 340 360
DIRECTION, DECREES TRIM
1000
100
10
0.1-3 —2.5 —2 -1.5 —1 —0.3 0 0.5 1 1.5 2 2.5 3
PREO(RNCT, CYCLES PER OAT

45
30.0020.00
'S
-20.00
30.00
10.00tn'S
—10.00
> -30.00
—50.00
15.00
14.00
013.00
12.00
114.00
112.00
2 110.00C0
108.00
106.00
104.00
IAPR MAY106 N AT LOBXVIA LEG lz HOURLXES1
43.0 DAYS STARTING 500 GM? 25 MAR 1976

STATISTICS FOR ANO N—S(J) COMPONENTS
N MVG(U) VAR(U) VAR(V) STD(L) STO(V) COV(UV)1042 2.7 —1.6 159.8 95.9 12.6 9.8 —112.5
VECIOR MEAN: SPO 3.2 CM/S, 121 DEGREES(T)jIRECTIONAL 23.3 7.
AXIS Is 1.27.1. DEGR€ES(T)
COORDINATES ROTATED .5 DEGREESALONGSHORE = 135 JFGREESCTI)
LEG 1.
JA RIABLE N MEAN 510 S<EW '(URT MAX
45.6 .3
U (N/S) .8 3.9 .3 2.7 12.8 —10.3
V (CM/S) 1C42 15.5 1.1 4.0 45.6 —23.1.
T()EG C) .2 .5 2.9 13.6 1.2.6
46
STATION LEG TAPE INTERVAL FILTERING1 206 71.9/23 HOURLY LOW PASS
FIRST 5 LINES OF OA'A:50!3 25 3 76 1.6.6 —9.9 16.6 —3.9 12.81 0 43.946600 25 3 76 17.9 -11.7
3 0
3 763 76 12.85 3 40.979
lAST 5 LINES OF DATA:1000 7 5 76 14.7 —4.9 2774.7 -166?.2 13.25 0 41.353 1
I1JO 7 5 7 10.3 —4.5 27R5.0 —168o.7 13.19 0 41.293 1
7 S 7o 8.1. '+.8 2793.'. —1691.5 13.16 0 41.259 1
7 5 7 7.6 —1b96.7 13.16 0 i+1.262 I
7 5 76 7.8 —5.2 —1701.9 13.18 '.1.282 1
CRLTN—. 9C 84
S lu 42 13.5 9.1 1.

0.10
0.09
0.08
0.07
0.06
0.05
0.04
0.03
0.02
0.01
0.00
47206 PETERS AT LOSIVIA. 24 76 TO 7 76. TAPE 749/23.
0 5.8 10.4 14.9 19.4 23.8 25.2 32.5 36.8 41.1 45.3 49.5
SPEED. Cfl/SEC
0.16
0.14
0.12
0.10
0.08
0.06
0.04
0.02
0.000 20 40 60 80 100 120 140 160 180 200 220 240 260 280 300 320 340 360
DIRECTION, DEGREES TRUE
I-
10000
1000
100
10
0.1—3 —2.5 —2 -1.5 -I -0.5 0 0.9 1 1.5 2 2.5 3
FREQUENCY • CYCLES PER DAT

2C.OU
0.00
-20.00
50.00
U)
10.00
> -10.00
0
w
I-
-30.00
48
h-'..-
—
14.00
13.00
IAPR IMAY206 14 Al' LOBIVIA 1: HOURLIES43.0 DAYS STARTIN6 500 GMT 25 MAR 1576

STATIONLOB IVIA
49
STATISTICS FOR E-WW) AND N—Sty) COMPONENTS
N AVG(U) AVG(V) STD(U) 510(V) COV(UV)101+1 —2.1. 1.2 63.8 20.2 8.0 4.5 -24.3
VECTOR MEANt SPO 2.1+ GuS, DIR = OEGREES(T)DIRECTIONAL STEADINESS: 32.C 7
AXIS IS 114.0 OEGREES(T)
STATISTICS FOR COORDINATES ROTATED 45 DEGREES(EQUIVALENT ALONGSHORE DIRECTION = 135 DEGREES(TJ)
LOBI VIA LEG 1'406
VARIA3LE N MEAN STO SKEW KURT MAX MIN
.1 4.2 20.2 —14.6
.2 3.3 26.1+ -22.0
T(DEG C) 1G'+i .8 —.0 2.4 12.1 8.1,
LEG DEPTH TAPE NO INTERVAL FILTERING1 1+36 1+52/32 HOURLY LOW PASS
FIRST 5 LINES OF DATA:500 25 3 76 11.5 —8.6 11.5 —8.6 11.60 1600 25 3 76 10.3 -9.6 21.7 —18.3 2703 25 3 76 8.3 —9.1+ 30.0 —27.7 11.56 3
8u0 25 3 76 10.6 —7.1. 1+0.6 —34.8 11.60 425 3 76 12.7 —4.2 53.3 —38.9 11.61 5
LAST 5 LINES OF OATAS900 7 5 76 —0.3 .0.6 —2216.1 1229.1 11.05 1037
1000 7 5 76 —0.2 0.7 —2216.3 1229.8 10.94 10381100 7 5 76 —0.6 1.5 —2216.9 1231.3 10.60 10391200 7 5 76 —0.1 1.1+ —2217.0 1232.7 10.52 101+01300 7 5 76 C.'+ 1.. —2216.6 1234.t 16.68 1041.
CRLTN—.6762
S (CM/SI i041
U (CM/S) 101+1
V (CM/S)
7. 6
—.7
5.7 1.1. 4.0 27.7
2.3 8.1
.1

0.1s
0.16
0.1%
0.12
0.10
0.08
0.06
0.04
0.02
0.00
0.10
0.09
0.08
0.07
0.05
0.04
0.03
0.02
0.01
0.00
50406 II AT 1081V1A. 24 76 TO 7 P8W 76. TAPE 452/32
1.5 2 2.3 3
3.9 6.5 9.1 11.? 14.3 16.8 19.4 21.9 24.5 27.0 29.5
SPEED. 01/SEC
0 20 40 60 80 100 120 140 160 180 200 220 240 260 280 300 320 340 360
DIRECTION. DECREES TRUE
1000
100
10
0.1-3 —2.3 —2 —1.5 —1 —0.5 0 0.5
FREQUENCY • CYCLES PER DAY
30.0020.00
—20.00
zC.)
51
- &AiL..
30.00
30.00
—10.00
-30.00
I_i-
!,.r"t
, II y
10.50C,
w
I- 9.50
9.50
7.50
406 N AT LOBIVIA LEG 1: )4OURLIES,43.0 OATS STARTING 500 GNT 25 MAR 1976
MAY

STATISTICS FUR E—W(U) AND N—S(il)
AVG(tJ) VARtV) 310(U) STO(V) COV(UV).6 13.9 3.7 5.9
MEAN: = .7 C'1/3, JIR = 123DIRECTIONAL 12.7 X
PRINCIPAL AXIS 13 1o2.i DEGREES(T)
STATISTICS FOR CCORCINATES ROTATED 45 OEGREES(EQUIVALENT ALONGSHORE DIRECTION = 135
LOBIVIA LEG 1556 1
N MEAN STO SKEW KURT MAX uN
(CM/S)
U (CM/S) .2 4.1 3.3 13.8 —15.3
V (Cti/S) 4.0 16.3 —21.5
T(JEç, C) 7. .3 .6 3.3 8.7 6.6
52
LEG JEPTH TAPE '10 INTER44L FILTERINGI 556 500/37 PASS
FIRST 5 LINES OF DATA:25 3 76 4.9 —7.7 —7.7 7.46 1
7G0 25 3 i6 4.3 —6.1 9.2 —13.8 7.57 28u3 25 3 76 1.9 —6.0 11.1. —19.8 7.66 393C 25 3 76 2.5 —4.9 13.6 —24.7 7.79 4
25 3 76 3.5 —5.3 8.1C S
LAST 5 LINES OF7 5 7 5.1 —15.7 653.6 —.342.3 7.55 10367 5 76 7.0 —1!J.l 660.6 —3,2.47 7
5
7 5 76 2.8 669.9 1010
N CRLTN—. 3376
5.9 3.8 1.4 22.6 .2
—.7 5.6 —.1

DE
NS
ITY
RE
LRT
XV
E F
RE
OU
EN
CT
RE
IRT
IVE
00
8a
00
00
—0
00
00
00
00
0—
CO
hia
hia
'4
0
o0
00
00
0p
00
0•O
00
00
00
00
0-
o—
wa
hia
a'0
0
hi hi hi hi hi C, hi
.4 0 a 0 8 CO 0
I 0 n C,
CO a 0 hi a 0
hi hi a a hi a a hi a hi a
a hi 'a

20.00
00I-
54
20.00
0.00
-Z0.00
iii •i • . & _&_I_•&_•
& r -I
6.00
6.00
7.00
6.00
556 N AT LOBIVIA LEC t: HOURLZES
43.0 DAYS STARTZNG 600 6MT 25 MAR

STATISTICS FOR E—W(U) AND N—S(V) COMPONENTS
N AVG(U) VAR(tJ) VAR(V) STI(U) STD(V) COV(tJV)1C+1 —.2 -1.3 33.7 2.2 5.8 3.5
VECIOR SPO 1.3 CI'S, DIR = OEGREES(T)DIRECTIONAL STFAOI'4ESS* 21+.2 Z
PRINCIPAL AXIS IS 6.7 OEGREES(T)
STATISTICS FOR COORDINATES ROTATE.D DEGREES(FIUIVALENT ALONGSHORE = 135
LO3IVIA LEG 1626 M
N MEAN STO SKEW KURT MAX MIN
'
C) 6.6 .3 .6 3.6 7.9 5.9
55
STATION LEG DEPTH TAPE NO INTERVAL FILTERINGI b26 LOW PASS
FIRST E LINES OF OATA*500 25 3 76 —1.0 —1.0 6.85 1
25 3 76 2.1 1.1 6.63 2
70u 25 3 76 2.5 2.2 3.6 —1.8 6.71 3
8u0 3 76 —0.3 —2.1 k
900 25 3 76 3.5 —ie.9 6.69 ,LAST S LINES OF DATA900 7 5 76 —0.2 —8.9 —203.0 —1293.8 6.52 1037
IDuG 7 5 76 —3.1 —10.7 —206.2 —1334.6 6.68 1U387 5 76 —1.7 —8.1 —1312.6 6.42 1039
1200 .' 5 76 —3.2 —11.2 —208 .1 —1323.8 10401300 7 —i'+.1 —2u9.7 —1337.9 6.63 1041
CRLTN. 2729
S (CM/S) 1341
U 1041
V (CM/S)
S. 4
—1.1
—.8
3.3
4.8
1.0
—.7
.1
2.9 11.7 —18.5
.5 8.5 16.3 —13.4

0.12
0.10
0.08
0.06
0.04
0.02
0.00
0.12
0.10
0.08
0.04
0.02
0.00
56626 M AT LORIVIA. 24 1118 76 TO 7 my 76. TAPE 488/22
-3 —2.5 -2 -1.5 -1 -0.5 0 0.5 * 1.5 2 2.5 3
rREOUENCT • CTcLES PER OAT
J,.tnw
3.4 S.d
SPEED. CM/SEC
14.3 16.4 18.5 20.7 22.8
0 20 40 60 80 100 120 140 160 180 200 220 240 260 280 300 320 340 360
DIRECTION • DECREES TRUE
100
10
0.1

20.00
0.00
-20.00
0—20.00
57
hi. -
20.00
0.00
I r"r9' . I
•
7.00
0
5.00
IAPR IMAY62S '4 AT LO8IVXR LEG 1: HOURLIES,
43.4 DAYS STARTING 500 GMI 25 MAR 197S

59
JOINT—Il 1976 Installation
ISLAYA I
Posi tion*:Distance Offshore:Bottom Depth:Set:Retrieved:Longest Data Interval:Longest Record Length:
Instrumentation
15°OO.O'S, 75°39.O'W17.0 km136 m1838 GMT1345 GMT0200 GMT42 days, 4 hours
25 March 1976 by R/V ALPHA HELIX7 May 1976 by R/V THOMPSON26 March to 0500 GMT 7 May
Intended Accepted Serial Sampling MeasuredDepth Depth Tape # Interval Variables
25 m 41 m 682/31 20 mm S,o,T,P,C50 m 66 m 489/30 30 mm S,O,T
100 m 116 m 686/29 20 mm S,O,T,P,C
* Navigation: Radar fixes and German chart DHI—721

41 P1 RI I$IRYA. 42.7 0013 1953 25 IVUR
-600
66 N AT ISL.RYR. 42.7 0013 310#TIW 1940 25 76
60
70
—75 75 040 210 280
-70
—040
—210
-280
-550
-420
-490
016 Ii Al 150.010. 42.7 0015 1957 25 76
125
575 500 625
500 400
-500

FOR E-W(U) N—S(V)
N AVGU) VAR(Va STO(U) 510(V) COV(UV) CRITN
1012 —12.8 11.5.4 151..3 10.9 12.3 —L#9.9 —.3729
MEAN SPC 20.0 Ci/.S, = 133OHECTIONAL STEAOINESS' Z
AXIS IS 144.1.
STATISTICS COORDINATES '+5 DEGREES
(EOIJj'IALENT ALONGSHJRE DIRECTION = 1.35 CEGREES(TI)
'+1 '1
t.EG 1
VAkIABLE N dEAN STO SKEW KURT lAX MIN
S 1.012
U 1.012
23.7 10.4
1.8 9.2
.7 2.8 55.6 3.9
.1. 2.8 26.0 —21.4
4.2 40.3
IONISLAYA
61
DEPTH TAPE .40682/3i.
LEG1 HOURLY
FILTERINGLOW PASS
S LINES OF OATA405712 '+1.838
2CC 26 3 7 1€.7 —12.6 16.7 —12.6 13.814141.739
300 26 3 76 15.1 —12.3 31.841.932
'+dJ 26 3 76 15.5 —7.8 —32.7 13.93'+04257 42.144
SJC 26 3 76 16.9 —14.0 b14.2 —37.b 114.15'+05208 141.998
600 26 3 76 17.1 —7.6 81.3 —45.1 13.98
LAST 5 LINES OF DATAI43.367
iCC 7 5 76 12.9 1.2.8 —13326.2 15.3543.39220u 7 5 76 11.9 10.9 —13015.3
15.51 405586 43.4573LC 7 5 6 11.8
405948 43.4627 5 7 12.1 Q.9 —12994.9
15.48 43.44147 5 76 lu.4 9.6 15546.8
'1 (C 1/5) 13.6
T(JEG 1)
—.1
1S.1 .7 —.2
F (05Ak.) 4.3.6 .3 1.1
2.7 15.3 —55.4
2.5 16.8 13.6

DE
NSI
TY
RE
LA
TIV
EF
RE
OU
EN
CT
RE
LA
TIV
EF
RE
QU
EN
CY
a
;--
g0
00
00
00
00
00
00
00
00
0
0
0 M 0 0 0 g p0 0
0
0 0 p4 0(a ((
I
(a 'a
'I '4 0 a '4
(ap.
,-D
.s
0 0
0. a C' a C'
'4 0. '4S
4-
a p.,
'-I

30.00
10.00I-10.00
-30.00
20.00
0.00
> -40.00
-60.00
17.00
0
0
23.00
43.00
43.00
•
63
14.00
C0
I APR43 N ISLA'rA LEC 3. HQURL.lESa
42.0 STARTINC 200 GMT 26 1876
MAY

STATISTICS E-W(U) AND t4—S(V) COMPONENTS
N AVGU) VAR(tJ) VAR(V) 510(U) STO(V) COV(UV)1012 13.3 —14.5 61.5 98.3 7.3 9.9 —33.6
SPC 1.9.7 CIfS, JLk = OEGREES(T)DIRECTIONAL 90.5 X
PRINCIPAL AXIS IS DEGREES(T)
STATISTICS FOR ROTATED '.5 DEGREES(EQUIVALENT ALONGSHOR€ DIRECTIJN 135 QEGREESCTI)
ISLAVA LEG 166 M
VAPIA3LE N MEAN STO SKEW KURT MAX MIN
S 21.8 .6 2.7 50.1 3.7
U (CM/S) —. y
.7
.2 2.5 —17.0
.1 3.2 12.6 —49.9
C) 1J12 1+.5 .5 2.7 is.a 13.3
64
10 NISLAY A I
LEG DEPTH TAPE NO66
FIRST 5 LINES OF DATA:26 3 76 8.5 —16.7
300 26 3 76 8.7 -16.2400 .3 7b 7.7530 26 3 76 9.5 —15.36CC 26 3 76 12.6 —14.6
I NT ER \l ALHOURLY
—16.7 13.34—32.8 13.39—t0.3 13.43—65.6 13.47—80.2 13.64
LAST
0
300
5 LINES7 5 767 5 767 5 76
5 767 5 76
8 .5
17.22i+ .934.447 .0
l31+Q3 .0
.413426.9
13S'9.6
OF DATA:11.511.4
11.311 • 4
8.03.6
—1.0
2.3
i4720.6—14721.6—14721.1
713.7
FILTER INGLOW PASS
1
2
3
4
5
10081009101010111012
GRLTN-.4324
15.1915.11
15.3715.
V .CI/S) 1012 —19.?

SP
EC
TR
AL
DE
NS
ITY
RE
LAT
IVE
FR
EQ
UE
NC
YR
ELA
TIV
E F
RE
OU
EN
CY
0 0 a 0 4. 0 0 0 0
0 —
N I,—
00 4. N'4 0 0 C
4 0 0
'4 Cli a 0 CA a 'I '4 'I' .4 'A 0, 0
0—
0—
0—
00
0
'9 'A
0000
0000
0???
20
00
0P
PP
P2
p0 N 'a 2?
a 0 a
U '9 'S U
a 4. Cii r 4. '4 CA
4.-
.4 a -I4.
0 a a 4. •0 '4 0

-20.00
20_Do10_DO
-30.0O
-50.00
LEC lx HOUMUES.zoo OMY 26 MAR 1876
66
y 'V 'PWV 1•
C,
0-pI-
14.50
13.50
2.2.50
IAPR IMAY66 N A7 XSLA'YA
42.0 DAY$ ETARTZNO

LAST 5
lOu 7
200 777
500 7
STATISTICS FOR E—W(U) N—S(V) COMPONENTS
N AVt,(U) AVG(V) VMR(U) VAR(V) STO(U) STO(V) COV(UV) CRLTN1j12 5.9 —12.0 36.3 99.3 6.0 10.0 —314.1 —.5680
VECTOR MEANS SPO j7,4 OIR = OEGREES(T)OIRECTIONAL STEADINESS: 85.5 Z
PRINCIPAL Is 156.4 DEGREESCI)
STATISTICS FOR COORDINATES ROTATED 45 DEGREESALONGSHORE JIRECTION = 135 OEGREEStTI)
ISLAVA116 M
LEG I
N MEAN STO SKEW KURT MAX MIN
S (CM/S) 1u12 15.7
U (CM/S) —L•3
(CM/S) —12.7 10.1
.6 2.7 42.4 1.8
.0 2.9 114.1 —22.5
.2 2.9 —39.5
TLDE(, C) 1 —.2 2.3 14.9 13.2
P (OEAR) 1012 116.2 .2 .2 6.2 117.0 115.7
67
STATION LEG DEPTH TAPE NO INTERVAL FILTERINGISLAVA 1 116 HOURLY LOW PASS
FIRSI S LINES OF OATA:200 26 3 76 9.14 —13.1 9.1+ —13.1 13.19 1158814 41.112
26 3 76 9.9 -11.8 19.3 —25.0 13.19 1158100 41.1114u0 3 76 6.5 —11.1 25.8 —36.u 13.19 1156858 41.1155u0 26 3 76 .3.9 —13.6 29.7 13.21 1157717 41.141
26 3 76 14.2 -15.2 33.9 —64.8 13.23 1158693 1+1.154
LINES5 765 76S 7€.
5 765 76
OF OATA0.2 —13.03.9 —11.6'+.6 —10.95.0 —10.1
—9.9
5977.65981.4 —12151.75986.1 —12162.65991.1 —12172.75996.2
14.63
14.6k14.6314.63
1161481116i5•1+7116138311620861162050
.42.49442.1+8842.4831+2.51042.506
8.3
5.8

0 20 40 60 80 100 120 140 160 180 200 220 240 260 280 300 320 340 360
DIRECTION, DECREES TRUE
68116 II AT ISL.AYA. 25 76 10 7 26. TAPE 686/29
0.07
0.06
0.05
0.04
0.03
0.02
0.01
0.005.1 9.1 13.0 16.8 20.6 24.4 28.2 31.9 35.6 39.3 42.9 46.5
SPEED, CM/SEC
0.20
0.18
0.16
0.14
0.12
0.10Is.
0.08
0.06
0.04
0.02
0.00
1000
too
10
0.1—3 —2.5 —2 —1.5 —I —0.5 0 0.5 1 1.5 2 2.5 3
CTCLES PER 0441

20.003.0.00
-30.00 -
20.00
0.00x
—40.00
15.00
14.50
13.50
— 117.00116.00
9a. 3.14.00 1.11 1111111 liii
IAPR IMAY316 14 AT ISLAYA LEG HOURLIES,
42.0 DAYS STARTING 200 GM? 26 MAR 3.B76
69
I. - n. L H .t . .
______
C,w
12.50


71
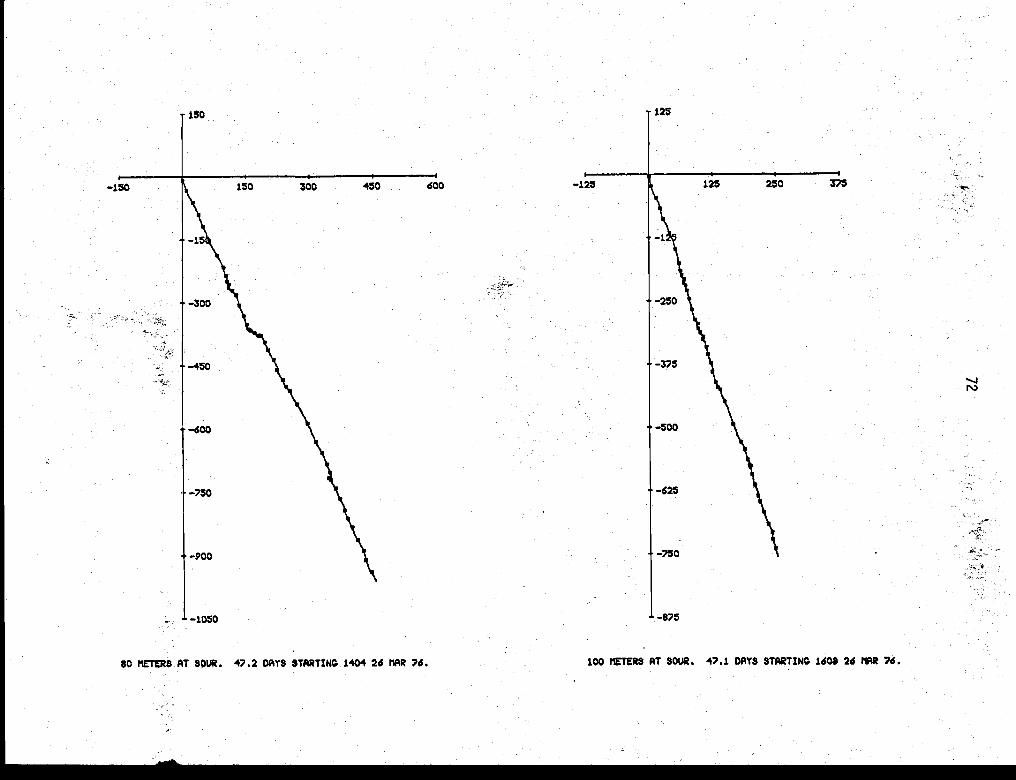
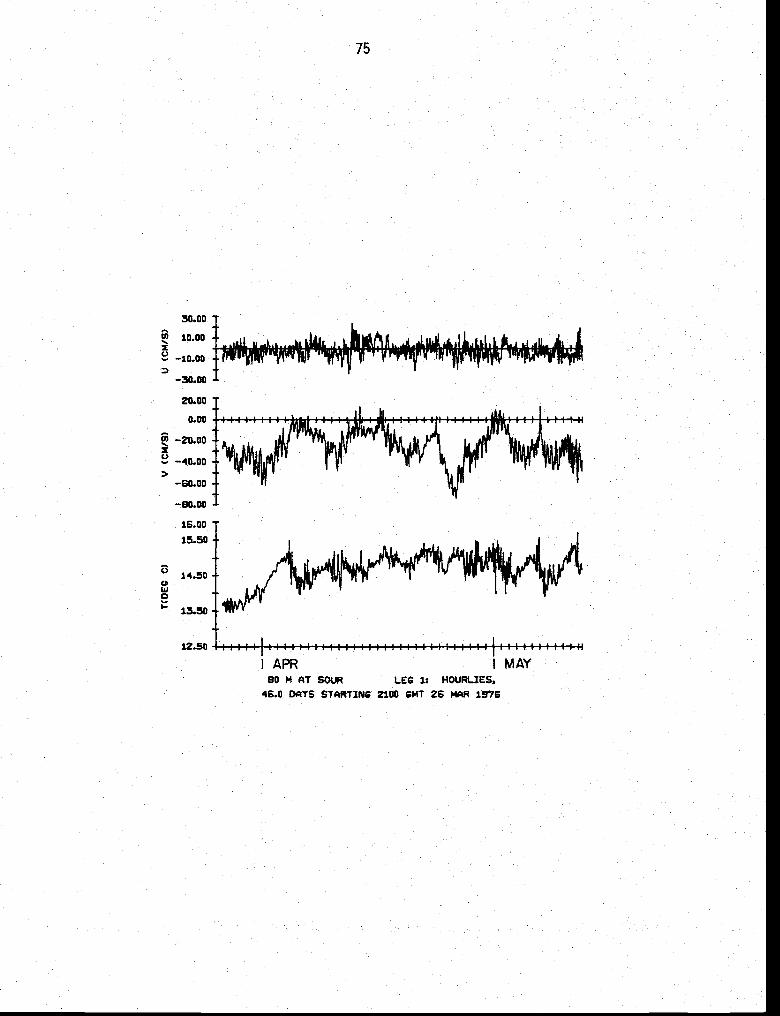
JOINT—lI 1976 Installation
SOUR I
Position*: 13°55.2'S, 76°29.4'WDistance Offshore: 10.8 kmBottom Depth: 120 mSet: 1302 GMT 26 March 1976 by R/V ALPHA HELIXRetrieved: 1855 GMT 12 May 1976 by R/V THOMPSONLongest Data Interval: 2100 GMT 26 March to 1100 GMT 12 MayLongest Record Length: 46 days, 15 hours
Instrumentation
Intended Accepted Serial Sampling MeasuredDepth Depth Tape # Interval Variables
80 m 80 m 453/38 30 mm S,O,T100 m 100 m 498/31 30 mm S,o,T
* Navigation: radar fixes and German chart DHI-72l.
—P00
IIETERS AT SOUR. 4.1 DAYS STARTING 1608 26 MAR ?6.
¼ —
t25
450 600 —125 125 250
—?50 —625
— —1050
50 METERS AT SOUR. 47.2 DAYS STARTING 1404 26 MAR 76.
—750

SOUR
STATISTICS FOR E-W(U) AN) N—S(V) COMPONENTS
N AVG(U) AVG(\I) VAR(U) VAR(V) 310(U) STO(V) COV(CV)iliq 11.2 77.5 8.8 14.1 —67.9
VECTOR MEAN: $PO = 26.1 DIR = 155 DEGREES(T)DIRECTIONAL STEADINESS! 93.5 X
PRINCIPAL AXIS IS OEGREES(T)
STATISTICS COORDINATES ROTATED 30 DEGREES(FQUTVALENT ALONGSHOPE 150 CEGREESCTI)
SOUR LEG 180 M
N MEAN 310 SKEW KURT MAX MIN
S (CM/S) L11 27.9 13.4 3.1 73.9
U (CM/S) 1119 —2.1
V 1119 —26.. 15.1
.3 3.1 23.2 —24.1
—.2 3.0 12.2 —73.8
C) 1119 .4 —.8 3.2 15.7 13.5
73
LEG DEPTH TAPE INTERVAL FILTERINGI HOURLY LOW PASS
FIRST 5 LINES OF DATA!210u 26 3 76 6.7 —28.4 6.7 13.71 1
26 3 76 1.2 —2e.2 7.9 —56.6 13.65 2
26 3 76 8.9 16.9 —31.4 13.7C .3
0 27 3 76 3.7 —24.0 20.6 13.67 4
iOU 27 3 76 4.2 —21.7 24.8 —127.1 5
LAST S LINES OF DATA:12 5 76 23.1 —36.+ 12421.8 —26211.6 14.74 111512 5 76 15.9 -43.8 12437.7 —26255.5 14.76 111612 5 7. 27.0 —40.) —26fl5.4 14.86 111712 5 76 21.2 12485.9 —26336.1 111312 S 7b 9.7 —39.3 12495.7 1119
CRLTN—.5456
7.0

0.12
0.10
0.083-
0.06
0.04
0.02
0.00
0.30
0.25
0.20
0.15
0.10
0.05
0.00
74
80 PETERS AT SOUR. 26 IffiR 761012 P811 76. TAPE 453138.
—3 —2.5 —2 —1.5 —1 —0.8 0 0.5 1 1.5 2 2.5 3
FREQUENCY, CYCLES PER DAY
8.? 16.0 23.2 30.3 37.3 44.1 50.9 57.5 64.0 70.4 76.? 82.9
SPEED, CD/SEC
0 20 40 60 80 100 120 140 160 180 200 220 240 260 250 300 320 340 360
DIRECTION • DECREES TRUE
1000
100
10
30.00
10.00T
—10.00
—30.00
20.00
0.00
-20.00x
—40.00
—60.00
-80.00
16.00
15.50
14.50
75
C,w
I- 13.50
I APR90 M AT SOUR LEG 1: HOURUES,
46.0 DAYS STARTING 2100 GMT 26 MAR 1976
I MAY

STATISTICS FOR E—W(U) ANJ COMPONENTS
AVG(tJ) AVG(V) VAR(U) VAR(V) 510(U) STO(V)6.2 —18.S 158.7 o.7 12.6 —1+1.2
VECTOR MEANZ SPO = 19.6 C1I3, DIR = 162 OEGREES(T)DIRECTIONAL 92.0 Z
F-RINCIPAL AXIS IS 162.1 OEGREES(T)
STATISTICS COORDINATES ROTATED 33 DEGREES(EDUIVALENT ALONGSHORE DIRECTION = 15C )EGREES(T])
LEG 1103 M
N STO SKEW KURT MAX MIN
(CM/S) 1117 21.2 11.6 1.2 4.9 70.0 1.3
IJ (CM/S) 1117 6.1
'I 1117 —19.2 12.9
3.5 19.2 —22.4
4.4 19.6 —69.i
T(DEG C) 1117 .'+ —.5 2.5 15.5 13.4
76
FILTER INGLOW PASS
LEG OEPIH TAPE INTERVALSOUR 1. HOURLY
FIRST 5 LINES OF DATAZ26 3 76 3.7 3.7 —14.6 13.56 127 3 76 1.2 4.9 —29.1 13.59 2
IOC 27 3 76 0.2 tc.8 5.2 1+1.9 33 Tb —1.b 3.6 —5o.k 13.59 '.
3u0 27 3 76 —14.8 4.3 —71.2 13.60 5
LASt 5 LINES OF 0414:700 12 5 76 6.u —25.1 —20581.7 14.41. 1113800 12 5 76 5.5 —32.2 —20613.9 11+.51 111'.903 12 5 76 15.3 —35.4 6866.8 —20649.3 1115luuO 12 5 7. 17.9 37.5 1L4..b2 11161100 12 5 76 16.7 —32.5 6901.4 —213719.1+ 14.61 1117
N
1117CRLTN
—.4905
—

0.00
0.24
0.22
0.20
0.18
0.16
0.14
0.12
0.08
0.06
0.04
0.02
0.00
77
100 METERSATSOUR. 26 MAR 76 TO 12 MAT 76. TAPE 498/31.
—3 -2.5 -2 -1.5 -1 -0.5 0 0.5 1 1.5 2 2.5 3
FREQUENCI • CYCLES PER DAY
IN0.12
0.10
0.08
0.06
0.04
0.02
8.2 15.1 21.9 28.6 35.2 41.7 48.1 54.4 60.6 66.? 72.? 78.5
SPEED. CA/SEC
0 20 40 60 80 100 120 140 160 180 200 220 240 260 280 300 320 340 360
DIRECT IDA, DECREES TRUE
1000
100
10
0.1

1 APR100 14 AT SOUR LEG 3.: HOURI.IES,
46.0 DAYS STARTING 2300 6147 26 MAR 1376
78
. Ikiia20.003.0.00
-10.00
-30.00
20.003.0.00
—10.00
-30.00
> —50.00
—70.00
15.50
14.50C,
UUi0
3.2.50 I III 1111111111111111 iii itiMAY

79
INSTALLATIONS: Leg II

81
JOINT—lI 1976 Installation
MILA II
Position*: 15°07.2'S, 75°30.5'WDistance Offshore: 12.0 kmBottom Depth: 128 mSet: 1416 GMT 10 May 1976 by R/V THOMPSONRetrieved: 1353 GMT 27 July 1976 by R/V EASTWARDLongest Data Interval: 2100 GMT 10 May to 0600 GMT 27 JulyLongest Record Length: 81 days, 14 hours
Instrumentation
Intended Accepted Serial Sampling MeasuredDepth Depth Tape # Interval Variables
0 m 0 in 0124/12 20 mm Sw,Ow,Ta,T25 m 33 m 682/32 20 mm S,o,T,P,C50 m 62 in 749/24 20 mm S,O,T,P,C75 m 84 m 489/31 30 mm S,e,T
100 m 109 in 686/30 20 mm S,e,T,P,C
Coments:
MILA II was equipped with a meteorological buoy (0124) which apparentlytore loose from its mooring during a period of strong winds. A localfisherman discovered the buoy on the beach just south of the Ica Rivermouth, and personnel from the Pisco fisheries (IMARPE) laboratoryrecovered it. The data from the buoy orientation sensor clearlyindicated when the buoy began to drift, therefore 37 days of datawere salvaged. The mean direction for the MILA II wind record was moreonshore than for the shorter MILA I record, but the vector mean directionsare similar for the several-day periods before and after the buoy wasserviced (see the PVDts). The MILA II water temperature (3 m) did notagree with the pre-calibration and is about 1.1°C cooler than thehydrographic (CTD) observations at the beginning, and about 1.9°Ccooler at the end of the record. The data were not corrected. The CTDvalues are included on the time series plot for comparison.
* Navigation: Satellite navigator. The position of the MILA IImeteorological buoy was estimated to be within ½ n.m. of the subsurfacearray.

0.20
0.18
0.16
0.14
0.12
! E0.04
0.02
0.00
0.20
0.18
0.16
0.14
0.12
0.10
0.08
0.06
0.04
0.02
0.00
82
RT MILR 2. 10 76 — 16 76. TAPE 0124/12.
91'€ED.
OIRECTtON, OEGREE3 TRUE
0 1 2 3 4 5 6 7 8 9 10 11 12 14 15 16
0 20 40 60 80 100 120 140 160 180 200 220 240 260 280 300 320 340 360

83
AT MILA 2. 10 MAY 76 — 16 TAPE 0124/12.
7500
5000
20000
17300
15000
12500
10000
2500
—12500 —10000 —7500 —5000 -2500 2500
-2500

N MEAN STJ SKEW MAX uN
S 7,fl 2.3 —.2 3.3 13.3 .9
U (M/S) 382 2.0 .3 2.3 ., ,,.',V (M/S) —.1 2.3 12.9 -1.3
15.6 2.6 17.3 13.0
TA 17.2 2.7 13.7 15.7
* Post- and pre-calibrations do not agree and data do not agree withdo casts. See coments on installation sumary and in Appendix 2.CTD values are plotted with the time series for comparison.
84
STATION LEG DEPTH TAPE INTERVAL FILTERINGMILA ? 0 0124/12 H3UFLY LOW PASS
FIRST S2200 10
LINES5 76
OF DATA:—4.3 7.2 .2 17.5€ 15.51+ 1
2300 tO 5 76 —4.1 7.1 —8.4 114.3 17.46 15.1+9 20 11 5 76 5.1 19.'+ 17.1+0 15.49 3
100 11 5 —5.1 5.3 —19.9 24.7 17.28230 ii 5 7c —3.9 5.7 —23.7 30.4 17.24 15.1+5 5
LAST 5 LINES DF DATA:1130 16 6 76. —4.0 —2776.4 5261.1 15.83 13.80 8781200 16 6 76 —2.5 14.1 —2775.9 52o5.2 15.36 13.80 8791300 16 6 76 —3.6 3.1+ —2782.5 5268.6 15.94 13.80 8801400 16 6 76 4•7 5273.3 16.00 13.00 8811530 16 6 7.2 —2785.5 5280.o 16.12 13.85
STATISTICS FOR E—W(U) AND N—Sly) COMPONENTS
N AVG(U) AVG(V) 313(U) STO(V) COV(UV)882 —3.2 6.0 i4..3 .5 2.1 2.1 —1.2 —.2730
VCC'OF.. SPC = 6..8 uS, DIR = —27 DEGREES(1)DIRECTIONAL ST5AOINESS* X
PRINCIPAL AXIS IS 137.0 DEGREES(T)
COIROINATES ROTATED '+5 DEGREESAt.ONGSHOP! = 135 11)
MILA LEG 2OM

85
II III•I.
6.00
—' 4.00U)S..I—. 0.00
—4.00
14.00
10.00
6.00
> 2.00
—2.00
17.50
16.50
15.50
0
14.50
13.50
12.50
15.00 -
18.00
(p
9 17.00
16.00
15.00
CTD TEMPERATURE OBS
JUN
O M AT MILA LEG 2:DAYS STARTING 2200 CMI 10 MAY 1976

—375
-175 175 350
-350
-525
33 11 AT MILA II. 77.9 0015 S1ARTING *453 10 ARl 76 62 II AT NIL II. 77.9 OATS STARTING 1439 ID ART 76
175
&
-?00
$4 1* AT IIILA II. 77.9 OATS STARTING 1510 *0 ART 76 109 N AT NILA II. 77.9 OATS STARTING 1427 *0 ART 76
125
—125
-250
100
co
-300
-400

N
1.
STATISTICS E-W(U ANO N—S(V) COMPONENTS
AVG(U) VAR(U) VAR(V) 510(U) STD(V) CO'I(UV) CRLTN—2.3 19.3 19.6 —.7677
VECTOR MEANS = 8.3 CM/S, hR = 136 OEGREES(T)OIRECTIUNAL STEAOHESS' 31.3 7.
PRINCIPAL AXIS IS DEGREES(T)
FOR COOPUINATES R3TATEB 45 BEGREES= 135
MI LM
.33 i
LEG 2
N MEAN SIB SKEW KURT MAX M IN
S 25.'+ 12.2 .9 73.7 2.1
U 9.5 2.7 32.7 —28.4
V ,, 2.1 59.C —71.6
C) 16.7 .9 ..4 3.3 19.2
c 1853 33.6 .5 1.5 4.9 35.9 32.9
87
STATION LEG BEPIW TAPEMILE 2 33 69,2/32 dOURLY LOW PASS
FIRST 5 LINES OF OATA:2103 lu 5 76 9.t+ 11.8 9.4 11.8 15.83 338193 43.77422u8 lu 5 76 11.8 20.1 23.6 15.35 33805723u3 5 76 11.3 13.1 36.7 15.89 338178 43.850
0 11 5 76 7.6 17.0 39.8 53.1 15.87 337+87 43.818100 11 5 7b 7.u 46.0 72.1 15.86 333599 43.831
LAST 5 LINES OF BAlM2J3 27 7 76 —19.9 9.1 14842.9 —4276.3 16.71 312668 43.7C3300 27 7 76 —19.2 12.9 14823.6 —4263.L. 16.75 3.32026 43.719
27 7 76 -20.7 13.9 1'+8u3.0 —4249.5 16.7€ 311995 43.72727 7 —15.3 16.3 14737.6 —4233.2 16.75 32990527 7 76 —14.2 15.3 14773.4 —4217.4 16.75 329500

0.12
0.10
d 0.04
0.02
0.00
0.12
0.10
0.08
0.06
0.04
0.02
0.00
10000
1000
100
10
8833 A AT lILA II. 10 ?4 TO V JIL TAPE 682/32
1.5 2 2.5 3
0 8.4 15.5 22.5 29.4 36.2 42.9 49.5 55.9 62.3 68.5 74.7 80.7
SPEED, CA/SEC
0 20 40 60 80 100 120 140 160 180 200 220 240 260 280 300 320 340 360
DIRECTION, DECREES TRUE
—3 —2.5 -2 —1.5 —1 -0.5 0 0.5FREOUENCT. CYCLES PER DAT

40.0030.00
10.00
—10.00
—30.00
60.00
40.00
20.00
0.00I—20.00
—40.00
-60.00
-60.08
13.50
18.50
17.50
016.50
0I-
15.50
14.50
89
13.50
36.0035.00
33.00
31.00
a
IJUN IJUL33 M AT MXLA LEG 2: HOURLXES
77.0 2100 ONT 10 MAY 1976

5
272727
27
LINES OF DATAX7 76 —2.8 10.57 76 —2.7 11.1+7 76 —4.6 11.97 6 u.S7 76 4.8 17.5
STATISTICS E—W(U) AN) N—SU) COMPONENTS
FILTERINGLOW PASS
N AVG(U) AVb(V) VAR(V) STO((J) STO(V) COV(UV) CRLTN12.6 —6.9 251.5 316.1 17.8 —229.9 —.8156
VECTOR MEAN: 3P3 = 1'.3 CIR = 119 DEGREES(T)JIRECTIONAL STEADINESS: 58.0 Z
AXIS IS 119.3 JEGREESW
CC1ROINATES ROTATED DEGREES(E)UIVALENI JIRECTION = 135 OEGREES(TJ)
1
LEG 2
VARIABLE N MEAN SID SKEW KURT MAX MIN
S (CM/s) 24.7 12.7 2.8 67.1 .9
U (CM /) 1853
V —13.8
7.3
22 7
.1 2.6 23.5 —18.5
.1 2.0 Ls0.3 —65.1
T(1E(, ii. 9 .7 2.1. 17.7 1'..1
P 61.9 1.6 5.5 63.6 61.1
?IILA
90
TA°E NO62 71+9/2..
LEG2
FIRST 5 LINES OF DATA:i 5 76 12.6 12.6
5 76 10.8 15.i) 23.423i0 1L 5 76 7.8 31.2
0 11 5 6.b 17.1 37.811 5 76 6.1 2u.9 1+3.9
16.031.045.102.233.1
I NI E R VA LHOURLY
15.2815.2915.3C15.2515.22
16.6216.6C16.6116.4t16.17
617408617397
617 390617457
618028616872615925615669611+697
23367.8 —12553.321365.1 —1281+1.92336u.52.3361.3 —12815.22336o.1 —12797.7
43.31043.323'3.33443.2Th43.235
1+4.711+
44.6951+4.7264+ .5 16

I-
91
62 II AT fILM it. to lifT 76 TO 27 76. TAPE 719/24
0.12
0.10
0.06
0.06
0.04
0.02
7.8 14.2 20.6 26.9 33.1 39.3 45.3 51.2 57.1 62.9 68.5 74.1
SPEED. CM/SEC
0.00
0.18
0.16
0.14
0.12
0.02
0.000 20 40 60 80 100 120 140 160 180 200 220 240 260 280 300 320 340 360
DIRECTION. DECREES TRUE
10000
1000
100
10
-3 -2.5 -2 -1.5 -1 -0.5 0 0.5 1 1.5 2 2.5 3
• CTC*13 PER OAT

50.00
30.00
10.00
—10.00
—30.00
—50.00
—70.00
18.00
17.50
16.5000
15.50I.-
30.0020.00
0.00•
—20.00
1' ' •11 1? -
>
14.50
13.50
64.00
62.00
60.00
IU.
N)
IJUN IJUL62 P4 AT MILA LEG HOURLIES,
77.0 OAYS STARTING 2100 CMI 10 MAY 1976

FJR £—W(U) AN') N—StV)
N AVG(U) VAR(V) 3T')(U) STO(V) COV(UV)12.L 237.5 14.2 15.4 —166.3
V6C)P MEAN: SPO = 15.5 C'1/i, DIR = 127 OEGREES(T)DIRECTIONAL 66.3 Y.
AXIS IS 138.1 JEGREES(T)
SIA'ISTICS COORDINATES ROTATED +5 DEGREESDIRECTION 135 ')EGREESCT3)
MILA LEG 28t+ 'I
N STD
S 23.+ 11.5 .7 2.7 62.5 1.7
25.u —21.8
.2 30.7
t) i.S.3 .6 .3 2.6 16.9 13.9
93
LEG DEPTH TAPE NO INTERVAL FILTERINGMILA HOURLY LOW PASS
12.9.t. C)
10.b
5.35.5J.c_9.6
5.3 14.35.14.87I
IA+.95
FIRST S LINES OF1? 5 76 13.9 1
23C0 1C 5 26.8 2
11 5 76 37.6 3
11 5 Tb 'p3.3 4
11 5 76 12.1 11.6 6G.4 14.96 5
LAST 5 LINES OF OATAI27 7 76 12.0 230C0.3 —17371.8 15.35 1854
'uu 27 7 76 —2.3 16.36 185527 7
7 76 —7.0 11.6 22952.1 —17335.2 15.76 1857730 27 7 7€ —2.6 11.2 22979.5 —17324.0 15.63 1.858
CRLTN—. 7611
o (CM/S) 1853 2.2
V 1q58 —15.3 19.6

0.04
0.02
0.00
0.22
0.20
0.18
0.16
0.14
9484 II AT NILA II. 10 hAY 76 TO 27 JUL 76. TAPE 489/31
0.12
0.10
0.08
0.06
13.4 19.4 25.3 31.1 36.9 42.5 48.1 53.6 59.1 64.4 69.7SPEED. CM/SEC
1
I
0.12
0.10
0.08
0.06
0.04
0.02
0.000 20 40 60 00 100 120 140 160 180 200 220 240 260 280 300 320 340 360
DIRECTION. DECOCES TRIE
10000
1000
100
10
-3 -2.5 -2 -1.5 -1 -0.5 0 0.5FREOUENCY. CYCLES PER OPT
1.5 2 2.5 3

30.00
10.00 -
-10.00 -
—30.00
10.00
—10.00
-30.00
-50.00
—70.00
17.00
16.00
10.00
14.00
.. ILL
- —v!Fiw'I.rr vrr W - "r
I JUN64 14 AT 14ILA LEO 2* HOURLIES,
77.0 DAYS STARTINO 2200 ONT 10 MAY 1976
I
I JUL

N
STATISTICS FJR E-W(U) ANI
AVGCI) VAR(V 510(v) COV(UV)13J.9 lu.3 12.0 '91.4 .75o1
MEAN: SPO 9.3 C'1/3, = 136UIRECTIONAL STEADINESS: 61.C
AXIS IS 11+1.7 OEGREES(T)
STATISTICS FOR COJRUINATES ROTATED '+5 DEGREESDIRECTION = 135 JFGREES(TJ)
M
109 'ILEG 2
VARIA3LF N
S 16.)U (CM/S) —.2
(CM/S i3Ei9 —9.7 14.6
ST) SKEW KURT MAX
3.6 51.7
—.1 2.9 16.5 —19.3
2.6 32.2 —51.3
T(lEr C .6 .1 3.0 16.6 13.2
jjg,q .1 5.6
96
STATION LEG DE?Tt-4 TAPE NOMILA 2 109 HOURLY
FILTERINGLOW PASS
FIRST 5 LINES OF DATA:2130 10 5 76 2G.6 —12.9 20.62200 5 76 20.5 —9.5
14.531.1.1
42.1.32
S 76 19.6 —6.514.53
60.71094930 42.430
0 11 7E 20.'+ —.314.5C
—32.110.0 11 5 7€ la.8 —2.7
14.41.—34.9 14.37
1095088 42.331.42.275
LAST 5 lINES OF DATAt27 7 76 3.5 13u
300 27 7 76 —5.114.82
12515.31097600 2.1.65
27 7 7€ 4.le 12516.2 —13u89.61097600 42.463
503 27 7 76 2.7 —4.114.97
12519.j1097600 42.602
27 7 76 '+.3 3.214.99 1097680 '+2.629
9.3
5.6
MIN

3-
Iii0a
3-
-J'Ii
97
109 II AT IIILR ix. to nay JUL 76. TAPE 606/30
0.12
0.10
0.00
0.06
0.04
0.02
0.006.5 11.? 16.8 21.9 26.9 31.9 36.0 41.7 46.5 51.2 55.9
SPEED, CM/SEC
0.16
0.14
0.12
0.10
0.08
0.06
0.04
0.02
0.00
1000
100
10
0.1
0 20 40 60 00 100 120 140 160 180 200 220 240 260 200 300 320 340 360
DIRECTION, DECREES TRUE
z
—3 -2.5 -2 —1.5 —1 —0.5 0 0.5FREOUENCT, CICLES PER OIlY
1.5 2 2,5 3

40.00
20.00
0.00
—20.00
—40.00
—60.00
17.0016.60
15.50a(p
14.60
13.50
_n
111.00
a. 108.00
- .1L.iL AL -JJLZ'i& .
20.00
0.00 r 'ywiTu 'r
>
9
IJUN IJUL109 14 AT MILA LEQ 2* HOURLXES1
77.0 OAY8 STARTXN6 2100 CMI 10 14A'r 1978

99
JOINT—Il 1976 Installation
LAGARTA II
Posi tion*:Distance Offshore:Bottom Depth:Set:Retrieved:Longest Data Interval:Longest Record Length:
Instrumentation
15°08.7'S, 75°39.5'W27.3 km465 m2235 GMT1334 GMT0600 GMT82 days,
* Navigation: Satellite navigator
9 May 1976 by R/V THOMPSON31 July 1976 by R/V EASTWARD10 May to 0500 GMT 31 July0 hours
Intended Accepted Serial Sampling MeasuredDepth Depth Tape # Interval Variables
100 m 115 m 684/29 20 mm S,O,T,P,C200 m 212 m 495/34 30 mm S,o,T,P300 m 312 m 452/33 30 mm S,e,T400 m 412 m 488/24 30 mm S,o,T

312 II AT tACARTA. 82.5 DAYS STARTING 2323 P 76 412 SI AT LAGARTA. 82.5 DAYS STARTING 23299 76
200
800 1000
125
—125
-600
500 625
115 11 AT LACARTA. 82.5 DAYS STARTING 2355 9 SlAY 76
70
-?0
—3,5
212 11 AT LACARTA. 82.5 DAYS STARTING 2329 9 SlAY 76
280 350 420
-J00
—45 15

LAG ARIATAPE INTERVAL FILTERING
LOW PASS
STATISTICS FOR E—W(U) N—S(V) COMPONENTS
N AVG(V) VAR(U) VAR(V) STD(U) STO(V) COV(UV) CRLTN1968 22+.6 233.3 15.C 15.3 —172.3 —.7526
VECTOR = 16.9 Cl/S, DIR = 119 OEGREES(T)71.7
PRINCIPAL AXIS IS 135.7 JEGREES(T)
sTATIsTICs COORDINATES ROTATED 45 DEGREESfEQtJIVALENT ALONGSHORE OIR€CTION = 135 OEGREESCTI)
LAGARTA LEG 2115
VARILE N MEAN STO SKEW KURT MAX tIIN
S (CM/S) 1968 23.6 13.7 .5 2.5 70.1 .2
.9 5.3 —18.9
1 +. 6 .5 —.1 2.7 16.1 13.3
(DEAR) 1968 115.9 2.0 5.0 37.4 136.7 114.9
101
LEG2 115 F400RLV
FIRST 5 LINES OF DATA:60ü IC 5 76 31.2 7.U 31.2 7.0 14.75 1+2.796
5 76 5.6 6L+.!+ 12.7 14.77 1154792 1+2.7835 76 36.u 3.3 100.4 15.9 14.61+ 1158651 42.657
90u 10 5 76 36.9 5.9 137.2 21.8 14.73 1164661 42.7441000 10 5 35.2 8.2 172.4 30.1 14.76 1163617 42.779
LAST 5 LINES OF DATA:100 31 7 76 32.1 —37.3 28871.6 —16242.6 15.60 1206600 43.500200 31 7 76 39.1 —35.4 23910.7 —16273.1 14.81 1210260 42.722
7 76 35.9 —37.2 28946.7 —16315.3 14.51 1209325 1+2.40831 7 76 38.9 —34.8 28985.6 —16350.1 15.07 1215072 42.998
E?GC 31 7 76 41.2 -35.5 29026.7 —16385.7 15.42 1209471 43.361
U 1968 4.5 7.5
.V (CM/S) 1963 20.0 .4 3.3 41.3 —70.1

0.09
0.08
0.0?
0.06
0.05
0.04
0.03
0.02
0.01
0.00
0.20
0.18
0.16
0.14
0.12
0.10
0.08
0.06
0.04
0.02
0.00
1000
3-
100
10
102115 II AT 9 TO 31 JIL 36. TRPZ 684/29
0 8.4 15.5 22.5 29.4 36.2 42,9 49.5 55.9 62.3 68.5 ?4.?SPEED. Eli/SEC
10000
0 20 40 60 80 100 120 140 160 100 20Q 220 240 260 280 300 320 340 360DIRECTI06. DECREES TRUE
0.1—3 —2.5 -2 —1.0 —1 —0.5 0 0.5 1 1.5 2 2.5 3
FREQUENCY • CTCIIS PER SliT

50.0040.00
20.00
> —40.00
-80.00
-80.00
1E.50
12.50
137.00
135.00
129.00
1.27.00
C125.00
123.00
121.00
119.00
117.00
115.00
113.00
103
15.50
14.50C,
w0I-
IJUN IJUL115 M AT LAGARTA LEG 2 HOURLES,
82 DAYS STARTING 600 GMT ID MAY1 1976

N1
STATISTICS FOR E—W(U) AND N—S(V) COMPONENTS
AVG(U) VAR(lJ) 513(U) STO(V) COV(UV) CRLTN7.7 —'+.9 123.9 52.0 11.1. 7.2 —58.7 —.7315
VECTOR 'lEAN: 9.3 CM/S, DIR = 122 DEGREES(T)DIRECTIONAL 65.7 Z
PRINCIPAL AXIS IS 119.3 OEGREES(T)
STATIsTICS COORDINATES ROTATED 45 DEGREES(EQUIVALENT ALONGSHORE DIRECTION 135
LAGARTA LEG 2212 '1
N MEAN
S (CM/S) 163 13.9
U (CM/S) 1369 2.1
V (CM/S 1969 —8.9 12.1
STO SKEW KURT MAX tlIN
12.9 .4 .+ 4.3 11.6
1968 1.6 229.9 212.3
104
STATION LEG DEPTHLAGART4 2 212
FIRST 5ICit
830900 10
1J00 10
LAST
200
495/34 HOURLY LOW PASS
LINES OF5 76 2.2 —v.6 2.2 —0.6S 76 3.1 5.3 —'.7
12.85 2135386 1
5 76 4.+ —..+ 9.712.87 2135037 2
5 76 8.2 b.2 17.9—7.2
—13.312.94 2135509 3
5 76 10.3 —3.6 28.3 —17.312.9813.OC
2137721213624k
45
LINES OF DATA:7 7e 26.3 —22.2 15051.37 76 24.9 —22.5 15076.2
1.77 2172011 1964
7 76 25.313.71 2177465 1965
7 76 24.5 —21.513.51+ 2179396 1966
7 76 21.1 —24.513.58 2182722 1967
5
31
313131
8.3
5."
T(DEG C) 1q68
.9 3.2 .3
.1 3.3 22.9 —18.0
.3 3.0 28.? —'+2.6

0.18
0.16
0.14
0.12
0.10
0.08
I-Cii 0.06C
0.04
0.02
0.00
105
212 11 AT LAC,PRTA 9 76 10 31 JUL 76. TV'E 495/34
,LRErVI0.09
0.08
0.07
0.06
0.03
0.02
0.01
0.000 5.6 10.0 14.3 18.5 22.8 27.0 31.1 35.2 39.3 43.3
SPEED. Cr1/SEC
0 20 40 60 80 100 120 140 160 180 200 220 240 260 280 300 320 340 360
DIRECTION. DECREES TRUE
1000
100
10
0.1—3 —2.5 —2 -1.5 —1 —0.5 0 0.5 1 1.5 2 2.5 3
FREOUENCT, CYCLES PER OAT
I!

11.00
230.00225.00
227.00
225.00
223.00
221.00
0. 219.00
217.00
215.00
213.00
211.00
106
v-VT. V • I. I ' 1 - -v
30.0020.00
—20.00
30.00
— 10.00In
—10.00
> -30.00
—50.00
14.50
14.00
13.00(Iw0
12.00
a
II
IJUN IJUL212 P4 AT LAGARTA LEG 2:92.0 OATS STARTING 600 GP47 10 MAY 1976

FIRST S
9u4J IL1GGO 10
12.16—11.6 12.15—17.2 12.18—26.8 12.19—38.1 12.2k
I
2
34
5
STMTISTICS F—W(U) A'l) N—S(V) COMPONENTS
N MVG(U) '1AR(U) VAR(V) 570(0) STO(V) COV(UV)'.1 —2.2 25.L+ 10.1 —34.2
MEANI 5P) 5.1 C'4/3, = 115 OEGREES(T)DIRECTIONAL 50.4 7.
PRINCIPAL IS jjo.q
COORDINATES ROTATED 45 DEGREESION = 135 DEGREESCI))
LAGARTA LEG 2312 '1
N rIEAN STU KURT MAX MIN
3.3 13.0 10.3
107
LEG TAPE NOLAGARTA 312 '+52/33
INTERVALHOURLY
OF OATA—6.5 15.6
16.• 1
2C • 720.3
LI NE5 7.
5 765 7.5 7b5 76
LINES7 767 767 767 76'7
LuST106200
3£
'-5.1
—5.6'-9.
—11.3
—6. 1—5.2
_.J. 0-6.9
5
31313133-
31
31.6• 7
I .491.7
91.16 .6912b .991i9 .8
.i3
OF OATA13.310 • U
IC • 212 • 9
—4273.0—427 2—4285.6
FILTERINGLOW PASS
1964196519661967
CRLTN—.6734
12.2212.0611.9712.3017.1. —.
S (CM!..,) 1J.2
U (CM/S) 1.7
V (CM/S)
7.0
5.4
9.9-.8
1.3 3.7 41.3
.3 3.0 21.1
—.2 2.8 21.8 —37.1
c) 1Q68 11.7 .+ —.1

0.12
0.10
0.0$
0z
0.06
0.04
0.02
0.00
0.14
0.12
0.10
0.08
0.06
0.04
0.02
0.00
1000
108
312 tl RT P 76 10 31 AL 74. TRPE 452/33
JMEAN
0 5.2 9.1 13.0 16.8 20.7 24.5 28.2 31.9 35.6 39.3 42.9 4d.5
SPEED. Cf/SEC
0 20 40 40 80 100 120 140 160 180 200 220 240 260 280 300 320 340 360
DIRECTION. DECREES
I-I-4,z'a0
U
100
10
0.1—3 —2.5 -2 —1.5 —i —0.5 0 0.5
FREQUENCY • CTCLE3 PER DRY
1.5 2 2.S 3

30.0020.00
0.00 Li,1'!!
U)
xC)
D -20.00
30.0020.00
0.00x0—20.00
—40.00
0C,UaI-
Ai.
IJUN IJUL312 N AT LAGARTA LEG 2: HOURLIES,82.0 DAYS STARTING 600 GMT 10 MAY 1976

STATISTICS FOR E—W(U) AN) N—S(V) COMPONENTS
N AVG(U) 44R(U) VAR(\I) STJ(U) STO(V) COV(UV)—.2 —.' 31.7 21.2 5.6 4.6 —17.9
VECTJP MEAN: .3 GuS, !)IR = 216 OEGRE€S(T)DIRECTIONAL STEADINESS: +.9 7.
PRINCIPAL IS 126.8 OEGREES(T)
STATISTICS COORDINATES ROTATED '+5 DEGREES(EOUIVALENT ALONGSHORE = 135 JEGREES(TJ)
LAGARTA LEG 2
N MEAN STD SKEW KURT MAX uN
S (N!/S)
U 1968
21.9 .1
9.5 —12.1
V (CM/S) 1968 —.0 b.7 .2 3.0 21.1 —20.1
T(DEG C) 1968 9.9 .7 3.5 12.3 8.1
110
FILTERINGLOW PASS
STATION LEG DEPTH TAPE NO INTERVALLAGARTA 2 412 L+88,'2L+ HOURLY
FIRST 5 OF600 5 76 —3.5 6.2 —3.5 6.2 10.64 1
700 10 5 76 —3.7 —7.2 9.7 10.4 2
10 5 7b —3.6 0.5 —10.8 lu.2 10.61 3
90C 10 5 76 —3.U —0.3 —13.8 9.9 10.621080 1L 5 76 —0.1 —3.2 —13.9 6.7 10.73 5
LAST S LINES OF DATA:100 31 7 6 3.5 —6.5 —348.6 10.66 1964200 31 7 76 —2.7 —345.2 —L+83.+ lu.23 1965
31 7 76 0.9 ).6 —482.8 196631 7 '6 —1.9 1.1. —346.2 —481.7 9.97 1967
500 31. 7 76 —2.7 1.1 —349.0 —'+83.5 10.07 1968
CRLTN—.6907
6. 2
—.3
3.8
2.9
1.1
—. 8 3.3

w
II.'U
111
412 II (IT LAGARTA. 9 AR'! 76 TO 31 JUL. 76. TAPE 488/24
J,FICAN0.10
0.09
0.08
0.07
0.06
0.05
0.04
0.03
0.02
0.01
0.003.4 5.6 7.8 10.0 12.1 14.3 16,4 18.5 20.7 22.8 24.9
SPEED. Gil/SEC
0.07
0.06
0.05
0.04
0.03
0.02
0.01
0.00
— 100
to
0.1
O 20 40 60 80 100 120 j4•J 150 180 200 220 210 260 280 300 320 340 360
DIRECTION. DEGREES TRUE
'UC
—3 —2.5 —2 —1.5 —l —0.5 0 0.5FREQUENCY. CYCLES PER DAY
1.5 2 2.5 3

10.0
0
____
____
____
____
__
0.00
0 — —
20.0
0
30.0
0 T
10.0
0I
-10.
00>
--T
v--.
•1.I.
-.
.-
.1.1
.1.
LJ
-'
--r
•'-
ii'j.
—30
.00
...I •
U•"
"rp
12.5
0
11.5
0
10.5
0
9.50
--
-
-
0 C, w 0 p.
-i
JUN
412
14 A
T L
AG
AR
TA
LEG
2:
HO
UR
LIE
S,
92.0
DA
YS
ST
AR
TIN
G60
0 G
NT
10
MA
Y 1
976

Posi tion*:Distance Offshore:Bottom Depth:Set:Retrieved:Longest Data Interval:Longest Record Length:
Instrumentation
12°04.7'S, 77°21.7'W12.2 km (from San Lorenzo Island)120 m1311 GMT1500 GMT2000 GMT80 days, hours
Corrrnents:
No good direction data were recorded by current meter 442 (100 m)prior to 2233 GMT, 28 June. The filtered hourly current data coversthe interval from 0433 GMT, 29 June through 0833 GMT, 2 August;temperature data is available for the entire mooring period.
* Navigation: radar fixes and U.S. chart H.0. 22173 (Callao and approaches).
113
JOINT—lI 1976 Installation
VUCA II
13 May 1976 by R/V THOMPSON2 August 1976 by R/V EASTWARD13 May to 0800 GMT 2 August13
Intended Accepted Serial Sampling MeasuredDepth Depth Tape # Interval Variables
80 m 80 m 921/3 20 mm S,O,T,P100 m 100 m 442/29 30 mm S,O,T

100 AT YUCA. 34.7 DAYS STARTING 2233 28 JUN 'o80 ii AT YUCA. 81.0 DAYS STARTING 1342 13 MAY 76
-J
—40 40 80
150
300 450 600
-750
—280
-900

STATISTICS FOR E—W(U) AN) '4—3(V) COMPCNENTS
N AVG(U) AVGU) VAR(V) 310(U) STO(V) COV(UV) CRLTN-13.' 82.'+ 253.7 9.1 15.9 —82.0 —.566A
= 15.3 OIR = 146 JEGREES(T)72.9 Y.
PRINCIPAL AXIS IS 158.1 JEGREES(T)
3TuTISTICS cUR COORJINATES DEGREESALONGSHORE JIRECTION = 15C
VU C A
ILEG 2
N MEAN <tJRT MAX MIN
,.i 1933 21.8 13.6 2.2 51.1 1 • 2
U 1933
', 1933 —15.9 16 • 8
•1 3C.14 —79.6
.6 3.2 38.3 —51.1
T(jEt, C) 1q33 1.5. 9 -.2 3.2 13.9 1.5.6
P 1 .1 17.9 80.6 79.8
115
STATION LEG CEPTH TAPE NO INTERVALIUCA 2 8k.. q21/3
FILTERINGLOW PASS
FIRST 5 LINE3 OF JATA:13 5 76 5.9 —21.7 5.9 —21.7 16.65 799706 1
13 5 7 11.8 —19.5 17.8 —41.3 16.6C 803653 2
13 5 76 16,8 —17.9 3*.b 831.437 3
5 7. —82.1 16.62 801257 4
3 5 76 5.1 —23.9 16.6k 80132.3 5
LAST 5 LINES OF )ATAI2 8 76 21.9 —2€.3 17167.1 —25375.2 16.45 332311 1929
5ü3 2 8 76 22.8 17189.9 —25400.2 16.318
2
8 7614.2 —24.85.9 —24.7
1722'+.917230.9
16.26 502839 19321933
1.1 7.4

0.09
o .oa
0.07
0.06
0.05
0.04
0.03
0.02
0.01
0.00
116
8OIIRTYUGR. TAPt92I/3
1.iiolw
6.5 ii.? 16.8 21.9 26.9 31.9 36.3 41.7 46.5 51.2DF'I.LU, Cf/SEC
0 20 40 60 80 100 120 140 160 180 200 220 240 260 230 200 320 340 360
DEGREES TRUE
0.13
0.16
0.14
0.12
0.10
0.0$
0.06
0.04
0.02
0.00
1000
100
to
0.!-3 —2.5 —2 -1.5 —1 —'T.S 0 0.5 1 1.5 2 2.5 3
- FREO!J!NCT. CTCLES PER DRY

C)
C,
I-
40.0030.00
10.00
—10.00
—30.00
40.00
20.00
0.00I-20.00
—40.00
—60.00
19.00
18.00
17.00
16.00
15.00
91.00'80.00
79.00
-J-z-.4
1111111,, ttII,II,IIIIIIIu,I,,tttI,,,,II,IIII,,,I1IIIIIl,I,,IIIIIJUN IJUL
90 t4 AT YUCA LEG 23 HOURUES,
80.0 DAIS STARTING 2000 CMI *3 MAY 1976
I AUG

STATION LEGYUCA
TA°EilL
INTERVALHOURLY
FILTERINGLOW PASS
FOR E—W(U) N—S(V) COMPONENTS
N AVGU) 'IAR('I) 310(U) 510(V) CQV(UV) CRLTN
821 3.M —9.2 5.j. 3.9 —2.0 —.221+1
VECTOR MEAN EPJ = 9.9 CM/S, OIR = 157 DEGREES(T)OFECTIONAL X
AXIS IS 1)9.5 OEGREES(T)
STATISTICS COOPOINATES DEGREES= JEGREESCI))
Y U CA LEG 2
N SKE4 KURT MAX MIN
S 1.2 3.9 .1. 2.6 .9
U —i.3 ..+
(Cd/S) 3 .8 .1
3.3 5..; —8.8
2.6 —.6 —19.9
L) .5 2.3 17.7 15.3
118
2
FIRST 5 LINES OF OATA!13 5 7€ U.Q 0.u I
2133 13 5 7o 0.3 u.0 0.0 16.2835 76 C.u 0.0 3.0 16.37
2333 13 5 76 O.u u.0 3.0 16.41 1+
533 5 76 3.u 0.0 0.0 0.3
LAST 5 OF QATA'+33 2 8 76 5.8 —5.5 31u7.6 —7535.7 15.99 1929
533 2 8 76 —3.3 3113.0 15.91
2 8 5.8 —3.7 —7512.7 15.84 1931
733 2 8 7b —2.7 15.8219332 8 76 1.8 —2.2. 15.77

0.10
0.09
0.08
0.07
0.05
0.04
0.03
0.02
0.01
0.00
119
200 N RT 'rUCA. 13 MAY 76 10 2 76. TAPE 442/29
,IMERN
0 4.3 7.4 10.4 13.4 16,4 19.4 22.4 25.3 28.2 31.1 34.0
SPEED • CM/SEC
0.30
0.25
0.20
0.15
0.10
0.05
0.00
0z0II.
'-4I-Ct-J
0 20 40 60 80 100 120 140 160 180 200 220 240 260 280 300 320 340 360
DIRECTION. DEGREES TRUE
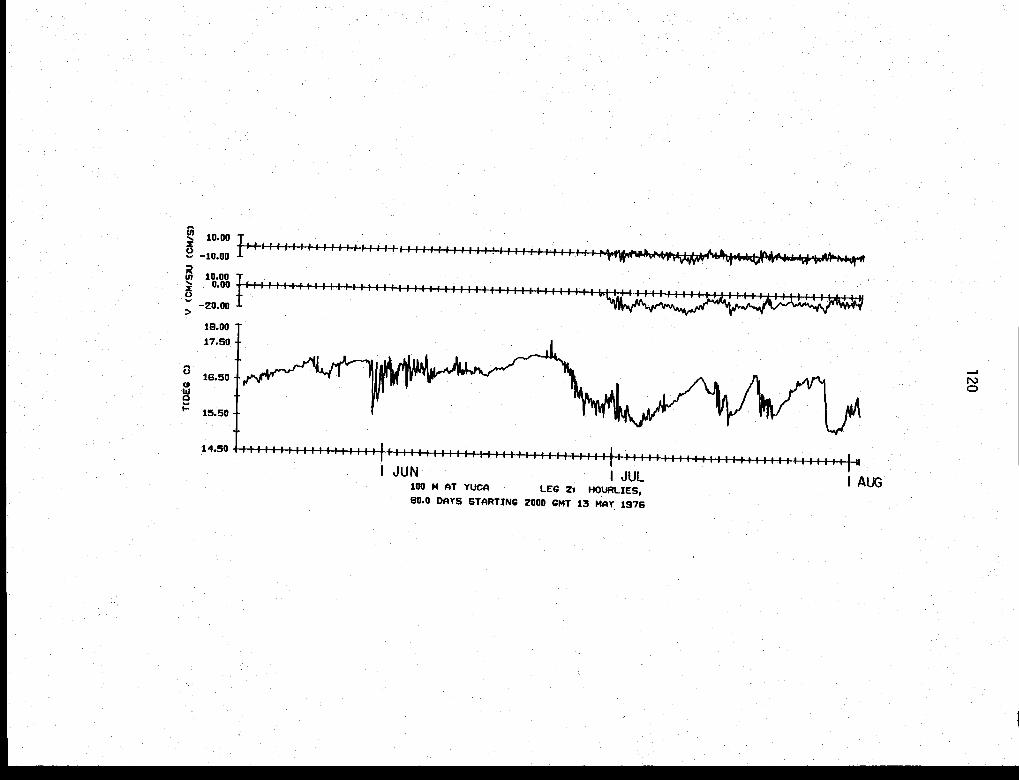
:: i÷÷10.00
0.000
——IIT —
C,
w0I.-
• IA.I.
18.00
17.50
16.50
15.50
14.50
IJUN IJUL100 M AT YUCA LEG 2: HOUPLIES,80.0 DAYS STARTING 2000 GIlT 13 MAY 1976
-I0
I- I I I I I I I 1111111 I I I I
I AUG

121
INSTALLATIONS: Leg III (JAS '76)

123
JOINT—Il 1976 Installation
MILA III
Posi tion*:Distance Offshore:Bottom Depth:Set:Retrieved:Longest Data Interval:Longest Record Length:
Ins trumentation
l5°05.8'S, 75°30.2'W10.0 km123 m1726 GMT 271145 GMT 300100 GMT 28
* Navigation: radar fixes and Peru chart DHNM 2200.
64 days, 4 hours
July 1976 by R/V EASTWARDSeptember 1976 by R/V EASTWARDJuly to 0400 GMT 30 September
Intended Accepted Serial Sampling MeasuredDepth Depth Tape # Interval Variables
25 m 28 m 747/23 20 mm S,e,T,P,C50 m 53 m 689/23 20 mm S,O,T,P,C75 m 79 m 746/22 20 mm S,O,T,P,C
100 m 104 m 748/20 20 mm S,o,T,P,C

124
—110
53 N AT 121. 64? DAYS 1520 27 J%A_ N
270
1*0
135
'0
220
—135 —90 —45
-70
2* P1 AT NU.A III. 64.? DAYS STARTING 1813 27 76
210 2*0
-125
—140
—210
-280
-350
104 II AT PPILA III. 64.7 DAYS STARTING 1324 27 JIll. N-579
79 II RI PlILA III. 64.7 DAYS STARTING 1327 27 JUt. 76

VARIASLF
S (CM/S) 1SL+O
STJ SKEW KURT MAX MIN
21.1 10.5 3.3 .2
2.7 25.1 —19.0
2.2
1.2 2.9 17.9 12.b
.3 2.8 29.6 27.8
STATION 'JEPTI1
MILA
125
TAPE 407 L17123
INTERVALHOURLY
FILTERINGLOW PASS
FIRST 5 LINES OFi€.8928 7 7t — 12.3 —..8 12.316.92 281772
28 7 76 —2.9 12.9 —7.725032'+
300 28 7 76 —u.3 L+Q.3
16.97 279992L4j3 28 7 76 —2.2 15.6 —lu.1279922 '+5.1+15
SuO 7 76 —p.8 16.5 —16.3 72.'+
LAST 5 LINES OF DATA S
279'+693u 9 76 10.5 —9.3 '+1+&.4 5'+37.k
28393099 769 76 —1.1 3.? 5'+22.1
1'+.32 293670 42.006'+30 9 —3.9 3.'+ 5425.5
STATISTICS FOR E—W(U) AND N—S(li) COMPONENTS
AVG(V) VAR(U) VAR(4) 510(U) ST0(V) CRLTN
—.3 3.5 299.3 2'+2.1 17.3 15.6 —221.1 —.8218
VECTOR MEAN 5P) 3.5 C'1/:S, CIR + OEGRE€S(T)DIRECTIONAL 16.8 V.
IS 131.3 JEGREES(T)
STATISTICS CUORDINATES ROTATED '+5
DIRECTION = 135 JEGREESCI])
MILA LEG 3'4
'J
V 15'e3
C) jS'+j
.3 7.0
2.7 22.2
z+. 9

0.10
0.09
0.08
0.07
t 0.06
0.05
:1::
0.02
0.01
0.00
126
28 A AT AILA III. 37 JUL 7, (0 30 SEP 76. TAPE 747123
0.12
0.10
0.08
0.06
0.04
0.02
0.00
I-2
'a.
'a
C-I'aC
0 7.1 13.0 18.7 24.4 30.1 35.6 43.1 46.5 51.8 57.1 62.3
SPEED, cnis'c
0 20 40 60 80 100 120 340 160 180 200 220 240 260 280 300 320 340 360
DIRECTION. DEOSEES TRUE
I-
2:'a
10000
1000
100
10
0.1
-3 —2.5 -2 —1.5 —1 —0.5 0 0.5 I 1.5 2 2.5 3
FREOUENCT. CTCLES PER OAT

60.0050.00
30.00
—10.00>
—30.00
-I
IAUG ISEP29 P4 AT MILA LEG HOURLIES,
64.0 DAYS STARTING 100 GP4T 28 JUL 1976
30.0020.00
—20.00
I, —.
—80.00
16.50
18.00
17.00
16.00a
15.00
14.00
13.00
12.00
30.00 -
0.
I')-4
'I Al ii

cIATISTICS FOR E—W(U) AN) N—S(V) CO P4 PC N EN I S
N AVG(U) 4JG(I) 510(0) STDU) COV(UV) CRLTN1.5 216.4 1%.6 1'..0 —169.2 —.8205
9.9 OIR = 82 OEGREES(T)STEAOINESS L7,.L4
PRINCIPAL AXIS 133.3 OEGREES(T)
STATISTICS COORDINATES ROTATED '+5 DEGREES(EQUIVALENT DIRECTION = 135 CFGREEStTJ)
ri 11453 1
LEG 3
N MEAN STO SKEW KURT MAX MIN
S (Ci/S)
Ii (CM/S) 6.1.
32.2
3.7 25.1 —19.5
—5.9 19.'. .1 E.2 '+6.3 —51.8
.r(OEG c) 1.1 .9 3.1 17.3 12.4
P (0e4) 1S'+3 53.2 .1 Q.2 53.9 32.7
128
LEG DEPTH TAPE INTERVAL FILTERINGMILA 3 53 HOURLY LOW PASS
FIRST S LIt'IES OF DATA:lUG 28 7 76 17.. —0.5 17.4 16.79 529102 '+6.3C9
29 7 76 3.2 19.u 2.7 36.4 16.39 529102 46.4C429 7 76 19.4 4.7 16.36 p29100 '+6.359
L+3G 28 76 —2.'+ 2.3 73.5 529100500 2% 7 7€ —7.1 19.6 —4.8 93.1 lb.79 4o.297
LAST 5 OF .
3 9 76 0.9 2257.8 5303329 12.2 —2.4 IL+98z..9 2255.4 13.46 p31633 42.702
. 75 lu.8 —5.5 14995.7 22'+9.8 13.47 532023 42.71o3Ju 9 12.4 —9.0 224).8
9 Tb 15.8 —3.1 2237.7 13.79 533193 43.047
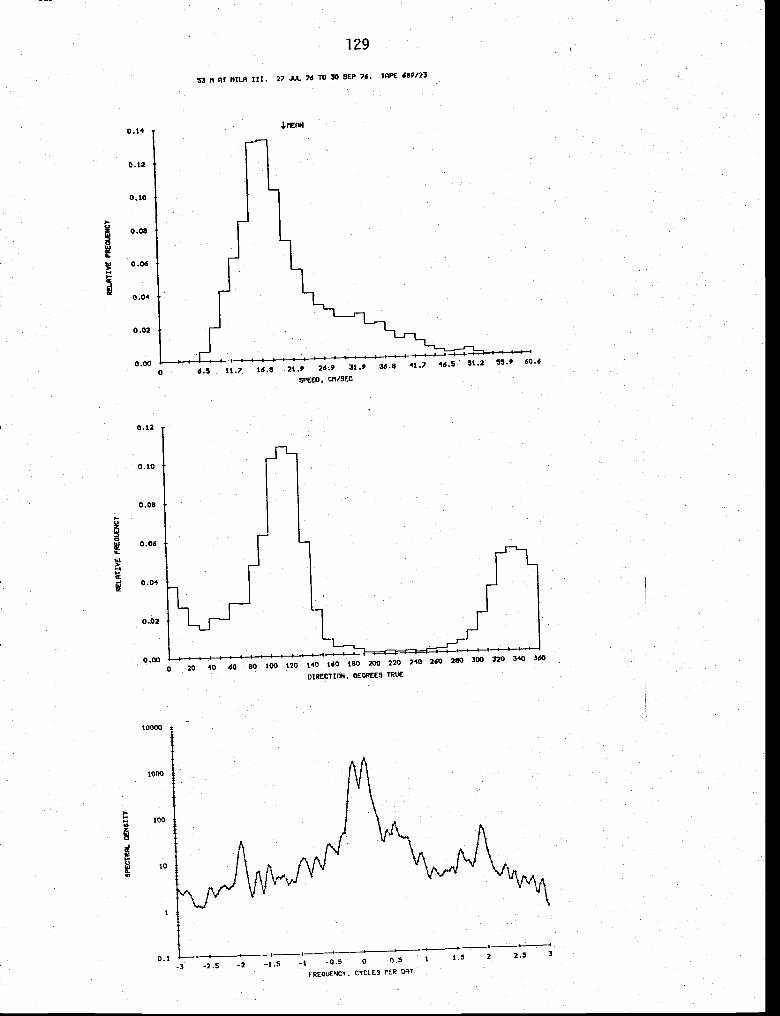
'a0
129
53 ?1 AT IIILA III. 27 JUL 74 10 30 SEP 76. TAPt 689/23
0.14
0.12
0.10
0.0$
0.06
0.04
0.02
0.006.5 01.? 16.6 21.9 31.9 36.8 41.? 46.5 51.2 55.9 60.6
SPEED. CA/SEC
0.12
0.10
0.08
0.06
0.04
0.02
0.000 20 40 60 60 100 120 140 160 180 200 220 240 260 280 300 320 340 360
DT.6€CTICR4, DECREE-a TRUE
00000
1000
too
to
—3 —2.5 —2 —1.5 -1 -0.5 0 0.5 i 1.5 2 2.3 3
CYCILS POR 001

5.4.20.00
0.00
—20.00
—40.00
—60.00
..,• 1'•
53 14 AT MILA64.0 STARTINQ
LEG 3s HOURLIES,
100 CMT 28 1876
30. -20. -
—20.00
iA.
17.50
16.50
15.50
14.50
13.50
12.80
11.50
—I(.4
54.0053.00-
51.00
A_I *
IAUG ISEP

STATISTICS FOR E—W(U) AN) COMPONENTS
N STO(UJ STU(V) GOV(UV) CRLTN
1..? 143.5 12.' 12.3 —115.C
VECTOR IEANZ SPO = 11.9 Ci/S, OIR = 116 OEGREES(T)61.7 7.
AUS IS 1.35.3
COOPOINATES ROTATED DEGREESALONGSHORE JIRECTION = 135 JEGREES(T3)
IL A7° M
LEG 3
VARIABLE N STD SKEW KURT PUN
S 1).
U (CM/S)
V (CM/S) —11.3
T(r)EG C) 13.7
51.7 1.7
—.2 2.8 18.0 —15.0
lo.3 3Li.9 —51.7
1.1.
P (flbAP) .2 —1.2 7.u 30.1 79.0
131
STATION DEPTH TAPE NOMILA 3 79
iNTERVALHOURLY
FILTERINGLOW PASS
FIRST 5 OF DATa!'.3.65628 7 76 2j.5 —6.8 20.5 15.5543.9022CC 28 7 —5.9 36.0 —12.7 15.79
23 76 —3.3 £48.2 15.82 789902789691+ 1+3.9C3
28 7 76 12.2 .6 -1.9.6 1.5.7943.913SuD 28 7 76 11.2 71.5 —23.3 15.80
LAST 5 lINES OF QATA:795684 41.094
C 9 76 11.4 —d.Le 16445.5 13.0941.0469 76 15.7 16461.3 795729
7955893L 9 76 —7.1 —861.7 13.)t£41.025
30 9 7 9.8 -13.2 16436.0 13.33
8
5 .9
1.0

132
PP A AT AIIM III. 27 UI. 76 ID 30 SEP 76. TAPE 746/22
6.5 11.7 16.0 21.9 26.9 31.9 36.0 41.7 46.5 51.2 55.9
SPEED. CM/SEC
0.16
0.14
0.12
0.10
0.00
0.06
0.04
0.02
0.00
0.15
0.16
0.14
0.12
§0.10
0.00
0.06
0.04
0.02
0.00
10000
1000
100z
-J
10
0.1
—3 —2.5 —2 —1.5 -1 -0.5 0 0.5 1 1.5 2 2.5 3
FREOIJITNCT, 000113 PER OAT
0 20 40 60 80 100 120 140 160 100 200 220 240 260 285 300 320 310 SdO
DIRECTION. DECREES TRUE

40.00
20.00
0.00
—20.00
—40.00
—60.00
17.00
16.50
15.50
14.50
13.50
12.90
11.50
81.00
79.00
77.00
20.00
0.00
—20.001 lpy .- .-
. 'l
00
I.-
AUG
lit I I IIII SEP
79 14 AT I4ILA LEC 3z HOURLIES,
64.0 DAYS STARTING 100 20 .JUL. 1970

ST A TI UMILA
TAPE7L&3/2j
IMTEf<V4LHOURLY
FILTERINGPASS
N AVG(U) AVG(4)c.2
VARU) STO(U) STDfll) COV(UV) CRLTN92.3 1G.? 6s.8 —.6280
iIEANt SPC = Gus, r)IR 132 OEGREES(T)DIRECTIONAL STE#OINE3S' 36.'+
AXIS IS 139.3 JEGREES(T)
STATISTICS FOR COJROINAIES ROTATEO '.5 iJEGREES(EQUIVALENT ALO.4GSHORE = 135 CEGRFESCTI)
114NI
LEG 3
N MEAN STD SKEW KURT MAX MIN
S 7.6 1.1 1.8
tj (CM/) 6.2 —.3 3.2 16.2 —23.4
'! (Cs/S) 1541 2.8 35.1 —41.8
T(OEG C) L..8 11.9
P
1
3 134
FIRST 5 LINES OF .JAtA:100 28 7 76 —0.9 —7.7 —0.9 —7.7 14.70 1941298
7 76 —3.2 —3.3 —4.1 —16.5 14.32 1040444 '+2.81928 7 76 —3.5 —7.6 —26.'. 14.93 '+2.938
23 7 76 —10.1 15.ul 1039271 '.3.016
28 7 —8.7 —10.7 15.U9 103834? 43.116
LAST S OF OATA*8 38 9 76 4.? —5.9 95'.3.3 12.93 1048940 40.891
100 30 9 76 6.7 —+.9 955U.0 —8593.0 12.92 1048770 '+0.890
9 7o 1+.S 9557.3 —8603.6 12.91 10L+9'.56 '+0.377
3uJ 9 6 7.b —b.3 12.92 1050436 kC.88u
'+30 30 9 71 7.3 —9.0 8619.5 12.93 '+0.899
STATISTICS FOR E—W(U) AN) COMPONENTS
1 3 • '3 1.0 1.5

0.12
0.10
0.08
o .o6
0.04
0.02
o .oo
0.12
0.10
0.08
0.06
0.04
0.02
0.00
135
104 11 RT IIILA Dli. 27 .JIX. 76 TO 30 SEP 76. TAPE 748/20
I
o 5.1 9.1 13.0 16.8 20.6 24,4 26.2 31.9 35.6 39.3 42.9 46.5
SPEED, CA/SEC
o 20 40 60 80 100 120 140 160 160 200 220 240 260 280 300 320 340 360
DIRECT ION • DEGREES TRUE
1000
100
10
0.1—3 —2.5 -2 —1.5 -1 0 0.5 1 1.5 2 2.5 3
rREOUEwcv, CYCLES PER DAY

—30.00 -
40.0030.00
10.00
—10.00
—30.00
—50.00
16.50
16.00
11.00
106.00
104.00
102.00
20.0010.00
—10.00 ''1 LkI(t. JLPJILLIiMgIi. .
'
15.00
14.00a
13.00
12.00
-a
I AUG I SEP104 14 AT MILA 3; HOURLIES,
04.0 DAYS STARTINO 100 CMT 29 .JIJL 1S76

137
INSTALLATIONS: Leg IV

139
JOINT—lI 1976 Installation
MILA IV
Position*:Distance Offshore:Bottom Depth:Set:Retrieved:Longest Data Interval:Longest Record Length:
15°06.O'S, 75°30.2'W11.5 km119 m1433 GMT 30 September1046 GMT 4 March 19771700 GMT 30 September154 days, 16 hours
1976 by R/V EASTWARDby R/V MELVILLEto 0800 GMT 4 March
Instrumentation
Coments:
Due to a sensor malfunction on current meter 751 (23 m), speed andvelocity components were zeroed out of the data record in two places.The two periods for which current data exist are from 1700 GMT30 September 1976 through 1000 GMT 4 January 1977 (95 days, 18 hours)and from 0900 GMT 23 January through 0600 GMT 3 March 1977 (38 days,22 hours).
Due to fouling of the savonius rotor, data for speed and velocitycomponents don't exist for current meter 1964 (73 m) after 2300 GMT2 February 1977.
* Navigation: radar fixes and Peru chart DHNM 2200.
Intended Accepted Serial Sampling MeasuredDepth Depth Tape # Interval Variables
25 m 23 m 751/20 60 mm S,O,T,P50 m 48 m 1962/3 60 mm S,O,T75 m 73 m 1964/3 60 mm S,O,T
100 m 99 m 503/34 60 mm S,O,T,P

100
23 II AT lillA. 1702 30 SEP 74 — 1002 4 JAN 77. 1APE 751/20.
-l00
I00
ISO 200 300 400 500 400 700 000
-too
-200
-300
—400
—000
73 AT flILA 4. 30 SEP 74 — 2 Itu 77. I$0! $944/I.
23 N AT IIILA. 0902 23 JAN 77 — 0402 3 77. TAPE 751/20.
40 $*TERS AT IIILA 4. 30 SrP 74 - 4 77. TVWE 1942/3. 99 IETERS AT liltA 4. 30 SEP 74 — 4 17. TAPE 503/34.
-100 300
-100
—200
ISO
100
-$00
730 900 $020
-100
-300

STATISTICS FOR E—W(U) AN) N—S(V) COMPONENTS
N AVG(U) AVG(V) VAR(U) VARtV) STDCU) STD(V) COV(UV) CRLTN3232 3.7 —1.7 140.8 156.6 11.9 12.5 —88.3 .59k5
VECTOR MEANI SPC = 4.0 DIR = 11'. DEGREES(T)DIRECTIONAL STEAOIN€SSS 7.
PRINCIPAL AXIS IS 137.6 OEGREES(T)
STATISTICS FOR COORDINATES ROTATED '.5 DEGREES(EQUIVALENT ALONGSHORE DIRECTION 135 DEGREES(T1)
MILA23 N
LEG '+
VARIABLE N MEAN 510 SKEW KURT MAX tiIN
6.2
V (CM/S) 3232 —3.8 15.4 .5 2.3 40.9 —43.5
T(DEG C) 3712 15.4 .8 —.3 2.5 17.8 13.2
P (D3AR) 3712 22.9 .5 1.1. 4.2 24.7 21.7
141
STATION LEG DEPTH TAPE NO INTERVAL FILTERINGtIILA 4 23 751/20 HOURLY UNFILTEREO
FIRST 5 LINES OF OATAI17C2 30 9 7.6 —4.4 —16.3 —16.3 13.15 226500 1
1802 30 . 76 —6.9 —16.2 —11.3 —32.5 13.72 228100 2
1902 30 9 76 —1.7 —16.6 —13.0 —49.1 13.75 226500 3
2Q02 30 9 76 —8.1 —12.9 —21.1 —62.0 13.80 226500 4
2102 30 9 76 —2.0 —14.. —23.1 —76.. 13.75 226500 5
LAST 5 LINES OF DATAs402 4 3 77 0.0 0.0 11909.7 —5402.7 15.74 3708
532 '. 3 77 0.0 0.0 11909.7 16.25 3709
602 £ 3 77 0.0 0.0 11909.7 —5402.7 16.11 231600 3710
702 4 3 77 3.0 0.0 11909.7 —5402.7 16.28 236000 3111.
802 4 3 77 0.3 11909.7 —5402.1 15.50 237600 3712
S (CM/S) 3232 16.8 5.8 1.1 4.5 41.1
U (CM/S) 3232 7.8 —.2 2.6 24.7 —29.6

0.12
0.10
0.08
0.06
0.04
0.02
0.00
0.0I
0.07
0.06
0.04
0.01
0.00
14223 ILTERS AT 4. 30 SEP 76 - 3 tRW 77. TAPE 751/20.
0 20 40 60 80 100 120 140 160 ieo 200 220 240 260 280 300 320 340 360
DIRECTION. DECREES TRUE
MI 23 N, NILA 4. 92 DAYS STARTING 1802 1 OCT 76.
—3 —2.3 —2 —1.5 —1 -0.5 0 0.5 1 1.3 2 2.3 3
FREOUENCY • CYCLES PER DAY
.&IIERN
5.3 9.0 12.8 16.6 20.4 24.2 27.9 31.7 35.5 39.3 43.1
SPEED. CM/SEC
1000
100
10

fl-1 14•44 II
I
•
1-14 C-3-I I I I'It-I, 114-4
I II II
w
IL
UC,
lfl.OO
17.50
ar,.!0
19.50
14.50
24.00
22.00
ZO.00 14 I 14 I I I 1441 I-I-I LI-P I I I-Ill tl-t I-Cl C-IP-?I tI Cl 41 C I
Cl AT LSC 1101..1!I1.7 DAYS STflRIIUS 1700 CIII S47' 1979
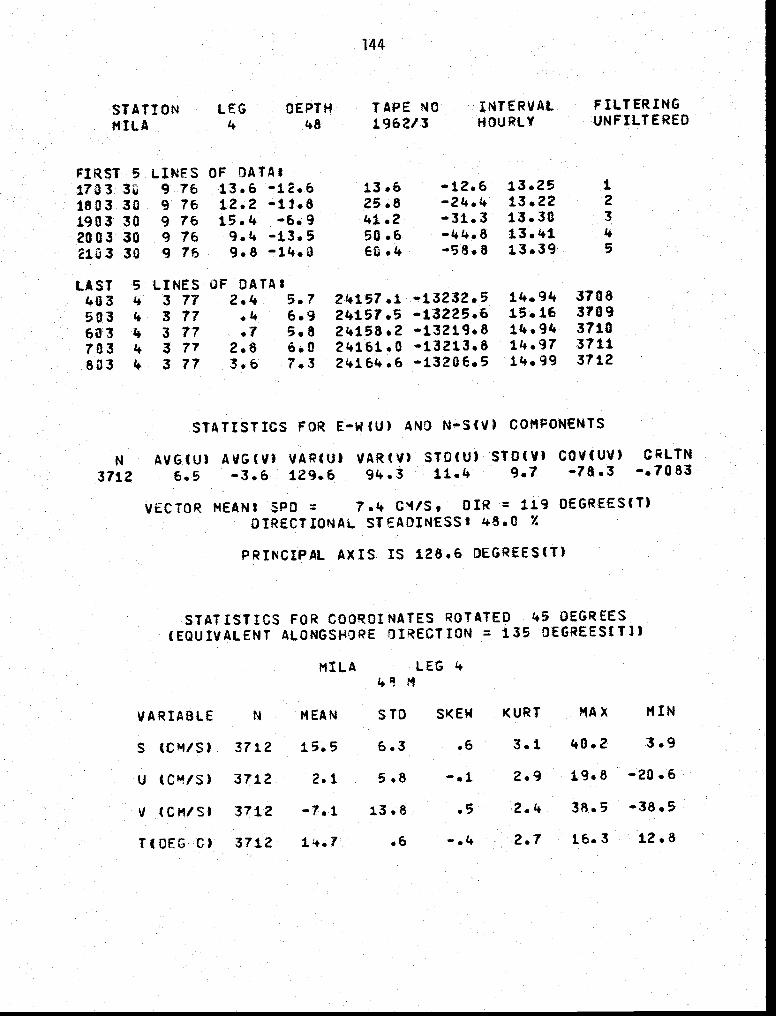
STATIONMILA
TAPE NO48 1962/3
INTERVALHOURLY
FILTERINGUNFILTERED
STATISTICS FOR E—W(U) AND N—Sly) COMPONENTS
N AVG(U) AV&(V) VAR(U) VAR(V) STD(U) 510(V) COV(UV)
3712 6.5 —3.6 129.6 94.3 11.1+ 9.7 —78.3
VECTOR MEAN) SPO = 7.1 DIR 119 OEGREES(T)OTRECTIONAt. STEADINESS' L.8.0 Z
PRINCIPAL AXIS IS 128.6 DEGREES(T)
STATISTICS FOR COORDINATES ROTATED 45 OEGREES(EQUIVALENT ALONGSI4ORE DIRECTION = 135 OEGREEStT3)
MILA LEGp4
VARIABLE N MEAN STO SKEW KURT MAX MIN
S (CM/S) 3712 15.5 6.3 .6 3.1 40.2 3.9
U 3712 5.8 —.1 2.9 19.8 —20.6
V (CM/S) 3712 —7.1 i3.8 .5 2.4 38.5 —38.5
T(OEG C) 3712 .6 —.4 2.7 16.3 12.8
144
LEG DEPTH
FIRST 5 LINES OF DATA:1733 9 76 13.6 —12.6 13.6 —12.6 13.25 1.
1803 30 9 76 12.2 —11.8 25.8 —24.4 13.22 2
1903 30 9 76 15.4 —6.9 41.2 —31.3 13.30 3
2003 30 9 76 9.4 -13.5 50.6 —44.8 13.41 4
2103 30 9 76 9.8 —14.0 60.4 —58.8 13.39 5
LAST 5 LINES OF DATA)403 1 3 77 2.4 5.7 24157.1 —13232.5 14.91. 3708
503 4 3 17 .4 6.9 24157.5 —13225.6 15.16 3109
633 4 3 77 .1 5.8 24158.2 —13219.8 14.94 3710
703 4 3 77 2.8 o.0 24161.0 13213.8 14.97 3711
803 4 3 77 3.6 7.3 —13206.5 14.99 3712
—.70 83
2.1

I..
14548 UET[RS AT MILA 4. 30 SEP 76 — 4 77. TAPE 1962/3.
,IMEPN
5.1 5.8 12.4 16.0 19.7 23.3 27.0 30.6 34.2 37.9 41.5
SPECS, CM/SEC
0.10
0.09
0.08
0.07
'- 0.06
0.03
0.04
0.03
0.02
0.01
0.00
0.16
0.14
0.12
0.10
0.08
0.06
0.04
0.02
0.00
1000
100
10
1
0.1
0 20 40 60 80 100 120 140 160 180 200 220 240 260 250 300 320 340 360
OIRECTIQN. OEOREES TRUE
AT 48 N. NILA 4. 130 OATS 3TPRTINC 1803 1 OCT 76.
I
-3 —2.5 —2 -1.5 —1 -0.3 0 0.5
FREGUENCT • CTCLES PER DAY

--30.00
40.00
014.00
13.00
02.00
40 N AT NILA LEG 4. JIOURLIES,
154.7 DAYS StARTING 1700 CMI 30 SEP
I-P-I -4-4-I -I-.--I-44-I-f44-4-4--I-I-I-I-I4--I-4-4-4-14 41-44-4-I-f 1-4-4-4-4-4 4—I-I-I--I-I- 4-4-4- 4-44-4--I-4-I--I-4-I-4-I-1 4—I-4--I -1-4-4-44 4-4 -I-I-I-I--I-4-I.4-4-4-4-I-I4-I--P-I--4--I-I-4-4--4--I-4- II

STATISTICS FOR E—W(U) AND N—S(V) COMPONENTS
N AVG(U) AVG(V) VAR(V) STO(U) 510(V) COV(UV)
3232 3.7 -1.7 1140.8 2.56.6 11.9 12.5 —88.3
VECTOR MEAN SPO CM/S, DIR = 1114 DEGREESCI)DIRECTIONAL STEADINESSt 214.2 7.
AXIS IS 137.6 OEGREES(T)
FOR COORDINATES ROTATED 145 DEGREES
(EQUIVALENT ALONGSP4ORE DIRECTION = 135 OEGRE•ES(T))
MILA LEG 421
N MEAN Sb SKEW KURT
k.5 1.1 6.2
—.2 2.6 214.7 —29.6
-3.8 .5 2.3 40.9 —40.5
T(OEG C) 3712 114.3 .6 —.3 2.o 15.6 12.5
STATIONNIL A
LEG4
147
TAPE NO2.9614/3
DEPTH73
INTERVALHOURLY
FILl ERINGUNFILTERED
FIRST S LINES OF DATAT—1.3 13.33 1
1705 30 9 76 j•14 —1.3 18.1412.98 2
30 9 76 11.7 5.7 36.15.0 13.13 3
30 9 76 17.2 .6 53.3.6 13.18 14
2005 30 9 76 15.3 -14.14 68.6—10.1 13.25 5
2105 30 9 76 12.3 —10.7 80.9
LAST S LINES OF OATA*114.71 3708
1405 14
505 14
605 Z.
3 773 773 77
0.0 0.00.0 0.00.0 0.0
20327.820327.8 —t1012.020327.8 —11012.0
—11012.0
114.71114.6814.71
37093110.3711
705 3 77 0.0 3.3—11012.0 14.71 3712
805 14 3 77 0.0 0.0 20327.8
CRLTN—.59145
VARIA9LE
S (CM/S) 3232
U (CM/S) 3232
V (CtI/S) 3232
16.8
1.4
MA X
5.8
7.8
1.1.
NIH

0.10
0.09
0.08
0.0?
0.06
0.05I-
0.04
0.03
0.02
0.01
0.00
14873 AT AILA 4. 30 SEP 76 — 2 FEB 7?. TAPE 1964/3.
,I.IIEAN
0 4.6 7.6 10.7 12.8 16.9 20.0 23.0 26.1 29.2 32.5 35.4 38.4
SPEED,
0.14
0.12
0.10
I ::0.04
0.02
0.000 20 40 60 80 100 120 140 160 180 200 220 240 260 280 300 320 340 360
DECREES TRUE
1000
100
AT 73 II • uCLA 4, 120 DAYS 3TARIIND 1805 1 OCT 76.
10
0.1—3 —2.5 —2 —1.5 —1 —0.5 0 0.5
FREQUENCY • CYCLES PER DAY
1.5 2 2.5 3

14114
40M0
U;
III II I14 I_4-t4 .I—)-I 1-41
—40.00
I 4-14-I-I II 1+1-14
73 H AT MhIfl LEC 4,154.7 OATS STARTING 1700 GMI 30 1915

STATION LEGMILA
DEPTH TAPE NO99 503/31+
STATISTICS FOR E—W(U) AND N-S(V) COMFONENIS
N AVG(U) AVG(V) VAR(U) VAR(V) STO(U) STO(V) COV(UV) CRLTN3712 3.8 —3.0 76.3 51.8 8.7 7.2 —32.7 —.5202
VECTOR MEAN SPO 4.9 CM/S, DIR = 128 DEGREES(T)OIRECTIONAL STEADINESS: 1.2.9
PRINCIPAL AXIS IS 124.3 OEGREES(T)
STATISTICS FOR COORDINATES ROTATED 45 DEGREES(EQUIVALENT ALONGSHORE DIRECTION = 135 DECREESET])
MILA LEG 1+
VARIABLE N MEAN STD SKEW KURT MAX MIN
.4 2.7 30.1. —30.3
T(OEG C)* 3712 .6 2.6 15.1. 12.3
P (DBAR) 3712 99.1 .2 .3 2.3 99.6 98.9
* No post-calibration available. Temperature data were processed using
the pre-calibration of 4 February 1976. See discussion in Appendix 2.
150
INTERVALHOURLY
LINES9 769 769 769 769 76
FILTERINGUNFILTERED
FIRST 5173'. 301804 301904 302004 30
30
LA ST
40531+
601+
704804
OF DATA12.410.8 6.711.5 .89.3 —6.19.8 —4.5
OF DATAI4.2 .72.9 —3.11.5 —3.12.6 —2.02.8 —3.3
5 LINES1$. 3 771. 3 771+ 3 771. 3 174 3 77
12.423.234.1'+4.053.8
14103.81k106.714108.214110.814113.6
.1.
7.17.91.8
—2.7
—11187.4—11190.5—1119 .3.6—11195.6—11198.9
12.9612.9412.9112.9412.96
14.3914.4214.4714.4414.47
992500992500992500992500992500
992500988900988900988900988900
I
2
3
5
31083709371031113712
S (CM/S) 3712
U (CM/S) 3712
V (CM/S) 3712
11.3 1.3
.6 5.6 -.2
3.8 30.9
—4.8 9.8
2.6
.2.7 17.5 —20.6

0.12
0.10
0.00
I-U
0.06
0.04
0.02
0.00
thOO
1 5199 AT NILA 4. 30 SEP 74-4 lIAR 77. TaPE 503/34.
.l.1IERN0.12
0.10
0.00
0.06
0.04
0.02
0.000 4.1 7.0 9.0 12.6 15.4 10.2 20.9 23.7 26.4 29.1 3t.0 34.4
SPEED, CA/SEC
0 20 40 60 80 100 120 140 160 180 200 220 240 260 200 300 320 340 360
DIRECTION, DECREES TRUE
CURRENT AT 99 A, AU.A 4. ISO DAYS 3TARTINC 1804 1 OCT 76.
100
10
0.1-3 -2.5 —2 -1.5 -1 -0.5 0 0.5 1 (.5 2 2.5 3
FREOUENCY, CTCLES PER DAY

—30.00
40.00
— 20.00
0.1)0
, -20.00
—40.00
11.00 I., 444-I-144-4-H+1414-4)4-l)lIi t -I+4-I-I--14-l-4-4-)4-I-I4-) 14- I-S 44-4 -I-S 4-I-I-I 444-1-14-4-4-44 I-I-4-$-1-I--I-I-4-++-I-I-4-1--I-4-I-I-I--4-4l 4-4-4 1-4-I-I--I- 54-I-I-Il-1-14-4-4-4-1-1-4-U
L__ -- - jJj. 97.00 -1-4-1-4-4-4-1-1-14 54-4-44-1-4-f-I-I- -4-4-4-14± H—I-4-4-I--I++-I S-I-I--I-I-I-I- H-I-I-f 4-1-4-I +5—I--I-f -I--I-H44-I-f +4-I-fI-F-I±H+++++4+f -5-1-1-14-44 14-1-5-44-I-f 4-141 +5-4-1-44-I- 144 HI
99 II AT MILA L9C 41154.1 01519 SThJ1)TINO 4709 CMI 35) S9P 1979

153
INSTALLATIONS: Leg V (MAM '77)

155
JOINT—lI 1977 Installation
AGAVE V
Posi tion*:Distance Offshore:Bottom Depth:Set:Retrieved:Longest Data Interval:Longest Record Length:
Instrumentation
15°04.O'S, 75°27.8'W4.0 km
- 86 m1909 GMT1138 GMT0200 GMT70 days, 3 hours
4 March 1977 by R/V MELVILLE14 May 1977 by R/V ISELIN5 March to 0400 GMT 14 May
Intended Accepted Serial Sampling MeasuredDepth Depth Tape # Interval Variables
20 m 26 m 682/36 20 mm S,o,T,P,C40 m 46 m 489/35 15 mm S,o,T60 m 67 m 684/33 20 mm S,e,T,P,C70 m 77 m 497/32 15 mm S,e,T
* Navigation: radar fixes and Peru chart DHNM 2200.

'5
24 rf€TERS PIT P3flVE. 4 77 - t4 77. 432fld. 44 lIt ACmE. 4 77 - t4 77. 459fl5.
50
-150
200 250 300 350
-J(TI
—200
—250
—200
7? M 4 77 — 14 $IT 7). TAPE 4 FIFIR 77—14 uIqY 77.

N MEAN STO SKEW KURT lAX tIIN
S (CM/S) 1683 4.9 .2 39.0 1.2
U (CM/S) 1683 3.8
V (CM/S) 1683 —3.3 13.9
T(DFG 1631 15.5
2.9 26.4
.2 1.8 26.9 —37.8
.2 3.3 jo.6
165.3 26.2 .3 .6 3.2 27.4 25.5
157
STATION LEG DEPTH TAPE NO
AGAVE 5 2. 632/36It4TEP VALHOURLY
FILTERINGLOW PASS
FIRSI 5 LINES OF OATA.200 5 3 77 10.0 —3.6 —3.6 15.56 265180 43.633
3 77 11.1 2.2 21.2 —6.5 15.69 263189 43.76743.692400 5 3 77 14.9 36.1 —1.1 15.61
530 5 3 77 1,.33 77 15.1 0.2 6b.5 2.6 15.46 260839 43.524
LAST 5 LINES OF DATA'2 5 77 12.9 —la.6 7954.2 1216.1 15.90 2617½1 42.548
100 14 5 77 14.9 —5.9 7969.0 1210.2 15.74 257575 '+2.364
200 14 5 7, 12.9 7981.9 1003.8 15.70 256874
3u3 14 5 77 10.1 1992.0 991.1 15.77 260344 42.500
STATISTICS FOR E—W(U) AND N—S(V) COMPON€NTS
N AVG(U) AVG(V) VAR(U) VAR(V) STD(U) STO(V) COV(UV) CRLTN1681 .6 125.5 113.6 11.2 10.7 —72.8 —.6097
VECTOR MEAN: SPO 4.3 DIR 83 OEGRE€S(T)DIRECTIONAL STEADINESS: 31.1 7.
PRINCIPAL AXIS IS 132.7 OEGREES(T)
STATISTICS COORDINATES ROTATED 45 DEGREES(EQUIVALENT = 135 L3EGREES(T))
AGAVE LEG 526 M

0.20
0.18
0.16
0.14
4.12
0.10
0.08
0.06
0.04
0.02
0.00
1000
too
-ICC'
'Si
23
to
15826 SIETERS AT ACAVE. 4 lIAR 37 - 14 ART 77. TAPE 682/56.
—3 —2.5 —2 —1.5 —1 —0.5 C 0.5 1 1.5 2 2.5 3
PER OAT
5.1 #.i 15.0 i6.8 20.6 24.4 28.2 51.9 55.6 39.3 42.9SPEED. CIt/SEC
0.08
0.07
0.06
0.05
0.04
0.05
0.02
3.0.1
0.00o 20 40 60 80 100 123 143 160 180 200 220 240 263 280 323 320 340 360
DIRECTIIIi, DEGREES TRUE

U,
z1-,
30.00 -20.00
0.00_
—20.00
30.020.0
0.00
—20.00
—40.00
17.00
j14.00
I APR26 14 AT ACAVE LEG St HOURLIES,
70.1 OATS STARTING 200 GHT 5 MAR 1911
0,'.0
I MAY

STATION TAPE NO'+6 '+89/35
INTERVALHOURLY
FILTERINGLOW PASS
STATISTICS FOR E—W(tJ) AND N—S(V) COMPONENTS
N AVG(U) AVG(V) VAR(U) VAR(V) STOCU) STD(V) COV(UV)
—2.5 107.8 9.9 l(.L. —68.'.
VECTOR MEAN* SPO = 10.4 CMIS, DIR = 104 DEGREES(T)
DIRECTIONAL STEAOINESS 61.3 7.
PRINCIPAL AXIS IS 137.0 OEGREES(T)
STATISTICS FOR ROTATED 45 DEGREES
(EQUIVALENT DIRECTION = 135 )EGREES(T])
AGAVE LEG 546 'I
VARIABLE N MEAN Sb SKEW KURT MAX PUN
S (CM/S) 16R3
U (CM/S) 1683
V (CM/S) 1683
16.9 5.2
5.4 5.9
—8.9 13.1
7.0 .2.7 .6
—.1 2.9 22.2 —14.5
.6 2.6 23.4 —42.5
T(OEG C) 1683 15.3 .2 .1 2.6 16.0 14.9
160
LEG DEPTH5
FIRST 5 LINES OF DATA:14.94200 5 3 77 14.6 —9.1 14.6 —9.1
300 5 3 77 9.7 —11.5 24.3 —20.7
'+00 5 3. 77 8.9 —12.5 33.1 —33.114.93SOC 5 3 77 8.4 —14.1 41.5 —'+7.314.955 3 77 6.6 —16.4 48.1 —63.6
LAST 5 LINES OF DATA0 14 5 77 15.2 —12.3 16926.4 —4128.1 15.32
15.30100 1'. 5 77 15.0 —11.4 16941.'. —'.139.615.3114 5 77 —lt.9 16954.9 —'.152.5
jL4
1'.5 775 77
14.3 —11.315.9 —9.3
16969.216985.1
—4163.8—4173.1 15.34
I
2
3
45
16791680168116821683
CR LT N
—.665 8

V.,z'SI0
161
46 1ETERS AT ACAVE. 4 77 — 14 77. TAPE 489/35.
0.20
0.18
0.16
0.14
0.12
0.10
0.08
0.06
0.04
0.02
o .oo0 5.5 9.9 14.2 18.5 22.7 26.9 31.1 35.2 39.2 43.3 47.3
SPEED • CA/SEC
0.12
0.10
0.05
0.06
0.04
0.02
0.000 20 40 60 80 100 120 140 160 180 200 220 240 260 280 300 320 340 340
DIRECTION. CECREES TRUE
1000
too
10
0.1—3 —2.5 —2 —1.5 —1 —0.5 0 0.5 1 1.5 2 2.5 3
FREOUENCT, CYClES PER 0111

I APR46 H AT AGAVE LEG 5: HOURLIES,
70.1 DAYS STARTING 200 Gt4T 5 MAR 1977
wr
30.0020.00
—20.00
30.00
10.00
—10.00
—30.00
—50.00
16.50
F..
C,
C,w0I-
16.00
15.00
14.00 IIHIJIII II Illi 111111 lilt, 11111111111111111111 I I
-JN)
MAY
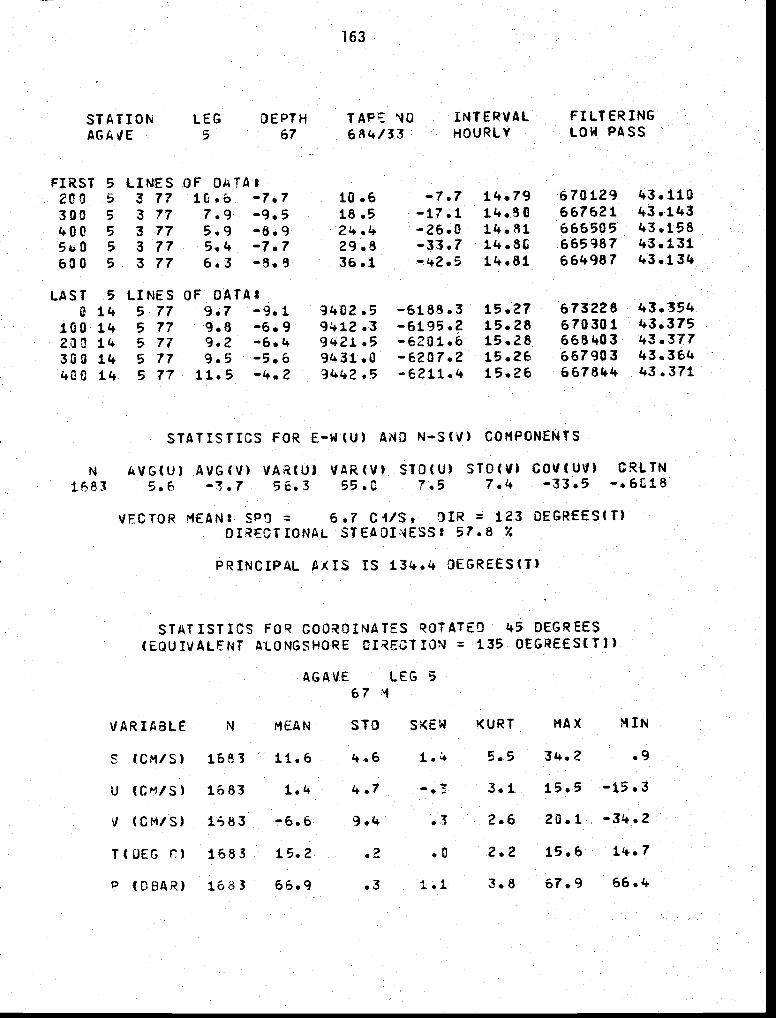
STATISTICS FOR E—W(U) AND N—SfV) COMPONENTS
N AVG(U) AVG(V) VAR(U) VAR(V) STOCU) STO(V) COV(UV) CRLTN1683 5.6 —'.7 56.3 55.C 7,5 7.4 —33.5 —.6C18
VECTOR MEAN SP!J = 6.7 C1/S, !)IR = 123 DEGREES(T)DIRECTIONAL 57.8 X
PRINCIPAL AXIS IS 134.4 3EGREES(T)
STATISTICS FOR ROTATED 45 DEGREES(EQUIVALENT ALOMGSHORE DIRECTION 135 OEGREES(T3)
AG AVE67 1
LEG 5
VARIABLE N STO 1(URT MAX MIN
.2 .0 2.2 15.6 14.7
P (D8AR) 1o83 66.9 .3 1.1 3.8 o7.9 66.4
163
STATION LEG DEPTH TAPE NO
AGAVE 5 67 684/33INTERVAL FILTERINGHOURLY LOW PASS
FIRST 5 LINES OF DMTA:200 3 77 10.6 —7.7 10.6 —7.7 14.79 670129 43.110
300 5 3 77 7.9 —9.5 18.5 —17.1 1.30 667621 43.143400 5 3 77 5.9 —8.9 24.4 —26.0 14.31 666505 1+3.158
5 3 77 5.4 —7.7 29.8 —33.7 14.80 665987 43.131
600 5 3 77 6.3 —3.3 36.1 —42.5 14.81 664987 43.134
LAST 5 LINES OF DATA:0 14 5 77 9.7 —9.1 9402.5 —6188.3 15.27 673228 43.354
100 14 5 77 9.8 —6.9 9412.3 —6195.2 15.28 670301 43.37514 5 77 9.2 —6.4 9421.5 —6201.b 15.28 668403 43.377
300 14 5 77 9.5 —5.6 931.0 —6207.2 15.26 667903 43.364400 11. 5 77 11.5 4.2 15.26 667844 1+3.371
S (CM/S) 1683 11.6
U (Cs/S) 1683
V (CM/S) 1683
1.4
—6.6
4.7
9.1+
T(OEG 1683 15.2
1.4 5.5 3k.2 .9
3.1 15.5 —15.3
2.6 20.1. —34.2

0.18
0.16
0.14
0.12
o:io
0.08
0.06
0.04
0.02
0.00
0.16
0.14
0.12
0.10
0.08
0.06
0.04
0.02
C .00
16467 IIETERS AT AGAVE. 4 lIAR 77 — 14 OAT 77. TAPE 684/77.
0 4.0 7.8 11.0 14.2 17.5 20.6 22.0 26.9 30.1 33.1 36.2
SPEED. CA/SEC
I-,
I
0zC
0 20 40 60 80 100 120 140 162 180 200 220 240 260 280 303 322 343 363
D:RCCTICN, DECREES TRUE
1000
.100
10
0.1
Ar
—3 —2.5 —2 -1.5 —1 —0.5 C 0.3 1 1.3 2 2.5 3
PREOUI.401 • CTCI.ES PER DAT

20.00
0.00
—20.00
—40.00
III liii liii 1)111 III 1111111 111111 111111 III
IAPR %MAY
H AT LEG HOURLIES,
70.1 DAYS STARTING 200 GMT 5 MAR 1977

STATISTICS FOR E—W(U) N—S(V)
N1683
AVG(U) VAR(U) IIAR(V) STO(U) 510(V) COV(UV) CRLTN3.2 —3.7 37.7 5.4 6.1 —18.8 —.5648
VECTOR MEANT SPO 4.9 C1/S, OIR = 139 OEGREES(T)DIRECTIONAL STEAOHESS 56.6 X
PRINCIPAL AXIS IS 141.2 OEGREES(T)
STATISTICS FOR COOROINATES ROTATED 5 OEGREESALONGSf4ORE = 135 CEGREESCTI)
AGAVE77 M
LEG S
VARIABLE N MEAN STO SKEW KURT MAX MIN
S (CM/S) 1683
U (CM/S) 1683
• 5.5 28.7 .8
3.6 13.4 —16.5
" (CM/S) 1683 —'4.9 7.2 .' 2.8 13.9 —28.6
T(OEG C) 1683 15.1 .2 .0 2.7 15.5 14.6
166
STATION LEG OEPTW TAPE MOAGAVE 5 77 497/32
FILTERINGLOW PASS
INTERVALHOURLY
FIRST 5 LINES OF OATA200 5 3 77 5.2 —6.0 5.2 14.76 1
300 5 3 77 2.8 —7.4 8.0 -13.3 14.78 2400 5 3 77 2.1 —6.2 10.1 —19.5 14.79 3
500 5 3 77 0.8 —6.2 10.9 —25.7 14.79 4600 5 3 77 0.6 —7.8 11.5 —33.5 14.79 5
LAST 5 LINES OF DATA S
0 14 5 77 7.8 —7.6 5409.8 —6230.2 15.26 1679100 1'. 5 77 8.1 —5.3 5417.8 —6235.2 15.27 16802J8 1'+ 5 77 8.6 —4.3 5426.5 —6239.5 15.27 1681330 14 5 .7 8.8 —3.2 5435.3 —6242.8 15.27 1682
14 5 77 9.7 —3.8 —6246.6 15.26 1683
8.7 4.0 1.3
—.3 3.8 —.2

IL'
C
U-
ILla-
I-
J,tEAN
167fl I1ETEAS At ACAVE. 4 11RA 7) — 14 hAY 7?. TAPE 497/33.
0.12
0.10
0.03
b.o6
0.04
0.02
0.00
0.14
0.12
0.10
o .oe
0.66
0.04
0.02
0.00
0 3.8 6.4 9.0 il.6 14.2 16.8 19.3 21.9 24.4 26.9 29.4 31.9 34.3
SPEED, Cr1/SEC
0 20 40 60 80 100 120 140 160 180 200 220 240 240 280 300 320 340
DIRECTION • DECREES TRUE
0000
100
to
0.1—3 —2.5 —2 —1.5 —1 —0.5 0 0.0 1 1.5 2
FREOLJENCY, CYCLES PER DAY
2.5 :3

0
waI-
20.00
;20.0010.00
-10.00
> —30.00
16.00 T
I • t i s u i .L . A • • kIM1 i
15.00
14.00
,-
Illil I
I MAY77 N AT AGAVE LEG 5: HOURLIES,
70.1 DAYS STARTING 200 GMT 5 MAR 1977

169
JOINT—Il 1977 Installation
MILA V
Posi tion*:Distance Offshore:Bottom Depth:Set:Retrieved:Longest Data Interval:Longest Record Length:
Ins trumentati on
15°06.O'S, 75°30.8tW12.0 km121 m1825 GMT2022 GMT0100 GMT69 days,
Comments:
The meteorological buoy data logger (0167) leaked after the firstsix days of the installation and the subsequent record was not usable.
Slowing of the rotor on RCM 687 (19 m) due to heavy fouling was apparentby 1 May 1977. Speed and component velocities were accepted through00 GMT 30 April, and zeroed out of the record thereafter. The gearboxand speeds were such that 1/3 - 1/2 of the remaining speed observationshad to be linearly interpolated.
* Navigation: radar fixes and Peru chart DHNM 2200.meteorological buoy was estimated to be 15°05.5'S
The position of the MILA V75°29.7'W.
5 March 1977 by R/V MELVILLE14 May 1977 by R/V ISELIN6 March to 1300 GMT 14 May13 hours
Intended Accepted Serial Sampling Measured
Depth Depth Tape # Interval Variables
O m 0 m Dl67/5 20 mm Sw,Ow,Ta,T20 m 19 m 687/24 20 mm S,o,T,P,C40 m 39 m 488/27 15 mm S,o,T60 m 59 m 752/25 20 mm S,O,T,P,C80 m 80 m 490/30 15 mm S,O,T
100 m 100 m 686/34 20 mm S,O,T,P,C115 m 115 m 1241/8 15 mm

170
WIND AT tIILA V. 6.0 DAYS STARTING 1358 5 rIAR 7?
1750
1400
1050
?00
—1?5O —1400 —1050 -700 -350 350

STATISTICS FOR E—W(U) ANO P4—5(V) COMPONENTS
N AVG(U) AVGU) VARCU) VAR(V) 510(U) 510(V) COV(UV)132 3.3 1.9 2.1 2.0 1.5 —1.6
VECTOR MEAN: SF0 = 14.7 1/5, DIR = 145 CEGREES(T)OTRECTIONAL STEADINESS 95.5 7.
PRINCIPAL AXIS IS 120.7 DEGREES(T)
STATISTICS FOR COOROINA?ES POTATED DEGREES(EQUIVALENT ALONGSHORE DIRECTION 135 DEGREESCTI)
MILA0',
LEG 5
VARW3LE N MEAN STO SKEW KURT MIN
S (M/5) 132
Li (MIS) 132
—.6 2.6
—.2 2.7
2.2 —.7
.6
2.5 —3.7
13' .7 2.3 17.4 15.4
132 1.S.4 .7 20.9 16.8
171
LEG DEPTH TAPE NO INTERVALPASSMILA 5 0 0167/5 HOURLY
FIRST 5 OF DATAt2000 5 3 77 —3.0 5.5 —3.0 5.5 18.68 16.77
22100 6 3 77 —3.8 3.6 —6.7 9.0 18.31 lo.863 77 —6.0 3.9 —12.8 12.9 18.74
1+2300 5 3 77 —6.7 z+.2 —19.5 17.1 19.25 16.685
0 6 3 77 —6.9 5.9 —26.1+ 23.0 19.43
LAST 5 LINES OF DATA I300 11 3 77 —'+.L+ 2.1+ 417.1+ 19.02 17.21 1281490 11. 3 77 —3.6 '+,1 —1+39.0 18.96
130500 11 3 77 —2.7 4.6 '+26.1 19.39 17.16131600 11
700 113 773
—1.9—3.3
3.01.7
—'+43.7—1.47.0
429.14.30.8 18.72 17.35 132
CRLTN—.5613
2 .0
1.2
V (M/S)
1W (flEi)
—.1
4. 7132 2.9 9.1 —1.3

I
172
hIND AT MILA V. 5 MAR 77 - 11 MAR 77. TAPE 0167/5
.1. MEAN0.24
0.22
0.20
0.18
0.16
0.14
0.08
0.06
0.04
0.02
0.000 1 2 3 4 5 6 7 8 9 10 11 12
SPEED, ti/SEC
0.20
0 • 18
0.16
0.14
0.12
0.10
0.08
0.06
0.04
0.02
0.000 20 40 60 80 100 120 140 160 180 200 220 240 260 280 300 320 340 360
DIRECTION, DECREES TRUE

19 5 AT IIfl.A V. 70.0 OATS SIASTING 190* 5 005 77
00 II AT HILA V. 70.0 OATS $Tf*TINO 5 OAR 77
$9 II AT IIILA V. 70.0 0575 31551190 1*42 5 lIAR 77 115 N AT 5115 5. 70.0 0513 STARTING 1547 5 00$ 77
43
225
-100
-225
—I-.4
200 250 500
—125 500 625
—250
—275
29 H AT ASIA V. 70.0 OATS STARTING 1554 5 lIAR 77
—12$
-200
750 70.0 OATS STASTIN$ 1547 5 77
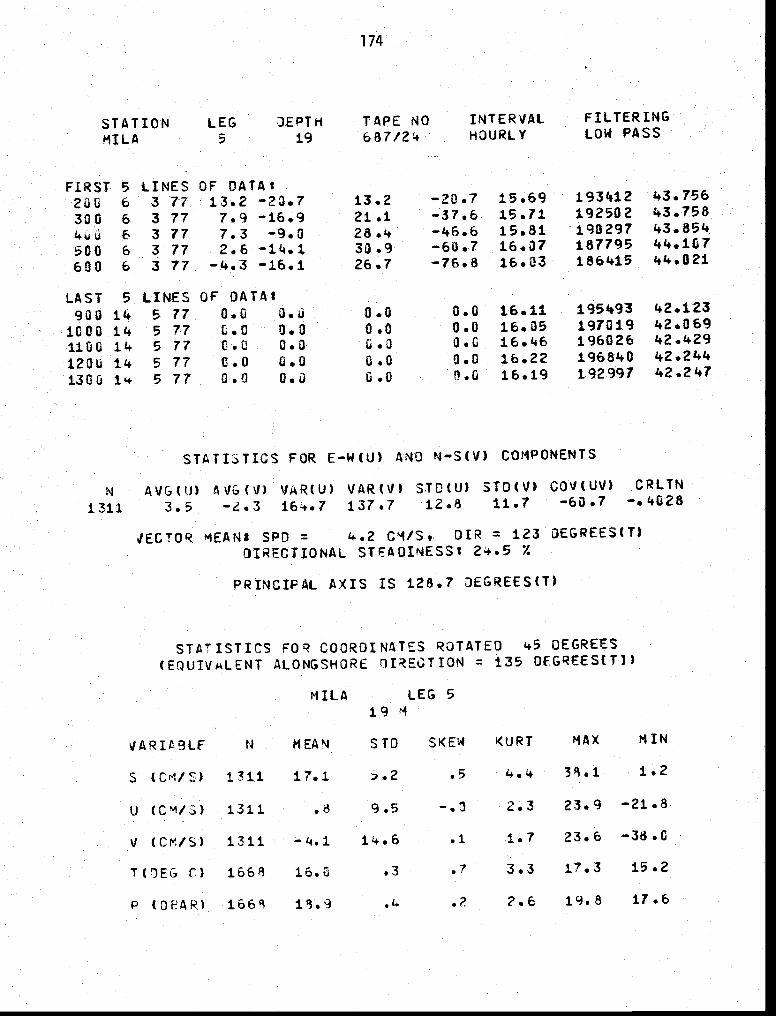
STATIONMILA
TAPE NO19
INTERJALHOURLY
FILTERINGLOW PASS
N MEAN
S (Cr415) 1311 17.1
510 SKEW KURT
.5 38.1 1.2
U (CM/3) 1311
\I (CM/S) 1311
T(!)EG C) 1668
.8 9.5
14.6
16.3 .3
2.3 23.9 —21.8
.1. 1.7 23.6 —38.0
.7 3.3 17.3 15.2
P (DEAR) 1668 18.9 .4 •. 2.6 19.8 17.6
174
LEG DEPTH5
FIRST 5 LINES OF DATAt'+3.756
206 3 77 13.2 —23.7 13.2 —20.7 15.69 19341243.758330 6 3 77 7.9 —16.9 21.1 —37.6 15.7143.854kuu €' 3 77 7.3 —9.0 28.4 —46.6 15.81 190297
187795 '+4.107500 6 3 77 2.6 30.9 —6U.7 16.37
186415 44.021600 6 3 77 —4.3 —16.1 26.7 —76.8 16.33
LAST 5 LINES OF DATA1'+2.123900 14 5 77 0.0 3.0 0.0 0.0 16.11 195493'+2.0691000 14 5 77 6.0 0.0 0.0 0.0 16.35 197019
196026 42.4291106 14 5 77 0.0 0.0 0.0 0.6 16.4642.244120U 14 5 77 0.0 3.0 0.0 16.22
192997 42.247130u 1'+ 5 77 0.0 O.i u.0 fl.6 16.19
STATISTICS FOR E-W(lJ) AND N—S(V) COMPONENTS
N AVG(U) VAR(V) STOCU) STO(V) CO'1(UV) CRLTN
1311 3.5 —2.3 137.7 12.8 11.7 —60.7 —.4028
1ECTOR MEANS SPO = CM/S, DIR = 123 DEGREES(T)DIRECTIONAL STFADINESS* 24.5 7.
PRINCIPAL AXIS IS 128.7 3EGREES(T)
STATISTICS FOR COORDINATES ROTATED 45 DEGREES(EDUPJuLENT ALONGSHORE OIREt.TION = 135 OEGREES(T1)
fIILA LEG 519
MAX MIN

0.14
0.12
o . to
o .oe
0.06
0.04
0.02
0.00
175
19 0 AT lILA V. 5 liaR 77 — 29 APR 77. TAPE 657/24
1.16
I
0 5.1 9.1SPEED, Cl/SEC
24.4 28.2 35.6 59.3 42.9
0.07
0.06
0.05
0.04
o .os
o 20 40 60 80 tOO 120 140 161 180 230 220 240 260 280 300 220 210 360
3E.3YEES TRUE
0.02
0.01
0.00
1010
too
to
a-
012Ill'a-ICC
Ui4-4)
-3 -2.3 —2 -1.5 -1 -0.3 0 0.5 1 1.5 2 2.1 3
313' ES 4E8 DAY

U)
C,
C,w0I.-
30.0020.00
0.00
—20.00
30.00
10.00x
—10.00 -
—30.00
L . . . AIV
—40.00
17.50
16.50
15.50
14.50
20.00
18.00
16.000.
I. LAJIAIIIAilgAnJ.*iA A — I i& I AI
I APR19 H AT MILA LEG Si HOURLIES,
69.5 OATS STARTING 200 CMT 6 MAR 1977
I
I MAY

STATISTICS FOR E-W(U) AN.') N—S(V) COMPONENTS
N AVG(U) VARIU) VAR(V) STJ(U) STD(V) COV(UV)
1668 9.3 —3.4 96.9 111.3 9.8 10.6 —50.4
VECTOR MEANt SPO = 9.9 GuS, DIR = 113 OEGREES(T)
DIRECTIONAL STEADINESS' 60.0 Z
PRINCIPAL AXIS IS 139.2 O€GREES(T)
STATISTICS FOR COOROINATES ROTATED '+5 DEGREESALONGSHORE DIRECTION = 135
MILA LEG 5
VARIABLE N MEAN STJ SKEW KURT MAX IIN
1.5 7.7 42.3
—.1 2.5 21.7
.4 2.7 19,8 -42.2
.2 .'+ 3.4 16.4
177
STATION LEG DEPTH TAPE NO
MILA 5 39 '+88/27
INTERHOURLY
FILT€RINGLOW PASS
FIRST 5 LINES OF OATA$1
130 6 3 77 14.7 —16.6 14.7 —16.b 15.162
200 6 3 16.2 —14.7 30.8 —3i.3 15.123
300 6 3 77 18.0 —14.7 48.8 —'+6.1 15.064400 b 3 77 15.6 —11.3 64.4 —57.. 15.195500 6 3 77 11.6 —12.7 76.0 —70.1 15.31
LAST 5 LINES OF DATA:1664
11+ 5 77 17.8 —3.4 15517.3 —5675.2 15.5316659u0 14 5 77 17.1 —8.0 15534.4 —5683.3 15.58166614 5 77 15.3 —9.'+ i55k9.5 —5692.71667
1103 5 77 12.5 —8.7 15562.0 —5101.4 15.47166814 5 77 lu.1 —10.7 —5712.2 15.52
CRLTN—.4841
S (CM/S) 16.6 5.7
U (CM/S) ..2 7.3
V (CM/S) 166S —9.0 12.4
T(JEG 1663

0.18
0.16
0.14
0.12
d 0.06
0.04
0.02
1-U
C'aIi.'a
0
UUa.4,
0.00
0.04
10CC
100
10
0.1
178
39 II AT MXI.A V. 5 MAR 7? — 14 fIAT 7?. TAPE 488/27
1.5 2 2.5 3
.l,IIEAN
0 5.5 9.9 14.2 18.5 22.? 26.9 31.1 35.2 39.2 43.3 47.3
SPEED, CM/SEC
0.12
0.08
0.06
0.02
0.000 20 40 6C 80 100 120 140 160 150 200 220 240 260 300 320 340 360
DIRECTION, DECM!E5 TRUE
LP CURRENT AT 39 II, NItA V. 69 OATS SYNC 100 6 MAR 77
—3 —2.5 —2 —1.5 —1 —0.5 3 0.5FREOUENCT • CTCI.LS PER OAT
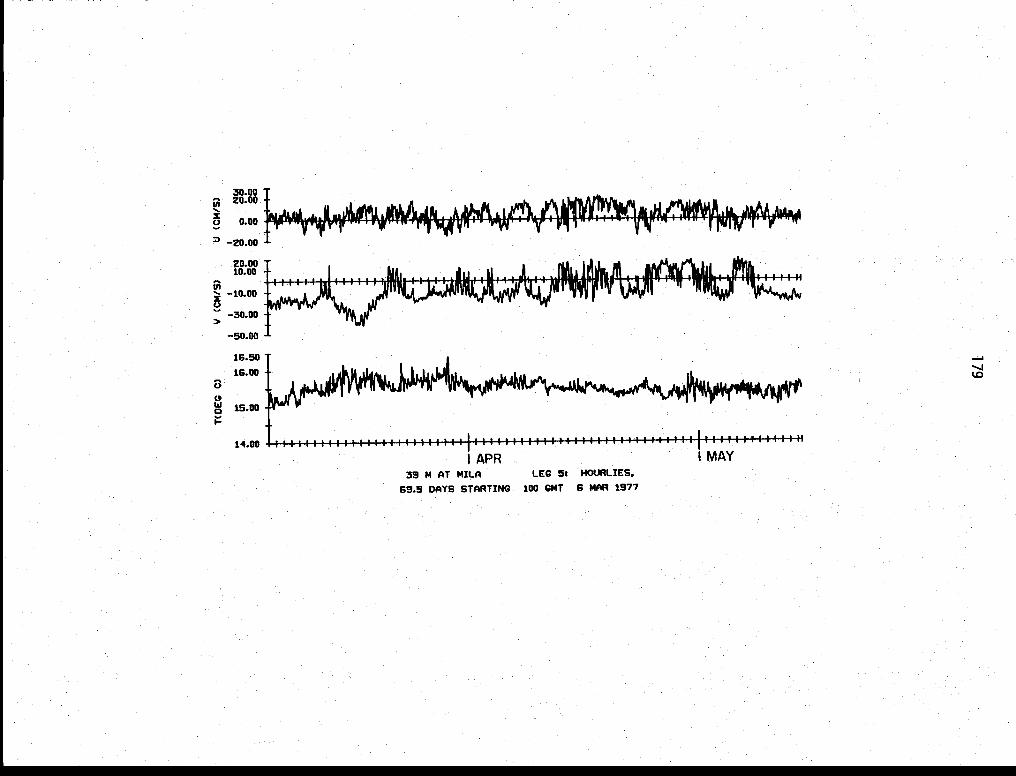
30.00 -20.00
zC) 0.00
20.0010.00
—10.00
—30.00
-50.00
1 I I I
C)
C.,
Iii0I-
16.50
16.00
15.00
14.00 II iiItiIiII 111111 III 11111 IlIttlIllI IIIAPR IMAY
39 N AT MILA LEG 5: HOtIRLIES,
69.5 DAYS STARTING 100 GMT 6 MAR 1977

ST A 110 N
MILALEG DEPTH5
180
TAPE NO FILTERINGLOW PASS
STATISTICS FOR E—W(U) AND N—S(V) COMPONENTS
N AVG(U) AVG(VI VARCU) VAR(V)1669 1C.3 89.5 99.7
510(V) COV(UV) CRLTN9.5 IC.u —55.6 —.5888
VECTOR MEAN: = jO.8 DIR = 107 OEGREES(T)DIRECTIONAL STEADINESS' 65.4 Z
PRINCIPAL AXIS IS 137.6 OEGREES(T)
STA1ISTICS FOR COORDINATES ROTATED +5 DEGREES(EQUIVALENT ALONGSHORE DIRECTION = 135 DEGREES(TJ)
MILA59 '1
LEG 5
VARIABLF N MEAN STO SKEW KURT MAX MIN
U 1669
7.5 .7
2.6 —13.9
V (CM/S) 1669 —9.6 12.3 .4 2.8 19.3 —1.3.8
C) 1669 15.2 .2 .C 2.8 15.9 14.7
P (OBAR) 1669 .1 1.5 6.0 59.8
5 LINES OF DATA:lOU 6 3 77 18.5 —10.6 18.5 14.76 593607 42.906200 6 3 77 19.8 —12.7 38.1. —23.3 14.79 592643 42.942303 6 3 77 20.7 —16.6 59.0 —39.9 14.84 591905 42.9981+30 6 3 77 17.5 —14.2 76.5 —54.1 14.80 590880 42.958
6 3 77 12.3 —13.4 88.9 —67.6 14.83 590901 42.979
LAST 5 LINES OF DATA900 14 5 77 22.5 —17.0 17177.6 -5359.5 15.24 595406 43.415
5 77 17.3 17194.9 —5378.0 15.22 596492 43.3931130 14 5 77 16.6 17211.5 —5393.3 15.16 596540 43.3341230 14 5 77 13.9 —13.3 17225.4 15.14 594393 '+3.299
1300 11+ 5 77 8.4 17233.8 —5420.2 15.12 592750 43.278
S (CM/S) 1669 16.6
5.
5.7
6.2
1.5
—.2

0.22
0.20
0.18
0.16
0.14
:0.05
0.06
0.04
0.02
0.00
I
0.14
0.12
0.10
0.05
.0.06
0.04
0.02
0.00
181
59 1 TEES Al IIILA. 5 77 - 14 77. TAPE 752/25.
—3 —2.5 —2 —1.5 —0.5 0 0.5
FREQUENCY • CYCLES PER DAT
AN
0 5.8 10.4 14.9 19.4 23.5 25.2 32.5 36.8 41.1 45.3 49.5
SPEED. Cu/SEC
0 20 40 60 80 100 120 140 190 160 200 220 240 260 260 300 320 340 360
DIRECTION, DECREES TRUE
1000
100
10
0.11.0 2 2.5 3

30.00
16.00
C,
18.00
14.00 I-I 4 I I I I I I I I I I I I I I I I I I 1111111 I I I I I I I I I I I I I I I I I III I I I II I I I I I I II I I III ItP_I.APR IMAY
59 14 AT NILA LEG 5*69.5 DAYS STARTING 100 GIlT 6 MAR 1977

STATISTICS FOR E—W(U) AND N—S(V) COMPONENTS
N AVG(tJ) AVG(V) VAR(U) VAR(V) 510(U) STO(V) COV(UV)1669 —.) 78.2 1C.1 8.8 —'+3.0
VECTOR MEANt SPO = 9.1. DIR = 116 OEGREES(T)DIRECTIONAL 59.1 7.
AXIS IS 127.6 DEGREESCI)
STATISTICS FOR COORDINATES ROTATED 45 DEGREESCEOULIALENT ALIJNGSHORE = 135 DEGREESCI))
MILA LEG80 M
VARIABLE N MEAN
(CM/S) 15.5
U 1669
510 SKEW KURT MAX tlIN
1.2
6.8 2.4 i7.E —15.8
\I (CM/S) 16b9 —8.7 11.5 .6 2.8 2fJ.2 —41.9
T(DEG C) 1669 13.C .2 —.1 2.9 15.5 14.5
STATIONMILA
183
TAPE MOLEG5
DEPTH INTERVALHOURLY LOW PASS
FIRST 5 LINES OF OATA$100 6 3 77 16.9 —1.2.6 16.9 —12.6 11+.?? 1.
200 6 3 Ti 19.9 —8.5 36.8 —21.2 i'+.76 2
3
3 7721.3 —9.315.6 —11.7
58.273.8
—30.2—'+1.9
14.7714.76
3
4
6 3 77 7.9 —10.6 81.7 —52.5 14.76 5
LAST 5 LINES OF DATA:900 11+ 5 ii 21.0 —1'+.9 —6651.2 15.01 1.665
14 5 77 17.6 —15.3 13679.1 —6667.0 15.02 1666
1130 14 5 77 1.3.2 —15.3 13692.2 —6682.0 15.05 1667
12u3 14 5 77 12.0 —13.9 13704.2 —6696.0 15.03 1668
1303 14 5 77 12.6 —12.'+ t3fl.6.8 15.30 1669
CRLTN—.4843
1.4

O.n
0.20
0.18
0.16
0.14
0.12
0.10
0.08
0.06
•O.04
0.02
0.00
184eo A AT lILA V. 5 lIAR ?? - 14 ART 77. TAPE 490/30
1.I1EAN
I
5.5 9.9 14.2 le.5 22.? 26.9 31.1 35.2 39.2 43.3 47.3
SPEED. CA/SEC
0.12
0.10
0.08
0.06
0.04
0.02
0.000 20 40 60 60 100 120 140 160 180 200 220 240 260 280 300 320 340 360
DIRECTION. DECREES TRUE
LP CIJROENT AT 80 r, MUM V. 69 SAYS SYNC 100 6 MAR fl
1010
100
r(0z
ID
0.1 t -——-——• ——3 —2.5 —2 -1.5 -1 —3.5 0 0.5 I 1.5 2 2.5 3
CYCLES

30.00J
> -30.00
—50.00
IMAY90 H AT NILA LEO 5z I4OURLIES,
69.5 DAYS STARTING 100 CHT 6 MAR 1977
-JU,

STATISTICS FOR E—W(U) AND N—S(V) COMPONENT
N uVG(U) AVG(V) VAR(U) VAR(V) STD(U) STO(V) COV(UV) CRLTN1669 L.4 —3.5 56.7 7.5 —26.0 —.1+227
VECTOR MEAN: SPa 5.6 Ci/S, DIR = 128 DEGREES(T)DIRECTIONAL STEAOINESS 1+8.2 7.
PRINCIPAL AXIS IS 129.6 OEGREES(T)
STATISTICS FOR COrROINATES ROTATED 1+5 DEGREES(EQUIVALENT 135 CFGREEStII)
MILA LEG 5
VARIABLE N MEAN STD SKEW KURT MAX MIN
S (C4/S) 1669 11.6 1.6 8.0 1+2.5 .3
U (CM/S) .7 6.0 .1 2.+ —16.9
V (CM/S) —5.5 9.1+ .7 iq.o —40.8
T(OEG C) 1669 .2 —.2 3.5 15.4 1'..2
1669 .1 .1 3.0 101.0 100.3
186
STATION LEG DEPTH TARE INTERVAL FILTERINGMILA 5 MOURLY LOW PASS
FIRST S LINES OF DATA:6 3 77 9.7 9.7 —14.9 j4.71, 1005008 42.7076 3 77 13.5 —8.3 23.1 —23.2 14.74 1004992
3uu 6 3 77 11.9 —2.8 35.C 26.O 14.75 1005004 42.7201+00 6 3 77 1.2 —5.2 36.2 —32.2 14.75 42.71550') 6 3 77 4.9 —8.3 41.0 -1+0.5 14.74 1005000 42.714
LAST 5 LINES OF DATA9C3 14 5 77 11.2 —12.5 7281.6 —5736.8 14.87 1008006 42.8591000 14 5 77 8.7 —12.2 7290.4 14.87 1008197 1+2.844
11+ 5 77 —11.1 7299.8 —5760.1 14.89 1009472 42.8851200 14 5 77 12.1 —6..) 7311.9 —5766.1 14.88 1008640 42.87613C0 14 5 77 13.2 —3.9 7325.1 —5769.9 14.56 1007628 42.854

I-0
1000
100
187
lOOflAItItLflV. SMPRfl-14M9Y77. 1RPE606/34
0.20
0.18
0.16
0.14
0.12
0.10
0.08
0.06
0.04
0.02
0.00
0.09
0.08
0.0?
0.06
20.05
0.04
0.03
0.02
0.01
0.00
5.1 9.1 13.0 16.8 20.6 24.4 28.2 31.9 35.6 39.3 42.9 46.5SPEED. WI/SEC
0 20 40 60 80 100 120 140 160 180 200 220 240 260 280 300 320 340 360
DIRECTION, DECREES TRUE
IP CURRENT 51 100 P. lILA V. 69 0912 SING 100 6 lIAR 2?
10
0.1—3 —2.3 -l -1.3 —1 —0.3 0 0.3 1 1.3 2 2.3 3
TItLES 051

100 M AT NIL.A Si HOURLIES.
69.5 DAYS STARTING 100 CMT 6 MAR 1977
V 1! V V 1' P"kki AM iW
20.00
-20.00
20.0010.00
—10.00
— —30.00
—50.00
15.50
U14.50
0I.-
13.50
101.00
99.00
-Jco
APR I MAY

VARIABLE N MEAN 3T3 SKEW KURT MAX MIN
c (CM/S) 1669 27.5 .8
U (CM/) 1669 —1.8 5.2 .2 3.1 —16.0
V (CM/S) 1669 -2.9 6.7 .1 3.1 —27.4
T(UEG C) 1669 1+.6 .3 —.1 3.0 15.4 13.7
189
STATION LEG DEPTH TAPE'lILA 5 115 124/13
INTERVALHOURLY
FILTERINGLOW PASS
FIRST 5 LINES OF DATA:100 6 3 77 6.3 —10.8 6.3 —10.8 14.73 1
200 6 3 77 8.8 —7.1 15.0 —17.9 14.75 2
300 6 3 77 9.3 —3.6 24.4 —21.6 14.74 3
403 6 3 77 +.3 —5.6 28.7 —27.2 14.73
503 6 3 77 2.7 —5.5 31.4 —32.7 14.73 5
LAST 5 LINES OF DATA:933 5 77 —1.3 —10.7 1298.8 —5535.8 14.61 1665
1000 14 5 77 —1.6 —9.1 i297.25 77 —0.3 —10.0 1296.9 14.79 1667
1200 14 5 77 1.9 —9.9 .1298.8 —5534.8 14.79 166813u0 5 77 5.6 7.6 14.81 1669
STATISTICS FOR E—W(Ui AN) N—S(V) COMPONENTS
N AVG(U) AVG(V) VAR(U) VAR(V) STO(U) STO4V) COV(UVP CRLTN.8 —3.3 35.4 36.7 6.1 —9.2 —.2537
VECTOR MEANI = 3.4 C'lIS, DIR 167 OEGREES(T)JIRECTIONAL STEAJINESS: 40.9 7.
PRINCIPAL AXIS IS 137.3 OEGREES(T)
STATISTICS FOR COORDINATES ROTATED 45 DEGREES(EQUIVALENT ALONGSHORE 135 OEGREES(T))
MILA LEG .5
115 '1
.8.3 3.8 1.1

I-
a!
U
0.10
0.08
0.06
0.02
o co
0.1
190115 A AT NOLA V. S 77 — 14 my 77. TAPE 1241/8
0.12 .LIIEAN
0.04
3.8 6.4 9.0 11.6 14.2 16.8 19.3 21.9 24.4 26.9 29.4 31.9 34.3
SPEED. Cr1/SEC
I
0.07
0.06
0.05
0.04
0.03
0.02
0.01
0.00
1001
100
10
0 20 40 60 80 100 120 140 160 180 200 220 240 260 280 300 320 340 360
DIRECTION. DEGREES TRUE
LP CURRENT AT 115 0, PILA V. 69 OATS SING 100 6 PAR 7?
—3 —2.3 —2 —1.3 —1 —0.5 0 0.3 I 1.3 2 2.5 3
FREOtIENCY. CYCLES nAY

::::> -30.00
15.50
15.00C)
C.
14.00I-
13.00
I APR115 M AT MILA LEG 5* HOURLIES)69.5 DAYS STARTING 100 GMT 6 MAR 1977
MAY

193
JOINT—lI 1977 Installation
IRONW000 V
Position*: 15°09.9'S, 75°32.9'WDistance Offshore: 19.5 kmBottom Depth: 205 mSet: 1546 GMT 16 March 1977 by R/V MELVILLERetrieved: 1900 GMT 14 May 1977 by R/V ISELINLongest Data Interval: 2200 GMT 16 March to 1200 GMT 14 MayLongest Record Length: 58 days, 15 hours
Instrumentation
Intended Accepted Serial Sampling MeasuredDepth Depth Tape # Interval Variables
0 m 0 m D124/13 20 mm Sw,Ta,T20 m 24 m 746/25 20 mm S,O,T,P,C40 m 44 m 2124/5 20 mm S,O,T60 m 63 m 689/26 20 mm S,o,T,P,C
100 m 105 m 688/35 15 mm S,o,T,P,C150 m 155 m 1968/6 20 mm S,O,T175 m 180 m 2130/6 20 mm S,o,T
Comments
No acceptable direction data exist for the Ironwood meteorologicalbuoy (Dl24) due to failure of the buoy orientation sensor. The datafrom the buoy water temperature sensor did not agree with pre- and
post—calibrations. Temperatures from CTD casts (at 3 m) are drawnon the time plots for comparison.
About 10% of the temperature data in the 1968/6 record were erroneousand were replaced by linear interpolation.
* Navigation: radar fixes and Peru chart DHNM 2200. The position ofthe meteorological buoy was estimated to be l5°09.O'S 75°32.9'W.

IRONW000 LEG 5OM
VALH 3 U
F IL 1' ER I N GLOW PASS
VARIMBLE N MEAN STO Ss(EW KthkT MAX MIN
.5 3.2 21.5 16.8
* Post- and pre-calibrations do not agree and data do not agree withCTD casts. See comments on installation sumary and in Appendix 2.CTD values are plotted with the time series for comparison.
194
LEGU
F1?S1 5 OF DAIAi0 17 3 71 19.02 17.42 1.
100 17 3 77 17.42 2200 It 3
7717 3 77 17.52 5
55
11+ 5 77 15.685 7 15.685 77 19.23 15.69 1408
STATISTICS
TW (OEG)* 16.0
TA (DEG) 1. 8. 7
1.0
.8
.6 2.5 19.1 14.2

19.50
18.50
17.50
16.50
15.50
14.50
13.50
22.00
21.00
aCD
19.00
1-
18.00
17.00
16.00
C)
CDIaja
OCTD TEMPERATURE OBS
0
-j
0 M AT IRONWOOD 5: HOURLIES1
58.7 DAYS STARTING 000 CMI 17 MAR 1977
MAY

50 200 250 200
-50
-100
-250
-200
-250
-200
155 II AT 155201000. 59.1 OATS STOAIING 2624 Id lAIR 55
—00
lAG 240
—IRO
-240
—500
—210
—200
—550
—420
—060
24 II AT 200140000. 19.2 OATS STARTING 2622 Id lIAR 55
44 II AT 10040000. 59.1 DAYS STARTING 1000 Id MA 55
50
-do ISO 240
—1450
65 0 AT IR000000. 59.1 OATS STARTING 1625 10 21120 55 -J
205 II lIT 100241000. 29.1 OATS STARTING 1600 Id lAIR 25
-225
—220
—3*5
$110 II fIT 10024*000. 59.1 OATS STARTING 26*6 *4 lIAR 55
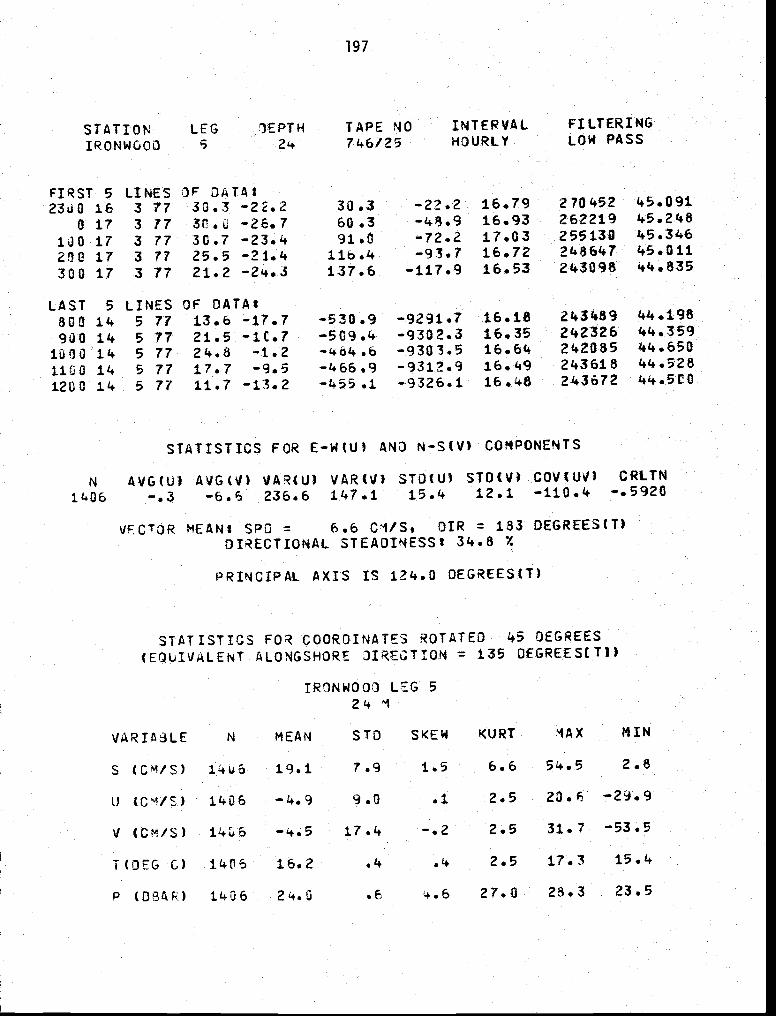
Sb SKEW KURT lAX HIM
6.6 5+.5 2.8
9.0 .1 2.5 20.6 —29.9
-.2 2.5 31.7 —53.5
16.2 2.5 17.3 15.4
P (OB4R) .6 +.6 27.0 28.3 23.5
197
STATION LEG TAPE P40
IRONW000 S 746/25INTERVALHOURLY
FILTERINGLOW PASS
FIRST 5 LINES OF DMTA45.09123u0 16 3 7T 30.3 —22.2 30.3 —22.2 16.79 270452
0 17 3 77 3C.u 2c.7 60.3 48.9 16.93 262219 45.248
100 17 3 77 30.7 —23.4 91.0 —72.2 17.03 255130 45.34645.011200 17 3 77 25.5 —21.4 llb.k —93.7 16.72 24861+7
300 17 3 77 21.2 —2+.3 137.6 —117.9 16.53 243098 44.835
LAST 5 lINES OF DATAZ800 14 5 77 13.6 —17.7 —530.9 —9291.7 16.18 21+5489 44.198
90011+1u00 14
5 775 77
21.5 —IC.724.8 —1.2
—509.4—4*4.6
—9302.3—9303.5
16.3516.64
242326242085
44.35944.65044.52811u0 14
1200 145 775 7
17.7 9.511.7 —13.2
466.9—1+55.1
—9312.9—9326.1
16.4916.48
243618243672 k4.5t0
STATISTICS FOR E—W(U) AND N—S(V) COMPONENTS
N AVG(UJ AVG(%I) VAR(U) VAR(V) STO(U) 510(V) COV(tJV) CRLTN
11+06 —.3 —6.6 236.6 147.1 15.4 12.1 —110.4 —.5920
VECTOR MEANt SPO = 6.6 Cl/S, DIR = 183 OEGREES(T)DIRECTIONAL STEAOINESS 34.8 7.
PRINCIPAL AXIS IS 124.0 OEGREES(T)
STATISTICS FOR COORDINATES ROTATED 45 DEGREESALONGShORE JIRECTIOM 135 O€GREES(Ti)
IRONW000 LEG 5
24 1
V (CM/S) 17.1+
T(OEG C) 1406
7.9 1.5

0.0$
0.0?
0.06
0.05
C0.04
0.03
0.02
0.01
o .oo
198
24 II AT IRONI1000. 16 7? — 14 NAT 77. TAPE
0.16
0.14
0.12
0.10
0.08
0.06
0.04
0.02
0.00
I
0 6.5 11.7 16.8 21.9 26.9 31.9 36,8 41.7 46.5 51.2 55.9 60.6
50E02,
0 20 40 60 80 100 123 140 160 183 210 200 240 260 283 300 323 340 363
DIRECTION, lOCAlES
1000
100
0
10
0.1—3 —2.5 —2 —1.5 —I —0.5 0 0.2 1 1.5 2 2.3 3
FREQUENCY. CYCLES PER OAT

30.00
10.00
'— —10.00
—30.00
40.00
20.00
0.00
—40.00
—60.00
17.50
C,
C,III0I-
16.50
15.50
14.50
29.0028.00
26.00
a. 24.00
22.00 i..'..I APR
24 M AT IRONW000 HOURLIES,
58.6 DAYS STARTING 2300 GMT 16 MAR 1977
A I.. g LII U.k A AIWb
MAY
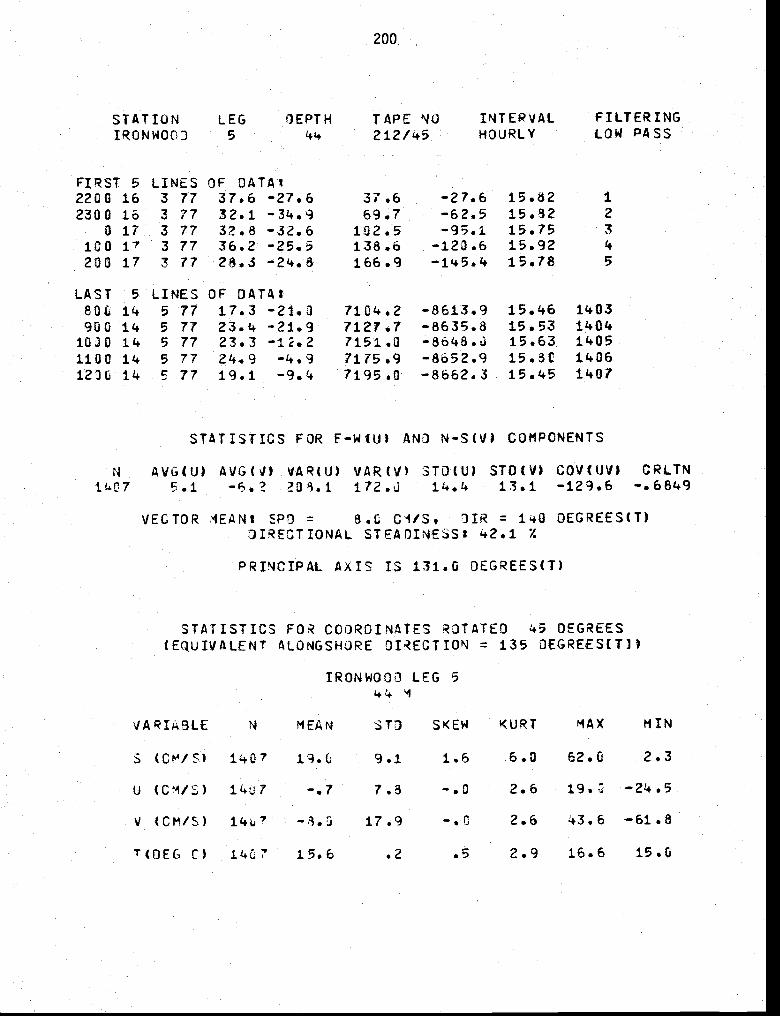
STATIONIRONWOOJ
200
INTERVALHOURLY
FILTER INGLOW PASS
VARIABLE N MEAN STO SKEW KURT MAX FuN
V (CMIS) 14u' 17.9 —Sc
2.6 t9. —24.5
2.6 .3.6 —61.8
T(OEG C) 14C7 15.6 .2 .5 2.9 16.6 15.0
LEG OEPTH5
TAPE NO212/+5
FIRST 5 LINES OF DATAt2200 16 3 77 37.6 —27.6 37.6 —27.6 15.82 1
2300 16 3 77 32.1 —34.9 69.7 —62.5 15.32 2
0 IT 3 77 32.8 —32.6 —95.1 15.75 3
100 17 3 77 36.2 —25.7 138.b —120.6 15.92 4
200 17 3 17 28.3 —24.8 166.9 —1'.5.'+ 15.78 5
LAST 5 LINES OF DATAI14 5 77 17.3 —21.0 7104.2 —8613.9 15.46 1403
900 14 5 77 23.4 -21.9 7127.7 —8635.8 15.53 140410)0 14 5 77 23.3 —12.2 7151.0 —8b48.J 15.63 14051100 14 5 77 24.9 —4.9 1175.9 —8o52.9 15.3t 140612)0 14 5 77 19.1 —9.4 7195.0 —8b62.3 15.45 1407
STATISTICS FOR F—W(U) ANO N—S(V) COMPONENTS
N AVG(U) AVG(V) VAR(U) VAR(V) 3TD(U) STO(V) COV(tJV) CRLTN—..' IL..4 13.1 —129.6 —.6849
VECTOR IEAN2 = 3.0 GuS, = 140 OEGREES(T)OIRECTIONAL 2.1 Z
PRINCIPAL AXIS IS 131.0 OEGREES(T)
STATISTICS COORDINATES ROTATEO 45 OEGREES(EQUIVALENT ALONGSHJRE = 135 DEGREESCI])
IRONW000 LEG S
S 1407 9.1 1.6
U 1'+u7 —.7 7.3 —.0
6.0 62.0 2.3

U
C
a.
20 10 40 120 110 140 1811 222 211) 240 280 325 320 310 360
OF
20141 II AT 16 1518 ?7 — ii lIllY ?7. TAPE 2124/5
IMEAN0.20
0.08
0.16
0.14
0.10
0.0!
0.06
0.04
0.02
0.1)2 • f } *— —. ., I I
?.3 12.2 19.1 25.0 33.8 43.6 18.5 51.3 60.2 66.1 '2.0
CF/SEC
0.02
0.10
0.08
0.06
0.04
0.2
0
1000
100
10
I
0.1
7'UU
—3 —2.3 —2 —1.3 -l —0.5 0 0.5 1 1.3 2 2.3 3
F8LOUE'lCY • CTCLE3 DE! 010

20.0010.00
—10.00 -
—30.00
50.00
30.00
10.00U)
—10.00
> -30.00
—50.00
—70.00
17.00
1g.50
15.50
14.50
:1F VI '1,1 • II
C.)
0U0I.-
N)
I APR44 M AT IRONW000 LEG 5: HOURLIES,
58.6 OATS STARTING 2200 CMI 16 MAR 1977
I MAY

STATIONIRON WOOD
OEOTH TAPE NO63 639/26
INTERVALHOURLY
FILTERINGLOW PASS
STATISTICS FOR E—W (U) APIO N—S(V) COMPONENTS
N
1 6AVG(U) AVG(V) VAR(U) VARIV) STO(U)
.3 -7.5 177.t 192.3 13.3STD(V) CRLTN13.9 —jj9•1 —.6470
VECTOR MEANS SPC = 10.5 DIR = 136 OEGREES(T)UIRECTIONAL STEADINESS: 53.1 Z
PRINCIPAL AXIS IS 136.8 O€GREES(T)
STATISTICS FOR COORDINATES ROTATED 45 DEGREES(EQUIVALENT ALONGSHORE DIRECTION = 135 OEGREES(TJ)
IRONW000 LEG 563 1
VARIA3LE N MEAN STO SKEW KURT MAX MIN
U (CM/S) 14(6 —.2
V (CH/S) 11+06 —10.5 17.4
T(JEG C) 15.2
.1 2.2 20.1 —19.1
—.2 2.7 26.2 —62.4
.2 .3 4.1 16.0 14.7
° (OBAR) 63.3 .5 5.0 3U.8 67.0 62.9
203
FIRST 5 LINES OF DATA:16 3 77 39.4 —314.9 39.4 —34.9 15.38 655053 44.832
0 17 3 77 35.5 74.8 —70.2 15.39 653b71 44.832100 17 3 77 31.2 —34.3 106.0 —104.5 15.39 647450 44.827200 17 3 77 30.7 —29.9 136.7 —134.4 15.20 641765 44.653300 17 3 77 27.9 —28.6 164.6 —163.0 15.24 638345 44.693
t.AST 5 LINES OF DATA:800 11+ 5 77 21.8 —26.4 10146.0 —10489.8 14.95 635905 44.344900 14 5 77 24.5 —22.0 10170.6 —10511.8 14.87 637226 44.251
lUuQ 14 5 77 22.8 2C.1 13193.4 —10531.9 638010 44.3711100 14 5 77 24.6 —14.6 10217.9 15.00 637906 44.3871200 114 5 77 27.3 —6.7 10245.2 —10553.1 14.81 635614 44.190
S (CM/S) 79,5
8.1
1.8 6.9 62.6 1.5
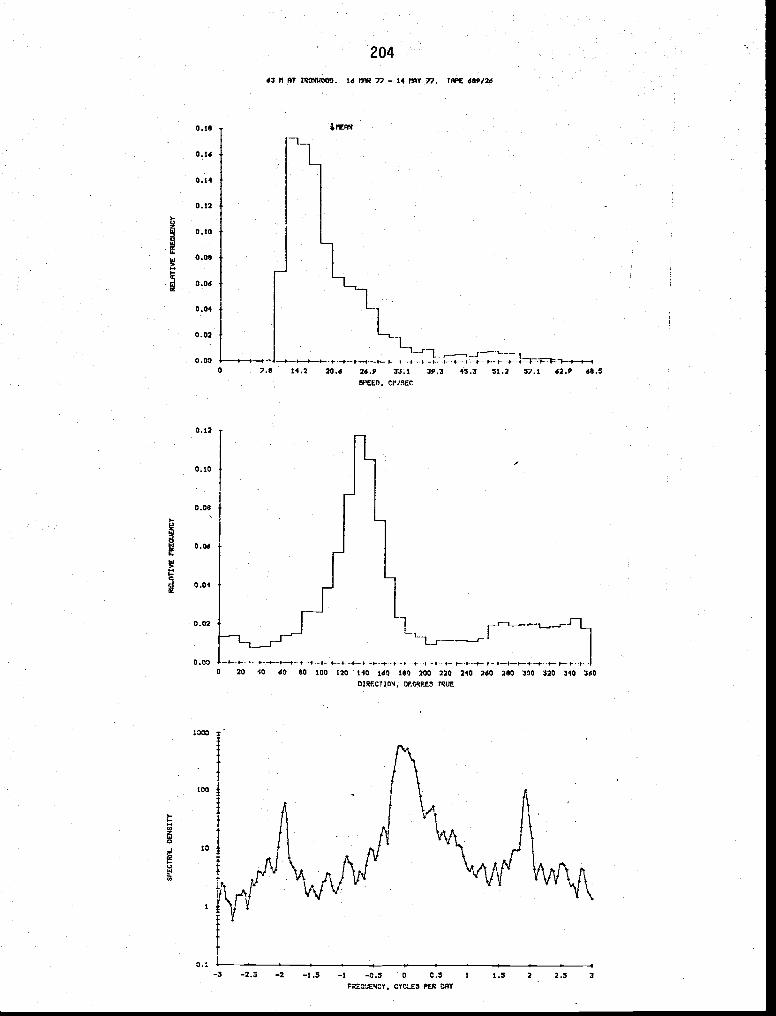
0.1
204
63 11 flT IRONU000. 16 MAR — 14 hAY 7?. TAPE dSP/3d
-I---+-i-t • -i -, •-e—...-----.—.-.—.---,-—-.—t40 60 50 100 120 140 160 190 200 220 240 260 250 300 320 340 360
TRUE
1.1IERN0.le
0.16
0.14
0.12
0.10
0.0$
0.06
0.04
0.02
0.007.5 14.2 20.6 26.9 35.1 39.3 45.3 51.2 57.1 62.9 69.5
Cr/SEC
0.12
0.10
0.0$
0.06
0.04
0.02
0.000 20
,-
I
100
10
—3 —2.5 —2 —1.5 —1 —0.5 0 0.5 1 1.5 2 2.5• CYCLES PER OAT
3

30.0020.00 -
x1.) 0.00
—20.00
30.00
10.00
—10.00
-30.00
-50.00
—70.00
14.00
63 N AT IRONU000 LEO HOURLIES,
58.6 OATS STARTING 2300 GilT 16 MAR 1977
-.
I MAY
:irv
16.00
15.00
0(p
I-
67.00
65.00
63.00
61.00
U,
I APR

sTATIsTIcs FOR AN) N—S(V) COMFONENTS
N AVG(U) 'IAR(U)6.7 —7.L 11.5.5 140.6
STOW) STOIV) COV(UV) CRLTN12.1 11.9 —99.2 —.6936
VECTOR MEAN! = 10.0 CM/S, DIR = 138 OEGREES(T)DIRECTIONAL STEADINESS! 58.2 Z
PRINCIPAL AXIS IS DEGREES(T)
STATISTICS FOR ROTATED 15 DEGREES(EQUIVALENT ALONGSHORE OIRECTION 135 JEGREESCIJ)
IRONW000 LEG 51OSM
VARIABLE N MEAN STO SKEW KURT MAX PuN
S (CM/S) 14r6 17.1
—. 5
V (CM/S) 1L+t6 —10.0 15.6
T(DEG C)
7.6 58.9 1.2
.1 2.2 19.0 —15.9
—.4 3.3 21.2 —58.9
.2 .0 2.8 15.2 14.2
P .7 29.1 109.0 104.9
206
STATION LEG DEPTH TAPEIRONWOO!) 5 105 688f35
INTERVAL FILTERINGHOURLY LOW PASS
FIRST 5 LINES OF DATA!2300 16 3 77 35.7 —35.6 35.7 —35.6 14.56 1072159 45.288
0 17 3 77 33.1 —3e.8 68.8 —74•1 14.1.3 1072023 1.5.200100 17 3 77 3'+.9 —3C.7 —105.1 14.54 1312021 45.329200 3 77 32.5 —27.3 136.2 —132.4 14.55 45.346300 17 3 77 27.8 —32.1 164.1 —164.5 14.47 1064954 45.270
LAST 5 LINES OF DATA:800 14 5 77 26.3 —17.5 9.3u5.0 —10352.7 14.42 1056400 45.239900 14 5 77 22.3 —22.0 9327.4 —10374.6 14.36 1057467 45.162
1000 14 5 77 20.0 —18.3 9347.3 —10393.0 14.1.2 1057123 1.5.2231100 5 77 —15.8 9366.8 —10408.8 14.43 1057095 45.231120k, 14 5 77 —15.9 9384.4 —10424.7 14.36 1058072 45.156
U (CM/S) 1q06
9.6
6.6
2.0

SP
EC
NI1
L. O
EN
SIT
TR
EL
AT
IVE
RE
LA
TIV
EF
RE
GU
EN
CY
Ca 0 a 0 a 0 a 0 Ca 0
(II,
4 C,
Cl
C.,
C)
Ca a 0 Ca en 0 U 0 t3 C, U C 0
0
0
PP
PP
00
00
20
oo
00
00
00
00
00
00
00
b0
..C
a14
014
a0.
•0
14a
o.0
0a
a a (I 0 0 Ii' in Ca
Ca a 1.1
U U a
0U
In.
Pu
—C
,
I
U 0.
0 U 0 a .4
CI
Cl a en 0 U U 0. Cl 0 0. a CI

ii 1111111 IIIHIIIII 11)111111,,IAPR IMAY
105 14 AT IRONW000 LEG 5: HOURLIESS
59.9 OATS STARTING 2300 C14T 19 MAR 1977
20.00
0.00
—20.00
30.0020.00
0.00
-20.00
> —40.00
—60.00
00waI-
waa-
15.50
14.50
13.50 -
109.00
107.00
105.00
103.00
N)
-a-

STATISTICS FOR E-W(U) AND N—S(V) COMPONENTS
STATISTICS FOR COORDINATES ROTATED 45 DEGREES(EQUIVALENT ALONGSHORE
1
N MEAN STO SKEW KURT MAX MIN
S 1q06 13.6 7.2 5.9 (+8.1+ .1
U (CM/S) 1406 .3 2.8 14.8 —13.2
(CM/S) —'7.è 12.8 —.1 2.6 21.3 —48.2
T(DFc, 0) 11+06 13.9 .3 .0 3.3 14.9 12.9
209
STATION LEG DEPTH TAPE NOIRONW000 5 155 196/36
FIRST 5 LINES OF DATA:2300 16 3 77 22.i. —31.6 22.1 —31.6
0 17 3 77 23.3 —28.2 45.4 —59.8luO 17 3 77 22.2 —27.6 67.5 —87..200 17 3 77 22.0 —25.0 89.5 —112.4300 17 3 77 22.4 —19.9 111.9 —132.3
LAST 5 LINES OF DATA:830 14 5 77 13.5 —19.1 5552.7 —8277.0900 1'. 5 77 15.5 —17.2
5 77 i5.o —18.0 5583.2 —8312.21100 14 5 77 16.6 —17.1+
5 77 17.7 —12.9 5617.5 —831+2.5
INTERVALHOURLY
13.8213.8C13.7913.7913.76
13.8813.8013.7613.8013.76
FILTERINGLOW PASS
1
2
3
45
140214031401+
11+05
1406
CRLTN—.7 803
N AVG(U) AVG(V) VAR(U) VAR(V) STO(U) 510(V) COV(UV).3 —5.9 71.5 114.3 8.5 10.7 —70.5
VECTOR MEAN: SPC = 7.2 CM/S, DIR = 1'+6 OEGREES(T)OIRECIIONAL STEADINESS: 52.6 %
PRINCIPAL AXIS IS 143.5 )EGREES(T)
1.5

0.16
0.12
0.10
0.08
0.06-J
x0.04
0.02
0.00
210
155 N AT IRONU000. 16 lIAR — 14 fIAT 7?. TAPE 1968/6
0.15
0:16
0.14
0.12
0.10
U.0.08
Cd 0.06
0.04
0.02
0.000 6.1 10.? 15.3 19.9 24.5 29.1 33.8 38.4 43.0 47.6 52.2
SPEED.
0 20 40 60 80 100 120 140 180 200 220 240 260 230 300 321 340 360
OC(?001S TRUE
LP CURRENT AT 155 N. 53 OPTS 3TNG 2300 16 77
1000
100
10
1'
V
z
-IC
Ua.9,
—3 —2.5 —2 —1.S —1 —0.3 0 0.5 1 1.5 2 2.5 3
CYCLES OPT

14.00
C,
13.00
12.00
20.00
0.00
-20.00
LA. JL.. . . . . . . Lii. i. . . it.v9,. 'V
U,
30.00
10.00
—10.00
—30.00
—50.00
15.00
N)—I
I APR I MAY
155 N AT IRONW000 L.EC 5: HOURLIES,5R.6 OATS STARTING 2300 CMI 16 MAR 1977

STATISTICS FOR E-W(U) AND t4—S(V) COMPONENTS
N AVG(U) VAR(U) VAR(V) STO(U) STO(V) COV(UV) CRLTN3..9 —5.5 83.6 9.2. —43.8 —.6810
VECTOR MEAN: SPO = 6.7 C'l/S, DIR = 145 OEGREES(T)DIRECTIONAL STEADINESS: 57.6 7.
PRINCIPAL AXIS IS 145.6 OEGREES(T)
STATISTICS FOR COORDINATES ROTATED 45 DEGREES(FQUIVALENT ALONGSHORE DIRECTION = 135 DEGREESET])
IRONW000 LEG 5180 M
.2 3.6 14.2 —15.6
T(OEG C) 1+u6 .5 —.0 2.6 12.0
212
STATION LEG DEPTH TAPE NO INTERVAL FILTERINGIRON WOOD 5 180 213F06 HOURLY LOW PASS
FIRST 5 LINES OF DATA:2366 16 3 77. 17.1 —29.6 17.1 —29.0 13.TG I
0 17 3 77 18.9 —25.5 36.0 —54.6 13.73 2130 17 3 77 19.7 —26.3 55.7 —80.9 13.74 3200 17 3 77 20.4 —23.9 76.1 —104.7 13.71 4330 17 3 77 16.3 —19.2 —124.6 13.69 5
LAST 5 LINES OF DATA:800 5 77 14.4 —11.0 5410.7 —7672.2 13.60 1402900 14 5 77 10.4 —11.6 5421.1 —7683.8 13.43 14031600 14 5 77 8.7 —9.0 5429.8 —7692.7 13.34 14041106 14 5 77 10.8 —12.5 5440.6 —7735.2 13.52 14051200 14 5 77 —10.7 5455.3 —7715.9 13.52 1406
VARIA3LE N MEAN
S (CM/S) 1406 11.7
U —1.1
V (CM/S) —6.6
STO SKEW KURT MAX
1.3 4.9 38.8 .86.5
16.5 —.1 2.6 16.4 —37.4

0.14
0.12
0.10
0.08
0.06
0.04
0.02
0.00
213
180 ii AT IRO'6U000. 16 lIAR 77 - 14 PRY 77. TAPE 2130/6
lJ cURRENT AT 130 P. 100NIIOOD. 38 0RT3 CTN 2300 16 MAR 77
.1 MEAN
5.2 9.0 12.8 16.6 20.7 24.1 27.9 71.7 35.5 39.2 42.0
SPEES, Ill/SEE
0.14
0.12
0.10
0.08
0.06
0.04
0.02
0.00
I
0 20 40 60 50 100 123 143 160 183 200 22C 240 260 280 300 7)1 340 360
DIRECTII). 001R515 TRUE
100
us
0 0.3 1 1.5 2 2.3 3
CYCLES PER DAT

20.00
—20.00
-I
--
r nvv'y'v- d hd1 I IAJia I L Ii.
r u •" .111.,TIvrrr
20.00
0.00
—20.00
—40.00
15.00
14.50
13.50wa
12.50
11.50
N)-j
I-r
IAPR IMAY180 P4 AT IRONWOOD LEG 5z HOURLIES,80.8 OAVS STARTING 2300 0141 18 MAR 1977

215
JOINT—lI 1977 Installation
LAGARTA V
POSition*:Distance Offshore:Bottom Depth:Set:Retrieved:Longest Data Interval:Longest Record Length:
Instrumentation
15°1O.O'S, 75°36.O'W24.0 km620 m1753 GMT 151804 GMT 140100 GMT 1659 days, 10
Coments:
The meteorological buoy at Lagarta (D128) was set 9 days earlierthan the current meters, on 6 March 1977. Speed and water temperaturewere satisfactorily recorded for 69 days, but no acceptable data wererecorded for direction and air temperature. The data from the buoywater temperature sensor did not agree with pre— and post-calibrations.The data from D128/7 have been kept for possible future use but are notconsidered reliable in their present form and are not described in this report.
Current meter 1242 was placed at an accepted depth of 313 m (intendeddepth = 300 m) but no intelligible data could be read from the tape.
and Peru chart DHNM 2200.buoy was estimated to be
The position of the15°1O.8'S 75°35.2'W.
March 1977 by R/V MELVILLEMay 1977 by R/V ISELINMarch to 1000 GMT 14 Mayhours
Intended Accepted Serial Sampling MeasuredDepth Depth Tape # Interval Variables
O m75 m
0 m92 m
D128/7756/21
20 mm20 mm
Sw,TS,O,T,P,C
100 m 115 m 755/23 20 ruin S,O,T,P,C200 in 214 m 500/41 15 ruin S,O,T,P500 m 512 m 1238/9 15 mm S,e,T,P
* Navigation: radar fixesLagarta V meteorological

214 IlflERg AT 15 ftAq 7? - 14 hAY 7?. TAPE 500/41. 5(2 IIETERS hIT LACflRTR. (5 — (4 hAY 7?. TAPE
-100
hOG
-(00 200 400
-300
-400
-500
P2 tW.TCRS AT LA041RTA. 15 lIAR 7? - 14 ART 77. TAPE 754/21.
-50
ItS METERS AT LACARTA. 15 lIAR 77 - 14 IVIT 77. TAPE 753122.
-i0•.

N1426
STATISTICS FOR E—W(U) AND COMPONENTS
AVG(U) VAR(V) 510(U) STD(V) COV(UV) CRLTN8.5 —9.7 155.7 108.4 12.5 —93.9 —.7617
MEANS SPO 12.9 CM/3, DIR = 139 OEGREES(T)DIRECTIONAL STEADINESS: 74.7 Z
PRINCIPAL AXIS IS 128.3
DEGREES(EQUIVALENT ALONGSHORE DIRECTION = 135 DEGREEStI))
LAGARTA LEG 592 M
N MEAN STO SKEW KURT MAX MIN
S (CM/S) IL#26 17.3 11.5 1.' 4.5 .9
.1 2.7 16.8 —17.6
'(OEG 14..8 .2 —.5 2.9 15.3 14.0
P (OFAR) 92.0 3.2 4.0 1.5 114.4 90.4
217
STATION LEG DEPTH TAPE NO INTERVAL FIITERING5 92 756/21 HOURLY LOW PASS
FIRST 5 LINES OF DATA:100 16 3 77 26.1 —24.5 26.1 —24.5 14.60 943988 37.515200 16 3 77 25.5 —25.2. 51.5 —49.6 14.63 937931 37.542300 16 3 77 26.8 —24.6 78.3 —74.2 14.61 934189 37.5214Ju 16 3 77 28.3 —22.0 106.7 —96.3 14.54 933298 37.45552u 16 3 77 26.9 —23.5 133.6 —119.8 14.54 932373 37.452
LAST 5 LINES OF OATA600 11+ 5 77 18.4 -12.0 11987.9 —13851.A4 14.43 929008 37.364700 14 5 77 19.5 —9.1 12007.4 —13860.5 14.38 935054 37.311800 11. 5 77 24.6 —7.3 12u.32.0 —13867.8 14.57 943349 37.48990u 11+ 5 77 22.0 -9.u —13876.8 14.49 947717 37.4111000 14 5 77 20.5 —9.1 12074.5 —13885.9 14.L.4 91+7673 37.379
U (CM/S) 1426 —.9 5.8
V (CM/S) 1426 —12.9 15.2 —.5 3.0 17.0 —58.3

0.13
0.0•9
0.18
0.07
0.06
0 .C4
0.03
0.02
0.01
0.10
21892 METERS RT LRGRRTR. 15 MAR 77 — 14 MAY 77. TAPE 754/21.
2:
7.1 13.0 18.7 24.4 33.o 3S.6 41.1 46.5 '31.3 57.1 62.3SPEED, CM/SEC
0.18
0.26
0.14
0.12
2:0.10
0.08
Cd 0.06C
0.04
0.02
3.003 20 40 60 83 103 120 143 160 180 230 223 240 241 280 300 323 340 260
DIROCTION, CECRZE5 TRUE
0000
100
10
2:
C.a'
L9
—2.5 —2 —1.5 —1 —0.5 0 0.5 1 1.5 2 2.5 3
FREQUENCY. CYCO.E3 PER OAT

13.50
13.5.00
115.00
111.00
103.00
107.00
105.00
103.00
0101.00
93.00
87.00
35.00
33.00
91.00
88.00
219
20.00
20.00
— 0.00(a
-20.00
> -40.00
-60.00
3.5.50 1•
014.50
0
92 14 LAGAR?A LEG 5 HOURLIES,53.4 DAYS STARTING 3.00 SMY 16 MAR 1377
MAY

STATION TAPE NO755/23
INTERVALHOURLY
FILTERINGLOW PASS
LINES OF DATA:5 77 19.25 77 20.65 77 23.85 77 25.75 77 24.7
.32.6
61.989.1
116.0141 • 8
FOR F—W(U) AN) N—Sty) COMPONENTS
N M/G(U) AVG(V) VARfV) ST0(U) STO(V) COV(UV) CRLTN7.4 —8.7 153.1 112.5 12.1+ 1.0.6 —lOli.3 —.7950
VECTOR MEAN: SPQ = 11.4 CM/S, DIR = 139 OEGREES(T)DIRECTIONAL STEADINESS: 71.2 Z
PRINCIPAL AXIS IS 129.5 DEGR€ES(T)
STATISTICS GOOROIWATE.3 ROTATL 0 '+5 DEGREES(EDUIVALENT ALONGSHORE DIRECTION = 135 CEGREESCTI)
LAGARTA LEG 5115
VA4kIA9LE N IIEAN
S (CM/S)
STO SKEW KURT MAX MIN
.2
U (CM/S) 1'+26 .3 3.2 16.2 —15.8
(CM/S) 1426 —11.'+ —.6 3.3 23.7 —61.7
T(DEG C) 1426 .3 —.2 2.7 15.2 13.7
P 116.t. 2.9 18.8 136.2 114.1
220
LEG DEPTH5 115
FIRST 5 LINES OF DATA:16 3 77 32.6 —2'+.316 3 77 29.3 -19.8
300 16 3 77 27.1 —17.5400 16 3 77 26.9 —17.95faU 16 3 77 25.8 —17.0
—24.31
-61.6—79.5—96.5
LAST600700800
10'i0
5
14iLl
lIeit4
—15.1—15.9—1 0. .0
—7.2—4.6
14.0614.0014.0314.1113.97
14.0014.0014.1814.1414.12
11816471175709117370711733171172320
116936011 748741180601118'. 614
1185188
10487.1 —12333.6IODOT.7 —12348.610531.5 —12358.510557.3 —12365.8
—12370..,
41.51641.44341.47041.56541.406
41.13441.13941.33441. 2 85
41.261
16.0 11.8 4.9 61.8
—.9 5.3

221115 AT 15 77 - 14 tlAl 77. 755/23.
H0 20 40 60 80 100 120 140 180 233 220 240 260 280 300 820 340 360
DZRZITICN, OiIREES TRUE
0.12
1
0.L0
0.08
0.06
0.04
0.02
0.00a 18.7
5PE02, Ch/SEl41.1 46.5 81.8 07.1 62.3 47.4
0.16
0.14
,_ 0.101.,
C8.15
0.16-.3
0.04
1.82
0.00
1000
• 130
z
-.3C
C,
0.1—3 —2.5 —2 —1.5 —1 —0.0 0 1.5 1 1.8 2 2.5 3
IYCLE3 PER OAT

13.00
137.00
135.00
133.00
131.00
123.00
127.00
125.00
123.00
121.00
113.00
117.00
115.00
113.00
222
•lI•% i i if rr A11A1Pkl i.U)
Ut.-xa
aC,
I-
tiii i • 1111 it,iiii Iii)
20.00 T
0.00wv
•
10.00
—10.00
-30.00
-50.00
-70.00
15.50
15.00
14.00
IAPR IMAY115 N AT LEG 5: HOURLXES1
53.4 DAYS STARTING 100 GMT 16 MAR 1577

N1426
AVG(U) AVG(V) VAR(U) VAR(V) 310(U) STD(V) COV(UV) CRLTN.3 —.9 79.6 8.9 —73.8
VECTOR MEAN$ SPC 1.0 Ci/S, DIR = 160 DEGREES(T)OIRECTIONAL STEADINESS! 5.5 7.
°RINCIPAL. AXIS IS 130.0 DEGREES(T)
S1ATISTICS FOR COORDINATES ROTATED 45 DEGREES(EQUIVALENT ALOMGSHORE = 135 OEGREESETJ)
LAGARTA LEG 5214 1
VARIA3LE N MEAN STO SKEW KURT MAX MIN
S (CM/S) 1426
U —.4
37.8 .2
.1 2.8 1.2 —14.1
V (CM/S) 1426
T(DEG C)
—.9 12.9
12.6
2.9 34.7 —37.8
3.1 13.5 11.5
P (OBAR) 2.6 20.5 233.5 213.8
223
STATION LEG DEPTH TAPE NO INTER VAL FILTERINGLAGARTA 5 21.4 500/41 HOURLY LOW PASS
FIRST 5 LINES OF103 16 3 77 3.5 —8.7 3.5 —8.7 12.53 2171+31+9 1
200 16 3 77 3.7 —5.0 7.1 —16.8 12.56 2167024 2
3CC 16 3 77 2.6 —8.5 9.7 —25.6 12.54 2161+119 3
4CC 16 3 77 1.5 —9.1 11.2 12.45 2161801 1+
530 16 3 77 1.4 12.6 —44.9 1.2.47 2160011 5
LAST 5 LINES OF DATA!600 14 5 77 19.1 —11.4 392.4 —1232.3 12.92 2154100 1422700 14 5 77 20.2 —15.1 412.6 —124.7.1+ 13.05 2160294 1423800 11+ 5 77 21.1 —17.3 433.7 —1264.4 13.06 21E8196 1424
14 5 77 22.1 —15.2 —1279.6 13.02 2174109 11+25
ICOC 14 5 77 23.3 —15.3 479.1 —1295.0 13.02 2175324 1426
STATISTICS FOR E—W(1J) AND N—S(V) COMPONENTS
11.4 7.5 1.0

224214 IIETEAS AT i.A0ARTA. 15 TAR 7? — 14 rAT 7?. TAPE 500/43.
—z —c.s 3 0.5
FEO'JENCT. CYCLES PER CAY
0.09
0.38
LNEAN
LIzUa
0.0?
0.06
.05
0.04
0.02
0.02
0.01
0.00
0 4.? 8.2 11.6 15.1 18.5 21.9
SPEED. CTISEC
0.19
28.6 31.9 25.2 38.4 41.? 44.9
0.08
3.3?
0.06
0.35
0.04
LI
aC
C0.03
0.02
0.01
0.03
0 20 40 60 80 100 120
1000
340 260 280 200 520 240 360
DIRECTION, DECREES TRUE
4,z
10
0.0
—2 —2.5 —2 —1.5 1.3 2 2.3 2

2.1.00
Z34.00
232.00
Z30.00
228.00
226.00
224.00
" 222.000.
220.00
218.00
216.00
214.00
22.2.00
225
I . - L ..LL4aL ...rAw vwr00
-20.00
40.00
— 20.00U)
0.00
> -20.00
—40.00
2.3.50
2.3.00
0C,
12.00
I ..a. &i.d it
214 N AT LAGARTA LEG 5 HOURUES1
59.4 DAYS STARTING 100 ONT 16 MAR 1977
I MAY

STATISTICS FOR E-W(U) AND t4—S(V) COMPONENTS
N AVG(U) AVG(4) !AR(U) \IARIV) STO(U) STO(V) COV(UV)
11.26 1.5 39.7 6.! 3.1 —12.3
VECTOR MEAN: SPO 1.5 CM/S, DIR = 106 DEGREES(T)
DIRECTIONAL STE.AOINESS$ 27.1 7.
PRINCIPAL AXIS IS 109.7 OEGREES(T)
STATISTICS COORDINATES ROTATED DEGREES
(EQUIVALENT ALONGSHORE JIRECTION = 135 CEGREES(fl)
LAGARTA LEG 5512 H
N tIEAN STO
S (CM/S) 11.26 5.6
U (CM/S) 11426 •7 3,5
V (CM/S) 11.26 —1.3
T(OEG C) 7.3
SKEW KURT MAX MIN
1.1 3.6 22.0
.3 3.2 12.8 —12.2
—.3 3.7 18.'+
3.2 8.4 6.5
STATION LEG DEPTHLAGARTA 5 512
226
TAPE NO123/89
INTERVALHOURLY
FILTERINGLOW PASS
FIRST 5 LINES OF DATAT0.8 6.9k 1
100 3 77 —5.1 0.8 —5.1.1.7 6.94 2
200 16 3 77 -2.4 0.9 —7.'+2.7 6.79 3
3 77 —0.3 1.3 —7.72.9 6.65 4
16 3 77 —0.8 0.2 —8.51.5 6.71 5
500 16 3 77 —1.1 —9.5
LAST 5 LINES OF OATAt8.28 1422
600 14 5 77 k.3 -3.6 20*3.58.14 1423
700 j1 5 77 3.3 —1.6 2046.8—605.6 8.23 1424
800 5 77 6.2 —0.5 2653.0—606.7 8.33 1425
9C3 1'. 5 .7 .8.9 —1.1. 2061.8—606.1. 8.17 1426
14 5 77 8.3 0.1+ .2070.1
CRLTN—.6192
VARIABLE
.1
6.1

IsZ
3.05
0.00k ii up uuuiiiii nip0 2.9 4.7 6.4 8.2 9.9 11.6 13.4 15.1 16.8 18.5 20.2 21.9 23.6 25.2
Cr/SEC
ri
0 23 40 60 30 100 120 143 160 180 200 223 240 260 283 300 320 340 36C
CCCREE5 TRUE
227
512 ME1ERS Al LACflRTR. 15 MMR 77 — 14 MAY 77. lAPE 1238/9.
0.30 .I.MEMN
0.25
0.20
0.15
3.09-
0.08 1
0.37
0.26,-
0.050
1.3
1..
1.10.04
0.03
0.02
C.0t
0.00
100
—3 —2.5 —2 —1.5 —1 —0.5 0 0.3 1 1.5 2 2.5 2
FRE1U!NCf • PER

20.00
000 p ii—20.00
20.00
> —30.00
v.00 I LI 1111111 I IIII III U 111111111 I"""I I I I I I It I I (iii I UI I • lilt IIIAPR IMAY
512 M AT LAGARTA LEG 5: HOIJRUESS
59.4 DAYS STARTING 100 CNT 16 MAR 1977

229
JOINT-Il 1977 Installation
LOBI VIA V
Posi tion*:Distance Offshore:Bottom Depth:Set:Retrieved:Longest Data Interval:Longest Record Length:
Instrumentation
15°1l.5'S, 75°34.3'W24.0 km580 m1951 GMT 151847 GMT 110300 GMT 1656 days, 9 hours
Coments:
The data from RCM 749 were of mixed quality, and three extensivesections were eliminated, leaving the following four segments of data:
1.2.3.4.
0300050012001600
GMT
GMT
GMT
GMT
16275
21
MarchMarch
AprilApril
throughthrough
throughthrough
17001200
04001100
GMT
GMT
GMT
GMT
2428
1211
March (8March (1
April (6May (19
days, 15 hours)day, 8 hours)
days, 17 hours)days, 20 hours)
Current meter 1245 was placed at an accepted depth of 383 m (intendeddepth = 350 m) but no intelltgible data could be read from the tape.
* Navigation: radar fixes and Peru chart DHNM 2200.
March 1977 by R/V MELVILLEMay 1977 by R/V ISELINMarch to 1100 GMT 11 May
Intended Accepted Serial Sampling MeasuredDepth Depth Tape # Interval Variables
25 m 58 m 748/28 20 mm S,e,T,P,C50 m 83 m 749/28 20 mm S,O,T,P,C
150 m 183 m 1244/8 15 mm S,e,T250 m 283 m 2284/4 15 mm S,O,T

—50
•3 11 AT LOBIVIR. 2210 26 MAR 7? 83 II AT LOBIVIA. 0510 5 APR 7? 83 11 AT LOBIVIR. 1010 21 APR 7?
— 1850 28 MAR — 1010 12 APR - 1750 11 MAY 7?.
230
50
-50 100 150 200
-100
—150
-200
-250
83 M AT LOBIVIA. 2050 15 lIAR 77 - 2330 24 lIAR 77.
50 50
-50 50
50
-50
-50
50 -50 50
-50

5e AT — 11 flRT ??. 74$12$.
231
iLl AT %.OBZYIA. 15 7? - ii rJW 7?. 124412.
2S3 tETERS At LCEY1A. *5 7? - 21 7?. 22*414.
200 400 120 160 200 240
—75 —60 —45 —20

STATISTICS FOR E-W(U) ANO N—S(V) COMPONENTS
r4 AVG(U) VARCU) VAR(V) 910(U) 510(V) COV(UV) CRLTN1352 6.5 —8.3 151.1 11+7.6 12.3 12.1 —113.5 —.71+01
VECTOR MEAN: 5PC 10.6 C1/S, OIR = 142 OEGREES(1DIRECTIONAL STEADINESS: 6'+.l Z
PRINCIPAL AXIS IS 134.5 DEGREES(T)
STATISTICS COORDINATES ROTATED '+5 DEGREES(EQUIVALENT = 135 OEGRE€S(TI)
LO8IVIA LEG S58 M
N MEAN $10 SKEW KURT MAX PUN
S (CM/S) 1352 16.5 11.8 5.6 6.2 .2
U (CM/S) 1352 —1.3
V (CM/S) —10.5 16.1
T(OEG C) 1352 15.3
.1 2.8 16.9 —20.8
—.7 3.5 22.1 —68.9
.2 .2 3.9 16.0 14.1+
P 58.0 4.13 71.7 88.1 56.0
232
STATION LEG DEPTHLOBIVIA S 71+8/28 HOURLY LOW PASS
FIRST 5 LINES OF OATAI300 16 3 77 —26.6 18.4 —26.6 15.30 616773 43.371400 16 3 77 16.1 —21.3 34.5 —53.9 15.34 609756 43.1+17500 16 3 77 17.3 —27.3 51.9 —80.9 601444 43.1+82600 16 3 77 18.6 —27.9 70.4 —108.8 15.32 604363 43.392700 16 3 77 18.2 —32.4 88.7 —141.2 15.33 614791 43.391
LAST 5 LINES OF OATAs .
630 ii. 5 77 7.0 —18.8 8751.7 —11227.8 15.12 567081 43.166700 Ii 5 77 8.9 -15.8 8760.6 —11243.7 15.06 567014 43.114800 11 5 77 10.1 —13.1 8770.7 —11256.8 15.03 567502 1+3.079930 11 5 77 5.9 —10.8 8776.6 —11266.8 15.33 566666 43.072
1000 11 5 77 2.9 —12.5 8779.5 —11279.4 566389 43.057
6.2
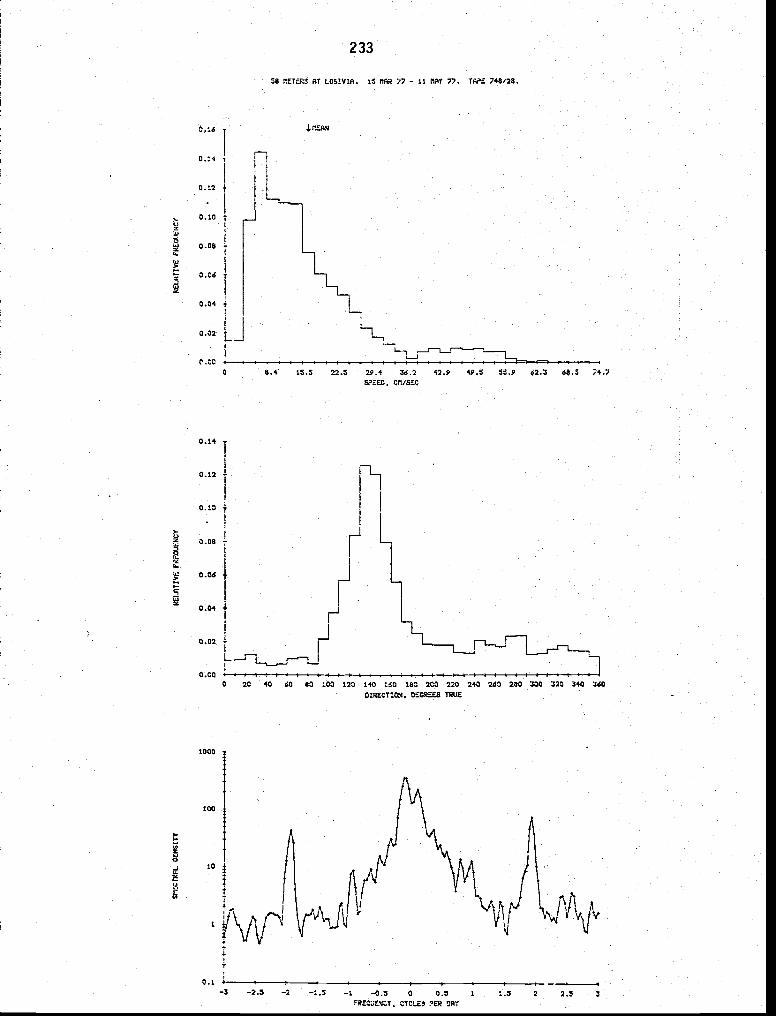
3.16
0.14
0.12
0.10
0.08
0.06
0.04
0.02
0.14
0.12
0.13
0.08
0.36I-
0.04
0.02
0.00
233
58 AT 15 — 11 MAY TA?E p48/28.
II.
hi
-JU
8.4 15.5 22.5 29.4 36.2 42.9 49.5 55.9 62.3 68.5896E0.
0 20 40 60 80 103 120 140 163 185 203 220 210 263 280 300 320 340 360DIREST1ON. 05086E5 TRUE
hiz
J.1
1000
too
10
5.1. - . .
—3 —2.5 —2 —1.5 —1 —0.5 0 0.5 1 1.5 2 2.5 3
STOLES TER OAT

Z0.0010.00
-10.00
30.00
10.00
—10.00
>—50.00
—70.00
16.50
14.50
13.50
83.00
87.00
85.00
83.00
81.00
79.00
77.00
75.00
73.00
71.00
65.00
67.00
65.00
63.00
61.00
53.00
57.00
55.00
234
.!rrI.
C
I APR58 P4 AT LOBIVIA LEG 5 HOORLIES,
56.3 DAYS STARTING 300 GMT 16 MAR 1.377

N MEAN $10 SKEW KURT MAX MIN
S 876 17.G 12.9 1.7 5.4 71.3 .8
U (CM/S) 376 —1.2 6.5 .2 15.0 —19.5
V (Ct'i/S) 876 —3.7 18.3 —.9 3.3 21.8 —70.1
T(OEG C) .2 —.6 3.0 15.4 1.4.3
P 876 83.1 4.5 3.. 1'+.6 112.1 80.8
235
STATION LEG DEPTH TAPE NO INTERVAL FILTERING5 33 HOURLY LOW PASS
FIRST 5 LINES OF OATAt300 16 3 77 24.3 24.3 14.87 847799 43.021430 16 3 17 23.0 —23.5 47.3 —46.4 14.85 845660 42.987500 16 3 77 19.6 —24.5 66.9 —70.9 14.91 43.056600 16 3 77 21.7 —24.8 88.7 —95.7 14.87 846995 43.002700 16 3 77 21.6 —21.9 110.3 —123.6 14.87 850946 43.009
LAST 5 LINES OF DATA:700 11 5 77 4.1. —12.3 —451.8 1063.7 14.78 816513 42.902BoO 11 5 77 5.1 —11.5 —446.6 ii)'+9.1 14.82 817456 42.952900 11 5 77 2.9 —443.7 14.76 817234 42.8761300 11 5 77 —17.7 —439.6 1019.9 14.69 817345 '+2.7991100 11 5 77 0.8 —16.9 —438.7 10t32.u 14.80 817236 42.921
N876
STATISTICS FOR E—W(U) AND N—S(V) COMPONENTS
AVG(U) AVG(V) VAR(U) VAR(V) STO(U) STD(V) COV(UV) CRLTN5.4 —7.0 171.3 2C6.7 13.1 14.4 —147.1 —.7816
VECTOR MEANt SPO = 8.8 CM/S, DIR = 142JIRECTIONAL STEADINESS: 51.9 Z
PRINCIPAL AXIS IS 138.4 OEGREES(T)
STATISTICS COORDINATES ROTATED 45 DEGREES(EQUIVALENT ALONGSHORE DIRECTION = 135 OEGREES(T1$
LOBIVIA LEG 5
83 '1

0.18
0 • 16
0.14
7.12
0.10
0.08
d 0.06
0.04
0.02
0.00
0.14
0.12
0.10
0.08
0.06
0.04
0.02
0.00
236
ES IIETERS AT LOBIVIA. 15 SIAR fl — 11 (lAY fl TRF'E ?49/28.
0 20 40 60 80 100 120 140 160 180 200 220 240 260 280
0 8.4 15.5 22.5 29.4 42.9 49.5 55.9 68.5 ?4.?
SPEEO, CM/SEC

20.00
0.00
—20.00
30.0020.00
0.00
—20.00
—40.00
—60.00
—80.00
15.50
14.50
13.50
113.00
111.00
109.00
107.00
105.00
103.00
101.00
99.00
97.00
95.000.
33.00
si-Do
89.00
87.00
85.00
83.00
81.00
79.00
237
0C,U)
LLAIMAY
83 P4 AT LOBIVIA LEG 53 HOURLIESa
56.4 DAYS STARTING 300 GMT 16 MAR 1977

STATION1081 I A
LEG DEPTH5 193
238
TAPE NO INTERVALHOURLY
FILTERINGLOW PASS
STATISTICS FOR E—W(U) AND N-S(V) COMPONENTS
AVG(u) VAR(I.J) VARtV) 510(U) STO(V) COV(tJV)2.R —3.1 112.8 110.8 1C.6 lt.5 —91.0
MEAN: = 4.2 CM/S, OIR = DEGREESIT)DIRECTIONAL STEADINESS: 32.9 Z
PRINCIPAL AXIS IS 134.7 OEGREES(T)
STATISTICS FOR COORDINATES ROTATED 45 DEGREES(FQUIVALENT ALONGSHORE DIRECTION = 135 OEGREES(TJ)
LOBIVIA LEG S183 M
VARIABLE N MEAN STO SKEW KURT MAX MIN
S (CM/S) 151U (C'4/S) 1353
'I (CM/S) 1353
12.7 8.9
—.2 .6
—4.2 —.5
4.9 1.8.2
.4 3.1 17.1 —12.2
3.2 30.8 —48.0
T(OEG C) 135.3 13.3 —.3 3.4 14.4 12.G
FIRST 5 LINES OF DATA:3
13 77 6.0 —15.4 11.1. —30.3 13.23 2
5G0 lb 3 77 5.1 —16.. 16.2 —46.7 13.22600 16 3 77 4.5 —16.6 20.8 —63.3 13.24YOu 16 3 77 5.4 —19.4 26.2 —82.7 13.29 5
LAST 5 LINES OF DATA:700 11 5 77 13.0 —14.3 3768.4 —4125.1 13.49800 11 5 77 12.9 —14.5 3781.3 —'+139.6 13.5390J 11 5 77 14.8 —14.9 3796.2 —4154.5 13.34
1350
11 5 77 1.6 —14.2 3814.7 —4168.8 13.25 13521100 11 5 77 1'..4 —17.1 3829.1
N CRLTN—. 811+4
1.4 .3

0.12
0.10
0.03
0.06
w
0.04
0.02
0.00
0.12
0.10
0.0$,.'ii
0.06
d 0.04
0.02
0.00
z
to
239183 PETERS AT LOBIVOR. 15 PAR 7? — 12 NAY 7?. TAPE 1244/3.
—2.5 —2 —1.5 —t —0.5 0 0.5 1 1.5 2 2.3 3CYCLES PER DAY
JMEAN
5.5 9.9 14.2 18.5 22.7 26.9 31.1 35.2 39.2 43.3 4?.3 51.2
SPEED. CA/SEC
42 60 80 100 120 140 160 180 200 220 240 260 230 300 020 240 360DIRECTION, CEOREES TRUE
1000
100

.i I...-r w'
J14.h1&1. . MJ_A — - - —
183 H AT LOBIVIA LEG 5: HOURLIES,56.4 OATS STARTING 300 GMT 16- MAR 1977
a- - . 1.
20.00
-20.00
40.0030.00
G 10.00
—10.00
—30.00
-50.00
14.50
13.50
12.50
11.50
IAPR IMAY

241
TAPE NO228/44
INT€RiIALHOURLY
FILTERINGLOW PASS
N AVG(tJ) AVG(%I) VAR(U) VAR(V) STJ(L)1351 —.6 .1. 53.1 32.6
VECTOR SPO = .7 CM/S, DIR = —78 OEGREES(T)DIRECTIONAL STEADINESS? 8.0
PRINCIPAL AXIS IS 125.2
STATISTICS FOR COORDINATES ROTATED *5 DEGREESALONGSHORE = 135 DEGREESCIJI
LOBIVIA LEG 5283
N MEAN STO SKEW KURT MAX PUN
S (CM/SI 1353
U (CM/S) 1353
4.3
3.8
.8 3.5 25.5
—.0
.2
2.9 12.2 —14.1
V (CM/S) 1353 .5 8.5 .1 2.1. 24.3 —22.8
TLOEG C) 1353 11.1+ .4 —.1 2.5 12.5 10.1
STATIONI!
LEG5
DEPTH283
a.?FIRST 5 LINES OF DATA?300 16 3 77 3.7 3.7 0.7 11.44 1.
L+00 16 3 77 4.4 2.5 8.2 3.2 11.29 2
500 16 3 77 —0.7 2.1 7.5 5.3 11.09 3
600 16 3 77 —2.2 0.3 5.3 5.7 11.12 4700 16 3 77 14.6 —2.6 9.8 .0 11.36 5
LAST 5 LINES OF DATA?700 ii 5 77 0.0 —2.8 —864.3 186.1 11.97 1349800 11 5 77 1.7 —1.6 —862.6 184.5 11.98 1350
11 5 77 —3.7 —8b6.3 179.4 12.26 13511000 11 5 77 —4.4 —870.7 174.4 12.33 13521100 11 5 77 —3.6 —5.2 —874.2 169.2 12.2'. 1353
STATISTICS FOR E—W(tJ) AND N—S(V) COMPONENTS
STO(V) COV(UV)5.7 —28.6
CRLTN—.6 872

0.05
o
0.06
0.05
0.04
0.03-J
0.02
0.00
0.00
o .cs
0.06
0.05
0.04
0.03
0.02
0.01
0.00
242
METERS Al LOBIVIA. 15 lIAR 27 — II MAY 77. TAPE 2254/4.
JMEAM
0 3.6 5.9 8.1 10.4 12.6 14.5 12.1 09.3 21.6 23. 26.0 28.3
SPEED, Oil/SEC
0 20 40 60 80 100 120 140 160 180 200 220 240 263 280 300 320 340 360
- DIMECTION, lOCAlES TRUE
1000
103
toz
E
'3'a
10
0.1—3 —2.5 —2 —1.5 —t —0.5 0 0.5 1 1.5 2 2.5 3
• PER A1
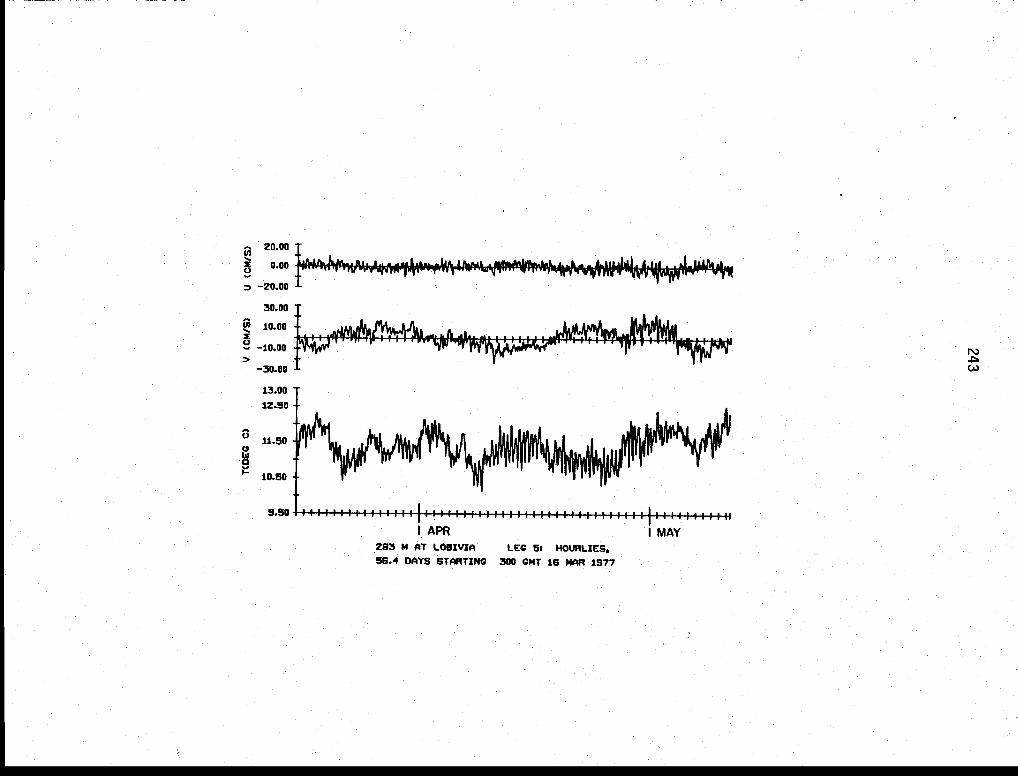
30.00
10.00 -
—10.00
LL. —.
—V."-. - .. .
(A)
283 M AT LOBIVIA LEC 5* HOURL.IES58.4 DAYS STARTINO 300 CMT 16 MAR 1977
20.00
D —20.00
& - L.iiuliLL .
I--'-- r
—30.00 -
13.00
12.50
'yr' 'rpTy
11.5000
10.50
I MAY

245
JOINT—Il 1977 Installation
EUPHORBIA V
Position*: 15°31.2'S, 75°00.8'WDistance Offshore: 7.0 kmBottom Depth: 123 mSet: 1339 GMT 20 March 1977 by R/V MELVILLERetrieved: 2226 GMT 11 May 1977 by R/V ISELINLongest Data Interval: 2000 GMT 20 March to 1500 GMT 11 MayLongest Record Length: 51 days, 20 hours
Instrumentation
Intended Accepted Serial Sampling MeasuredDepth Depth Tape # Interval Variables
0 m 0 m Dl26/9 20 mm S,8,Ta,T20 m 26 m 503/35 15 mm S,o,T,P60 m 63 m 751/21 15 mm S,O,T,P
Comments:
Current meter 1964 was placed at an accepted depth of 103 m (intendeddepth = 100 m) but the magnetic tape did not run.
* Navigation: radar fixes and Peru chart DHNM 2200. The position of theEUPHORBIA meteorological buoy was estimated to be l5°31.5'S 75°00.8'W.
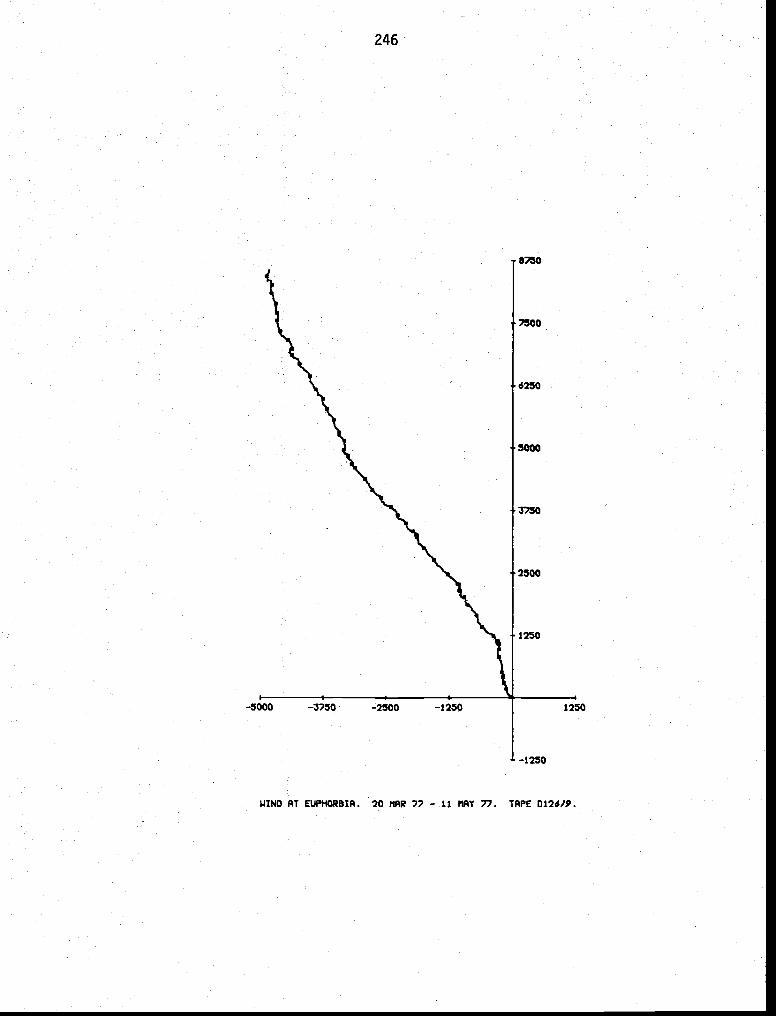
246
2500
7500
6250
5000
1250
-2500
—1250
WIND AT EUPHORBIA. 20 lIAR 72 - 11 hAT 7?. TAPE 012619.

STATISTICS FOR E—W(U) ANO N-S(V) COMPCNENTS
N AVG(ti) AVG(J) \FAR(U) VAR(V) 510(U) STD(V) COV(UV) CRLTN.1.1 2.1 1.8 1.5 1.4 .1859
VECTOF MEANT SPC = 2.2 MIS, DIR = —29 OEGREES(1)DIRECTIONAL STEADINESS: 79.5 7.
PRThCIPAL AXIS IS 123.7 OEGREES(T)
STATISTICS FOR ROTATED 60 DEGREES(EQUT'IALENT ALONGSHORE DISECTION = 120 CEGREEStI))
EUPHORBIA LEG 50 M
VARIABLE N MEAN 570 SKEW KURT MAX uN
S (M/S) 1240 2.7 1.1 .3 2.8 6.2 .1
U (M/S)
(M/S) 1240
TW (CEG) I2L4O 17.1 .8 .6 3.1 19.7 15.4
1240 26.5 1.2 .5 2.9 30.6 2..2
247
STATION LEG DEPTH TARE MO INTERVAL FILTERING5 9 0126/9 HOURLY LOW PASS
FIRST 5 LINES OF DATA:0 21 3 77 —1.2 1.1 —1.2 1.1 27.29 16.96 1
lOU 21 3 77 —0.9 1.9 —2.1 3.0 27.30 17.17 2
200 21 3 77 —1.6 2.3 —3.7 6.3 27.29 16.77 3
300 21 3 77 —1.9 1.5 -5,7 6.7 26.81 16.81 1
400 21. 3 77 —1.7 1.6 —7.3 8.'.. 26.97 17.08 5
LAST 5 LINES OF DATA:1100 11 5 77 1.4 1.8 —1339.4 2354.1 25.59 17.28 12361200 11 5 77 1.9 1.2 —1337.5 2355.3 26.01 17.67 12371300 11 5 77 0.6 0.3 —1336.9 2355.6 26.61 17.83 1238
11 5 77 0.9 —t.7 —1336.0 2354.9 26.81 17.94 12391500 11 5 77 0.7 .0 2357.0 27.03 18.03 1240
1.1 1.3 3.0 1.•3 —2.7
1.9 1.5 —.2 2.8 6.0 —3.2

0.20
0.15
0.16
0.11
0.12
0.10
0.0e
0.06
0.04
0.02
0.00
248AT EIWHORBIA. 20 lIAR 77 - 11 NAT 77.
3 4 3 6 7 5SPEED, fl/SEC
I
'a
I-
C-J
1-
0.12
0.10
0.00
0.06
0.04
0.02
0.00
10
0.1
0.01
0 20 40 60 80 100 120 140 160 ISO 200 220 240 260 250 300 320 340 360DIRECTION. DECREES TRUE
-3 -2.5 -2 -1.5 —I -0.5 0 0.5 1 1.5 2 2.3 3
FREQUENCY • CYCLES PER CRY

249
6.004.00
0.00
—4.00
6.004.00
0.00
—4.00
20-Do
19.50
18.50
17.50
16.50
15.50
U)
U)
C.)
w0C
14.50
31.00
30.50
27.50
26.50
25.50
24.50
23.50
O 14 AT EUPI4ORBIA LEG 551.7 DAYS STARTING 000 OMT 21 MAR 1977
I MAY

250
ti AT EUPHORBIA. 20 MAR 77 — 11 MAY 77. TAPE 50V35.
63 II AT EUPHORBIA. 20 MAR 2? — 11 MAY 7?. TAPE 751/21.
75
50
—50 -25
50
—100 —50 200 250

STATISTICS FOR E—W(U) M—S(V) COMPONENTS
N AVG(U) AVG(V) VAR(V) 510(U) STO(V) COV(LJV) CRLTN
121.4 •5 96.3 14.5 9.3 —90.9 —.6409
VECTOR IEANI = .7 hR = 53 OEGREEStT)DIRECTIONAL STEADINESS' 4.0 Z
PRINCIPAL AXIS IS 119.0 DEGREES(T)
FOR COORDINATES ROTATED 6) DEGREESALONGSHORE = 120 DEGREESETI)
EUPHORBIA LEG S26 1
N MEAN STO SKEW KURT MAX MIN
5.8 43.5 .1
.0 2.7 20.2 —20.3
1.9 43.4 —36.1
..3 —.0 2.6 16.6 14.8
P (O3AR) .2 26.8 25.3
251
STATION LEG OEPTH TAPE 40
EUFHORSIA 5 2o 503/35INTERVALHOURLY PASS
FIRST 5 LINE3 OF DATAS258811 1
2C30 2C 3 77 —18.3 0.3 —18.0 3.3259970 2
2100 20 3 77 —15.7 —3.0 —33.7 —2.7 16.22260769 3
2230 23 3 77 —iL..5 0.1 —48.2 16.0415.95 260469 1+
23u3 20 3 77 —14.1 5.5 —62.4 3.05.2 15.85 261379 5u 21 3 77 —13.1 2.2 —75.5
LAST 5 LINES OF OATAZ1240
1130 11 5 77 10.4 —9.1. 599.5 523.4 16.40257086 121+1
1230 11 5 77 11.7 —10.0 611.1 513.4 16.41257108 1242
13Cc 11. 5 77 11.3 —9.7 622.4 503.6257087 1243
14CC ii 5 77 11.1 —9.5 633.6 495.2 16.27257081 121+1+
1530 ii. 5 77 14.9 —9.1 648.5 486.0 16.18
S tCM/S) 15.4 6.0
U (Cs/S) 1244 .6 6.8
(CM/S) 1244 —.3 16.1
T(tJEG C) 1244 1.5.7

o .o,
o .oe
o .0,
0.05
0.04
0.03
0.02
0.01
0.00
252
26 METERS AT EUPHORBIA. 20 MAR 77 — 01 MAY 77. TAPE 503/35
J. MEAN0.18
0.16
0.14
0.12
0.13
0.08
0
0.04
0.02
0.30
cizCw'S.
'Si
5.5 9.9 14.2 18.5 22.7 26.9 01.1 35.2 39.2 43.3 47.2
SPEEO, CM/SEC
0 20 40 60 80 100 120 140 160 180 200 223 240 260 280 300 320 240 360
DIRECTION, OEOs3EES TRUE
100
'S.z
Ua-
—3 —2.5 —2 —1.5 —1 -0.3 0 0.5 1 1.3 2 2.3 0
FREOVENC't, CYOLES PER DAY

50.0040.00
20.00
0.00
> .-z0.00
—40.00
17.00
16.00
15.00
1MAY
26 AT EUPMORS2A LEG 5:51.8 DATS STARTXNG 2000 GMT 20 MAR
253
C,
C,w0I-
0a.
14.00
27.0026.00
A I & . . .&fluaif i_ . ......iI.AJJULI

STATISTICS FOR E—W(U) AN) N—S(V) COMPONENTS
N AVr,(U) A'IGU) VAR(U) VARtV) STO(tJ) STD(V) COV(UV) CRLTNi2LiL+ '..1 —2.. 2C3.0 8.0 77.1+ —.6821
VECTOR MEAN: SPO = 5.6 CM/S, = DEGREES(T)DIRECTIONAL STEADINESS! 33.9 X
AXIS IS IIL+.0 OEGREES(T)
STATISTICS FOR COORDINATES ROTATED 60 DEGREESALONGSHORE DIRECTION = 120 OEGREES(TI)
FUPHORBIA LEG S63 M
VARIABLE N MEAN STO SKEW KURT MAX MIN
.9 5.3
U (CM/!) .5 5.6 —.n 2.8 15.9 —14.9
V —5.6 15.3 .6 2.1 36.7 —31.3
T(OEG C) is. o .2 Z3.3 1'+.3
P 12L.L+ 63.7 .3 -.5 3.3 62.8
254
STATION LEG JEPTH TAPE INTERVAL FILTERINGEU°HORBIA 5 63 751/21 HOURLY LOW PASS
FIRST 5 LINES OF DATA:2&iOC 20 3 77 —19.9 U.S —19.9 0.5 15.76 63038k 1
2C 3 77 —12.1+ 8.1 —32.3 8.6 15.1+6 630460 2
22CC 3 77 —C.7 16.1 —32.9 15.20 633751 3
23CJ 3 77 12.6 15.25 632537 4
0 21 3 77 9.1 12.5 —5u.5 i',.2'. 637868 5
LAST 5 LINES OF DATA:110i3 11 5 ii 22.1 —13.7 6202.? 14.81 639901 121+0
12U0 11 5 77 25.0 —9.9 6227.8 —2916.4 14,76 639901 12411300 11 5 77 26.9 —11.7 6254.7 —2928.2 14.82 639900 121+2
11 5 77 —11.5 6281.7 2939.6 14.33 639904 121+3
11 5 77 28.1+ 6310.1 —2949.1 14.75 639901 1241+
S 1241+ lo.5 5.3 .3

0.1—3 —2.5 —2 —1.5 —t —0.5 5 0.3 1 1.5 2 2.5 3
FqECJEJ6CY • CYCLES CAY
255
63 ti M 25 tWA 77 - 11 tWY 77. TAPE
4.8 8.1 11.5 14.8 18.2 21.6 28.3 31.6 55 30.1
o. 18
0.14
0.12
0.10
0.08
0.06
0.04
0.02
0.20
0.12
0.10
0.08
az
0.06
0,04
0.02
0.00
1000
100
z
10
C.
0 23 40 60 80 100 120 142 160 180 200 220 240 260 280 322 520 540 560
TRI1P

20.00
0.ooi
—20.00
40.00
20.00
0.00
-20.00
—40.00
16.00
15.50C.)
C,w0I-
a.
14.50
13.50
65.00
61.00
Ui
I APR63 N AT EUPHORRIA LEC 5: HOURLIES,
OATS STARTING 2000 GMT 20 MAR 1977
I MAY
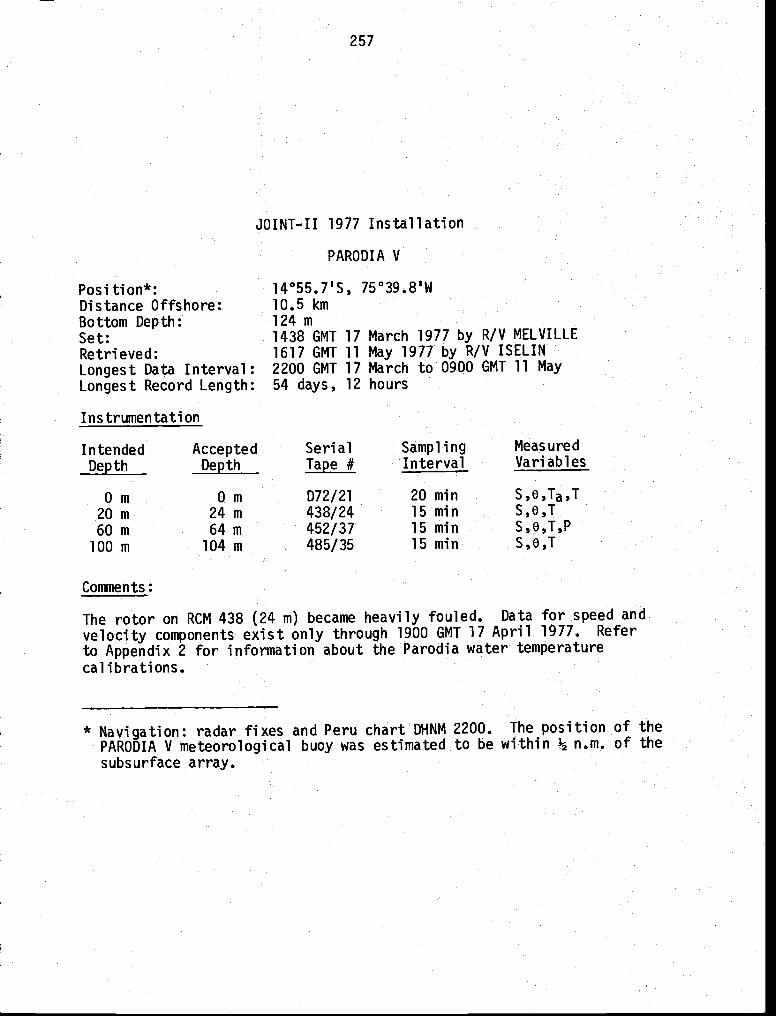
257
JOINT—lI 1977 Installation
PARODIA V
Posi tion*:Distance Offshore:Bottom Depth:Set:Retrieved:Longest Data Interval:Longest Record Length:
Instrumentation
14°55.7'S, 75°39.8'W10.5 km124 m1438 GMT 171617 GMT 112200 GMT 1754 days, 12
Comen ts:
The rotor on RCM 438 (24 m) became heavily fouled. Data for speed andvelocity components exist only through 1900 GMT 17 April 1977. Referto Appendix 2 for information about the Parodia water temperaturecalibrations.
* Navigation: radar fixes and Peru chart DHNM 2200. The position of thePARODIA V meteorological buoy was estimated to be within ½ n.m. of thesubsurface array.
March 1977 by R/V MELVILLEMay 1977 by R/V ISELINMarch to 0900 GMT 11 Mayhours
Intended Accepted Serial Sampling MeasuredDepth Depth Tape # Interval Variables
0 m 0 m D72/2l 20 mm S,O,Ta,T20 m 24 m 438/24 15 mm S,O,T60 m 64 m 452/37 15 mm S,O,T,P
100 m 104 m 485/35 15 mm S,O,T

258
11200
p600
8000
6400
-6400 -4800 -1600 1600
WINO AT PARODIA. 55.0 OAY3 STARTING 17 NAR 2?.
—1600

STATISTICS FOR E—W(U) AND N—S(V) COMPONENTS
N AVG(U) AVG(V)1307 —1.' 3.3
VAR('I) STD(U) STD(V) COV(UV) CRLTN3.8 1.8 2.0 -1.9 —.5251
VECTOR MEANS SF') 2.7 MIS, DIR —30 OEGREES(1)DIRECTIONAL STEADINESS2 35.3 X
PRINCIPAL AXIS IS 139.1 OEGREES(T)
STATISTICS FOR COORDINATES ROTATED DEGREES
(EQUIVAL!NT ALONGSHORE DIRECTION 135 DEGREESITI)
PAROOIA LEG 5OM
N MEAN Sb St(EW KURT MAX MIN
S ('4/5) 1307 3.2 2.1 .8 2.8 10.1. .1
U (M/S) 1307 .7 1.3 .2 '3.0 —4.7
V (M/S) 1307 2.6 2.3 .6 2.7 9.8 -2.6
.W (DEG) 130' 17.0
(DEG) 1307 18.9 1.2
2.8 20.2 15.1+
2.9 22.9 16.3
259
LEG DEPTH TA°E NOLOW PASS5 0 072/21 HOURLY
FIRST 5 LINFS OF DATA?12200 17 3 77 1.1+ 1.1+ 5.1+ 19.98 18.2122300 17 3 7, 0.2 1.5 10.7 19.86
17.89 30 18 3 77 —1.7 7.2 —0.2 17.9 19.7817.75 14
100 18 3 7 —1.8 7.7 —1.9 25.7 19.635200 18 3 —2.7 6.1+ —14.7 32.1 19.1+8
LAST 5 LINES OF DATA?13031.00 11 5 77 —0.3 1.1+ —1793.1 3Q1414,L+ 17.16 16.11+
16.32 1304500 11 5 77 —1.4 2.3 —17914.6 301+6.7 17.11k16.25 1305600 11 5 77 —2.1 2.7 —1796.7 17.2416.33 1306700 11 5 77 —2.0 2.1 —1798.8 3051.5 17.2016.35 1307800 11. 5 77 —1.9 1.8 —1800.7 3053.3 17.05

0.30
0.25
0.20
0.12
0.10
0 .0
0.04
0.02
0
z
10
0.1
0.01
0
260AT PAPOOIA. 17 - 11 lilT 77. TAPE 072/21
-3 —2.5 -2 -1.5 —1 -0.5 0 0.5 I 1.5 2 2.5 3
- FRCOUENCT • CTCLES PER 04T
IMEf8I
2 3 4 5 6 7 S 9 10 11 12 13
REED. A/SEC
0 20 40 60 80 100 120 140 160 180 200 220 240 260 280 300 320 340 360OIRECTIGR, DEGREES TRUE

6.00
2.00
-2.00
—6.00
39.008.00
4.00
0.00
—4.00
20.50
18.50
18.50
17.50
16.50
15.50
14.50
23.0022.50
21.50
20.50
19.50
18.50
17.50
16.50
15.50
261
' rr I
LI)
x
in
0P.
CDw
CP.
I MAYI APR0 P4 AT PARODIA I..EG 5 HOURLIES1
54.5 DA'rs STARTINC 2200 GP4T 17 MAR 1977

24 11 PMODIR. .6 0013 1454 fl
64 II AT PARODIA. 55.0 DAYS 1?
104 II PT PUCOIP. 55.0 w
N)
-25 75 100 125
—70 250

RIABLF N MEAN STO SKEW KURT MAX tlIN
S (Ce/S) 1-.7 .2 3.6 30.9 2.9
U (CM/S) 3 1.3 10.3 .6 2.3 24.7 —26.3
74+3 11.6
* No recent calibration available. See discussion of temperature calibrationsin Appendix 2.
263
STATION LEG OEPTH TAPE INTERVAL FILTERING24 L+38/24 LOW PASS
FIRST 5 LINES OF OATAS2166 17 3 77 18.8 —21.8 18.8 —21.8 16.07 1
2200 17 3 77 20.3 -23.3 39.0 15.79 2
2360 17 3 77 20.7 —22.5 59.7 —67.6 15.90 30 18 3 77 21.1 —19.5 80.8 —87.2 15.91 4
100 18 3 77 19.6 —17.3 —1J4.5 15.96 5
LAST 5 LINES OF DATA400 11 5 77 0.0 0.0 0.0 0.0 15.91 1301.500 11 5 77 0.0 0.0 0.0 u.u 15.81 1305
11 5 77 3.U 0.0 0.0 15.77 13Db700 11 5 77 3.u 0.0 0.0 3.6 15.84 1307860 11 5 77 0.0 0.u 0.0 3.0 15.77 1308
STATISTICS FOR E—W(U) AND N—S(1) COMPONENTS
N AVG(U) AVG(V) VAR(V) STOtU) STO(VI COV(UV) CRLTN743 —2.L. 141.7 99.6 11.9 10.0 —14.6 —.1180
VECTOR MEAN: SPO = .8 DIR = 123 QEGREES(T)DIRECTIONAL STEADINESS: 30.9 Z
PRINCIPAL AXIS IS 106.9 DEGREES(T)
STATISTICS FOR COORDINATES ROTATED 1+3 OEGREESALONGSHORt DIRECTION = 135 DEGREESET))
PARODIA LEG 524 M
(CM/S)
T(DEG C)* 1 5. 9
2.0 22.3 —30.8
.3 .6 3.2 17.0 15.2

'Ii0
26424 N AT 17 NAR 77 - It APR 77. TAPE 435124
3.5 6.4 9.0 11.6 14.2 14.5 19.3 24.4 24.9 29.4 31.9 34.3SPEED, CN/3EC
0.10
0.09
o .os
0.07
0.04
0.05U.
0.04
0.03
0.02
0.01
0.00
0.06
0.05
0.04
0.03U.
0.02
0.01
0.00
1000
100
10
0.1
0 20 40 40 50 100 120 140 140 180 200 220 240 240 200 300 320 340 360
DIRECTION, DECREES TRUE
—3 —2.5 -2 —1.5 —1 -0.5 0 0.5 1 1.5 2 2.5 3
FREQUENCY. CYCLES PER OAT

30.00
10.00
—10.00
— —30.00
30.0020.00
U,0.00
0—20.00
—40.00
17.50
16.50
'I15.50
14.50 -I—I-! ........... iiiit'iilsiIItIiI24 AT PARODIA 5:
54.5 OAYS STARTING 2100 GP4T 17 MAR 1977
I ii ii i I—1—4—
IAPR IMAY

STATISTICS FOR E—W(U) AND N—S(V) COMPONENTS
N AVG(U) AVG(V) VAR(U) STO(U) STD(V) COV(UV) CRLTN
-5.2 100.0 75.1k 8.7 —34.5 —.3953
VECTOR MEANt SPJ 8.7 C1/S, DIR = OEGREES(T)
DIRECTIONAL STEAOIPIESS1 57.1 7.
PRINCIPAL AXIS IS 125.6 OEGRE€S(T)
STATISTICS FOR COORUINATES ROTATED DEGREES
(EQUIVALENT ALONGSHORE DIRECTION = 135 OEGREES(131
PARODIA LEG 5
MAX
.3 1+.6 35.7
7.3 .1 2.5 20.3 —17.6
—8.7 11.1 .8 2.5 —31.9
.2 .1+ 2.6 15.8 i..6
.2 .6 3.5 65.3
* No post-calibration available. Temperature data were processed using
the pre-calibration of 14 September 1973. See discussion in Appendix 2.
STATIONPARODIA
LEG
266
TAPE NO1+52/37
DEPTH INTERVALHOURLY
FILTERINGLOW PASS
FIRST 5 LINES OF DATAI33.9 —11.2 15.33 6501+44 1.
2200 17 3 77 33.9 —11.265.7 —20.5 15.35 651091+ 2
2300 17 3 77 31.8 —9.396.3 —29.9 15.35 65095k 3
Ii 18 3 77 30.6 —9.1+125.2 —1+2.0 15.33 651050 1+
1(0 3 77 28.9 -12.1152.1+ 15.37 61+9719 5
2J0 18 3 77 27.2 —7.5
LAST 5 LINES OF OATA$9151.0 —6734.9 61+61+12 1304
500 ii 5 77 14.3 —12.'+9163.7 15.05 647355 1305
6C0 11 5 77 12.7 —t1+.99180.4 —6763.1+ 15.16 648034 1306
Ii. 5 77 16.7 —13.69197.6 —6777.7 15.04 61+7988 1307
800 Ii 5 77 17.2 —11+.3—6789.5 15.16 51+7989 1308
N MEAN STOVARIABLE
S 1305
U (C1/S) 13C8
V 1308
T(OE( C)* 13L8
P
1.3
MIN
.6
15.2
6!.,. 7

267
64 AT PARODIR. 17 nOR 7? - 11 ORY 7?. 452/37
1000
100
t0
—3 —2.5 —2 -1.5 —I 1 1.5 2 2.5 3
0.14
0.52
0.10
I :::
0.04
0.02
0.00
0.12
0.10
O .18
0.06
oi 0.04
0.02
0.00
0 4.7 8.2 11.6 15.1 18.5 21.9 25.2 28.6 31.9 35.2 38.4
SPEED, CS/SEC
0 20 40 60 80 100 120 140 160 180 200 220 240 260 280 300 320 340 360
DIRECTION. DECREES TRUE
—0.5 0 0.3
FREOUENCT • CYCLES PER OAT

30.Q0 -20.00 -
O.00•
-20.00 -
00I-
16.00
64 M AT PAROOXA LEG 5: HOURLIES,
54.5 DAYS STARTING 2200 CMI 17 MAR 1977
... Wi
________________________
15.00
14.00
66.0065.00-
a63.00
1%.)
03
I APR
i.LA.ALA — —-
I
I MAY

N AVG(U) 44G(V)1388 2.5 —2.7
VAR(V) STJ(U) STO(V) COV(UV) CRLTN55.8 7.2 7.5 7.6 —32.1 —.5673
VECTOR MEAN: SPO = 3.7 Ci/S, DIR = 138 OEGREES(T)DIRECTIONAL STEADINESS! 34.9 7.
PRINCIPAL AXIS IS 135.6 OEGREES(T)
STATISTICS FOR COORDINATES ROTATED '.5 DEGREES(EQUIVALENT ALONGSHOR.E OIRECTION = 135 OEGREES(T1)
LEG 5101+ M
VARIABLE N MEAN STO SKEW KURT MAX MIN
S (CM/Si '+.5 29.9 1.2
—. 2 .2 3.0 18.4 —13.1
.3 2.1+ 21.0 —29.7
T(OEG C)* j3Q9 .3 2.8 15.5 14.2
* No post-calibration available. Temperature data were processed usingthe pre-calibration of 4 February 1976. See discussion in Appendix 2.
269
FILTERINGLOW PASS
STATION LEG OEPIH TAPE NO INTERVALPARODIA 5 '435/35 HOUFLY
FIRST 5 tINES OF DATA!2200 17 3 77 18.8 18.8 —23.2 15.23 1
17 3 77 18.3 —21.7 37.1 —kk.9 15.24 2
3 1R 3 77 15.3 —21.9 52.1+ —66.7 15.25 3
100 18 3 77 12.6 —21.1. 65.0 —88.1 15.252u0 18 3 77 10.4 —20.5 75.'. —108.6 15.27 5
LAST 5 LINES OF DATA!5u3 11 5 77 12.3 —9.1 3170.7 —3488.0 11e.51 130'.
11 5 77 10.9 —9.5 3181.6 —31.97.5 14.50 13057u0 11 5 77 12.3 —13.9 3193.9 —3511.1+ 14.53 1306SOu 11 5 77 13.6 —IC.5 3207.6 —3521.9 14.51 1307
11 5 77 10.5 —12.6 3218.0 —3531..5 14.52 1308
STATISTICS FOR E—W(U) AND N—S(V) COMPONENTS
1.1.
U (CM/S) 1308 '4.9
V (CM/S) 1309 —3.7 9.1+

270
104 A AT Pc1ROOIA. 1? ?7 - 11 18W fl TIV( 485/35
0 3.8 6.4 9.0 11.6 14.2 16.8 19.3 21.9 24.4 26.9 29.4 31.9
TEED, CM/SEC
0.16
0.14
0.12
0.10
0.08I.-
hi
0.06
0.04
0.02
0.00
0.12
0.10
0.08
0.06
0.04
0.02
0.00
1000
100
10
0.1
0 20 40 60 80 100 120 140 160 180 200 220 240 260 280 300 320 340 360
DIRECTION, OECREES TRUE
—3 —2.5 —2 —1.5 —i —0.5 0 0.5 1 1.5 2 2.5 3
FREQUENCT • CTCIIS PER OAT

-20.00
30.00
p:::III
i3.50 I I I I I I I I I I I I I I I I I I I I I I I I I I I I I I I I I I I I I I I I I I I I I I I I I I I I II
IAPR IMAY104 M AT PAROOIA LEG 5: HOURLIES,
54.5 DAYS STARTING 2200 GIlT 17 lIAR 1977

273
JOINT—Il 1977 Installation
YUCCA TOO V
Position*: 12°04.6'W, 77°19.5'WDistance Offshore: 8.2 km (from San Lorenzo Island)Bottom Depth: 117 mSet: 1141 GMT 9 March 1977 by R/V MELVILLERetrieved: 1152 GMT 18 May 1977 by R/V ISELINLongest Data Interval: 1900 GMT 9 March to 0500 GMT 18 MayLongest Record Length: 69 days, 11 hours
Instrumentation
Intended Accepted Serial Sampling MeasuredDepth Depth Tape # Interval Variables
40 m 37 m 921/7 20 mm S,e,T,P60 m 57 m 493/29 15 mm S,o,T
100 m 97 m 1239/8 15 mm S,e,T
Commen ts:
All sensor channels from RCM 493 (57 m) were unintelligible for thelatter part of the installation. Data exists through 1100 GMT 7 April.
* Navigation: radar fixes and U.S. chart H.0. 22173 (Callao and approaches).

—20 30 60
—3
-60
-P0
-*20
—150
—leo
5 fl AT YUCCA TOO.
30 50
Co -50 50 *00
—630
37 fl AT YUCCA 100. 70.0 DAYS 5TAATftiG *202 P lIAR 77
2P.2 DAYS 1204 P lIAR 7
—350
P7 H AT YUCCA 100. 70.0 DAYS STARTING *202 9 MAR 77

275
LEG DEPTHYUCCA 5 37
TAPE r40921/7
INTER4AL FILTERINGHOURLY LOW PASS
STATISTICS FOR E—W(U) AN) N-Sly) COMPONENTS
AVG(U) VAR(V) STO(U) STO(V1 COV(UV) CRLTN1.8 —10.0 77.7 118.1 8.3 10.9 —.0550
VECTOR MEAN: SPO 10.1 DIR = 170 OEGREES(T)DIRECTIONAL STEADINESS) 62.9 7.
AXIS IS 172.7 DEGREES(T)
STATISTICS FOR COORDINATES ROTATED 30 OEGREES(EQUIVALENT ALONGSHOkE = 150 DEGREESETI)
S (CM/S) 1667 16.1
U (CM/S) 1667 —3.5
YUCCA TOO LEG S37
V 1667 —9.5 10.6
TIDEG C) 1o67 16.1
P 16ó7 37.2 .3 .5 3.0 33.3 36.6
FIRST 5 LINES OF DATAt1930 9 3 77 d.9 1.7 8.9 1.7 16.iQ 37001g. I
2000 9 3 77 6.7 6.5 15.6 3.2 16.05 369599 2
9 3 77 5.1 9.1. 2u.7 17.3 15.95 367493 3
9 3 77 9.9 —d.b 30.6 10.7 16.12 36886k 42300 9 3 77 10.9 -0.2 41.5 16.6 16.04 368556 5
LAST 5 LINES OF DATA:lOu 18 5 77 3.3 2923.3 —16o38.7 17.9k 375303 1663200 18 5 77 0.6 1'.9 2923.9 —16625.8 17.58 373526 1664300 5 77 3.3 10.9 2927.2 —1661'4.9 17.25 3?131'+ 1665'÷00 18 5 77 0.9 3.13 2928.1 -16606.9 16.29 370069 1666
5 77 0.5 8.1 2928.6 —16598.8 16.34 369547 1667
N1667
N MEAN 310 SKEW KURT MAX
6.3 .6 3.1 17.9
9.1
MIN
2.3 22.9 —25.1
.6 3.1. 23.7 —35.4
.2 .8 6.2 17.9 15.5
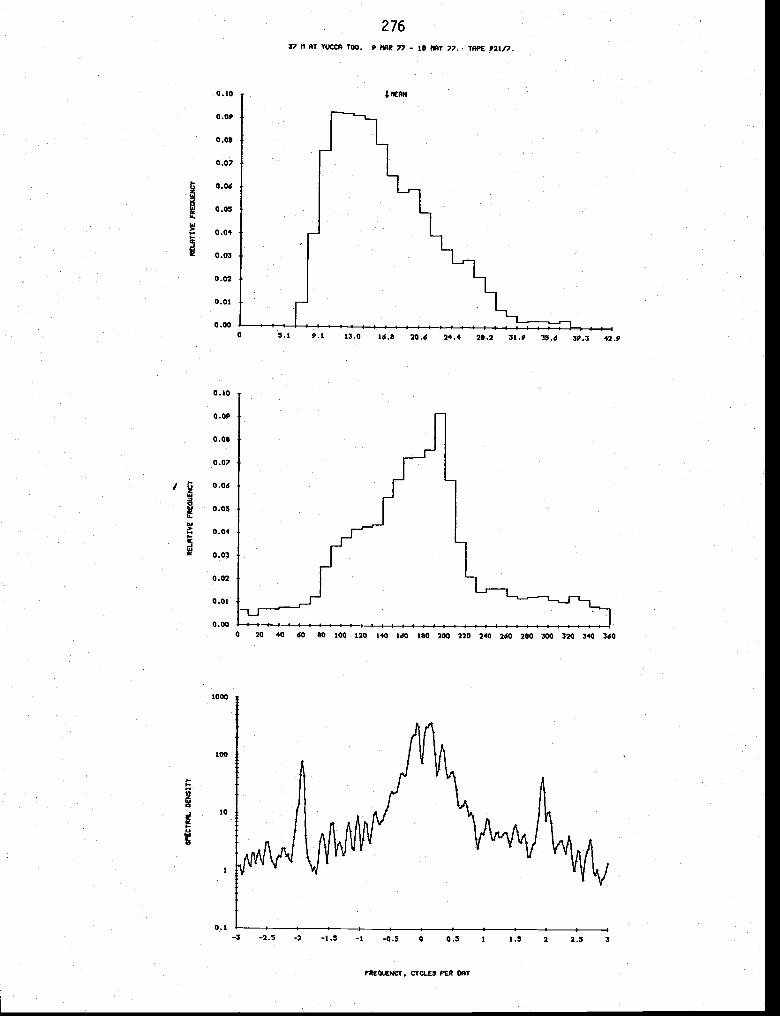
SP
EC
TR
a. D
EN
SIT
Y
0
'a 'a (A
RE
LA
TIV
E F
RE
QU
EN
CY
(A
o0
00
00
00
00
00
00
00
00
b-o
00
RE
LA
TIV
E F
RE
DU
EN
dT
0 (ii
'I g -4 C, 2
0
0 '-4 '0 Gd 0
0 IA
0 I'I 0 a 0 0- 0 0 0 'a 0 S a 0 'a S P-1 S 'a 0 Gd 0 0 Gd 'a 0 0 Gd 0- 0
I-A 'a 'a GA 'a
= '0
A-
—4
0- 'a a a 'a a 'a I-I '0 '4 U 0- G
d 'O S 'a '0

3000
—30 00
—40 00
10.00
17.00
C,
16.00
I I
IAPR37 N AT YUCCA TOO LEG HOURLIES,
69 5 DAYS STARTING 1900 ONT 9 MAR 1977
15.00
39.00
3700 ,.u
35.00 +
A A A — -
-4—4
1

STATISTICS FOR E—W(U) AN) N—S(V) COMPONENTS
AVGIU) AVG(V) VAR(U) VARfl/) STO(U STO(V) COV(UV)—6.6 3+.2 181,9 5.8 1.5 —9.2
VECTOR MEAN: SPC = 7.3 CMIS, DIR = 156 DEGREES(T)DIRECTIONAL STEADINESS: '+7.1+ Z
PRINCIPAL AXIS IS 176.1+ 0EGREES(T)
S1ATISTICS FOR COORDINATES ROTATED 33 DEGREES(EQUIVALENT A1ONGSHORE DIRECTION = 150
YUCCA TOO LEG 557 M
VARIABLE N MEAN STO SKEW KURT MAX PuN
S 689 5.8 1.3 4.3 37.0 3.2
U (CM/S)
V ICM/S)
689 —.7
689 •—7.2 12.'.
.3 2.0 16.3 —15.5
2.4 22.6 —36.0
T(DEG C) 68q 16.1 .1 —.3 2.8 16.6 15.5
278
STATION LEG DEPTH TAPE NO INTERVAL FILTERINGYUCCA TOO 5 57 '+93/29 HOURLY LOW PASS
FIRST 5 LINES OF 0414$1900 9 3 77 10.0 —5.2 10.0 —5.2 15.66 1.2000 9 3 77 10.7 —5.5 20.7 —10.7 15.62 2?1•00 9 3 77 8.5 —6.2 29.1 —16.9 15.5k 32200 9 3 77 7.2 —9.3 36.1+ 15.572300 9 3 77 —7.U 1+5,9 —33.2 15.6 5
LAST 5 LINES OF DATAI700 7 1+ 77 7.0 3.6 2035.7 —1+560.0 16.15 685800 7 1+ 77 8.1 0.2 2043.7 —4559.8 16.15 686
7 77 5•9 —4.3 —'+561+.1 16.15 b877 4 77 3.6 —6.6 2053.3 —1+570.7 16.1k 688
1100 7 4 77 3.1 —8.2 2C56.'+ —4578.9 16.14 689
N CRLTN
7.9

RE
InT
1VE
FR
EO
UrN
CY
IIaA
TIV
E F
RE
OU
EN
CY
a 0
aa
SO
0 C, 0
—0
0.
'a 0— a
flI(I
m 0
'0 .3I,
aA
n0U
-'
U-, a
I., a 0'a
•3—
C' 0
'0'a o
IaC
)C
A
U.,
C-a U., 0 '4 3.
a0 (-
Ia
a 0S
i
0
(a U., (4
-—
08
80
'A
00
(30
00
09
C?
0b
b.
a9.
00
P3
a0
00 0
-p
00
00
c'b
a0.
00
13
a Si
I-,
a a .4 C 0 a —I 8 '0
(3 Cl
C-4
C—
a '0 'a U-, '0

.-. 20.O0•UI
0.00•
-20.00
30.0020.00
0.00N.)U
—20.00
—40.00
17.00 T
a16.00 4.
a
15.00 Iii, 1,1111111111 I •
I APR57 N AT YUCCA TOO LEG 5: HOURLIES,
20.7 DAYS STARTING 1900 GMT 9 MAR 1977

281
STATISTICS FOR E—W(1J) AND N—S(V) COMPONENTS
N AVG(U) VARLU VAR(V) 510(U) COV(UV)1667 1.[ 29.7 9+.0 9.7 —20.7
VECTOR MEAN: SPO = 5.5 DIR 169 OEGREES(T)DIRECTIONAL STEADINESS: 7.
PRINCIPAL AXIS IS 163.6 DEGREES(T)
STATISTICS FOR COORDINATES ROTATED DEGREES(EDUIVALENT DIRECTION = IEGREEStTI1
YUCCA TOO LEG 597
V4PIABLE N MEAN srn SKEW KURT MAX tlIN
S (CM/S) 1667 .1
U 1667 —1.8 5.3 .3 2.7 15.4
V (CM/S) 1667 .3 3.0 25.7 —33.5
T(OEG C) 1667 .1 —.2 2.8 16.1 14.4
STATIONYUCCA TOO
LEG5
TAPE NO123/93
DEPTH97
1.72.33. 53.2•1 P
5 LINES OF19CC 9 3 77 —10.A+ —1U.4 1.7200u 9 3 7i —lu.6 —21.0
9 3 77 —10.1 —31.2 3.02200 9 3 7 —10.0 —41.2 11.2
9 3 77 -5.7 —46.9 11.8
LAST 5 LINES OF DATA:130 18 5 77 —11.3 —1Q.2 1683.9 —9G17.6200 18 5 77 —3.7 0.3 1680.2 —9017.3
18 5 7, 3.7 10.8 1683.913 5 77 13.3 1687.4 —8991.2
5jQ 18 5 77 4.2 14.3 1691.6 —8973.9
I MT ER V ALHOURLY
15 • 2215.2215.2215.2215.22
15. 5315.1915.1315.1215.13
FILTERINGLOW PASS
I
2
3
45
16631664166516661667
CRLTN—. 3917
11.1 5.5 1.? 4.2 14.6

$PE
CT
KflL
DE
NS
ITY
RE
LA1I
VE
rR
D0U
EN
CY
RE
LAT
IVE
FR
EO
UE
NC
Y
0
$-.*
-4 +
+4l
4,4
-•
2
.5_t
i
o0
0o
2o
00
-0
14 .4 (A (A '4, C 0 (A (A '4 'S (A
'4 4(4 2 F -4
044
C,
——
Al
01)
*0 'U 44
, '4
4,q
(.0
Al
CA '4 '0
'I S '-C S
'0—
Cl 0
m S z-z S -4 -4 .4,
-o 0 .4 'C a'4 A
l '4 '0 (-4
04 (4, '4

C,
0waI-
MV UT- -.. .A.. .
— 20.00
0.00
-20.00
—40.00
16.50
MV yrI . .i%.. . .
15.50
14.50
13.50 i_i-tiIutiiIAPR tMAY
97 N AT YUCCA TOO LEG 5: HOURLIES0
69.5 DAYS STARTING 1900 GMT 9 MAR 1977
N)03CA)

285
JOINT—Il 1977 Installation
OPUNTIA V
Posi tion*:Distance Offshore:Bottom Depth:Set:Retrieved:Longest Data Interval:Longest Record Length:
Instrumentation
12°l4.2'S, 77°35.9'W41.9 km (from San Lorenzo Island)620 m1823 GMT1446 GMT0200 GMT66 days,
Comments:
Due to compass failure, no direction data exist for RCM 501 (129 m).
Due to battery failure,1400 GMT 30 April.
data for RCM 1962 (324 m) exists only through
* Navigation: radar fixes and Peru chart DHNM 2100.
12 March 1977 by R/V MELVILLE18 May 1977 by R/V ISELIN13 March to 0800 GMT 18 May7 hours
Intended Accepted Serial Sampling MeasuredDepth Depth Tape # Interval Variables
100 m 129 m 501/39 15 mm S,T,P200 m 224 m 495/38 15 mm S,O,T,P300 m 324 m 1962/4 15 mm S,e,T500 m 524 m 1243/8 15 mm S,O,T

-150
286
324 II 49.1 ORIS 1818 12 NAR 7?
15
75 100 —15 45 60
—125
224 II RI OPUI11A. dd.8 Oms 1906 12 77.
12
-4
—4
20
—a
524 II AT OPU?411A. 66.8 DAYS START2NC 1919 12 MR 77

STAT ISTCS
OPUNTIA LEG 5129 tl
VAPIABLE MEAN STO SKEW KURT MAX MIN
T.(OE& C) 1391 14.2 .0 2.1 15.3 13.2P 129.3 .5 2.7 12.7 132.3 128.5
287
STATION LEG DEPTH TAPE NO INTERVAL FILTERINGOP'JNTIA 5 129 501/39 HOURLY LOW PASS
FIRST 5 LINES OF DATA200 13 3 77 14.90 1293079 1
300 13 3 77 IL+,90 1291459 2
400 13 3 77 14.91 12912.33 3500 13 3 77 14.90 1291656 4600 13 3 77 14.90 1290217 5
LAST 5 LINES OF OATA*400 18 5 77 1288547 1587500 IR 5 77 13.89 1288393 1588600 18 S 77 13.91 1288435 1589700 18 5 77 13.91 128o281 1590800 18 5 77 13.92 1289278 1591

129 N AT OPUNTIA. 12 NAR 77 - 18 NAY 77. TAPE
0ztd
0.04LUi
—IUi
0.02
0.01
0.00
25.2 28.6 1.9
0.08 JItIEAN
4.7 8.2 11.6 15.1 18.5 21.9
SPEED, ON/SEC

03
00129.00
a-
127.00
I APR129 H AT OPUNTIA LEG 5: HOURLIES,
66.3 DAYS STARTING 200 GMT 13 MAR 1977
MAY

S (CM/sI 1591
U (CM/S) 1591
V 1591
T(DEG (.)
8.9 5.1
.3
8.9
12.6 .3 —.1
MAX
.8 3.0 26.7 .2
.3 3.6 17.3 —12.3
.3 2.9 —26.2
3.4 14.1 11.7
290
LEG DEPTHOPUNTIA 5 224 495/38
FILTERINGHOURLV LOW PASS
FIRST 5 LINES OF DATA:13 3 77 —10.9 13.9 —1U.9
300 13 3 77 —i5.i+ 8.7 —26.412.77 2249003 1
400 1. 3 77 —13.5 9.3 —39.922.6 12.86 2249009 2
560 13 3 77 —8.6 13.0 —48.531.9 12.90 2248992 3
603 13 3 77 —9.8 11.1 —58.344.956.0
12.83 224902912.59 2248952
45
LAST 5 lINES OF DATA:4JC 18 5 77 —5.6 —3.7 2664.6 —3634.5503 18 5 77 —6.2 0.2 2658.4 —3634.2
13.25 2245135 1587
18 5 77 —7.0 —3629.913.18 2243361 1588
18 5 77 —7.2 L4.j 2644.113.08 1589
18 5 77 —6.113.08 2245446 1590
N15Q1
STATISTICS FOR EWIU) AND NS(V) COMPONENTS
AVG(u) AVG(V) VAR(U) VAR(V) 510(U) STD(V) COV(tJV) CRLTN1.7 —2.3 45.1 51.8 6.7 7.2 —33.6 —.6942
VECTOR MEAN: = 2.8 CMIS, DIR OEGREES(T)JIRECTIONAL STEADINESS: 31.8 Z
PRINCIPAL AXIS IS 137.8 OEGREES(T)
STATISTICS FOR COORDINATES ROTATED 33 OEGREES(EOUIVALEN'r ALONGSHORE = 150 OEGREES(T1)
OPUNTIA LEG 5224 '1
N MEAN STO SKEW KURT
P .5 2.9 12.3 223.9

SIE
CIR
AL
DE
NSI
TY
0 a 0 8 a '4 0 '3 a '4 0 e 0 &4 0 'a 0
RE
*.R
TZ
VE
00
00
00
00
00
•o0
00
88
8
PR
EG
UE
NC
Y
C,
'I •3 (3 '4 Ca
0
o0
00
00
00
00
•°•°
80
—
0, 0
(A
4- 3
'4 (4
a 3 3 3 'a
-J
I, a '0 (A a
'0 '4 '(3 '0 'a '(3 '0
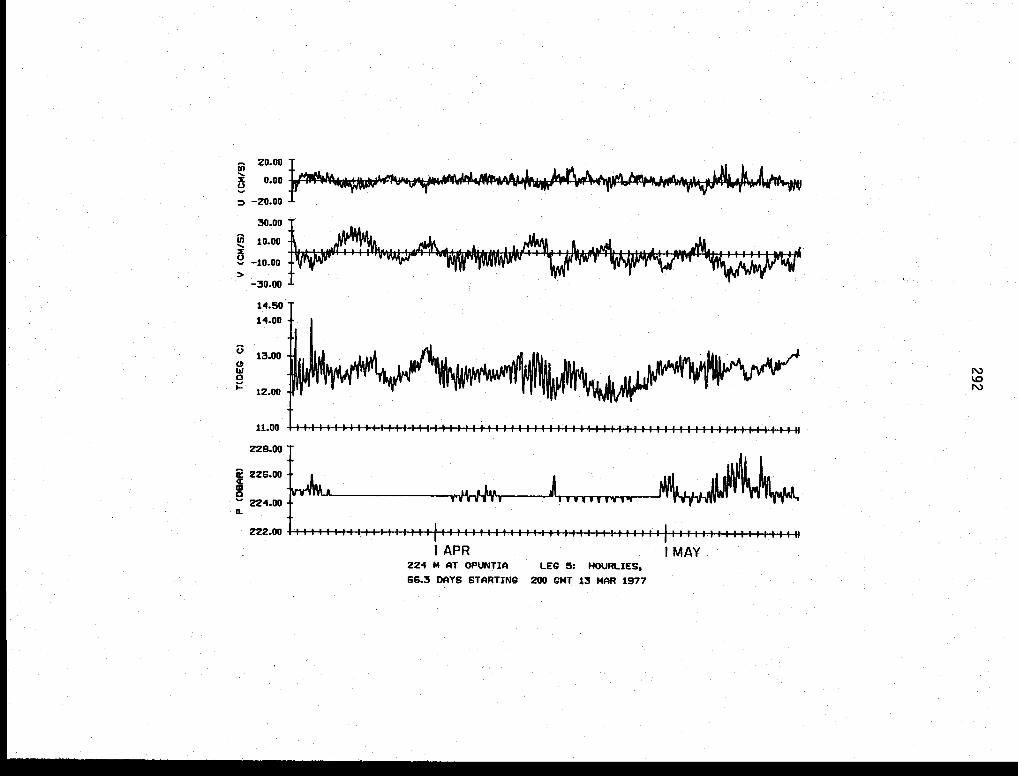
— 20.00 -
—20.00 -
30.00
10.00
—10.00
—30.00
14.50
14.00
13.00C,liia
12.00
11.00
Jfl
t , I I I I ——
N)
0224.00
0.
1
229.00
222.00
224 P4 AT OPUNTIA66.3 DAYS STARTING
LEG HOURLIES,
200 GMT 13 MAR 1977
I MAY

VARIABLE N MEAN STO SKEW KURT MAX MIN
S (CMfs) 1166 4.8 .7 2.8 23.3 .2
U (CM/S) 1166 .2 4.1 .0 2.9 12.0 —13.2
V (CM/S) 1166 —2.4 .1 3.1 21.1 —22.4
r(OEG C) 1166 .5 2.6 11.7 8.3
293
STATION LEG DEPTH TAPE NOOPUNTIA 5 324 196/24
INTERVALHOURLV
FIRST 5 LINES OF DATAI100 13 3 77 —4.3 —2.0 —4.3 —2.0 10.03
20U 13 3 77 —7.1 -4.5 —11.4 —6.4 lb.073u0 13 3 77 —lu.3 —6.5 —21.7 —12.9 10.14
'+00 13 3 77 —iu.2 —8.7 —31.8 —21.6 10.33
500 13 3 77 —4.0 —8.9 —35.8 —30.5 10.65
LAST 5 LINES OF DATA IlCOu 4 77 6.3 —8.4 1562.7 —2285.9 11.29
30 77 5.J —2.7 —2288.6 10.991200 3C 4 77 1.8 1.6 1569.5 —2287.0
1300 4 77 —3.3 2..71 5.7 3.6
1566.21560.5
—2284.6—2281.0
10.5910.55
FILTERINGLOW PASS
I
23
5
116211631164116511.66
STATISTICS FOR E—W(U) AND N—S(V) COMPONENTS
N AVG(U) AVG(4) VAR(U) STO(U) STO(V) COV(UV) CRLTN
1166 1.3 —2.0 28.5 5.3 6.8 —13.0 —.4991
MEAN: SPO = 2.4 CM/S, DIR 146DIRECTIONAL STEADINESS: 31.6 X
PRINCIPAL AXIS IS 147.8 DEGREES(1)
STATISTICS FOR COORDINATES ROTATED 30 DEGREES(EQUIVALENT ALONGShORE 150 DEGREESC 11)
OPUNTIA LEG 5324 M
7.6

0. Id
0.14
0.12
,. 0.10
o.oaU.
w
0.06
0.04
0.02
0.00
294
324 11 At OPUNTIA. 12 liAR 77 — 30 APR 7?. TAPE 1962/4
3.6 5.9 8.1 10.4 12.6 14.8 17.1 19.3 21.6 23.8 26.0SPEED, Cl/SEC
0.07
0.06
0.05
0.04
0.03
I,,'C
0.02
0.01
3.00
1000
100
10
0.I
0 20 60 80 100 120 140 160 180 200 223 240 260 283 300 320 341 360DIRECTION. DEcRIES TRiE
-3 —2.3 -2 —1.5 —l —0.5 0 0.3FREOIZRCY• CYCLES PER DAY
1.5 2 2.5 3

z0.00
0.00
—20.00
30.00
10.00x
—10.00
—30.00
12.00
11.00
'Li II 1-!.LLL.L• LU .. .
D
-,YI'P
10.00
9.00
8.00
C-,,
I APR324 14 AT OPIJNTIA LEG 8z HOURLIES,
48 6 DAYS STARTING 100 GMT 13 MAR 1977
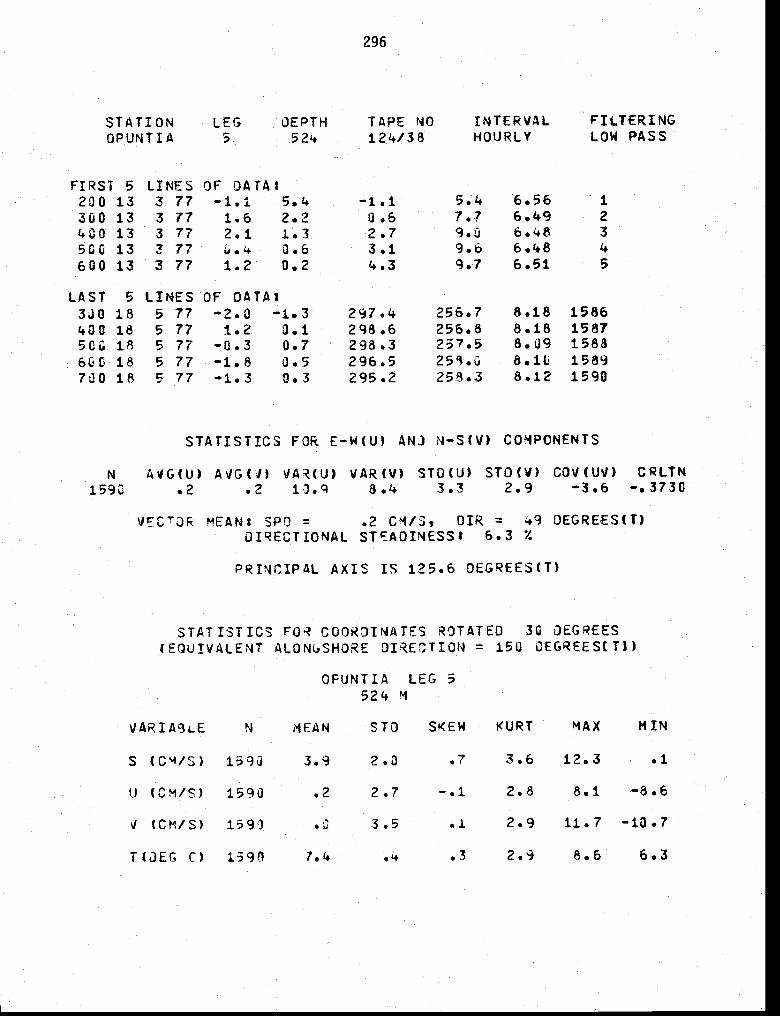
FIRST 5200 13360 13
13560 13600 13
LAST 5
1
400 18506 18660 18700 18
LINES OF DATA:3 77 —1.1. 5.43 77 1.6 2.23 77 2.1 1.33 77 0.63 77 1.2 0.2
LINES OF DATA:5 77 —2.0 —1.35 77 3.15 Ti —0.3 0.75 77 —1.8 0.55 77 —1.3 0.3
STATISTICS FOR E—W(U) N—S(V) COMPONENTS
N1590
AVG(U) A%IG(J) VAR(V) STO(U) STO(V) COV(tJV) CRLTN.2 .2 3.3 2.9 —3.6 —.3730
MEAN: SPO = .2 CM'S, DIR = OEGREES(T)DIRECTIONAL STEADINESS: 6.3 7.
PRINCIPAL AXIS IS 125.6 OEGREES(T)
STATISTICS FOR COORDINATES ROTATED 30 DEGREES(EQUIVALENT DIRECTION = 150 OEGREES( TI)
OFUNTIA LEG 5524
.4 .3
STATIONOPUNTIA
296
TAPE NO
124/38LEG DEPTH
S 52L.
INTERVALHOURLY
FILTERINGLOW PASS
—1.1 5.4 6.56 1
0.6 7.7 6.49 2
2.7 9.u b.48 3
3.1 9.o 6.48 4
4.3 9.7 6.51 5
297.4 256.7 8.18 1586298.6 256.8 8.18 1587298.3 257.5 8.09 1583296.5295.2
258.6258.3
8.168.12
15891590
STO SKEW KURTVARIABLE N MEAN
S (CM/S) 1590 3.9
U (CM/S) 15Q0 .2
V (CPuS) .0
i (OE( C) 7.4
MAX MIN
2.0 .7 3.6 12.3
2.7
3.5
—.1.
.1
2.8
2.9
8.1
11 • 7
.1
-8.6
—10.7
8.6 6.3

0.1—3 —2.5 —2 —1.5 —1 —0.5 0 0.5
FREOVENCT • CTCLE5 PES CAY
1 1.5 2 2.5 2
297524 MAT DRUMlIn. 12 MAR 77—18 MAT??. TAPE 1243/5
4. MEAN
0 2.3 3.5 4.7 5.8 7.0 8.2 P.3 11.5 11.6
SPEED, CM/SEC
0.14
0.12
0.10
0.08
0.06
0.04
0.02
0.00
0.045
0.040
0.035
0.030
0.025
0.020
0.015
0.010
0.005
0.003
100
10
UzU
I''a
Uz'a
a
C
C
z
U
0 20 40 60 80 100 120 140 160 180 200 220 240 260 300 330 320 310 360
DIRECTION, DECREES TRUE
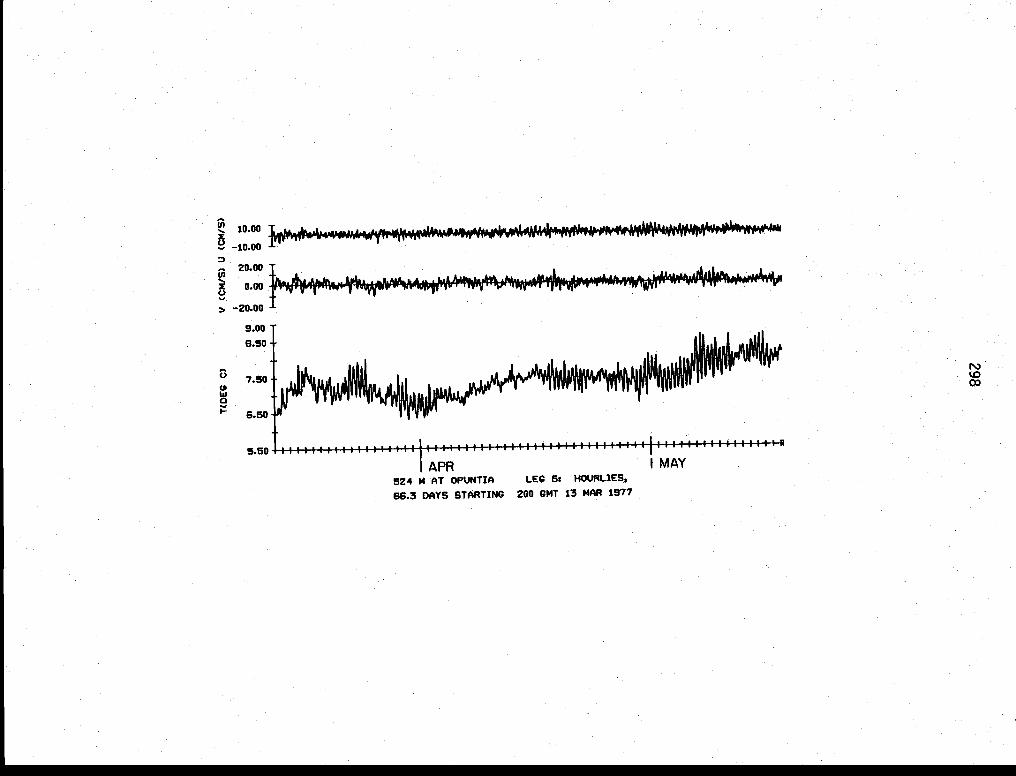
10.00 i:x—, —10.00
-' 20.00 T.f .&..JI_
0.00 1
> -20.00
9.00
0C,'aaI-.
N.)
APR524 t4 AT OPUN1IA LEG 5t HOtJRLIES,
66.3 DAYS STARTING 200 GMT 13 MAR 1977
MAY

299
JOINT—Il 1977 Installation
PEYOTE V
Posi tion*:Distance Offshore:Bottom Depth:Set:Retrieved:Longest Data Interval:Longest Record Length:
Instrumentation
9°57.8'S, 78°24.3'W19.7 km117 m1150 GMT 131322 GMT 191900 GMT 1366 days, 12
* Navigation: radar fixes and U.S. chart H.O. 22008.
March 1977 by R/V MELVILLEMay 1977 by R/V ISELINMarch to 0600 GMT 19 Mayhours
IntendedDepth
40 m60 m
100 m
AcceptedDepth
37 'ii56 m96 m
SerialTape #
496/33499/362278/5
SamplingInterval
15 mm15 mm15 mm
Meas uredVariables
S,o,T,PS,o,T,PS , 0

*50
AT 47.0 DAYS 3TARTING *202 13 MAR 77
54 II AT 0.0 OATS STARTING 1204 *3 MAR 7?
125
Pd A AT PEYOTE. 0.0 DAYS STARTING *219 13 MAR 77
-150 600
—750
-P00

STATISTICS FOR E—W(tJ) AND P1—5(V) COMPONENTS
N AVG(U) AVG(V) VAR(tJ) VAR(V) STO(U) STO(V) COV(tJV) CRLTN1596 11.1 —16.5 31.0 1.23.5 5.6 11.1 —24.8 —.4013
VECTOP MEAN: 5P0 = 19.9 CM/S, DIR = 11+6 OEGREES(T)DIRECTIONAL STEADIMESSI 89.1 V.
PRINCIPAL AXIS IS 165.9 OEGREES(T)
STATISTICS FOR COORDINATES ROTATED 33 DEGREES(t.QUIVALENT ALONGSHORE DIRECTION = 150 CFiREES(TJ)
PEYOTE LEG 537 '1
VARIABLE N MEAN STO SKEW KURT MAX PUN
S (CM/S) 1596 2!.3
U (CM/SI 1.596 1.4
V (CM/s) 1596 —19.8
T(OEG CI 1596 16.8
7.2 .2 2.5 44.4
5.7 .4 2.9 20.2 —13.3
1.2 5.2 26.8
.5 3.9 18.9 15.7
P 1595 36.9 .5 —5.5 39.0 31.1
301
STATION LEG DEPTH TAPE NO INTERVAL FILTERINGHOURLY LOW PASS
FIRST 5 lINES OF DATA:13 3 77 15.1 —35.2 15.1. —35.2 16.48 371761. 1
2000 13 3 77 1.4.5 —34.0 29.6 —69.2 16.50 371629 2
1.3 3 77 16.9 —31.3 46.5 —101.0 16.48 371806 3
1.3 3 77 9.1+ —34.0 55.9 —135.u 16.1+6 369005 42330 13 3 77 10.6 -31.3 —166.2 16.1+2 368436 5
LAST 5 LINES OF DATA:200 19 5 77 8.7 2.3 17626.1 —2631+0.9 17.30 370091 1592330 19 5 77 9.2 3.0 17635.3 —26337.9 16.'+3 370396 1593
19 5 77 11.2 6.9 1761+6.5 —26331.0 16.70 369775 1594500 19 5 77 19.1+ 6.8 17665.9 16.25 369783 1595
6J0 19 5 77 5.3 29.6 17671.2 —26294.6 18.37 3691+77 1596
Ii. .0
1.7

0.24
0.22
0.20
0.18
0.16
0.14
0.12
0.10
0.08
0.06
0.14
3.02
0.00
302
13 IRR — 19 MAY 77. TAPE 496/33A AT PEYOTE.
0.08 J. AlAN
0.06
0.05
Las
0
I..LaS>
CLU
0.01
0.305.5 9.9 14.2 18.5 22.7 26.9 31.1 25.2 42.3 51.2
SPIED, IN/SEl
U1'as00LaS
LI.
Ill
C-I'Ux
40
C
I—U
0 20 40 60 80 100 120
1000
140 toO 180 200 223 240 260 280 303 320 340 360
too
10
0.!
FREDUENIT. 111118 PER OAT

19.00
18.00
C,
17.00a
16.00
30.0020.00
0.00
—20.00
30.00
— 10.00U)
—10.00
—30.00
—50.00
15.00
40.00
Iii
38.00
(A)
(A)
3soo
34.000.
3200
30.00 _,_.____.__I uiiuItIIiII_I MAYI APR
37 H AT66.5 DAYS STARTING
LEG 5: HOURLIES,
1900 GMT 13 MAR 1977

STATISTICS FOR E—W(U) AND N-S(V) COMPONENTS
FILTERINGLOW PASS
N
1596AVG(U) AVG(V). VAR(U) VAR(V) STD(U) STO(V) COV(UV) CRLTN11.4 91.6 5.1 9.6 —19.0 —.3908
VECTOR MEAN: SPO = 22.c CM/S, DIR = 149 DEGREES(T)OIRECTIONAL STEADINESS! 94.5 7.
PRINCIPAL AXIS IS 165.0
STATISTICS FOR COOROINATES ROTATED DEGREES(EQUIVALENT ALONGSHORE DIRECTION = 150
PEYOTE LEG 556 M
N MEAN
S (CM/S) 1596 23.2
U (CM/S) 1596
(CM/S) 1596
T(QEG C) 1696 15.8
7.8
9.6
.3
MAX MIN
2.6 L5,3 2.5
19.9 —14.4
.8 4.2 13.0 —45.0
.5 2.5 16.9 15.2
LEG DEPTHPEYOTE 5 56
304
TAPE NO INTERVAL499/36 HOURLY
LINES OF DATAt3 77 14.j3 77 17.63 77 15.83 77 17.03 77 11.6
FIRST 519u3 132000 132100 132200 1323C0 13
LAST 5
200 19300 19
19500 1960u 19
—28 • U
-26.9—27.7-27.8—29.4
1.0.31.6 —54.9
—82.664.4 —110.576.0 —139.9
LINES5 775 775 775 775 77
OF DATA:3.9 4.6 18119.8 —30028.62.2 7.+ 18122.0 —30021.21.7 7.5 18123.8 3Uo13.73.3 7.1 13127.1 —30006.6
10.1 18129.4 —29996.5
16.07
15.9615.8815.87
15. 5715.4015 • 6315.3416.80
56321756320256320 156320 1563201
5647015647015647015646995647.06
I
2
3
45
15921593159415951596
Sb SKEW KURT
5.1 .4 3.4
(DEAR) 1596 56.3 .2 1.1 6.3 57.1 55.8

0.1—3 —2.5 —2 —1.5 —i —0.5 0 0.5 1 1.3 2 2.5 3
FREOUO4CY, CYCLES PER DAY
305
56 N AT PEYoTE. 13 PAR 77 — 19 fIAT 77. TAPE 499/26
.1.IIEAN
5.5 9.9 14.2 18.5 22.7 26.9 31.1 35.2 39.2 43.0 47.3 51.2
0.0$
0.07
0.06
0.05C,
0.04
0.03Ui
0.02
0.01
0.00
0.30
0.25
0.20
C,
0.15
Ui
0.10
0.05
0.00
1000
100
1-
Isi
10
0 20 43 eo 80 100 120 140 160 103 203 223 240 260 280 300 320 340 360
DECREES

20.00
0.00
—20.00 -
20.0010.00
U,—10.00
C.,
—50.00
I APR56 H AT PEYOTE LEG 5: HOURLIES,
66.5 DAYS STARTING 1900 GMT 13 MAR 1977
11111 1111 III tilt 'I'll I
17.00
16.50
15.50
4A
aCII,'aI—
2
a0.
58.00
56.00-
54.00 IIIII,pIttIIIii,iili,ii,,,,,ipi,,,,,,p,,,,i,itiih,,,,i,,.i.,
(A)
I MAY

9637.9 —21073.19642.4 —21070.5
9646.5 —21)b2.096i+6.9 —21&d63.7
14.1314.7314.7314.7314.86
159215931591+15951596
STATISTICS FOR E—W(U) AND N—S(V) COMPONENTS
N AVG(U) AVG(4) VAR(V) 510(U) STO(V) COV(UV)1596 —13.2 13.8 58.2 1.7 7.6 —6.1+
VECTOR MEAN: SPO = 14.5 CM/S, OIR = 155 OEGRE€S(T)DIRECTIONAL STEADINESS: 93.5 X
PRINCIPAL AXIS IS 171.9 DEGREES(T)
STATISTICS FOR COORDINATES ROTATED 30 DEGREES(EQUIVALENT ALONGSHDRE DIRECTION = 150 OEGREES(TJ)
PEYOTE LEG 596 M
VARIABLE N MEAN STO SKEW KURT MAX MIN
S (CM/SI 1596 15.5 6.5 .2 2.3 32.9
U (CM/S) 1596 4.4 2.6 12.4 —12.9
V (CM/S) 1596 —14.5 7.3 .3 2.9 3.2 —31.9
T(JEG C) 1596 15.2 .3 .5 2.4 16.0 14.5
307
OF OATAFIRST 5190G 132000 1321u0 132200 132300 13
STATION LEG TAPE NO INTERVALPEYOTE 5 96 227/95 HOURLY
10.513.510.19.6
10.0
—19.2—17.7—15.9—13.9—11.5
10.520.931.039.6
—19.2 15.75—36.9 15.75—52.8 15.74—t6.8 15.73—78.3 15.69
1.
23
5
FILTERINGLOW PASS
LINES3 773 773 773 773 77
LINES5 775 775 775 775 77
LAST200
400530
5
1919191919
OF DATA$4.0 —2.9
I
0.1 3.74.8
0.4 —1.7
CRITN—. 2262
1.0

0.26
0.24
0.22
0.20
0.
'— 0.16
0.14
0.12Ia
o.toC
0.0B
0.06
3.04
0.12
3.30
100
10
CC
0.1-3 —2.5 —2 —1.5 —i —0.5 0 0.3 I 1.5 2 2.5 5
•
C
C-j
0.08
0.07
0.06 -
0.05
0.04
0.03
0.02
0.01
3.10 J.
0
30896 11 AT PE'rOTE. 13 LIAR 7? — 19 FlAY 7,• TAPE 2220/5
.I.FIERN
I I I I I I
5.3 9.2 13.2 17.1 21.0 24.9
SPEED. CF/SEC
20.8 32.8 36.7 40.6 44.5
0 20 40 60 80 100 120 140 160 100 200 220 240 260 280 330 323 340 360
DILIECTION. ICOFEEC TRUE

20.00 1
0.00
-20.00
; :> —40.00
16.50
14.00 I I I ......, I I I 1111 I I I I I I I I I I I I I I I I I I I I I I I I I I I
(APR96 H AT PEYOTE LEG 5:
66.5 DAYS STARTING 1900 GMT 13 MAR 1977

0.22
0.20
0.10
0.16
0.14
0.12
0.10
0.00
0.06
0.04
0.02
0.00
310
UIPC fIT IMRRPE. 17 MiD 76 10 7 OCT 76. TIWE 0127/0
£IIEAN
8
(U
0 1 2 3 4 5 6 7 0 9 10 Ii 12 13
SPEED. A/SEC
0.35
0.30
0.25
0.20
0.15
0.10
0.05
0.000 20 40 60 00 100 120 140 160 100 200 220 240 260 200 300 320 340 2d0
DIRECTION. DECREES TRUE
t(Uz
(3(aII-
100
to
0.1
0.01—3 —2.5 —2 —1.5 —1 —0.5 0 0.5 1 1.5 2 2.5 3
FREOUENCT • CTCI.E3 PER DAT

C,
a
311
6.004.00
0.00
—4.00
U)
>
1z.0010.00
6.00
2.00
—2.00•
—6.00
19.00
18.00
17.00
16.00
15.00
14.00
ISEP IOCT0 AT IMARPE 3:
50.5 DAYS STARTING 2200 GMT 17 AUG 1976

313
IMARPE Meteorological Installation

315
JOINT—Il 1976/1977 Installations
Meteorological TowerI MARP E
Position:Location:
Sampling Interval:Measured Variables:
12°03.9'S, 77°09.3'WOn a guyed tower 3 m above the roof of
in Callao, Peru.20 minutes.Speed, direction, air temperature.
a building
Installation Periods:
August 17 1976 1415October 7 1976 1515Feb. 27 1977 1400May 19 1977 1900
Record Length
89 d, 7 h50 d, 11 h
142 d, 16 h69 d, 10 h
Comments:
The building used for the installation was that of the Instituto del Mar delPeru (IMARPE), located in La Punta, a borough of Callao. The building isabout 80 m long, oriented east-west, and seven stories high, the highestfor at least a kilometer in any direction. It is situated on a narrowpeninsula or spit about 200-300 meters across that extends to the west,with a beach and open ocean to the south (windward) and Callao harbor tothe north (leeward). Only flat, open space lies to windward betweenIMARPE and the south beach. Slightly to the east of windward and acrossthe street, lies a series of two—story buildings. Any distortions of thewind field are probably limited to those produced by the IMARPE buildingitself.
SerialTape # Installation Time (GMT) Recovery Time (GMT)
II Dl27/7 March 19 1976 1830III D127/8 August 17 1976 1445IV Dl27/9 October 7 1976 1545
V Dl27/10 March 10 1977 1815

—21250
316
SURFACE AT IfIARPE. 89.9 DAYS STARTING 1900 19 hAY 76
29750
25500
21250
12750
8500
4250
—17000 —12750 —8500 -4250 4250
-4250

STATISTICS FOR E-W(U) AN) N—S(V) COMPONENTS
N AVG(U) AVG(V) VAR(U) VAR(V) 510(1) 510(V) COV(UV)2143 —2.6 2.1 3.1 1.5 1.8 —1.7
VECTOR MEANS SPO = 4.6 C1/S, DIR = —33 OEGREES(T)DIRECTIONAL 96.6 7.
PRINCIPAL AXIS IS 143.2 DEGREES(T)
STATISTICS FOR COORDINATES ROTATED 33 DEGREES(EQUIVALENT ALONGSHORE DIRECTION 150 OEGREES(TJ)
IMARPE LEG 2J
VARIABLE N MEAN STD SKEW KURT MAX MIN
S (MIS) 2141 1.9 .1 2.8 11.3 0.c
U (MIS) 2143 .9 .1 '.9 —5.6
V (M/S) 2143 3.7 11.3 —3.7
TA (OEG) 2143 .9 —.2 3.3 22.2 15.7
STATIONIMARPE
LEG2
OF OATA*—2.2—2.8—1 • 1—1 • 1
FIRST S2u
20
20
L
5
5 765 765 76
317
OEPTN TAPE NO3 0127/7
3.4 —2.23.1 —5.02.1 —6.1
—7.21.8 —8.6
5.1 —5555.04.2..2
5 76 —1.4
INTERVALHOURLY
19.8719.8519.7519.72
3,4k
8.69.4
LAST303
5u3
5
1717171717
LINES8 768 768 768
76
8 76
11.2 19.58
OF DATAI—4.8—5.1
• 7—4.4—.1
8121.18125.38129.58134.98138.3
FILTER INGLOW PASS
I
2
3
4
5
21392140214121422143
CRLTN-.6 716
15.9916. 0016.IC
16.84
I —4. .
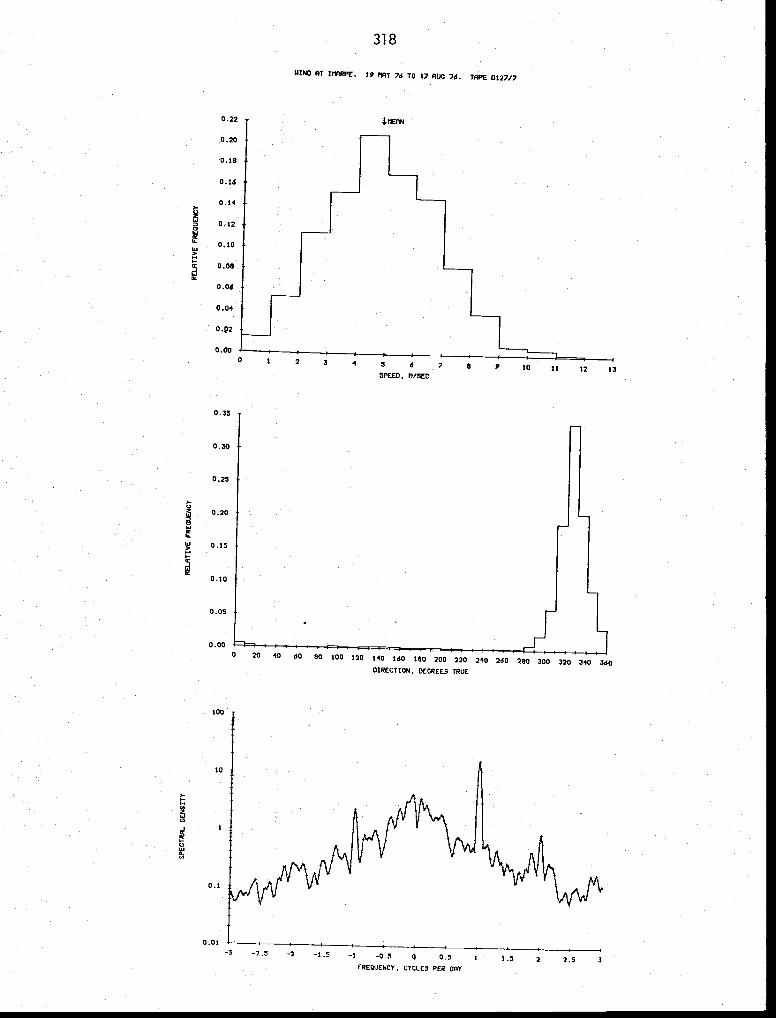
318
hIND AT ItIARFE. 19 MAT 76 10 1? AUG 76. IRPE 0127/?
J.IIERN0.22
0.20
0.18
0.16
0.14
::::
0.06
0.04
0 .p2
0.000 2 3 4 5 5 7
SPEED. fl/SEC8 9 10 11
0.35
0.30
0.25
0.20
12 13
Uz00'Si
0.05
60 80 100 120 140 160 180 200 220 240 260 280 300 320 340 360DIRECTION, DECREES TRUE
is,
0-II-'.5
100
10
0.1
0.01—3 —2.5 -2 -1.5 —t —0.5 5 0.5
IREQIJENCY. CTCLE3 PER CRY
1.5 2 2.5 3

U)I
U)I>
C,U,0
18.00
-J
15.00
I JULOHAT tMARPE LEG2
89.3 DAYS STARTING 100 GMT
I
HOURLIES,
20 MAY 1976
I AUG

SURFACE AT IIIARPE. 51.0 DAYS STARTING 1520 17 AUG 76
320
15750
1350Q
9000
6750
—11250
2250
—9000 —6750 -4500 -2250 2250
-2250

STATIONIMARPV
STATISTICS FOR E—W(U) N-S(V) COMPONENTS
N AVG(UI AVG(V) VAR(V) 310(U) 310(V) COV(UV)1211. 3.5 '+.2 1.9 2.1 —3.2
MEAN: SP!) = C'l/S, OIR —30 OEGR€ES(T)DIRECTIONAL STEADINESS: 90.6 V.
AXIS IS 138.5 DEGREES(T)
STATISTICS FOR COORDINATES ROTATED 30 DEGREESIEOUIVALENT ALONGSHORE ON = 150
IMARPE LEG 3
VARIABLE N MEAN STD SKEW KURT MAX IIN(MIS) 1211 4.5 2.0 .3 2.6 10.7 .1
U (MIS) 1211 —.1 5.3 —3.6
1211 2.6 3.8 10.7 —5.8
TA (DES) 1211 .7 .7 3.7 19.0 14.6
321
LEG TAPE NO INTERVAL FILTERING3 u HOURLY LOW PASS
FIRST 5 LINES OF DATA:2230 17 8 76 —3.7 14.8 —3.7 +.8 17.01+ 1
2300 17 8 76 —4.3 6.0 —8.1 lu.8 17.39 2
0 18 8 76 —4.8 6.3 —12.8 17.1 17.41 3
18 8 76 —4.? 5.6 —17.6 22.7 16.88 4
200 18 8 76 —4.3 5.2 —21.9 27.9 16.81 5
LAST 5 LINES OF DATA:1+00 7 71 5.4 —25L+9.7 '+251.9 16.34 1207500 7 10 76 —3.5 4.2 —2553.2 '+256.1 16.22 12086CC 10 76 —3.1 4.7 —2556.3 1+263.7 16.12 1209703 7 7r 2.9 4.9 4265.6 16.34 1210
7 76 3.8 —25b2.3 1+269.'+ 15.91 1211
CRLTN—.8428
—.7

—16000 —12800
322
SURFACE AT IIIARPE. 71.6 DAYS STARTING 7 OCT 76
22400
19200
16000
12800
9600
6400
3200
-3200
5200—9600

323
SURFACE AT IMARPE. 71.6 DAYS STARTING 650 18 DEC 76
23450
20100
16750
13400
10050
6700
-3350
—16750 —13400 -10050 —6700 -3350

STATIONIMARPE
LEG DEPTH
324
TAPE NO INTERVALHOURLY
FILTERINGPASS
STATISTICS FOR E-W(U) AND N-S(V) COMPONENTS
N AVGIU) AVG(V) VAR(U) VARIV) STOtU) STO(V) COV(UV)342k —2.3 3.7 2.5 1.3 1.6 —1.5
VECTOR SPC = 14,3 Cl/S. DIR = —31. OEGREES(T)DIRECTIONAL STEAOINESS! 95.9 X
AXIS IS 142.1. DEGR€ES(T)
STATISTICS FOR COORDINATES ROTATED DEGREES(EQUIVALENT ALONGSHORE DIRECTION = OEGREESET])
IMARPE LEG 43M
VARIABLE N MEAN STO SKEW KURT MAX MIN
S (M/S) 3424 9.2
U (M/S) 3424 .8 .6 3.9 4.5 —2.9
V (M/S) 4.3
TA (DEG) 3421+ 23.0 1.9
5.1 9.1 —4.7
—.2 2.0 24.9 15.2
C 0127/9
FIRST 5 LINES OF DATA!2300 7 IC 76 —2.6 5.6 —2.6 5.6 16.77
0 8 IC 76 —2.8 4.9 —5.5 10.5 16.77100 8 10 76 —2.4 3.7 —7.9 14.2 lc.l1200 8 10 76 —1.9 3.0 —9.7 1.7.2 16.78
10 76 —1.8 3.2 —11.5 20.1+ 16.70
LAST 5 LINES OF DATA!1300 27 2 77 2.O 3.:1 —7911.5 12589.2 20.601100 27 2 77 —0.8 2.8 —1912.3 12592.1 20.59
2 77 0.3 2.8 —7912.0 12594.9 20.681300 27 2 77 —1.1 3.1 —7913.2 12597.9 21.17
27 2 77 —1.6 3.2 —7914.8 12601.1 21.56
I
2
3
LI.
S
34203421.
342231+23
3424
CPLTN—.721+8
4. 5 1.6 —.0 2.7
1.9
.2

0.24
0.22
0.20
0.18
0.16
0.14
0.12
0.10
0.08
0.06
0.04
0.02
0.00
325
lUND Al UIARPE. 7 OCT 76 TO 27 FEB 77. TAPE 0127/9
J,I1EAN
O 1 2 3 4 5 6 7 B 9 10 11 12
SPEED, S/SEC
'a
'aII.'a
zbJa-JCC
0.40
0.35
0.30
0.25
0.20
0.15
0.10
0.05
0.00
too
10
0.1
0.01
0 20 40 60 80 100 120 140 160 180 200 220 240 260 280 300 320 340 360DIRECTION. DECREES TRUE
—3 —2.5 —2 —1.5 —1 —0,5 5 0.5 1 1.S 2 2.5 3
FREQUENCY, CYCLES PER OAT

1.frn
I
wn19.90
a
17.90
15.50
1990
10.00
7.101
C.'.)N.)
11.51)- 4! H I I H I I I I I—I-I 110-I H I--I H 11+1 I-I I I I-I
J
I-I—I-I 4.! I-I 04-4 I II I-I H 0-44-I I-H H4-J I Ill--H 3-I-I I-I—I 4—04-I I—II I I I
I II
I .9
112.7 1)011) 0)01)1,96 2)1)1) 64-4) 7 ocr isic

327
SURFACE AT IMARPE. 69.9 DAYS STARTINC 1901 10 MAR 27
2650
18550
15900
10600
7950
2650
—10600 —7950 —5300 —2650
-2650

STATISTICS FOR E—W(U) AN) N—S(V) COrIPONENTS
STJ(U) COV(UV) CRLTN—i.e 5.1 2.2 —3.4 —.8593
MEAN: = 3..+ OIlS, —26 JEGREES(T)STEADINESS:
IS DEGREES(T)
FOR COJROINATE3= CEGREES(T))
I.IARPE LEG 5
U (MiSs
fM/5) 1666
328
ST4I AR P E
LEG OE2TH TAPE NO INTERVAL FILTERING5 0i27/iO HOURLY LOW PASS
FIRST S LIt1ES OF DATA:11 3 77 —3.7 —3.7 j11 —2.8 5.2 —6.5 9.7 21.+4 2Ii 3 77 —9.9 21.27 3Ii 7/ —3.3 —13.3 21.211 3 77 —2.5 22.u 21.J9 5
LAST S LINES UF flAlAt19 5 77 —2.7 —26.2.3 18.3819 5 77 —2.4 —2b0Z+.7 18.28 166319 5 77 —1.9 —26L&.7 18.1119 5 77 —u.3
5
5 (M/3) 1656
.9
STO SKEW KURT iAX
1.8
.8
2.83.
.1 2.7
5.7
'i IN
0
-2.9
9.
TA 1665 1J.9
—.9 3.6 —s.a
.1 2.2 23.6 16.6

0.22
0.20
0.18
0.16
0.14
0.12
0.10
0.08
0.06
0.04
0.02
0.00
329WIND AT IIIMRPE. 10 lIAR 77 - 19 MAY 77. TAPE 0177/lO
MEAN
1 2 3 4 5 6
SPEED. A/SEC
7 8 9 10 11 12
1-U
.6
UzCU
t4zU
0.35
0.30
0.25
0.20
0.15
0.10
0.05
0.00
100
0 20 40 60 80 100 120 140 160 180 200 220 240 260 280 300 320 340 360
DIRECTION. DECREES IRIJE
10
0.1
0.01
—3 —2.5 —2 —1.5 —l —0.5 0 0.5 1 1.5 2 2.5 3
FR02UENCY • CYCI.E3 PER flAY
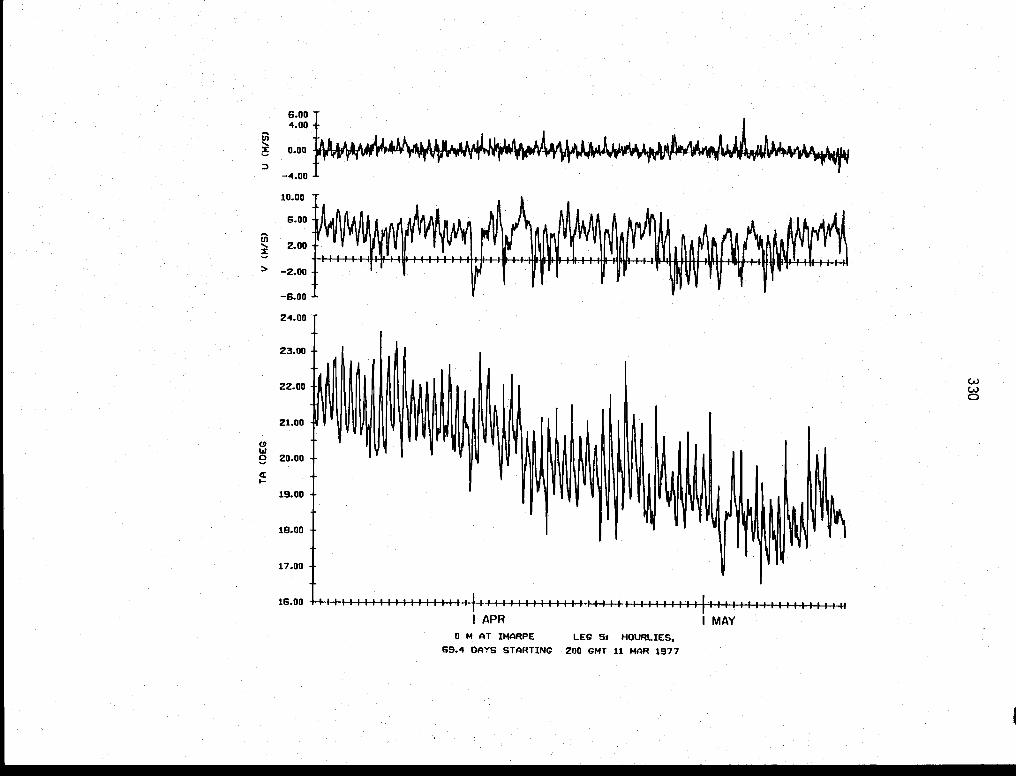
InxD
Inx>
Cow0
—4.00
200
24.00
23.00
22.00
21.00
20.00
19.00
18.00
17.00
16.00
(A)(A)cD
I APR0 N AT IMARPE LEC HOURLIES,
69.4 DAyS STARTiNG 200 CMI 11 MAR 1977
MAY
I

331
APPENDIX I
JOINT II Navigation Chartsand Positions

333
JOINT II Navigation Charts and Positions
The lack of a single chart with a coastline and bathymetry in whichwe could be confident plagued us throughout the JOINT II experimentAlthough we operated from Chimbote (9°S) to south of San Juan (16°S), mostof the work was concentrated between Cabo Nazca and Punta Ana, near l5°S;unfortunately, this is a strong candidate for being the worst charted partof the coast.
The charts of the Pisco-San Juan area that we found and used all hadsoundings based on an 1836 British survey, with some later additions AGerman chart (DHI—721) was used to obtain positions for Leg 1 mooringsfrom radar fixes aboard the R/V ALPHA HELIX, in March 1976 The coastlineon DHI—721 seems to correspond fairly closely to that on the U S chart(H.O. 1218), which cautions: "The coastline for about 10 miles to the south-eastward of Pta del Infiernillo is reported to lie about 1¼ miles southwest-ward of its charted position" For the rest of the experiment our navigatorsmainly referenced their radar fixes to the Peruvian chart (DHNM 2200), thoughoccasionally satellite fixes were accepted While the soundings on DHNM 2200and HO. 1218 are apparently based on the same source (i.e. the 1836 survey), thecoastline was based on a topographic chart of the Military GeographicalInstitute of Peru (IGM).* This coastline does not agree well with thatof the German and US charts
Positions of prominent coastal navigation points from Infiernillo(l4°40'S) to Pta. Lomas (15°33'S) are shown in Table Al.1, as they weredetermined from each of the three charts. The same features on the Germanand U.S. charts lie within ½ n.m. or less of each other; this suggests thattheir coastlines are based on the same source (as were the soundings).Features on the Peruvian chart lie l-1½ n.m. from those of DHI-72l andH.O. 1218, in some instances to landward (Cabo Nazca, Pta. Santa Ana) andin others to seaward (Pta. San Juan, Pta. Lomas). Near Infiernillo thecoastline on the Peruvian chart lies north and west of the one on the U.S.and German charts, as opposed to the reports that the true coastline liesto the southwest (seaward). This seems to confirm that the DHNM 2200 coast-line was based on a different survey. The lack of agreement between surveysis not surprising, considering the rugged, uninhabited nature of the area.
Before we were aware of the discrepancy between charts, we assumedthat mooring positions were known to within no less than a nautical milein order to avoid inconsistencies Now we feel it sensible to statepositions to the nearest 1/10 mile relative to the charts used to determinethem Correcting for chart discrepancies usually makes the positionsmutually consistent with each other within the limits of typical coastalnavigation uncertainties (±0.2 n. miles).
* The 1GM Topographic charts we used for land work were based on aerialphotographs and geodetic control done by 1GM in collaboration with theInter-American Geodetic Survey in 1966.

334
Table Al.1 Positions of coastal features as determinedfrom three navigation charts used in theJOINT II Experiment.
CoastalFeature D.H.I. 721 H.O. 1218 DHNM 2200
Infiernillo 14°40.4'S/75°55.O'w 14°39,8'S/75°55.O'W 14°38.2'S/75°55.8'w
Cerro Do?ia Maria 14°41.2'S/75°50.2'w 14°40.8'S/75°49.8'w 14°39.5'S/75°50.8'W
Pta. Olleros 14°46.7'5/75°43.l'w 14°46.O'S/75°43.l'w 14°46.7'S/75°44.O'W
C. Nazca 14°57.O'S/75°31.5'W 14°56.8'S/75°31.l'w 14°57.3'S/75°29.8'W
Pta. Sta. Ana 15°08.O'S/75°23.O'w 15°07.9'S/75°22.6'W 15°O8.7'S/75°21.9'W
Pta. San Juan 15°21.O'S/75°ll.tJ'w 15°21.2'S/75°1O.8'W 15°21.7'S/75°ll.3'W
Pta. Lomas 15°32.8'S/74°51.7'w 15°33.4'S/74°50.5'W 15°34.O'S/74°51.Q'W

335
A related problem concerns the bathymetric chart of the JOINT IIarea produced by O'Brien and Preller, based on the R/V MELVILLE survey ofMay 1977 (Preller, CUEA Newsletter 6f4]) Some investigators may havenoted (as we have) that stations plotted on this chart are shown to beshallower in depth than was indicated by the ship's PDR when the stationwas taken (or by pressure sensors, in the case of Aanderaa current metermoorings).
Figure Al.l (redrawn from O'Brien and Preller) shows how thisinconsistency may be related to the coastline discrepancy The positionsof Cabo Nazca and Pta. Santa Ana as determined from DHI-721 and H.O. 1218(not shown) plotted very close to the corresponding points on the O'Brien-Preller chart The DHNM 2200 points plot considerably east of, and somewhatsouth of the points on the other three charts (see triangles, Figure Al 1)The Leg V (1977) current meter mooring positions, based on DHNM 2200,appear too shallow relative to the isobaths (squares) If they are re-plottedusing the same range-crossings, but relative to the O'Brien-Preller navigationpoints, the depths become more reasonable (small circles) Leg I mooringpositions (crosses) do not appear to be in serious conflict with theO'Brien—Preller chart, consistent with the fact that those positions arebased on radar fixes on the DHI—72l chart. In particular, the AGAVE depthand offshore distance appear much more reasonable than on DHNM 2200,where it shows up as being in 60-70 m of water, and 2.3 n m from shore,AGAVE was in fact set about 3/4 n.m. from shore at a bottom depth of 40 m.
Which chart is more correct in an absolute sense is not certain.The processed satellite positions from Scripps appear to lie consistentlyseaward of the corresponding radar positions on DHNM 2200 (O'Brien,personal communication) The positions given in Table Al 1 and in theinstallation summaries are the original coordinates determined from thenoted navigation charts, and uncorrected for discrepancies between chartsUsers are hereby advised of these discrepancies, and if they wish to makecorrections, we recommend the above procedure.

Figure A1.1
336
Bathymetry and coastline from the O'Brien—Preller chart. Leg I navigationpoints (0) and moorings ( ÷ ) were referenced to the DHI 721 chart; Leg Vnavigation points ( ) and moorings (0 ) were referenced to the DI-INM 2200charts. Leg V moorings were then (0) to account for the discrepancybetween navigation points (i,e,.. coastline) on the two charts.

337
APPENDIX 2
Calibration of the Aanderaa TemperatureSensors Used in JOINT II

339
Calibration of the Aanderaa Temperature Sensors used in JOINT II
The temperature sensors of the Aanderaa current meters are calibratedat OSU by immersing several current meters in a bath whose temperature ismeasured by a quartz probe. The quartz probe is itself calibrated at leastonce per year. Details of the calibration procedure have been described byBarstow (1978).
All but one of the current meter and buoy temperature sensors used inJOINT II were calibrated in this manner at least once. Most of the currentmeters were calibrated both before and after their use in JOINT II. Some
of the current meters were new when the experiment began, and there was notime to calibrate them before the experiment. Others were lost at sea,either during the experiment, or very soon afterwards, and no post-JOINT IIcalibration could be made.
Temperature Data from Current Meters
The resolution of the temperature sensors of the Aanderaa currentmeters is about 0.02°C. For each current meter, we compared the post-JOINT II calibration with the pre-JOINT II calibration, over the actualtemperature range observed by that current meter during JOINT II. Currentmeters for which the pre- and post-calibrations were essentially identical(within ±2 bits, or ±0.04°C) are listed in Table A2.l (first column). Forsome current meters, the post-calibration did not agree with the pre-calibration; this generally occurred only when there was a long time (twoor three years) between the two calibrations. For these current meters(second column) we used the post—JOINT II calibration curves to processthe data. All but one of the current meters which had not been calibratedprior to JOINT II were calibrated afterwards. The post-calibration informa-tion was used to process the temperature data from these instruments (thirdcolumn).
For all but one of the current meters lost before post—calibrationwas possible (Table A2.2), we used the pre-calibration to process thedata. Our long—term calibration records indicate that the calibration ofeach instrument generally changes by less than 0.1°C, but one change of0.2°C has been observed. We estimate the accuracy of this group to bewell within 0.2°C.
The one remaining current meter (Parodia, 24 m) had no recent calibra-tion, and was lost with Peyote II, a mooring that had been left on thePeru shelf off Huarmey in May 1977, for recovery in November 1977. No
trace of this mooring was found during the recovery attempt. The data from24 m, Parodia was processed using an average calibration curve for OSUcurrent meters.

Locations and depths of current meters for which (a) pre—JOINT IIand post-JOINT II temperature calibrations changed by 0.04°Cor less; (b) pre-JOINT II and post-JOINT II temperaturecalibrations did not agree (post—calibration curves wereused to process the data); (c) no pre—JOINT II calibrationsexist. The precision of the Aanderaa water temperaturechannels is believed to be ±0.04°C.
Table A2.1
(a) (b)Pre- and post-cali-
(c)
Installation Station Pre- and post- brations disagreed; NotPhase Name calibrations agreed Post—calibrations used
pre—calibrated;Post—calibrations
Leg I: AgaveSourMilaIslayaLobivia
29 m80 m28,53 m
206,556 m
10 m100 m78 m41,66,116 m406,626 m
used
Leg II: MilaLagartaYuca
62 m115,212 m80,100 m
33,84,109 m312,412 m
Leg III: Mila 79,104 m 28,53 m
Leg IV: Mila 23,48,73 m
Leg V: AgaveMilaIronwoodLagartaLobiviaEuphorbiaOpuntiaYucca—TooPeyote
26,67,77 m 46 m39,59,80,100 m 19 m24,44,63,105,155,180 m92,115,214 m58,83 m63 m 26 m129,324 m37 m 57 m56 m
115 m
512 m183,283 m
224,524 m97 m37,96 m

341
Table A2.2 Locations and depths of current meters for whichthere is no post-JOINT II calibration data, withthe serial/tape number and the date of lastcalibration. For the current meters calibrated in1976, the accuracy of the temperature data isbelieved to be ±0.04. For the remainder, theaccuracy is believed to be within ±0.2°C.
Leg I Lobivia 106 m (684/28) 27 Nov. 73
Leg IV Mila 99 m (503/34) 4 Feb. 76
Leg V ParodiaParodiaParodia
2464
104
m
m
m
(438/24)(452/37)(485/35)
no14
4
recent calibrationSept. 73Feb. 76

342
Water Temperature Data from Meteorological Buoys
A similar study was made of the water temperature sensors on themeteorological buoys. The sensors are made by Aanderaa, and the data isrecorded by Aanderaa data loggers. The resolution of the data is ±0.08°C.The temperature data from the buoy temperature sensors is, therefore,of lesser quality than the data from current meters. If the pre- andpost-calibrations agreed to within ±2 bits (±0.16°c), we deemed them tobe identical.
Some of these temperature sensors exhibited a drift, which wasapparently caused by a very small leak. All of the data was thereforecompared with 3 m temperature data from CTD casts whenever possible.The results are summarized in Table A2.3.

343
Table A2.3 Summary of 3 m water temperature datafrom meteorological buoys.
Mooring
Post— andPre—Caljb.
Agree
Agreeswith CTD
Data
DataAccepted as
Good
Mila lB no post—calib. yes yes
Mila II no no no
Mila V yes yes* yes
Ironwood no no no
Lagarta no no no
Euphorbia yes yes* yes
Parodia yes yes* yes
* Very little CTD data available for comparison.
