of the issi 2011 conferenceeprints.rclis.org/16666/1/perianes_issi_2011.pdfissi 2011 the 13th...
TRANSCRIPT

Proceedings13th International Conference of theInternational Society for Scientometrics & Informetricsdurban, south Africa, 04-07 July 2011
of the ISSI 2011 conference
edited by Ed Noyons, Patrick Ngulube & Jacqueline LetaVolume ii
i
Proceedings of
ISSI 2011
The 13th Conference of the International Society for Scientometrics and Informetrics
Durban, South Africa July 4-7, 2011
Volume 2
Edited by Ed Noyons, Patrick Ngulube and Jacqueline Leta
Published by ISSI, Leiden University and University of Zululand 2011

Proceedings of ISSI 2011
ii
Proceedings of ISSI 2011. The 13th Conference of the International Society for Scientometrics and Informetrics. © Authors © International Society for Scientometrics and Informetrics The cover was designed by Balázs Schlemmer, with use of the photos of Graeme Williams / MediaClubSouthAfrica. © Balázs Schlemmer © Graeme Williams © MediaClubSouthAfrica ISBN 978‐90‐817527‐0‐1 Printed by University of Zululand Reprographic and Printing Centre

Proceedings of ISSI 2011
iii
Preface The 13th biennial International Conference on Scientometrics and Informetrics is held under the auspices of the International Society for Scientometrics and Informetrics (ISSI). The society aims to encourage communication and exchange of professional information in the field of scientometrics and informetrics, to improve standards, theory and practice in all areas of the discipline, to stimulate research, education and training, and to enhance the public perception of the discipline. The most recent ISSI conference meetings took place in Stockholm (Sweden, 2005), Madrid (Spain, 2007) and Rio de Janeiro (Brasil, 2009). Traditionally, the ISSI conference covers research on quantitative studies of science, scientific publishing, science dynamics, research performance, collaboration, technometrics, webometrics, mapping of science and network analyses. Also this year most submissions were on these topics. It seems however that more and more the attention shifts from scientific literature in journals to other sources. Webometrics has gained a solid position but also books are becoming more important together with the discussion on arts and humanities outputs. The authors of the submitted papers have put much effort in visualization. The graphics in these proceedings, as you will notice, have become extremely important to illustrate, to make a point, as an object of study or as a result. The next proceedings may have to be printed in full color not to loose vital information. In total we received 175 submissions for Full papers and Research in Progress (RiP) papers and around 40 for posters from 37 different countries. At the conference, 65 full papers and 28 RiP papers will be presented orally together with 52 posters. This means that around 30% was rejected or withdrawn. We would like to acknowledge the support of the following organizations for their generous contribution: Elsevier Ltd, Thomson Reuters, Yahoo, University of Zululand, Durban University of Technology and Leiden University. We are grateful to all authors for submitting their papers and posters as well as to all members of the scientific committee for reviewing all submissions. For the creation of the book of proceedings we thank Suze van der Luijt who put a lot of effort in editing the manuscript. Last but not least, we wish to express our gratefulness to Neil Evans, Bosire Onyancha, Peter Ingwersen and Dennis Ocholla helping us to create the program and proceedings. The editors Ed Noyons, Patrick Ngulube & Jacquline Leta

Proceedings of ISSI 2011
iv

Proceedings of ISSI 2011
v
ISSI2011OrganisationandProgramCommittee
National Organising Committee Prof. Theo Bothma – UP Dr. Gavin Davies – UWC Dr. Daisy Jacobs – UZ Prof. Mabel Majanja – UNISA Prof. Patrick Ngulube – UNISA Prof. Dennis Ocholla - UZ Dr. Bosire Onyancha – UNISA Dr. Daisy Selematsela – NRF (TCB) Prof. Peter Underwood – UCT Athol Leach - UKZN Dr. Naresh Sentoo - DUT Neil Evans - UZ
Conference Chairs Dennis N. Ocholla Daisy Jacobs Peter Ingwersen
Programme Chairs Ed Noyons and Patrick Ngulube
Poster Chair Jacqueline Leta and Bosire Onyancha
Doctoral Forum Chairs Jesper W. Schneider and Bosire Onyancha

Proceedings of ISSI 2011
vi
Program committee
Thematic chairs Éric Archambault Aparna Basu Katy Börner Wolfgang Glänzel Birger Larsen Liming Liang
Martin Meyer Henk Moed Bluma Peritz Ronald Rousseau Jane Russell Mike Thelwall
Other members Isidro Aguillo Per Ahlgren Subbiah Arunachalam Fredrik Åström Judit Bar-Ilan Sujit Bhattacharya Manfred Bonitz Maria Bordons Lutz Bornmann Kevin Boyack Tibor Braun Quentin Burrell Linda Butler Clara Calero Chaomei Chen Rodrigo Costas Rickard Danell Koenraad Debackere Ying Ding Leo Egghe Tim Engels Claire Francois Wouter Gerritsma Jochen Glaser Isabel Gomez Juan Gorraiz Stefanie Haustein
Sybille Hinze Marianne Hörlesberger Stefan Hornbostel Peter Ingwersen Evaristo Jiménez-Contreras Sylvan Katz Hildrun Kretschmer Vincent Lariviere Grit Laudel Jonathan Levitt Grant Lewison Loet Leydesdorff Terttu Luukkonen Marc Luwel Valentina Markusova Katherine Mccain Ülle Must Ton Nederhof Patrick Ngulube Dennis Ocholla Victoria Okafor Omwoyo Bosire Onyancha Olle Persson Ismael Rafols Ravichandra Rao Ed Rinia Elías Sanz-Casado
Andrea Scharnhorst Edgar Schiebel Christian Schloegl Ulrich Schmoch Jesper Schneider Anne Sigogneau Giorgio Sirilli Gunnar Sivertsen Henry Small Bart Thijs Robert Tijssen Cornelis Van Bochove Nees-Jan Van Eck Thed Van Leeuwen Bart Van Looy Anthony Van Raan Liwen Vaughan Martijn Visser Ludo Waltman Jos Winnink Mathias Winterhager Dietmar Wolfram Paul Wouters Erjia Yan Michel Zitt Alesia Zuccala

Persson
656
Benchmarking and visualising the knowledge base of pharmaceutical firms (1995-2009)
Antonio Perianes-Rodríguez1,2, Alice O'Hare2, Michael M. Hopkins2, Paul Nightingale2 and Ismael Rafols2
1 [email protected] Carlos III University of Madrid, Department of Library and Information Science, SCImago Research Group, C/
Madrid, 128, 28903 Getafe, Madrid (Spain)
2 [email protected] (corresponding author) SPRU – Science and Technology Policy Research, University of Sussex, Brighton, BN1 9QE (England)
Abstract The rise of biotechnology in the 1970s ushered in a change in innovation strategies in the pharmaceutical industry. The vertically-integrated company become more reliant on a distributed innovation structure in which large corporations integrate the knowledge generated by a network of actors, including small biotechnology firms and public research organisations. In this context, it is important for the players in the network to benchmark the knowledge base of pharmaceutical firms against their competitors in the industry, as well as against possible collaborators. In this paper we present a suite of interactive visualization techniques that help understand the relative positions of pharmaceutical firms, collaborators and past or prospective mergers and acquisitions.
Introduction The rise of biotechnology 30 years ago ushered in a change in the pharmaceutical innovation system. Vertically integrated companies became more reliant on the expertise of a number of actors, including small biotechnology firms and public research organisations (McKelvey, 2004). However, the change in innovation model has had no substantial impact on productivity of therapeutic R&D economic development (Nightingale & Martin, 2004; Hopkins et al. 2007). Expectations around the rapid growth of biotechnology and associated revolutionary treatments led to investment in biotechnology which raised R&D expenses, but did not result in comparable rise in the number of newly created drugs (Munos, 2009). The increase in R&D costs without the expected rise in successful drugs, compounded by cost containment policies in health and continued demands of returns by investors, have put pharmaceutical firms under stress. This context has led to further change in the pharmaceutical R&D system. Pharmaceutical firms have followed corporate strategies that include acquisition of smaller firms, mergers with competitors and outsourcing a variety of R&D activities. Recently, we reported evidence in both the decline in the absolute number of papers authored by top pharma and a significant rise of their collaboration with public research organisations to undertake research (Rafols et al., 2010b). In summary, large pharmaceutical corporations acquire and diversify their capabilities by taking over other corporations and small biotechnology firms, and by collaborating with public research bodies, while cutting back on in-house R&D centre resources and staff. This picture is consistent with recent analyses advising pharma to outsource research to meet their objectives (Morgan Stanley, 2010). In this context, it is crucial for pharmaceutical firms to understand their knowledge base. This serves two purposes: on the one hand to benchmark against their competitors in the industry; on the other hand, to locate possible collaborators (Rafols et al., 2010a). It also aims to contribute to ongoing attempts to devise methods to map the technological trajectories of fields and organizations (e.g. Verspagen, 2007). The rationale underlying the effort in
Persson
657
mapping is that technological organisations (and technology) exist in multidimensional spaces and may develop and progress into different directions. The plurality (and ambiguity) of potential technological choices and associated paths is better captured and conveyed by rich 2-dimensional maps than by uni-dimensional tables. In this paper we present a suite of interactive visualization techniques that aim to help understand the relative position of pharma firms and their collaborators in the ‘pharma knowledge space’. The full suite of interactive maps is available online at http://www.scimago.es/perianes/spru/intromaps.html. Since the labels and the colours of the maps are too small for the print version, we recommend the readers to look at details in this webpage.
Material and methods The papers authored by the 15 major pharmaceutical firms (including subsidiaries and acquisitions) were downloaded from the Web of Science (WoS). The 15 firms where those with largest absolute number of articles published between 1995 and 2009: Pfizer, Merck, GSK, Novartis, Roche, Astrazeneca, Sanofi-Aventis, Eli Lilly, Bayer, Johnson and Johnson, Abbott, Bristol-Myers-Squibb, Amgen, Novo Nordisk and Boehringer Ingelheim. The document types chosen were “article”, “letter”, “note”, “proceeding paper’, and “review’ for 1995-2009. Information on each company’s acquisitions, mergers and subsidiaries was gleaned from their annual reports and the Recap database (http://www.recap.com/). A total of 160,841 records were obtained, standardised, processed and analysed with VantagePoint software (http://thevantagepoint.com/). The freeware programmes Pajek and VOSviewer were used for visualisation (http://pajek.imfm.si/, http://www.vosviewer.com/). Two types of maps were created to visualize the knowledge base of pharmaceutical firms and one type for the collaboration networks. The first type was an overlay map of global pharma publications following the methodology detailed in Rafols et al. (2010a). An updated map based on 2009 version of the Global Map of Science was used to map category cross-citations11. The second type (used for 2 analyses) mapped the 191 most cited journals by the pharmaceutical firms in the period 1995-2009. All citations received by these 191 journals were downloaded from the WoS. This data was used to create the cosine similarity measure between journals, which allowed location of the papers in a network according to Pajek’s Kamada-Kawai algorithm. Factor analysis was applied to the resulting matrix to attribute each journal to a scientific speciality (e.g. Oncology) (Leydesdorff & Rafols, 2009; Perianes-Rodríguez et al., 2010). As described in the following section, this journal map was used to make two different overlays: for interactions between fields (i.e. knowledge flows) and for specialization of given pharmaceutical firms. The third type of map is a co-authorship network of the pharmaceutical firms and the top 50 collaborations of each of them (which have major overlaps), leading to a total of 286 organisations. The VOSviewer similarity was used to generate the coordinates of organisations. Finally, the network was created combining the original matrix (edges) and the coordinates (nodes).
Results
Pharma production overlay in the global science maps As discussed in Rafols et al. (2010), the global maps of science offer a robust first point of entry to investigate the knowledge base of a large organisation. Here we use the maps of science to locate the main disciplines of publication of top pharma (Figure 1), as well as the areas of growth and decline (see webpage12). Pharma publishes mainly in the fundamental 11Thisbasemapisfreelyavailableathttp://www.leydesdorff.net/overlaytoolkit/,seealsowww.idr.gatech.eduforauser‐friendlyonlineuploadingofdatatomakethemap.12http://www.scimago.es/perianes/spru/Interaction_Categories.html

Persson
658
biosciences, in infectious diseases, analytical and organic chemistry, clinical medicine, some neurosciences, and some health services. Comparing 1995-99 and 2005-2009, we observe a decrease of publications in the more traditional knowledge bases, namely fundamental biosciences and infectious diseases, and an increase of new areas, namely computer sciences, some medical fields such as rheumatology, ophtamology and psychiatry, and health care, occupational health and health services. Thus, the main insight gained is that overall pharma publications have become more diversified over the last 15 years.
Figure 1. Pharma production (1995-2009) overlaid on the global map of science.
Evolution of cross-citations in the pharmaceutical journal map Although the global science map is helpful to locate a body of research, it is too coarse for a detailed analysis of interactions between fields or of time evolution. In order to obtain a finer picture, we created a map of the most highly cited journals by pharma (Figure 2). The base of this map is from the cross-citations among these journals in the Web of Science in 2004-2006 (downloaded), and hence not derived from our subset pharma data (as is usual in bibliometric studies). Thus, the positions of the journals correspond to how similar journals are according to all science. Then, we can overlay two types of knowledge flows (i.e. cross-citations among journals): those of all science (which we call ‘expected’, since they would be the patterns to expect from pharma if it behaved as ‘average science’), and those of pharma only (‘observed), and over three different periods (1995-99, 2000-04, 2005-09; see webpage13). The results show that there has been a thematic diversification in the cross-citations patterns, in accordance with results at the global map. From a knowledge base concentrated around fundamental biosciences (mainly biochemistry and cell biology), citations have increased towards more medicine-specific areas, such as cardiology, oncology and vaccines. This increase can be seen both for all science (‘expected) and for pharma only (‘observed).
13http://www.scimago.es/perianes/spru/Interaction_Pharma.html

Persson
659
Figure 2. Network of cross-citations (for all the WoS) among journals cited by pharma.
Figure 3. Areas of specialisation of Novo Nordisk
Specialisation of pharmaceuticals firms as seen in journal maps Using the same journal basemap, we investigated the areas of specialisation of the different top 15 pharma firms. Figure 3 shows the case of Novo Nordisk (see webpage for other
Persson
660
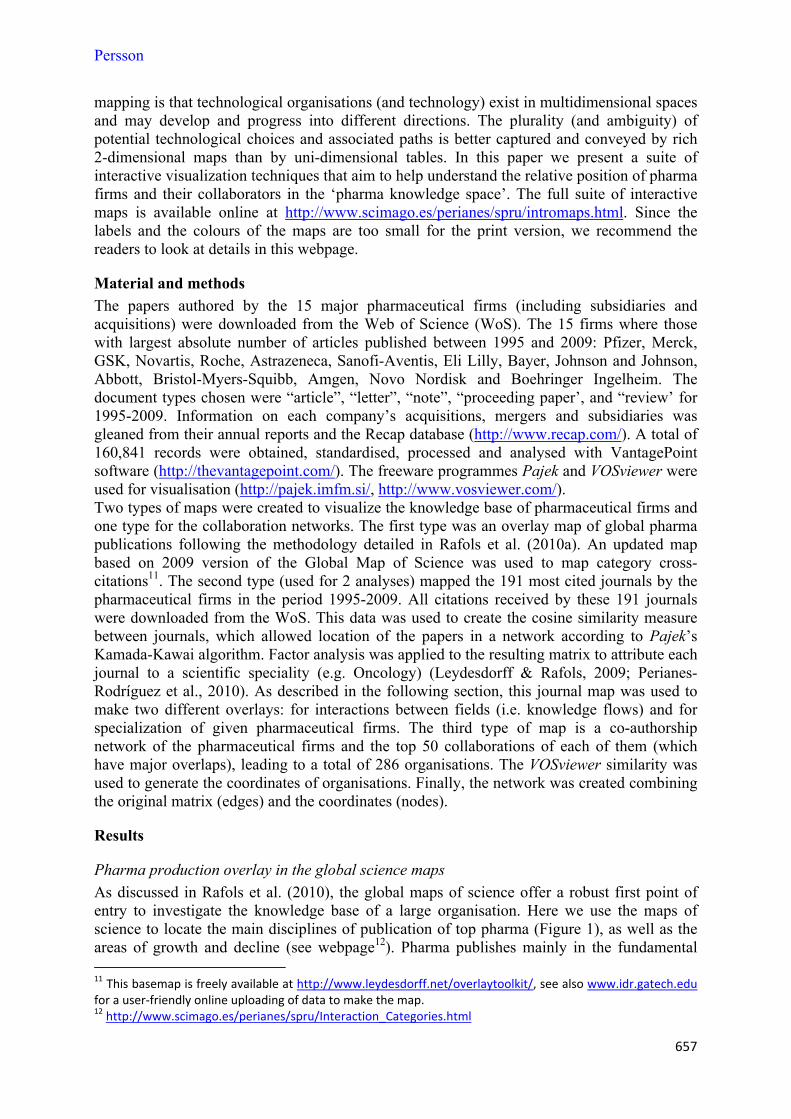
firms14). Here the size of the node is proportional to the quotient of dividing the number of publications of a firm in a given journal by the number of publications by all top 15 pharma in that journal. This is the relative specialisation of a firm in a journal. In the case of Novo Nordisk, we see a clear specialisation in endocrinology journals, as known from its research on diabetes (it manufactures insulin). We had hoped that a journal map would provide sufficient degree of granularity to see in detail the topics specialisation of the different firms (which can not be seen in the coarser map of science based on inaccurate ISI Subject Category). This has been confirmed for firms with clear profiles, such as Novo Nordisk or Amgen (expertise in antibodies applied to cancer and immunology). However, for larger firms such as Pfizer or Roche, it is difficult to identify clear patterns of specialisation. More detailed analyses are necessary, for example using keywords such as the Medical Subject Heading (MeSH) provided by PubMed.
Figure 4. Collaboration network of top-pharma (1995-2009)
Collaboration networks Finally, we conducted an analysis of the collaborations of pharma firms according to co-authorship (Figure 4, see webpage15). The results support the view that geographical co-location is a key factor in stablishing collaborations, as reported by Tijssen, 2009. There is a high degree of internationalisation of pharmaceutical research: European firms publish ~35% of their papers from their own US labs; and US firms ~20% of theirs in their own European labs. However, more than 60% of collaborators of European-based firms are Europeans, and likewise a ~60% US collaborators for US-base firms. Thus, in the collaboration network we see mainly Scandinavian universities near Novo Nordisk, German universities near Bayer, etc. This is corroborated by factor analysis of the collaboration network –the solution is made of factors mainly composed by organisations of the same country (or linguistic area in the case of Switzerland). This can be appreciated in the interactive webpage, comparing these factors with the subnetworks formed by same-country organisations.
Conclusions The pharmaceutical innovation system is shifting from being relatively in-house R&D focused to becoming an open network composed by large pharma, small biotech and public 14http://www.scimago.es/perianes/spru/Interaction_Companies.html15http://www.scimago.es/perianes/spru/Interaction_Colaborations.html

Persson
661
research organisations. In this context, bibliometric mapping techniques can be helpful to locate the body of research of one organisation and explore its evolution over time. This study has shown that this visualisation is feasible for making overlay maps and for using as basemap global maps of science or area-specific (in this case pharma) journal maps. In particular, the study has allowed identification of: (a) the diversification in the knowledge base of top 15 pharmaceutical firms, which have reduced their publications in the traditional biosciences, and increased their publications in health services, some computater sciences and some medical specialties such as rheumatology; (b) the areas of expertise of specific firms; (c) the collaborators of pharmaceutical firms. A procedure similar to the one followed here to analyse collaboration networks, may be applied to disaggregate subsidiaries, merged companies and takeovers, thereby obtaining fuller details on the variations in each company’s scientific production. However, the degree of resolution of the global maps (disciplinary) or the journal maps does not always allow a clear identification of the expertise of pharmaceutical organisation. In order to obtain a description better aligned with practitioner needs (i.e. more concerned on therapies than disciplines), finer and more practitioner-oriented labelling methods such as PubMed’s MeSH will need to be developed.
Acknowledgments A. Perianes-Rodríguez conducted this research at the University of Sussex as awardee of José Castillejo grant, JC2010-0042, funded by the Spanish Ministry of Education. A. O’Hare and I. Rafols were supported by EU FP7 project FRIDA, grant 225546. The authors would like to thank the three anonimous referees for hepful suggestions and comments.
References Hopkins, M.M., Martin, P.A., Nightingale, P., Kraft, A. & Mahdi, S. (2007). The Myth of the Biotech
Revolution: An assessment of technological, clinical and organisational change. Research Policy, 36 (4), 566-589.
McKelvey, M., Orsenigo, L. & Pammolli, F. (2004). Pharmaceutical analized through the lens of a sectoral innovation system. In Malerba, F. (ed.), Sectoral Systems of Innovation. Cambridge: Cambridge University Press, pp. 73-120.
Morgan Stanley. (2010). Exit research and create value. New York: Morgan Stanley Research Pharmaceuticals.
Munos, B. (2009). Lessons from 60 years of Pharmaceutical Innovation. Nature Reviews Drug Discovery, 8, 959-968.
Nightingale, P. & Martin, P. (2004). The Myth of the Biotech Revolution. Trends in Biotechnology, 22, 564-569.
Perianes-Rodríguez, A., Olmeda-Gómez, C. & Moya-Anegón, F. (2010). Detecting and Visualizing Research Groups in Co-authorship Networks. Scientometrics, 82 (2), 307-319.
Rafols, I., Porter, A. & Leydesdorff, L. (2010a). Science Overlay Maps: A new tool for Research Policy and Library Management. Journal of the American Society for Information Science and Technology, 61 (9), 1871-1887.
Rafols, I., O'Hare, A., Perianes, A., Hopkins, M.M. & Nightingale, P. (2010b). Collaborative practices and technological trajectories in large pharmaceutical firms. International Conference of Tentative Governance in Emerging Science and Technology (pp. 93-95). Enschede: Twente University.
Tijssen, R.J.W. (2009). Internationalisation of pharmaceutical R&D: how globalised are Europe's largest multinational companies?, Technology Analysis & Strategic Management, 21(7), 859-879.
Verspagen, B. (2007) Mapping technological trajectories as patent citation networks: a study on the history of fuel cell research. Advances in Complex Systems, 10 (1), 93-115.

These proceedings are a record of the 13th Interna-tional Conference of the International Society for Sci-entometrics and Informetrics (ISSI2011).
ISSI is an association of professionals active in the emerging interdisciplinary fields of informetrics, bib-liometrics/scientometrics, technometrics and webo-metrics. The application areas of the field include: scholarly communication, indicators of scientific and technological performance and collaboration, knowledge mapping and visualization, the structure and dynamics of WWW, information systems and in-formation retrieval.
ISSI aims to encourage communication and exchange of professional information in the field of scientomet-rics and informetrics, to improve standards, theory and practice in all areas of the discipline, to stimulate research, education and training, and to enhance the public perception of the discipline.
ISSI’s constitutional structure includes a President, a Secretary-Treasurer, and Board members. ISSI Board meetings have been held in association with the conference every two years since establishment.
Among its members are scientists from over 30 coun-tries representing all five continents.
ISSI presidents:
Hildrun Kretschmer (Germany) Michael E.D. Koenig (USA) Bluma Peritz (Israel) Cesar Macias-Chapula (Mexico) Mari Davis (Australia) Henry Small (USA) Ronald Rousseau (Belgium)
Information and how to join the society, categories of membership and associated fees can be found on the ISSI web site:
http://www.issi-society.info