office of systems planning gis t conference april 22, 2015 · · 2015-04-25gis‐t conference...
TRANSCRIPT

Office of Systems PlanningGIS‐T Conference
April 22, 2015
1

Presentation outline Importance of interstate system Project objective Evaluation structure Plan overview Interstate Corridor Evaluation (ICE) tool ICE demo
2
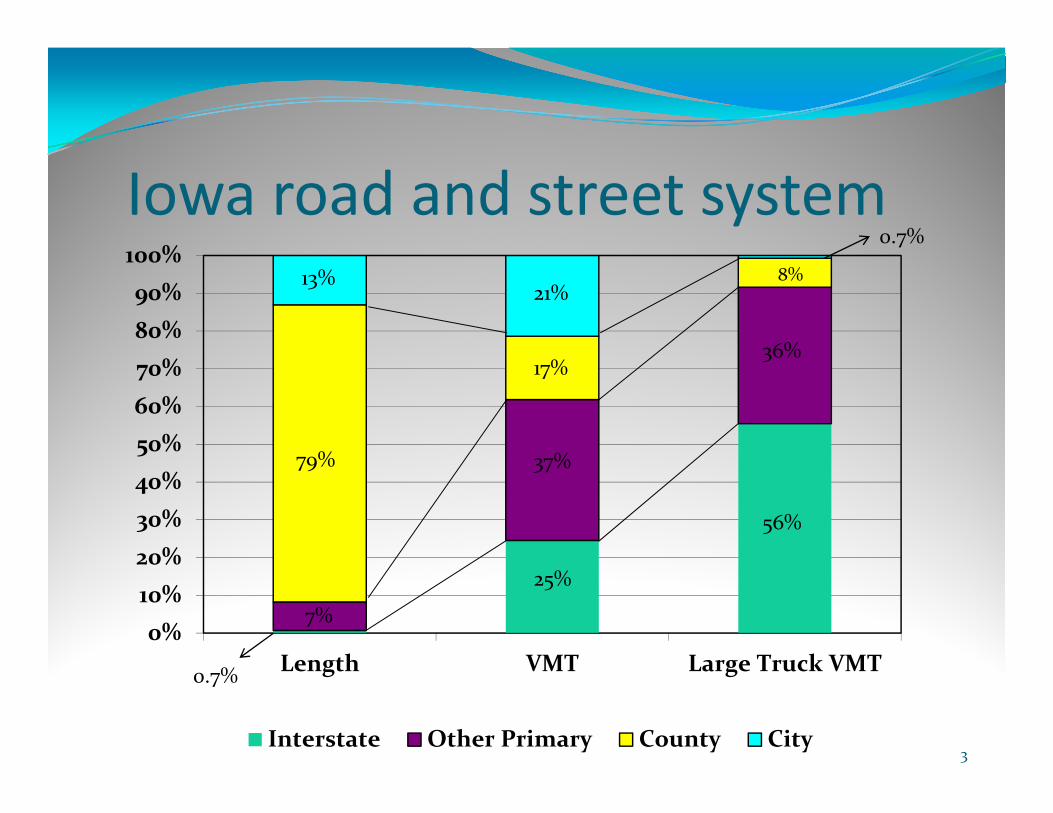
Iowa road and street system
0%10%20%30%40%50%60%70%80%90%100%
Length VMT Large Truck VMT
Interstate Other Primary County City
21%
79%
8%
0.7%
36%17%
7%
0.7%
37%
13%
25%
56%
3
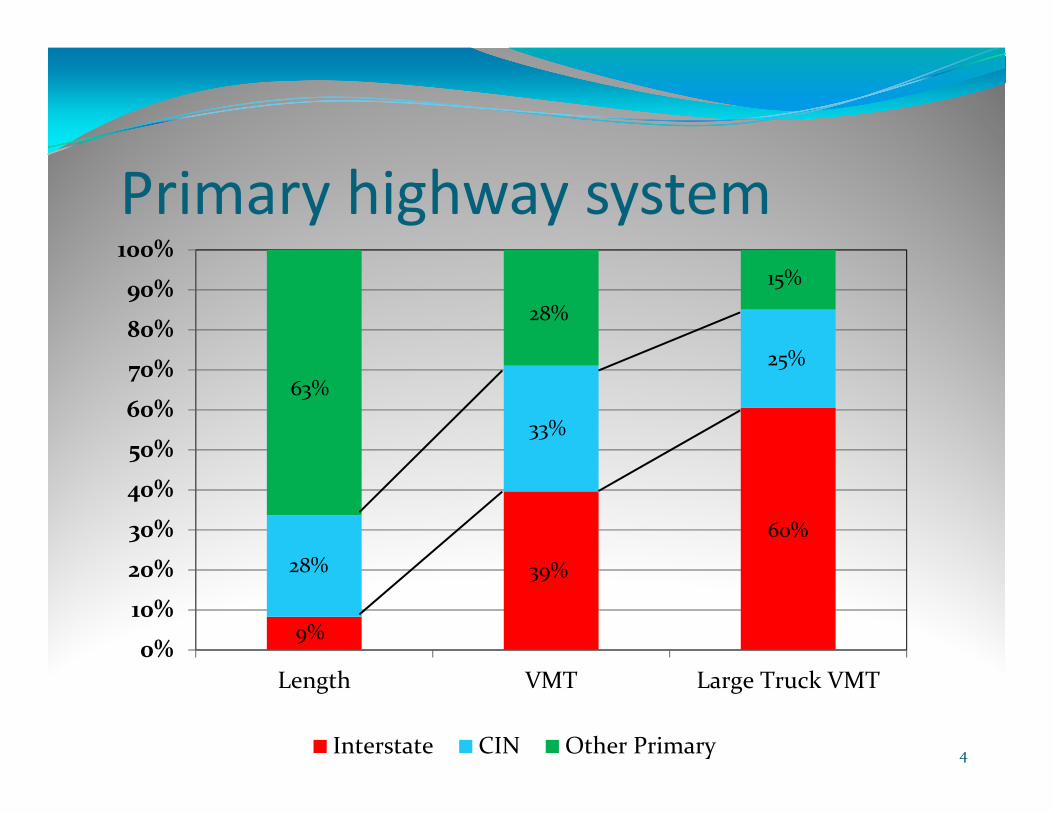
Primary highway system
0%
10%
20%
30%
40%
50%
60%
70%
80%
90%
100%
Length VMT Large Truck VMT
Interstate CIN Other Primary
9%
63%
28%
33%
39%
60%
15%
25%
28%
4
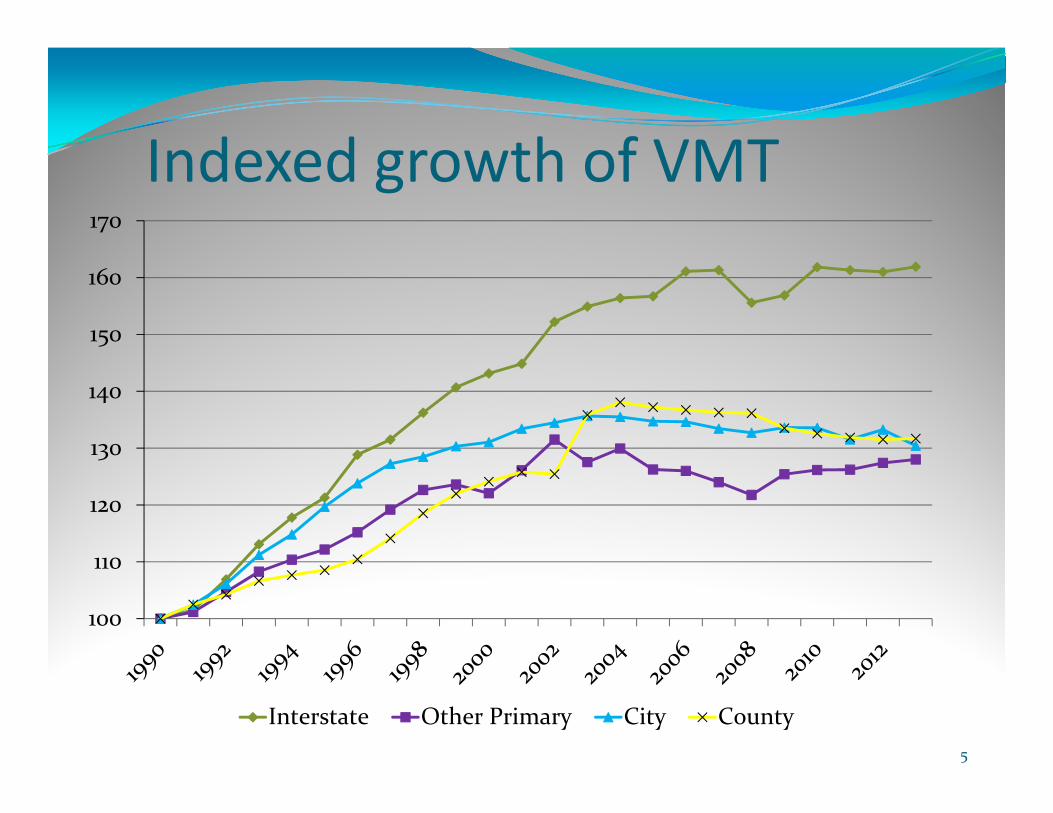
Indexed growth of VMT
5
100
110
120
130
140
150
160
170
Interstate Other Primary City County
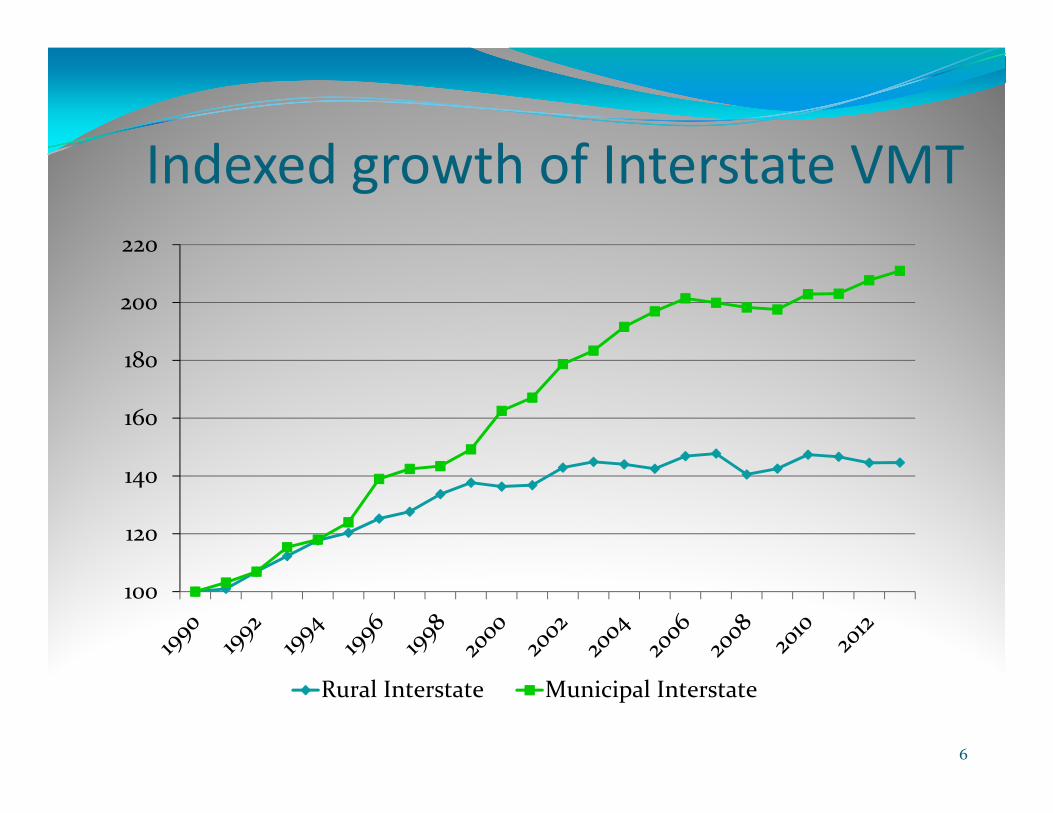
Indexed growth of Interstate VMT
6
100
120
140
160
180
200
220
Rural Interstate Municipal Interstate

Long‐haul freight truck traffic, 2011
7

Long‐haul freight truck traffic, 2040
8
Interstate Corridor Plan objective Evaluate the entire Interstate mainline system, independent of current financial constraints, using a select group of criteria weighted in terms of relative significance. Will provide the department with an initial screening and prioritization of Interstate corridors.
These corridors would then represent those areas that should be considered for further study and possible programming.
9

Evaluation structure Seven evaluation criteria (next slide)
Supplementary data (SD/FO, crashes, 5‐Year Program) Normalized to common scale (1‐10) Determined appropriate weighting (percentage) Applied corresponding multipliers Maximum composite score = 100 Low score indicates greater need
10

Evaluation criteria Pavement Condition Index 25% Structure Sufficiency Rating 25% International Roughness Index 15% Combination Truck AADT 15% Single‐Unit Truck AADT 5% Passenger AADT 5% Congestion (V/C) 10%
100%
11
Evaluation strengths
12
Flexible tool that allows for quick adjustments to evaluation structure
Easy access to all input data and processed output data Provides a single composite rating for all Interstate mainline segments, in addition to individual criteria
Evaluation results can be summarized in table and map form, consumed via web‐based tool
Useful input to programming process
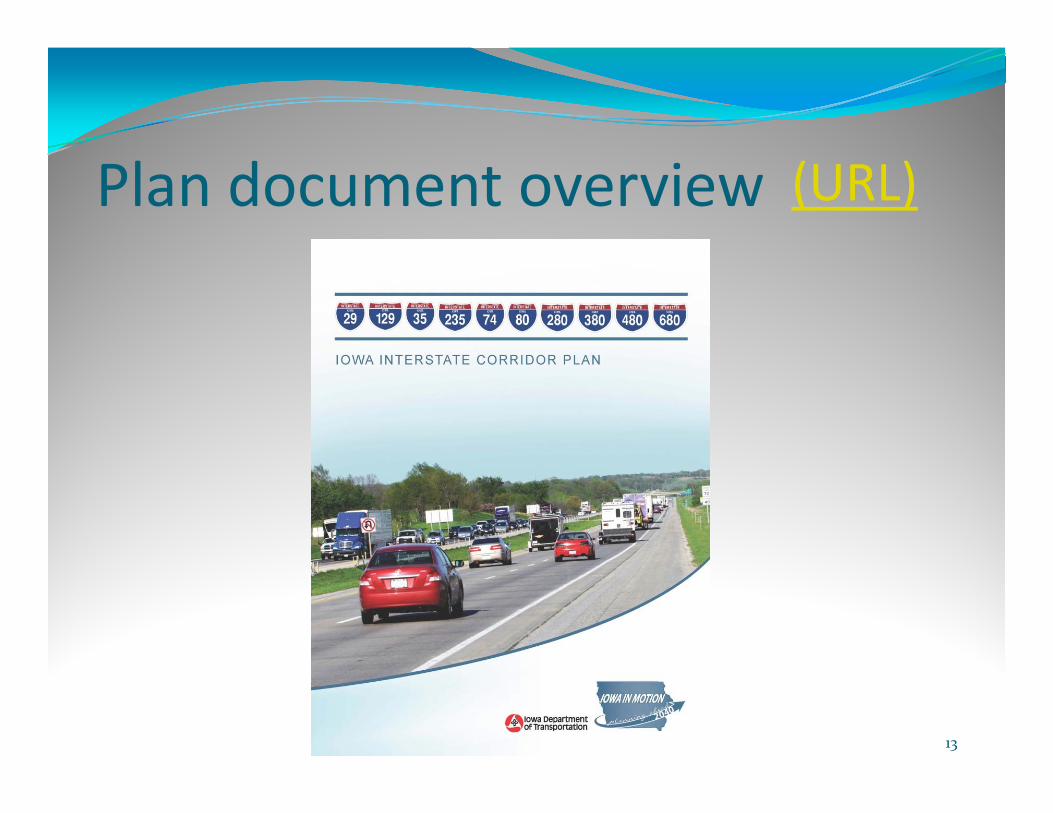
Plan document overview
13
(URL)
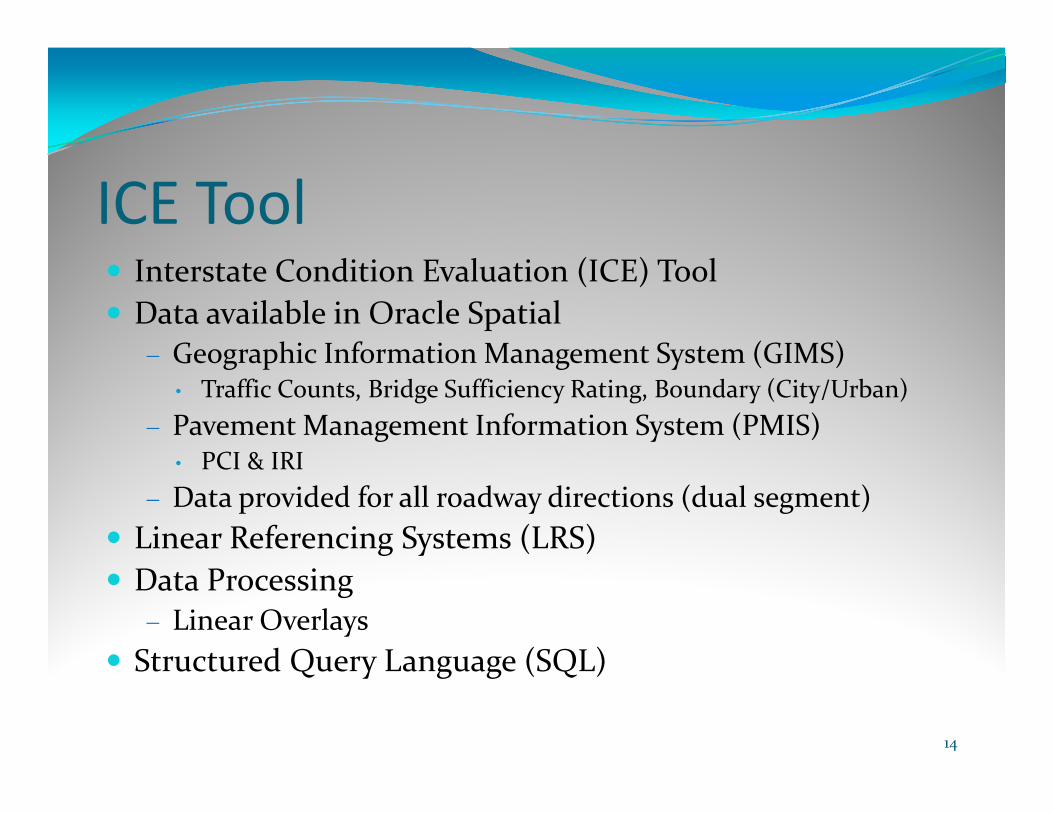
ICE Tool Interstate Condition Evaluation (ICE) Tool Data available in Oracle Spatial
Geographic Information Management System (GIMS)• Traffic Counts, Bridge Sufficiency Rating, Boundary (City/Urban)
Pavement Management Information System (PMIS)• PCI & IRI
Data provided for all roadway directions (dual segment) Linear Referencing Systems (LRS) Data Processing
Linear Overlays Structured Query Language (SQL)
14

Linear Referencing System (LRS)A set of procedures and methods for specifying a location as a distance, or offset, along a linear feature, from a point with a known location
Iowa LRS also has a time (temporal) component.
15

Linear Overlay Functions
16

SQL 101
17

ICE Data Summary 4,768 records Segment lengths range from 0.008 mile (42.5’) to 5 miles Bridge Sufficiency Ratings
Processed to ICE geometry using GIS spatial procedures in GeoMedia
On Interstate Structures – no overpasses Weighted rating based on structure length Segments w/o bridges given a normalized value of 10
Supplemental data in web‐map Crash data, 5‐Year program projects, SD/FO structures
18
Mapping
19
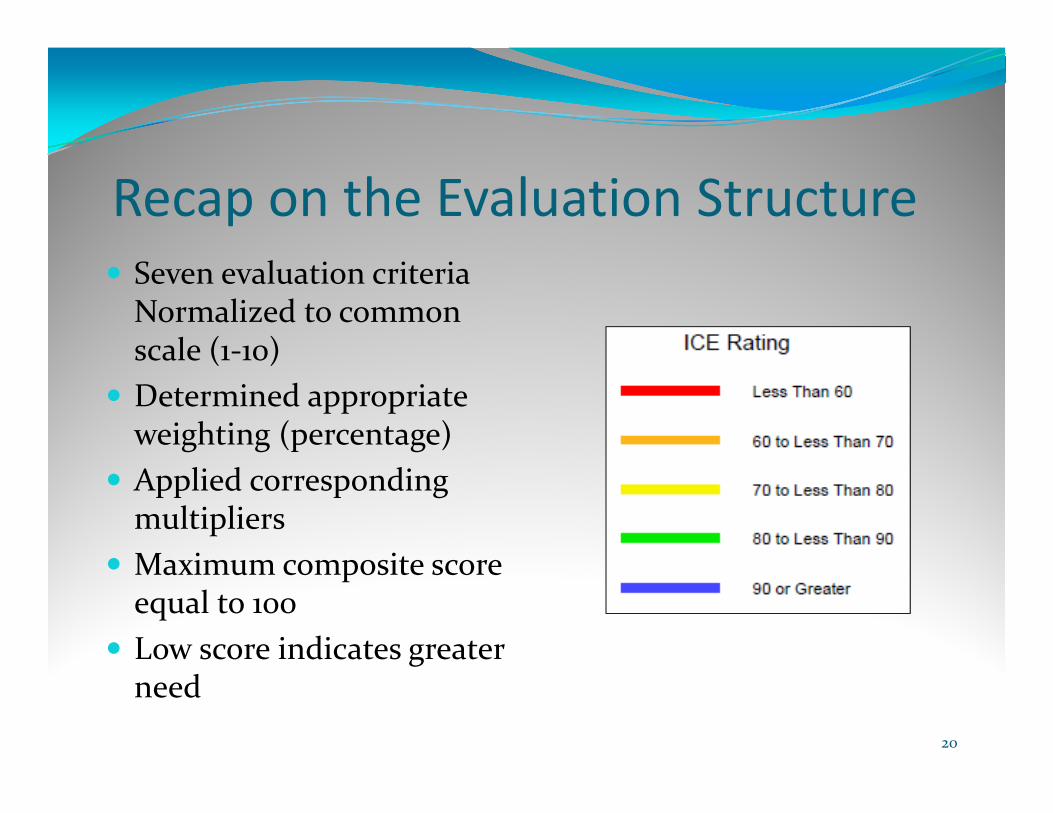
Recap on the Evaluation Structure Seven evaluation criteria Normalized to common scale (1‐10)
Determined appropriate weighting (percentage)
Applied corresponding multipliers
Maximum composite score equal to 100
Low score indicates greater need
20

21

ICE Demo(click)
22

Next Steps Lessons learned Linear Overlay rerun:
Included the full Primary System Developed a list of corridors defined by natural breaks in the Iowa
roadway network Update the Web Map on the GIS portal Stakeholder outreach at the DOT Update the 2013 ICE Plan Document
Yearly report Forecast future conditions
Integrate ICE Analysis with Iowa Statewide Travel Demand Model Apply deterioration factors to road assets including highway
pavement and structures.
23

24
25

Questions?Adam Shell
Office of Systems [email protected]
515‐239‐1221
Kyle BarichelloOffice of Systems Planning
[email protected]‐233‐7767
26