office policy space use review
TRANSCRIPT

U.S. GeneralServicesAdministration
Office ofGovernmentwidePolicy
Am or PatriaeDucit
Office of Real Property
OfficeSpace UseReviewCurrent Practices and Emerging Trends

Office Space Use ReviewCurrent Practices and Emerging Trends
U.S. General Services AdministrationOffice of Governmentwide Policy
Office of Real PropertyWashington, DC
September 30, 1997

ii
Th e Off ice of Governmentw ide Policy is pleased to issue the OfficeSpace Use Review: Current Practices and Emerging Trends. I think you willfind that it contains valuable data and practical advice pertinent to all real
property professionals.
The review was undertaken in response to an Office of Management and Budgetrequest for follow-on actions to implement the Federal Real Property AssetManagement Principles. In an effort to improve the use of office space by Federalagencies, the Office of Real Property conducted an extensive review of spacemanagement priorities and practices prevalent in the private and public sectors. Thereview provides findings and recommendations as to how best practices may be usedwithin the Federal community. The review breaks new ground for the Federal sectorby emphasizing flexibility, individual agency responsibility, strategic planning for realproperty needs and an overall average utilization rate measured in private sectorterms.
I want to recognize David Bibb whose Office of Real Property spearheaded thisreview. Under the leadership of Marjorie Lomax, the Evaluation and OutreachDivision assumed responsibility for the planning and completion of this importanteffort. Sandy Brooks and Stan Kaczmarczyk researched, analyzed and wrote thereport.
Most importantly, I would like to acknowledge and extend my appreciation to thosewho assisted in our review with special thanks to Lucent Technologies, Australia'sDepartment of Administrative Services, Canada's Public Works and GovernmentServices, and Alberta Public Works, Supply and Services for outstanding contributions.Please know that you have played an important part in our endeavors to improveFederal asset management by recognizing and sharing best practices and policies.
G. Martin WagnerAssociate Administrator Office of Governmentwide PolicyU.S. General Services Administration
iii
Foreword

iv

Executive Summary . . . . . . . . . . . . . . . . . . . . . . . . . . . . . . . . . . . . . . . vii
Introduction . . . . . . . . . . . . . . . . . . . . . . . . . . . . . . . . . . . . . . . . . . . . . . 1
Findings . . . . . . . . . . . . . . . . . . . . . . . . . . . . . . . . . . . . . . . . . . . . . . . . . 3
Recommendations . . . . . . . . . . . . . . . . . . . . . . . . . . . . . . . . . . . . . . . . 15
Next Steps. . . . . . . . . . . . . . . . . . . . . . . . . . . . . . . . . . . . . . . . . . . . . . . 26
Research . . . . . . . . . . . . . . . . . . . . . . . . . . . . . . . . . . . . . . . . . . . . . . . . 27
Policies, Practices and Background Information . . . . . . . . . . . . . . . . . . . . 27
FPMR Temporary Regulation D-76 . . . . . . . . . . . . . . . . . . . . . . . . . . . . . . . . 27PBS Space Assignment Data . . . . . . . . . . . . . . . . . . . . . . . . . . . . . . . . . . . . . 281997 BOMA Experience Exchange Report . . . . . . . . . . . . . . . . . . . . . . . . . . 281996 National Summit on Building Performance . . . . . . . . . . . . . . . . . . . . . 31Benchmarking Occupancy Cost in the Private Sector. . . . . . . . . . . . . . . . . . 31Alternative Office Solutions . . . . . . . . . . . . . . . . . . . . . . . . . . . . . . . . . . . . . 32Space Use Trends in the Private Sector . . . . . . . . . . . . . . . . . . . . . . . . . . . . 33Institute of Real Estate Management . . . . . . . . . . . . . . . . . . . . . . . . . . . . . . 34Sydney,Australia, Private Sector Office Market . . . . . . . . . . . . . . . . . . . . . . . 36FM DATA Monthly: Kraft Foods, Inc. . . . . . . . . . . . . . . . . . . . . . . . . . . . . . . 37FM DATA Monthly: J.P. Morgan . . . . . . . . . . . . . . . . . . . . . . . . . . . . . . . . . . 37FM DATA Monthly: Steelcase, Inc.’s Top Ten Telecommuting Tips . . . . . . . . . 37PBS Office of Portfolio Management FORM Report . . . . . . . . . . . . . . . . . . . 38International Centre for Facilities. . . . . . . . . . . . . . . . . . . . . . . . . . . . . . . . . 38City of Philadelphia, PA . . . . . . . . . . . . . . . . . . . . . . . . . . . . . . . . . . . . . . . . 39
v
Table of Contents
Private Sector . . . . . . . . . . . . . . . . . . . . . . . . . . . . . . . . . . . . . . . . . . . . . . . 40
AT&T . . . . . . . . . . . . . . . . . . . . . . . . . . . . . . . . . . . . . . . . . . . . . . . . . . . . . 40IBM. . . . . . . . . . . . . . . . . . . . . . . . . . . . . . . . . . . . . . . . . . . . . . . . . . . . . . . 40Lucent Technologies . . . . . . . . . . . . . . . . . . . . . . . . . . . . . . . . . . . . . . . . . . 41Wausau Insurance . . . . . . . . . . . . . . . . . . . . . . . . . . . . . . . . . . . . . . . . . . . . 44Eastman Kodak . . . . . . . . . . . . . . . . . . . . . . . . . . . . . . . . . . . . . . . . . . . . . . 45Mobil Corporation . . . . . . . . . . . . . . . . . . . . . . . . . . . . . . . . . . . . . . . . . . . . 45The Dun & Bradstreet Corporation . . . . . . . . . . . . . . . . . . . . . . . . . . . . . . . 47Northrop Grumman Corp.. . . . . . . . . . . . . . . . . . . . . . . . . . . . . . . . . . . . . . 47Intel Corporation. . . . . . . . . . . . . . . . . . . . . . . . . . . . . . . . . . . . . . . . . . . . . 47Sandia National Laboratories . . . . . . . . . . . . . . . . . . . . . . . . . . . . . . . . . . . . 48
States . . . . . . . . . . . . . . . . . . . . . . . . . . . . . . . . . . . . . . . . . . . . . . . . . . . . . . 49
New York . . . . . . . . . . . . . . . . . . . . . . . . . . . . . . . . . . . . . . . . . . . . . . . . . . 49California. . . . . . . . . . . . . . . . . . . . . . . . . . . . . . . . . . . . . . . . . . . . . . . . . . . 49Virginia . . . . . . . . . . . . . . . . . . . . . . . . . . . . . . . . . . . . . . . . . . . . . . . . . . . . 50Texas. . . . . . . . . . . . . . . . . . . . . . . . . . . . . . . . . . . . . . . . . . . . . . . . . . . . . . 51Colorado . . . . . . . . . . . . . . . . . . . . . . . . . . . . . . . . . . . . . . . . . . . . . . . . . . . 51Florida. . . . . . . . . . . . . . . . . . . . . . . . . . . . . . . . . . . . . . . . . . . . . . . . . . . . . 52North Carolina . . . . . . . . . . . . . . . . . . . . . . . . . . . . . . . . . . . . . . . . . . . . . . 53Oregon . . . . . . . . . . . . . . . . . . . . . . . . . . . . . . . . . . . . . . . . . . . . . . . . . . . . 53Minnesota . . . . . . . . . . . . . . . . . . . . . . . . . . . . . . . . . . . . . . . . . . . . . . . . . . 54Missouri . . . . . . . . . . . . . . . . . . . . . . . . . . . . . . . . . . . . . . . . . . . . . . . . . . . 56
Governments . . . . . . . . . . . . . . . . . . . . . . . . . . . . . . . . . . . . . . . . . . . . . . . 56
Canada . . . . . . . . . . . . . . . . . . . . . . . . . . . . . . . . . . . . . . . . . . . . . . . . . . . . 56Australia . . . . . . . . . . . . . . . . . . . . . . . . . . . . . . . . . . . . . . . . . . . . . . . . . . . 60United Kingdom . . . . . . . . . . . . . . . . . . . . . . . . . . . . . . . . . . . . . . . . . . . . . 62Netherlands. . . . . . . . . . . . . . . . . . . . . . . . . . . . . . . . . . . . . . . . . . . . . . . . . 63Alberta, Canada . . . . . . . . . . . . . . . . . . . . . . . . . . . . . . . . . . . . . . . . . . . . . . 64
Federal Agencies . . . . . . . . . . . . . . . . . . . . . . . . . . . . . . . . . . . . . . . . . . . . . 66
United States Postal Service . . . . . . . . . . . . . . . . . . . . . . . . . . . . . . . . . . . . . 66Tennessee Valley Authority. . . . . . . . . . . . . . . . . . . . . . . . . . . . . . . . . . . . . . 66National Aeronautics and Space Administration . . . . . . . . . . . . . . . . . . . . . . 67Department of Commerce . . . . . . . . . . . . . . . . . . . . . . . . . . . . . . . . . . . . . . 67Internal Revenue Service . . . . . . . . . . . . . . . . . . . . . . . . . . . . . . . . . . . . . . . 68
References . . . . . . . . . . . . . . . . . . . . . . . . . . . . . . . . . . . . . . . . . . . . . . 69
vi
As a result of the National Performance Review, the General ServicesAdministration (GSA), Office of Governmentwide Policy, Office of RealProperty, using collaboration, partnering and customer involvement, developed
the Federal Real Property Asset Management Principles. As a follow-on action, the Officeof Management and Budget (OMB), in its FY98 budget passback, requested that GSAdevelop guidance and best practices to implement these principles.
The following factors support a review of the office workplace and how to improveits use:
• OMB’s request (as part of the passback) for the development of space standards
• Past regulatory attempts to control space use
• Government reengineering and downsizing efforts
• The President's Management Council’s National Telecommuting Initiative
• The Administration’s Family Friendly Work Arrangement Initiative
• Rapid changes in technology
• The need for improved customer service
The workplace is rapidly changing:
• A Department of Agriculture employee was able to maintain her job in Ohio andstay with her family....in a rural town in France.
• Federal Railroad Administration safety inspectors more efficiently cover theirterritories by working full-time out of their homes.
• GSA’s Northwest Arctic Region offers hotelling workstations to GSA and otherFederal agency employees on a daily reservation basis.
Our intention was to not only satisfy OMB’s request, but to reach a wider audience byreviewing space use practices for purposes of improving and promoting the efficientand optimum use of office space by Federal agencies. A literature review wascompleted to identify available reports, articles, policy documents and otherinformation on space management in the public and private sectors. Both traditionalapproaches and Internet research were used in the review. We made telephone calls,held personal meetings, and used electronic mail to consult with professionals andidentify practices and priorities prevalent in the private sector, other governments,and other landholding Federal agencies. The results of this review are presented inthis report.
vii
Executive Summary

The Finding s are:
1) The workplace is changing, and evaluating space use is more complexas a result. The Office of Management and Budget (OMB) asked our office todevelop “utilization standards for various uses of building space, such as officespace, storage, laboratory space, etc.” Although all organizations look at somekind of utilization rate as a target or benchmark, a utilization rate is anoversimplified way of looking at space use. Our review addressed the spirit ofOMB’s request by focusing on overall space, and went beyond the issue ofutilization rates to address larger workplace and management issues. From astrategic planning standpoint, and in consideration of the fundamental changesin the ways that people work, we recommend that customer agencies not relytotally on utilization rate but consider additional measures such as cost peremployee housed, whether in an office environment, working at home, or anyother arrangement.
2) All organizations look at some type of square feet per person measure.Both government and private sector organizations pay attention to efficiencymeasures based on square feet per person. Utilization rate remains a commonsense space use measure in a traditional office setting, despite the measure’sdrawbacks. Some organizations use an overall square foot per person number asa planning guide. Most organizations set space use standards according to jobfunction or rank. Private sector organizations pay attention to utilization rate butalso look at measures such as cost per person and cost per square foot.
3) The appropriate U.S. Government average for space use is 200 usablesquare feet per person, as compared to the U.S. private sector average of250 usable square feet per person. Based on the historical trend in theBOMA experience data, our analyses of the PBS inventory and leaseprospectuses, and the benchmark data, we believe that this average isappropriate and typical for Federal space use in office type buildings. The 200usable square feet per person average refers to total space (office plus associatedstorage and special space).
4) Federal agencies could use additional incentives to improve or reducespace use. The downsizing of the Federal workforce has not resulted in aproportionate reduction in office space. We believe that downsizing, combinedwith the trend towards alternative workplaces, must eventually lead to somespace reduction. We would like to see an improved incentive structure forFederal agencies so that it can happen. While profit and loss are motivatingfactors for the private sector, Federal agencies lack similar incentives to improvereal property asset management.
viii
5) Our space use review, advocacy of an overall average utilization rate,and broadening of space use evaluation beyond utilization rate to othertypes of performance measures can add value by increasing Federalagencies’ strategic focus on space use issues. We feel there is value inbringing key issues to Federal agencies’attention, encouraging the incorporationof space use objectives into the strategic planning process, measuring space useperformance and letting agencies manage accordingly. Each agency shouldmeasure and control its space use as a responsible manager of taxpayer funds.
The Recommendations are:
1) Stay current with the latest trends and best practices in spacemanagement. Space is the second largest administrative cost after personnel.Agencies can no longer afford to treat the cost of space as a pass through item inthe budget. A fundamental change in thinking has occurred due to the NationalPerformance Review and the Government Performance and Results Act.Agencies must be accountable for their expenditures, including those made onreal property. GSA must be a leader and source of best practices, and must notuse its regulatory role as an obstacle. Agencies should look to best practices forguidance and support when undertaking their real property operations.
2) Agency strategic plans should focus on mission but not overlookadministrative costs such as real property. We recommend that agenciesuse planning and measurement to manage their real property use and costs.GSA can help by providing sensible standards, guidelines, and measures used inthe public and private sectors. Each agency’s space needs and space portfolioare ultimately unique and mission-specific, so each agency should compare itselfto the common standards and track its own unique space use and costs. Ifagencies understand that real property costs can be managed, the overall savingsmay provide some fiscal relief in a tight budgetary environment.
3) Utilization rate should be managed at the agency level in the strategicplanning process. In our Space Use Review, we have advocated a moreflexible, strategic and comprehensive approach to space management.Considering the continuous evolution of the workplace, a return to the D-76“building block” approach to space utilization or to tracking utilization ratesthrough Form 3530 is inappropriate. In the spirit of the National PerformanceReview, we recommend that agencies be empowered to manage their own spaceuse through the strategic planning process. In return, the Office of RealProperty will commit itself to an ongoing educational effort to identify anddisseminate best practices in space management.
ix

The Next Steps are:
1) The Office of Real Property’s Governmentwide Performance MeasurementInitiative, already underway, will collaboratively identify a comprehensive indexof measures and establish a baseline for annual measurement and improvement.
2) The Office of Real Property will assume an increased leadership role in the areaof alternative workplaces through the establishment of a new WorklifeEnterprises division.
3) GSA will explore ways to encourage agency planning for administrative costs,such as an appendix to the mission-focused strategic plan.
Finally, the Research section contains useful information beyond what the reader willencounter in the findings and recommendations. We encourage readers to takeadvantage of our research with private sector contacts, state governments, othernational governments, and professional trade organizations, as well as the latestinformation in professional journals and on the Internet.
x

I n 1 9 9 3 , th e National Performance Review (NPR) recommended thatthe Administrator of General Services develop asset management principles toguide the Federal Government’s real property ownership enterprise. In
response to the recommendation of the NPR, the General Services Administration(GSA), Office of Governmentwide Policy, Office of Real Property, using collaboration,partnering and customer involvement, developed a set of goals and principles formanagement of the Federal real property portfolio.
Issued in October 1996, the Federal Real Property Asset Management Principles serveas a guide and a frame of reference for making sound real property decisions. Theypromote lower costs, incentives to improve property management, and improvedefficiency and performance of real property. As a follow-on action, the Office ofManagement and Budget (OMB), in its fiscal year 1998 budget passback, requestedthat GSA develop guidance and best practices to implement these principles bySeptember 30, 1997. In particular, OMB requested that GSA, using the sameinteragency collaborative approach, develop guidance on “utilization standards forvarious uses of building space, such as office space, storage, laboratory space, etc.”
Since the early 1980’s, there have been several attempts to regulate office utilizationrates and establish reporting requirements. For various reasons, all have beenproblematic. Pursuant to Temporary Regulation D-75, GSA and OMB attempts to trackoffice utilization rates through the Work Space Management Plan and BudgetJustification (GSA Form 3530) have been frustrated by both the inability andreluctance of agencies to provide data. Temporary Regulation D-76 set standards for asubset of office space only. There has been concern that classification of generalpurpose office space as office, storage and special, with standards only for office, hasled to inconsistent application and the use of the storage and special categories toobtain additional “office” space.
We have attempted to satisfy the spirit of OMB’s request through the verification ofan overall average for space use in a traditional office building setting. We alsowanted to prepare a review of best practices and emerging trends in space use thatwould be of value to all Federal landholding agencies. In doing so, we identified amore significant issue than utilization rates––the radical and rapid transformation ofthe workplace beyond the traditional office building setting.
Consistent with the vision of the President's Management Council’s NationalTelecommuting Initiative, the workplace of tomorrow will no longer be the traditionalworkplace of today. The need to be competitive, to support new ways of working,and to keep a skilled work force will require flexibility. Technology has made itpossible, and a growing consensus in society that work and home life have becomeunbalanced has made it desirable.
1
Introduction

To cite a few examples:
• The Defense Investigative Service established a Work-From-Domicile programheavily used by its investigators.
• The first U.S. General Store providing one-stop government services recentlyopened in Houston.
• GSA’s Federal Supply Service employs virtual officing in implementing its qualityassurance programs.
The recent movement to reengineer and downsize has resulted in a more business-like, customer-oriented Federal Government. This situation has provided us with anopportunity to achieve improvements in productivity, employee morale, and spaceefficiency through the use of alternative work strategies.
This report summarizes many months of research, analysis and discussions. InFebruary 1997, we began a literature review to identify available reports, articles,policy documents and other information on space management in the public andprivate sectors. We used both traditional approaches and on-line search capabilities inthe review. In addition, we consulted with private industry (corporate America, tradeand professional associations), state and local governments, other Federal agenciesand other national governments, and the academic community to identify bestpractices and emerging trends. We obtained information and made contacts throughpersonal meetings, telephone interviews, fax, traditional mail, electronic mail, and anon-line Facilities Management conference. We present the results of our review in thisreport.
2
Finding #1 The workplace is changing, and evaluating space use ismore complex as a result.
Temporary Regulation D-76, which expired in November 1996, established a standardfor office space only of 125 occupiable square feet per person, plus up to 22 percentadditional support space. Although the regulation defined many categories of storageand special space, it did not specify utilization standards for different categories ofspace use beyond what GSA classified as “office.” At the same time, OMB and GSAattempted to track adherence to an outdated standard of 135 occupiable square feetper workstation through the Workspace Management Plan included in Form 3530,part of the annual budget submission process. While the 135 target was aGovernmentwide number, the D-76 standards applied to GSA space only.
The common flaw in each of these approaches is an overestimation of the value ofthe utilization rate (the amount of square feet of space allocated per person) as arelevant measure of the way people use space to work. Although all organizationslook at some kind of utilization rate as a target or benchmark, a utilization rate is anoversimplified way of looking at space use. There are many issues to consider whenusing utilization rates to evaluate current space:
3
Findings
• Agency-specific needs
• Accounting for all space users (full-time, part-time, contractors, shift work,vacancies, etc.)
• Space measurement methodology
• Actual cost of the space
• Age of facility
• Productivity and morale issues
• Cost of consolidation

4
In our research, we came across an excellent example of a national government thatlooked at space use in a more comprehensive way. Public Works and GovernmentServices Canada (PWGSC), the department responsible for the Canadian government’sgeneral purpose office accommodation and facilities, undertook a groundbreakinganalysis in 1994 to measure and report on the total and comparative use of officeaccommodation across the Canadian government. The analysis generated threemeasures of the office inventory: space per person (utilization rate), cost per squaremeter, and cost per person per annum. PWGSC benchmarked these numbers againstthe Canadian private sector, the U.S. private sector, and the U.S. government sector.(See the Research section for more details on this study.)
Although a study such as this is a marked improvement over simply tracking autilization rate, the way that people work is changing rapidly and inevitably due toimprovements in technology and evolving attitudes about work and society. Thismeans that we need to be even smarter about how we measure and evaluate spaceuse in a world where an employee, a workstation, and a piece of office real estate areno longer a discrete, interconnected unit of productivity.
Consider just a few examples of the rapid changes in the way that peoplework (see sidebar on opposite page).
If we were to replicate the Canadian government study today, we would have toadjust the way that we calculate the three performance measures in order to accountfor and make sense of the changing work environment:
Space per person: As a measure of space efficiency in an office building environmentonly, we would need to be sure that the denominator consists of only thoseemployees who have a full-time need for a workstation in an office buildingenvironment. If we divided by total employment, the utilization rate would be
From a strategic planning standpoint, we recommend that customer agencies not relytotally on utilization rate but consider a range of measures such as:
• Total cost per employee
• Total occupancy cost per square foot
• Real property cost as a percentage oftotal administrative budget
• Rental cost per square foot
• Operating costs per square foot
• Total square feet owned and leased
• Building efficiency ratio (net to gross)
• Ratio of shared space to dedicatedspace
• Increased use of alternative workenvironments
• Telecommuting cost versus realproperty cost
• Ratio of enclosed offices to open planworkstations
• Tenant satisfaction
• Vacant space
• Amount of space occupied bycontractors
• Track and eliminate redundantsupport spaces
• Churn rate and associated costs
• Number of remote versus non-remoteworkers
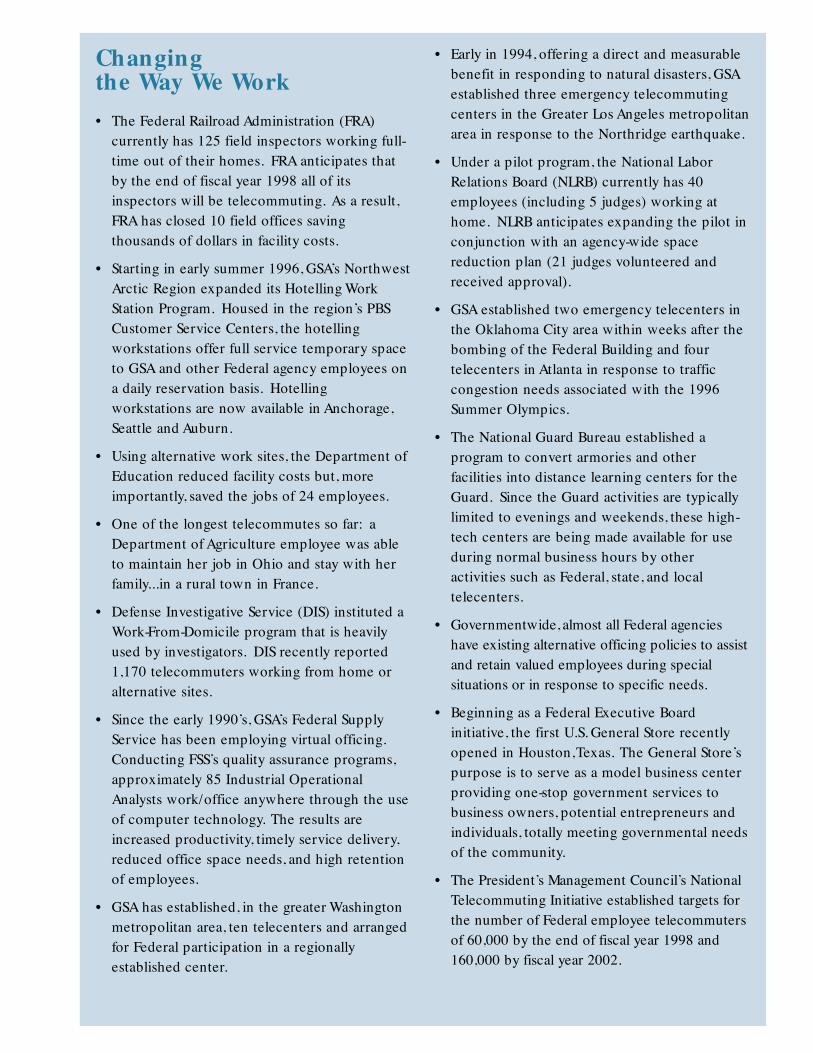
Changing the Way We Work• The Federal Railroad Administration (FRA)
currently has 125 field inspectors working full-time out of their homes. FRA anticipates thatby the end of fiscal year 1998 all of itsinspectors will be telecommuting. As a result,FRA has closed 10 field offices savingthousands of dollars in facility costs.
• Starting in early summer 1996, GSA’s NorthwestArctic Region expanded its Hotelling WorkStation Program. Housed in the region’s PBSCustomer Service Centers, the hotellingworkstations offer full service temporary spaceto GSA and other Federal agency employees ona daily reservation basis. Hotellingworkstations are now available in Anchorage,Seattle and Auburn.
• Using alternative work sites, the Department ofEducation reduced facility costs but, moreimportantly, saved the jobs of 24 employees.
• One of the longest telecommutes so far: aDepartment of Agriculture employee was ableto maintain her job in Ohio and stay with herfamily...in a rural town in France.
• Defense Investigative Service (DIS) instituted aWork-From-Domicile program that is heavilyused by investigators. DIS recently reported1,170 telecommuters working from home oralternative sites.
• Since the early 1990’s, GSA’s Federal SupplyService has been employing virtual officing.Conducting FSS’s quality assurance programs,approximately 85 Industrial OperationalAnalysts work/office anywhere through the useof computer technology. The results areincreased productivity, timely service delivery,reduced office space needs, and high retentionof employees.
• GSA has established, in the greater Washingtonmetropolitan area, ten telecenters and arrangedfor Federal participation in a regionallyestablished center.
• Early in 1994, offering a direct and measurablebenefit in responding to natural disasters, GSAestablished three emergency telecommutingcenters in the Greater Los Angeles metropolitanarea in response to the Northridge earthquake.
• Under a pilot program, the National LaborRelations Board (NLRB) currently has 40employees (including 5 judges) working athome. NLRB anticipates expanding the pilot inconjunction with an agency-wide spacereduction plan (21 judges volunteered andreceived approval).
• GSA established two emergency telecenters inthe Oklahoma City area within weeks after thebombing of the Federal Building and fourtelecenters in Atlanta in response to trafficcongestion needs associated with the 1996Summer Olympics.
• The National Guard Bureau established aprogram to convert armories and otherfacilities into distance learning centers for theGuard. Since the Guard activities are typicallylimited to evenings and weekends, these high-tech centers are being made available for useduring normal business hours by otheractivities such as Federal, state, and localtelecenters.
• Governmentwide, almost all Federal agencieshave existing alternative officing policies to assistand retain valued employees during specialsituations or in response to specific needs.
• Beginning as a Federal Executive Boardinitiative, the first U.S. General Store recentlyopened in Houston,Texas. The General Store’spurpose is to serve as a model business centerproviding one-stop government services tobusiness owners, potential entrepreneurs andindividuals, totally meeting governmental needsof the community.
• The President’s Management Council’s NationalTelecommuting Initiative established targets forthe number of Federal employee telecommutersof 60,000 by the end of fiscal year 1998 and160,000 by fiscal year 2002.
understated due to the fact that we included employees who do not need a full timeworkstation in the home office (teleworking) or who do not need space in the homeoffice at all (virtual officing).
Cost per square foot: Once again, this measure only provides useful informationabout space in office buildings; it ignores the costs of alternative officing.
Cost per person: In order for this number to make sense in the new environment,the numerator would have to include all costs associated with how people work. Thisincludes, not just the cost associated with office space, but costs associated withalternative work environments such as computers, facsimile machines, dedicatedtelephone lines, home office furniture, telecommuting centers, etc. In fact, when weconsider the wide range of costs associated with work environments outside of thetraditional office environment, we conclude that cost per person is probably the bestin ternal m easure of space use for these changing tim es.
Finding #2 All organizations look at some type of square feet perperson measure.
Both government and private sector organizations pay attention to efficiencymeasures based on square feet per person. Utilization rate remains a common sensespace use measure in a traditional office setting, despite the measure’s drawbacks(oversimplification, differing support and circulation needs, perception of anentitlement rather than a maximum allotment, differences in how space is measured,different functional requirements, space implications of alternative workenvironments). Some organizations use an overall square foot per person number asa planning guide. Most organizations set space use standards according to jobfunction or rank. Some organizations are starting to move away from the concept ofallocating space based on rank. This move towards egalitarianism in the workplacemay be driven more by economics and the teaming concept, rather than by anyattempt at “fairness.”
Private sector organizations pay attention to utilization rate but also look at measuressuch as cost per person and cost per square foot. These cost-based measures aredifficult to translate into equivalent measures for the government sector. In theprivate sector, every cost has a directly measurable effect on the bottom line.Increased cost may even be acceptable if it can be directly linked to increasedproductivity and greater profits. One cost measure that may be useful to thegovernment sector is space cost as a percentage of total revenue. Federal agenciescould measure space cost as a percentage of the total administrative budget. Anagency could use this measure to track performance in its strategic planning process.However, an agency should use caution when comparing this number to otheragencies or to private sector firms.
Although everyone looks at some type of square foot per person measure, there is nouniform approach. Comparing standards across organizations is difficult withoutmaking numerous confusing adjustments.
6

• Different ways of measuring usablesquare feet
• Different ways of handling supportand circulation space
• Differences in job classification
• Differences in rank or grade scales
• Global approaches versus buildingblock approaches
7
For example, we collected information from 10 State governments. However, theapproach to space standards varies widely and the data do not lend themselves easilyto tabulation. What the State government space standards have in common is:
• All of the States in our sample express their space standards in terms of square feetper person.
• Almost all of the States have individual standards by job category. Rank or gradeoften counts when it comes to allocating space.
In spite of these problems, we were able to make some generalizations and drawsome meaningful comparisons based on our research.
One point to keep in mind when reviewing the space use data is the differencebetween standards and actual performance. Standards are useful for planning newspace assignments, but they may be difficult to apply to existing ones, particularly inolder buildings. In our research, we came across examples where an organization’sactual utilization rate exceeded the target utilization rate cited in its space standards.We discuss the Federal government’s utilization rate in terms of an average orstandard for comparison. The measurement of actual utilization can be expensive andtime consuming. As with any performance measure, an organization should be certainthat the information to be obtained will be useful and relevant enough to warrant thetime and expense of collecting it.
Space standards based on square feet per person are usually flexible. Individualfunctional elements have particular needs that are not always envisioned by even themost elaborate set of standards. Perhaps the real test of an organization that is seriousabout controlling space use is not the strictness of the actual standards, but thediscipline with which they are enforced when individual space requests exceedthem.
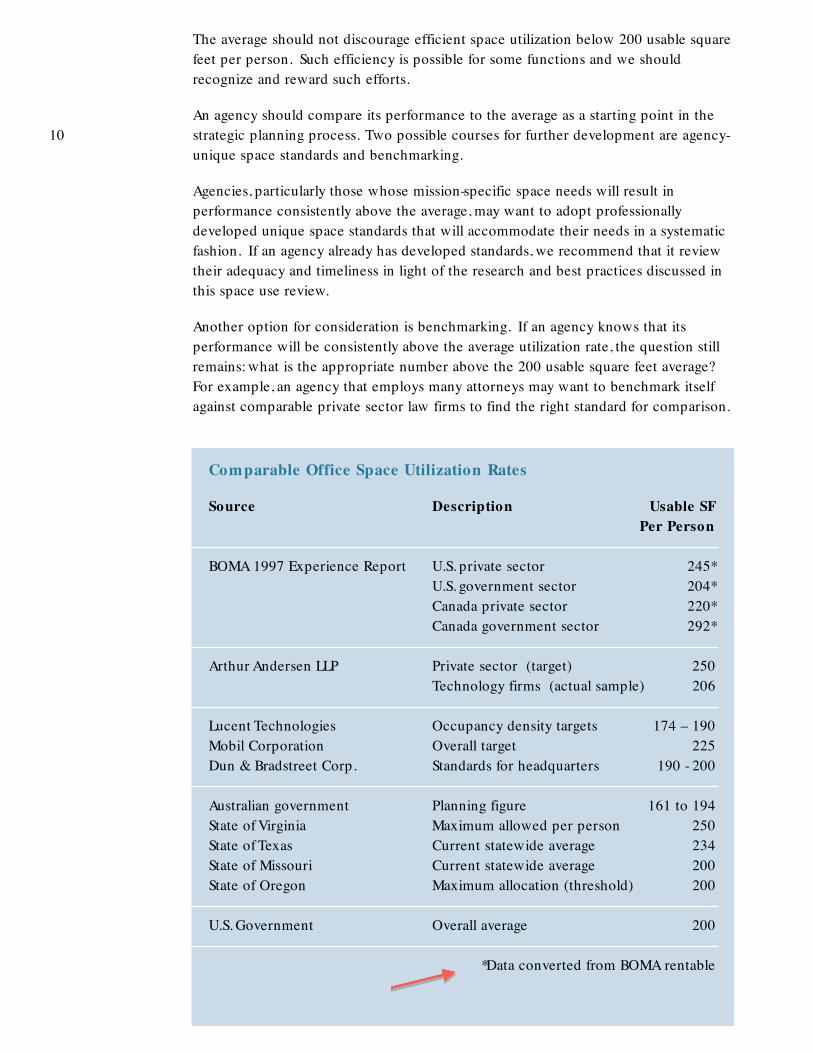
Finding #3 The appropriate U.S. Government average for space use is200 usable square feet per person, as compared to theU.S. private sector average of 250 usable square feet perperson.
We examined the utilization rate data in the BOMA Experience Exchange Reportsover the last five years. Please refer to the chart on page 9. We found that the privatesector office utilization rate is about 250 usable square feet per person for thisperiod, while the government sector office utilization rate is consistently in the rangeof about 200 usable square feet per person. Although the U.S. government sector isdefined by BOMA as including Federal, state and local governments, in practice many
Some of the reasons that the standards vary are:
of the government sector buildings in the reporting sample belong to GSA’s PublicBuildings Service (PBS). For example, in the most recent Experience ExchangeReport (1997), 185 out of 246 government buildings were PBS buildings.
The BOMA data represent a sample of the GSA office building inventory, which inturn represents only about 30 percent of the Governmentwide office buildinginventory. Based on this sample, however, we feel that Federal agencies should becommended for consistently achieving lower office utilization rates than the privatesector. From a theoretical perspective, we can quantify this achievement by pointingout that housing 1.8 million Federal employees at a rate of 200 rather than 250 usablesquare feet per person represents an annual savings of over $1.5 billion (assuming thedifference is in leased space averaging $17 per usable square foot).
Such a consistent and sizable difference between private and government sectorutilization rates cannot be explained by statistical anomalies alone. Although wecannot be sure of the explanation in the absence of detailed space planning studies,we can speculate (in consultation with BOMA personnel) as to some of the reasonswhy the private sector would use more space per person:
• Private offices for private sector executives are generally larger than offices for topgovernment officials. The culture of a larger and fancier office denoting morestatus still prevails throughout much of the private sector.
• Private sector firms may be more generous in providing conference rooms,especially firms with high customer or supplier contact.
• Motivations differ. In the government sector, space should be modest in order toconvey the proper sense of frugality to the customer (the public). In the privatesector, space must often convey a much different message to customers, a messageof prosperity and longevity. However, this cultural bias can be overcome in firmsfaced with the urgent need to cut costs.
Having established what seems to be a reliable figure for comparison, we examinedthe 200 usable square feet per person number to see if we could confirm it throughanalysis and benchmarking.
We examined PBS inventory data to see if a benchmark of 200 usable square feet perperson was a practical number. Our analysis started with the D-76 standards of 125occupiable (which is virtually identical to what we now call usable) square feet perperson, plus up to 22 percent for support space. We believe that these standardswere and still are valid. The challenge was to determine how much should be addedper person to yield an average allocation of storage and special space. In otherwords, what was the total space (office plus storage plus special) equivalent to the D-76 standards for office space alone? We calculated ratios of the different spacetypes as classified in the inventory, and we determined that the equivalent total spacenumber is around 185 usable square feet per person.
We also analyzed GSA lease prospectuses submitted to Congress during the fiscal year1996 and fiscal year 1997 cycles. We found that the proposed utilization rate for total
8

space for the sample as a whole was 181 usable square feet per person.
We benchmarked the number against those standards and actual utilization data thatyielded the best “apples to apples” comparisons. The table on page 10 presents thebenchmark data.
Based on the historical trend in the BOMA experience data, our analyses of the PBSinventory and lease prospectuses, and the benchmark data, we believe that theaverage of 200 usable square feet per person (office, storage and special) isappropriate and typical for Federal space use in office type buildings.
The following questions and answers explain exactly what we mean by “theappropriate average for Federal space use in office-type buildings is 200 usable squarefeet per person.”
What do we mean by “the appropriate average for Federal space use?”
In contrast to the D-76 approach of setting standards for “office” space but not for“storage”and “special” space, the average of 200 usable square feet per person appliesto total space in a traditional office building environment (office plus associatedstorage and special).
We want to move away from restrictive standards and provide flexibility within aframework of responsibility.
When planning new assignments, we encourage Federal agencies to accommodateuser needs within the framework of this average.
9
1 9 9 2 1 9 9 3 1 9 9 4 1 9 9 5 1 9 9 6
Private Government3 0 0
2 5 0
2 0 0
1 5 0
1 0 0
5 0
0
BOMA Utilization Rates
Note: Utilization rates expressed in terms of usable square feet perperson (converted from BOMA rentable)
The average should not discourage efficient space utilization below 200 usable squarefeet per person. Such efficiency is possible for some functions and we shouldrecognize and reward such efforts.
An agency should compare its performance to the average as a starting point in thestrategic planning process. Two possible courses for further development are agency-unique space standards and benchmarking.
Agencies, particularly those whose mission-specific space needs will result inperformance consistently above the average, may want to adopt professionallydeveloped unique space standards that will accommodate their needs in a systematicfashion. If an agency already has developed standards, we recommend that it reviewtheir adequacy and timeliness in light of the research and best practices discussed inthis space use review.
Another option for consideration is benchmarking. If an agency knows that itsperformance will be consistently above the average utilization rate, the question stillremains: what is the appropriate number above the 200 usable square feet average?For example, an agency that employs many attorneys may want to benchmark itselfagainst comparable private sector law firms to find the right standard for comparison.
10
Comparable Office Space Utilization Rates
Source Description Usable SFPer Person
BOMA 1997 Experience Report U.S. private sector 245*U.S. government sector 204*Canada private sector 220*Canada government sector 292*
Arthur Andersen LLP Private sector (target) 250Technology firms (actual sample) 206
Lucent Technologies Occupancy density targets 174 – 190Mobil Corporation Overall target 225Dun & Bradstreet Corp. Standards for headquarters 190 - 200
Australian government Planning figure 161 to 194State of Virginia Maximum allowed per person 250State of Texas Current statewide average 234State of Missouri Current statewide average 200State of Oregon Maximum allocation (threshold) 200
U.S. Government Overall average 200
*Data converted from BOMA rentable

Looking at the issue from the other side, an agency that may be consistently belowthe average should also benchmark to ascertain the right standard for comparison.For example, an agency that processes a lot of paperwork might benchmark againstan insurance company that processes a high volume of claims.
What do we mean by “office-type buildings?”
GSA formerly established a standard for primary office work area of 125 occupiablesquare feet per person, with up to 22 percent added for support space (for a possiblemaximum overall office allocation of 153 occupiable square feet). Office spaceassignments also included space classified as storage space and special space. Therewere no standards for the latter two categories; subsequently a lot of time and effortwent into arguing the merits of every single space request (particularly at theprospectus level).
Our review did not find examples of other organizations that divided an overall officespace assignment into office, storage and special. Office space is office space. Theidentified average covers all space in an office-type building formerly classified under theFederal Property Management Regulations (FPMR) as office, general storage, and special.
In other words, we are referring to a traditional office environment with associatedgeneral storage and special areas. We are excluding inside parking and warehousespace (formerly classified under the FPMR as ST-2 and ST-3). Buildings that areprimarily special in nature, such as warehouses, laboratories, border stations andcourthouses, are excluded.
What is the definition of “usable square feet?”
GSA’s Public Buildings Service recognizes the ANSI/BOMA (Z65.1-1996) standarddefinition of usable square feet. Generally speaking, the usable area is where a tenantnormally houses personnel and/or furniture. Consult the ANSI/BOMA standard fordetailed information on the measurement of usable versus rentable space.
What is the definition of “per person?”
FPMR Temporary Regulation D-76 defined personnel for the purposes of calculatingutilization rates as the peak number of persons to be housed during a single 8-hourshift, which included permanent employees of the agency, temporaries, part-time,seasonal, contractors, budgeted vacancies, and employees of other agencies andorganizations who are housed in the space assignment. This definition is still relevant.
One final note about benchmarking: some of the major corporations we spoke withreported relatively aggressive space standards (although, at least in once case, actualutilization exceeded the standards). Big corporations have the advantages of marketclout and a tight span of control. Although on the surface some may be tempted tocompare the Federal government with a major corporation due to its size, in realityour culture is more decentralized agency by agency. We are actually a collection ofsmaller and different Federal governments and may compare more appropriately tosmaller corporations.
11

While the private sector often looks at space cost measures with an eye towards costreduction, in some cases the reduction is accomplished by locating “back office”functions in low cost areas away from high cost urban or Central Business Districtenvironments. This leads to lower cost, but not necessarily due to less space perperson. This option is not readily available for Federal agencies that are directed bypolicy to be located in downtown urban areas. The result is a relatively greaterproportion of assignments in older buildings with less efficient, smaller floor plates.
Finding #4 Federal agencies could use additional incentives toimprove or reduce space use.
The downsizing of the Federal workforce has not resulted in a proportionatereduction in office space for the Government as a whole. The following data from theWorldwide Inventory indicates a flat office space inventory:
Fiscal Year Office Space (GSF) Decrease (percent)
1993 674,000,000 n/a
1994 674,000,000 0.0
1995 668,000,000 0.1
1996 662,000,000 0.1
There are many issues to consider concerning downsizing. There will always be atime lag involved. Space does not disappear overnight. Organizations downsize inpockets of space here and there. Taking advantage of those pockets means movingpeople around and consolidating facilities. That costs money. Also, lease expirationdates must be favorable to such plans.
While there are many explanations as to why it hasn’t happened quickly, there aresome possible reasons why it may not happen at all:
• Agencies may be holding on to space, especially owned space, in the event it maybe needed at some future date.
• Agencies may be holding on to space because they do not receive any proceeds orbenefits from disposal.
• Agencies may simply be using more space per person, as it becomes available.
• Government data on space utilization is not current or reliable; updating it couldbe expensive.
• Space may sit vacant or be occupied by contractors working in place of thedownsized employees.
• Agencies are not taking appropriate measures to reduce office space such asintroducing a space-sharing program consistent with its number of teleworkers.
We believe that downsizing, combined with the trend towards alternative workplaces,must eventually lead to some space reduction. We would like to see an improvedincentive structure for Federal agencies so that it can happen.
12
While profit and loss are motivating factors for the private sector, Federal agencieslack similar incentives to improve real property asset management. Under existingprovisions of law, most Federal landholding agencies are prohibited from retainingproceeds from the disposal and outleasing of real property. In addition, agency realproperty professionals may not believe there is any benefit from savings realized froma reduction in use, particularly if the payback is not immediate. These factors,coupled with the tacit belief that an agency’s budget will be reduced by the amountof money not spent, create a reduced incentive.
GSA continues to promote legislation that would allow agencies to share in theproceeds from the disposal and outleasing of real property. Enactment of suchlegislation would provide much needed business-like incentives to improve assetmanagement and assist agencies in times of budgetary constraints.
Agencies receive appropriated funds based on estimated space needs. If less spacethan anticipated is used, agencies may feel like they cannot use the savings for otherpurposes such as program or personnel costs. Consequently, agency space costs areconsidered a pass through expense. There is in reality more flexibility in the processthan some of us may realize. Perhaps the key is greater coordination between realproperty and budget personnel.
One approach to creating additional incentives would be to establish annual targets forutilization rates and cost per square foot. Based on authorized personnel levels, OMBand Congress could use these targets to “control”space use and associated costs. Thisapproach requires high commitment and centralized management. It is also an overlysimplistic approach that averages everything and disregards important issues such as:
13
• Different missions of Federal agencies
• Shift work
• Contractors working on site
• Geographic area
• General market conditions
• Employee morale
• Productivity
• Alternative officing strategies
This is an oversight and control approach that does not intrinsically motivate agenciesto improve their asset management and space utilization. It is also inconsistent withreinvented Government as envisioned by the National Performance Review.
Another approach would be for agencies to set space reduction objectives as part oftheir performance plans and the Government Performance and Results Act (GPRA)process. This approach is discussed in greater detail below under Recommendation #2.
Also worthy of consideration is a recent initiative conducted by Public Works andGovernment Service Canada (PWGSC), the Canadian equivalent of GSA. In responseto downsizing and a mandate to reduce space use by 10 percent over a five yearperiod, PWGSC used a spreadsheet analysis to establish customer-specific spacereduction targets. If a customer agency reduces space below the target, the agencyreceives the funds that PWGSC would have otherwise spent on the space. If theagency fails to achieve the target, it must reimburse PWGSC for the excess space.

Some agencies may have the will to reduce space but not the means. For example,agencies may identify opportunities to cancel leases, consolidate offices, andimplement alternative officing strategies, but may not have the money to make ithappen. Agencies should identify these opportunities and associated costs during thestrategic planning and budget formulation processes. A cost/benefit analysis will tellus if we need to “spend money to save money.”
Finding #5 Our space use review, advocacy of an overall averageutilization rate, and broadening of space use evaluationbeyond utilization rate to other types of performancemeasures can add value by increasing Federal agencies’strategic focus on space use issues.
We feel there is value in bringing key issues to Federal agencies’attention,encouraging the incorporation of space use objectives into the strategic planningprocess, measuring space use performance and letting agencies manage accordingly.Each agency should measure and control its space use as a responsible manager oftaxpayer funds. For example, agencies in Australia are responsible for annual strategicreal property plans.
As discussed in Finding #4, we believe that Federal agencies tend to incorrectly viewthe cost of space as just another line item request in their budget process. Ironically,Congress created the Federal Buildings Fund and required agencies to pay rent fortheir GSA space in the hope that some kind of market discipline would be imposedon the use of space. However, the treatment of funding for rental costs in the actualbudget process counteracts any motivational benefit that we might derive from a userpay system. We face the challenging task, in the absence of practical incentives, ofconvincing Federal agencies of the broader benefits of responsible spacemanagement.
14
RecommendationsRecommendation #1 Stay current with the latest trends and best
practices in space management.
Space is the second largest administrative cost after personnel (albeit a distantsecond). Agencies can no longer afford to treat the cost of space as a pass throughitem in the budget. A fundamental change in thinking has occurred due to theNational Performance Review and the Government Performance and Results Act.Agencies must be accountable for their expenditures, including those made on realproperty. GSA must be a leader and source of best practices, and must not use itsregulatory role as an obstacle.
Agencies should look to best practices for guidance and support when undertakingtheir real property operations. No single practice will be “best” for everyone. Thus,best practices are ideas that have worked well elsewhere and should be consideredwhen appropriate to an individual situation.
Using collaboration, partnering and customer involvement, the Office of Real Propertyworks with Federal agencies to provide them with policies and tools to promotegood asset management. We consult with other national governments, State and localgovernments, the private sector, professional associations, and the academiccommunity to ensure that the best practices and emerging trends of each areconsidered in the Federal arena.
In the following section, we present some best practices identified during the courseof the space use review. We recommend that you read the entire “Research” sectionfor more information and additional ideas and best practices.
Use alternative work strategies to improve productivity and/ or spaceefficiency.
The movement to reengineer and downsize is generating a need for alternativeofficing and new office environment solutions. This situation provides an opportunityfor organizations to maximize their business benefits by combining non-traditionalwork arrangements with non-traditional space arrangements. Alternative workstrategies (AWS) are techniques that reconsider the nature of the workplace and workprocesses in order to improve productivity and/or space efficiency. By focusing onplaces and their interaction with people and processes organizations can be moreproductive and improve the bottom line.
As suggested by Franklin Becker, a leading authority on workplace innovations, whenconsidering whether an AWS is suitable, careful consideration should be given to thenature of physical settings (where work is conducted); information technology (howinformation and ideas are accessed, processed and communicated); and work patterns
15

and processes (when and how tasks must be performed to achieve businessobjectives). It is rare that a single strategy will serve an entire organization. Differentbusiness areas may require different tools and perhaps different strategies. Many AWStechniques are technology-dependent and emphasize team-based work andcollaboration. For success, it is imperative to have collaborative input from end-usersduring both the design and implementation processes.
If you work in teams, plan space accordingly.
Organizations heading into the new millennium are relying increasingly onknowledge sharing and group-based work. Effective solutions for collaborative workare not likely to yield a single model, since needs are quite varied. Nor are they, inthemselves, likely to result in space savings. If anything, more space may be needed.For example, it may be more beneficial for workers involved in multiple cross-functional projects to have several small individual workspaces near other teammembers rather than a traditional office in their functional unit. The net effect ingroup-intense organizations is likely to be a reallocation of space from individual togroup uses. However, if having ample, well-organized space, including the possibilityof increased space, plays a vital role in increasing productivity and efficiency, theoutcome is likely to yield a greater return to the organization than direct savings onspace. Some team-based interaction strategies are discussed below:
Teaming requires flexible space that supports interactive collaborative workprocesses. Teaming environments tend to have fewer (and smaller) dedicatedworkspaces, with shared spaces for collaborative functions or activities. Theseenvironments encourage the exchange of ideas and communication. Teaming spacesshould be flexible and easy to reconfigure in order to adapt to changingrequirements. Most organizations or functional units within them are candidates forteaming.
Team Setting is a space designated as a group or teamwork environment, usually for aparticular project and a specified period of time. Staff often continues to have theirown workspace. Team settings are also known as neighborhoods or groupaddressing.
Activity Settings provide a variety of work settings to suit diverse individual or groupactivities such as desk work area, conference area, telephone work area, lounge area,etc. Facilities are available on a first-come, first-served basis. Activity settingsencourage interaction across departmental or functional boundaries.
The workplace is rapidly expanding beyond the boundaries of thetraditional office setting.
The need to be competitive, to support new structures and ways of working, and toattract and keep a skilled work force has also contributed to the development of theremote worker and alternative officing strategies. Remote workers include allemployees who spend some portion of their week away from the regular office. Thetwo most common remote workers are those who spend a significant amount of time
16

away from the office and generally work from multiple locations in a single day (mobileworkers), and those who normally would work in a central office but who instead workat home or in a center based site (telecommuters/teleworkers). Properly implemented,remote workers perform the primary portion of their job (intensive work) outside ofthe traditional office. The traditional office is more likely to be used for interactive orgroup type endeavors (meetings, interviews, and information sharing).
Coupled with the idea of remote work is the realization by organizations thateveryone does not need his or her own private assigned desk or office all the time.As a result, several strategies have evolved which center around the concept of acollection of work spaces (fewer than the number of potential occupants) notoccupied continuously by the same individual but used on an assigned, reserved, orfirst-come, first-served basis.
Free Address means multiple offices or workspaces shared by individuals on a first-come, first-served basis. Potential candidates for free addressing, also known asmotelling, spend a significant amount of time away from the office (for example, at aclient base or on the road) and are equipped with portable technology (laptop,portable printer, cellular modem and phone). These candidates may include sales,marketing, outreach, audit, inspectors, examiners, contractors and customer services.An organization can achieve significant savings by providing one workspace for every2 to 8 employees.
Hotelling refers to work space that is reserved on a first-call basis and not dedicatedto any specific worker beyond a specified occupation time. Most typically, a smallstaff will handle reservations, reprogram telephones and prepare the reserved spacefor occupancy. Hotelling can also include teaming and conference facilities, and issimilar to free addressing.
Virtual Office is a briefcase approach to the office. Employees have the freedom towork/office anywhere (home, car, plane, hotel) through the use of portabletechnology. Virtual office workers rarely require main office space. In the ultimatevirtual office scheme, workers have no assigned main office space. Potentialcandidates may include sales, legal, research, audit, investigators, inspection, andcustomer service functions.
Shared Space is when two or more employees share a single, assigned work spaceand work tools, either simultaneously or on different shifts/schedules. Telecommutersmost typically use shared space.
Teleworking/telecommuting is a combination of assigned off-site workspace andworkspace at the main office facility. Such off-site locations could include at homeaccommodations or remote telecenters. The teleworker generally works from thealternative site 2 to 3 days a week and is linked to the main office by various meanssuch as a desktop computer, fax and telephone. Many job functions lend themselvesto telecommuting. Participating occupations could include program analysts,engineers, accountants, administrative assistants, budget analysts, computer specialists,contract specialists, managers, management analysts, personnel specialists,
17
telecommunication specialists, scientists, and other occupations. Previously seen asan employee benefit, telecommuting viewed from a management perspective canmean fewer dollars for space and improved performance. By providing oneworkspace for every 3 to 5 telecommuters, space requirements can be reduced.
Telecenters are generally geographically convenient (located near where people live)facilities and have on-site managers. Centers can be an economical way to providesophisticated office technology (computers, high-speed printers, video conferencing)and administrative support not always available at a telecommuter’s home. By sharingfacility and overhead costs, participating organizations can minimize expenses.
Satellite Offices are remote facilities that are linked to the main facility by technologyand are generally located near employees and customers. Employees are assigned towork at the alternative site on a full-time basis. Although satellite offices may notreduce the amount of space needed, they do provide an excellent opportunity toimprove customer service and a firm may reduce the cost of space by moving to lessexpensive locations.
The ever-growing lexicon of remote work makes it a challenge to include and defineall terms precisely. For example, telecommuting and telework are synonymous. Manypeople prefer to use the term telework as it more directly implies working from aremote location. Telecommuting is sometimes viewed as just replacing the commute(therefore an employee rather than employer benefit). Non-territorial and virtualofficing typically refer to the mobile worker but these terms are also usedconceptually to include all forms of workspace sharing (hotelling, motelling, freeaddressing).
The private sector has taken the lead and stimulated interest in alternative workstrategies. Technology has made it possible, while a growing consensus in society thatwork and home life have become unbalanced has made it desirable. Alternativeofficing in the Federal sector, after a slow start, now seems to be accelerating. ThePresident's Management Council has established Governmentwide telecommuting(working in an environment outside of the traditional office) goals to accelerate thepace of change. The initial goal is to increase the number of Federal employeetelecommuters to 60,000 by the end of fiscal year 1998. This figure represents threepercent of the Federal civilian workforce and, while challenging, is a realistic targetgiven the number of agencies that have already established policies and programs.Viewed as part of an overall reinvention strategy, achieving this goal should helporganizations meet other requirements necessitated by agency streamlining such as theneed to reduce overhead costs and maintain program effectiveness with fewer staff.
Through the use of information technology organizations are becoming flexiblenetwork teams combining strategic goals with real property needs. Changes have tobe made carefully, and must be based on careful analysis of tasks, workflow,technology, and organizational priorities and goals. However, when found to beappropriate and properly implemented, alternative work strategies offer significantopportunities and benefits. The three most common areas in which benefits areachieved are employers, employees and society.
18
Benefits to Employer
Employer Productivity and Quality Gains: Based on studies and anecdotal evidence,productivity increases range from 10 to 40 percent. Although knowledge-workerproductivity is difficult to measure, both remote workers and their managersconsistently report productivity gains. Gains are generally attributed to fewerinterruptions, less stress and proximity to customers.
Cost Savings: The main savings are in premises costs and office overhead. Academicstudies are scarce, and most anecdotal reports reflect other organizational changes(downsizing, relocation) that occurred at the same time. Regardless, organizationswith a well-planned remote work program can reduce the amount and cost of space.The key is to institute a space-sharing program. Of course, remote work also hascosts (one-time start-up costs and ongoing operating expenses) that must be factoredinto any calculation of cost savings.
Reduced Absenteeism: Reports indicate that alternative officing results in reducedabsenteeism since employees can use an hour rather than the entire day to handlepersonal and health concerns.
Enhanced Customer Service: Employees can be closer to a client base. Using flexiblehours, customer services can be extended beyond the normal 9-to-5 working day.
Benefits to Employee
Studies and first-hand accounts on alternative officing report the followingadvantages:
19
• Increased personal productivity
• Increased flexibility to balance thedemands of work and home life
• Personal savings (for example,clothing and transportation costs)
• Stress reduction associated withcommuting
• Improved morale
• Decreased commuting time
• Greater control over work processand time
Benefits to Society
• Reduced traffic congestion andconsequent pollution
• Reduced total travel and consequentpollution
• Less stress on deterioratingtransportation infrastructure
• Improvement in air quality
• Reduction in energy usage
Increase flex ibility by minimizing the number of space standards.
Some organizations are moving away from the traditional space by rank approach andmoving toward universal plan offices—one-size-fits-all workstations. One of thebenefits of a universal standard is an increase in flexibility.
The one-size-fits-all workstation will accommodate a number of different work stylesand job functions by fitting out the footprint with different furniture componentsarranged in different ways. The components a space planner uses depends on jobfunction. Furniture components can then be standardized and modularized, and theyare interchangeable.
In practice, most organizations use a variation of the universal plan that limits thenumber of different office sizes. When determining the proper size for a workstationor office, it is important to consider both the job function and how the differentspace standards will interact. Workstations should share a common module so theycan be easily combined. For example, 8 feet by 8 feet, 8 feet by 12 feet, and 12 feetby 16 feet standards all share a 4 foot module. Consequently, three 8 by 8 workstationcould easily become two 8 by 12 workstations. In addition to accommodatingdifferent job functions, standardized workstation modules can easily be reconfiguredto address changing requirements (such as reorganizations) and to support teamsettings.
Universal workstations or fewer standards allow much greater flexibility and result infewer barriers to change, less disruption when change does occur, and lower costs inmoney and time.
Don’t expect to achieve state of the art space utilization in older facilities.
Research indicates that an improvement in space utilization rate is not a simplematter of squeezing people into less space. In reality, such a simplistic approachcould have a devastating effect on an organization. There are certain factors thatsupport and facilitate more efficient space use. Emerging trends indicate thatorganizations are seeking newer box type (vanilla) office buildings with large floorplates, capable of meeting heavy power and technology related demands.
Larger floor plates (greater than 18,000 sq. ft.) lend themselves to more efficient,flexible office layouts. Generally, a larger tenancy allows for smaller workspace perperson. Consequently, organizations are consolidating into single large locations toreduce real property costs and non-real property costs. By leveraging size, firms canreduce other costs such as mailroom and custodial.
The use of teaming approaches, telecommuting, hotelling and other shared officeconcepts, and greater reliance on power and new technology all have implications forspace use. Considering the continuous and rapid changes in the ways people workand use space, buildings and furniture systems must provide sufficient flexibility toallow for cost-effective reconfigurations.
These factors sometimes make it difficult for the Federal government to achieveimprovements in space utilization in an environment of constrained resources.Agencies, lacking funds for acquiring space in the newer, more efficient facilities, mustdo the best they can with existing space in aging Federal buildings. An impressiveaspect of the GSA/PBS utilization standards and performance is that they are achievedin a disproportionately older inventory of facilities.
20
Recommendation #2 Agency strategic plans should focus on missionbut not overlook administrative costs such asreal property.
We recommend that agencies use planning and measurement to manage their realproperty use and costs. GSA can help by providing sensible standards, guidelines, andmeasures used in the public and private sectors. Each agency’s space needs and spaceportfolio are ultimately unique and mission-specific, so each agency should compareitself against the common standards and track its own unique space use and costs. Ifagencies understand that real property costs can be managed, the overall savings mayprovide some fiscal relief in a tight budgetary environment (assuming a tradeoff amongreal property, operations, personnel, and program costs during the agency’s ownbudget development process). Furthermore, agencies that are struggling withmeasuring performance will find that the area of real property provides anopportunity to plan and manage a discrete and quantifiable cost of doing business.
Each agency should be aware of the following about their own space use:
• Space use is a cost of doing business, like personnel or supplies.
• Space use can be measured.
• Space use can be tracked, controlled, and planned for.
• If you pay attention to it and measure it, space use usually can be improved.
Each agency should plan strategically for its own space use. There are several reasonswhy this is preferable to having a central source such as GSA mandate standards forspace use:
• Each agency’s space use profile is unique and dependent on the particular mission,not just of the overall agency, but of the specific agency elements using the space.Each agency will have a different learning curve for alternative space usemethodologies based on employee profile, agency culture, or operational issues.GSA’s role is to identify and share best practices.
• The available data sources (Worldwide Inventory, Foundation Information for Realproperty Management (FIRM)) are not comprehensive or current enough tofacilitate centralized space management. GSA’s role is to use available resources to“take a snapshot” of space management issues.
• Each agency should, in light of the Government Performance and Results Act(GPRA), think in terms of setting its own goals and measuring its ownperformance. GSA’s role is a leadership role.
GPRA is mission-focused and agencies are rightly concerned with efforts to measurethe outcomes of their particular programs. However, an agency still requiresinfrastructure to carry out its mission. There is a link between agency mission andadministrative functions such as real property. Executive agencies can improve andexpand upon GPRA by including this link in their strategic plans, even if it is only anappendix to the plan itself.
21

We recommend that each Federal agency plan strategically for future real propertycosts, in the same way that each agency prepares future year projections for budgetand staffing. Such planning would enable each agency to consider real property as amanageable cost of business, to plan for projected changes in space use, and to trackperformance in controlling space use and real property costs.
Some issues to consider are:
• There should be consistency of direction among your future year projections foroverall budget, staffing, and real property costs. If you are projecting flat budgetsand downsizing, your projected real property costs probably should not be rising.
• Always consider the full economic cost of real property. For leased space (spaceleased from GSA as well as other lessors), consider the rent plus any additional costs.For agency-owned space, there is an actual cost for operations, utilities andmaintenance. However, there is also an economic cost for use of the space. Anagency should make some attempt to value the cost of use of its owned space,whether that be opportunity cost, market cost, or depreciation. For example, apossible measure of cost could be to assume a fair market rental value as an oppor-tunity cost. Therefore, an agency’s total real property cost would be the sum of:
• Actual lease costs (both GSA and non-GSA controlled locations)
• Operating costs in agency-owned space
• Some measure of fair market rental value of agency-owned space
If owned space is perceived as being free of charge it is easy to over-allocate space,to let vacant space remain vacant, or to provide excessive free space forcontractors.
• After establishing the baseline real property cost, the future year projections shouldreflect the outcomes of strategic objectives designed to maximize efficiency ofspace use and contain the cost of real property use.
• When projecting reduction of real property costs attributable to personnel downsizing,keep in mind that there is a time lag between losing people and giving up space. PBSdata suggest a 2-year time lag. Timing depends on factors such as whether the space isowned or leased, lease expiration dates, ability to consolidate, and the disposal process.
• Are there fundamental differences between the types of space you tend to ownversus the types of space that you tend to lease?
• What is the influence of sub-markets (geographical areas) on your overall spaceportfolio?
• What is the influence of alternative work strategies on your overall space portfolio?
• Do costs vary across different segments of your space portfolio? Are there anyimplications for additional savings?
• Are there ways to save money in current space assignments?
• If your current or future year budget proposes new programs or initiatives,consider the real property implications if the programs are approved. Make sure
22

you have included funding projections for associated real property costs as well ascost of the programs themselves.
• Think of real property as a true cost and not a pass through. Start with yourbaseline real property cost as a percentage of your total agency budget. Set a targetfor reducing real property cost. Consider what you could do with the funds if theywere applied to your program. Such an approach may be more realistic thanassuming a pass through of steadily increasing real property costs coupled withincreased appropriations for new program elements.
• Remember to take full advantage of GSA’s expertise if you need help in strategicplanning for real property.
When planning for space use at the strategic level, focus on total space as we havedefined it in this review. Compare new assignments to the government sectoraverage of 200 usable square feet per person. Use this number as a guideline, not as arigid limit or a minimum entitlement. Plan according to your actual needs, but beaware of the implications for your utilization rate.
Utilization rates are useful to management and should be considered in strategicplans, but they do have drawbacks:
• There are problems associated with collecting the data. Both PBS and the privatesector bill according to the amount of space, not the number of people using it.
• Utilization rates ignore market factors that are more likely to have a greater impacton cost, for example, geographic area, market fluctuation, urban versus suburban, orlocation in or away from the Central Business District.
• Since the Federal government is not a commercial business, there is no obviousway to establish a link between space use and productivity. Simply squeezingpeople into less space is a misguided attempt to control costs and can becounterproductive to morale and productivity.
• A one-size-fits-all utilization rate ignores the mission-specific needs of agencies.That is why we framed the discussion in terms of an overall average for officespace utilization.
• In this era of rapidly changing workplace environments and technologies, the mostimportant quality is flexibility. Any attempt to develop utilization standards foralternative workplace environments misses the whole point.
• The nature of agency-owned space is different from PBS space. There is limitedvalue in comparing a space utilization standard developed for office space use withspace use in Government buildings that have more mission-specific uses (hospitals,laboratories).
• Space planning is not the same thing as strategic inventory management.
• Verification of space utilization data is complicated by the presence of work shifts,contractors, temporary help, or shared workstations.
• The relationship between space utilization rate and cost is not a simple one. Wemight achieve a more favorable utilization rate in newer, technologically modern
23

building with larger floor plates, but the rent may be higher. It may be moreeconomical to settle for a higher utilization rate in an older and less expensivebuilding.
When thinking about the implications of upcoming space actions on utilization rate,consider the following issues:
• Can you justify the variation from the average on the basis of mission or uniquerequirements?
• Is the facility materially different than the standard GSA vanilla office-type buildingand, if so, what are the space implications?
• Is the facility an older building with an inefficient design?
• Is the planned assignment based on an open floor plan with systems furniture,with one workstation per person?
• Can adjustments be made for workstation sharing, telecommuting, hotelling,working in shifts, etc.?
• Are there extraordinary circulation needs?
When you look at real property in your strategic plans, keep in mind that spaceprovided to contractors has value. Although contracting rules require that weevaluate the value of space provided to contractors, agency real propertyprofessionals may not be aware of the implications. There is an opportunity costsince you could have provided the space for your own employees’use. Considerwhether a stricter space standard should be applied to contractor-occupied space.Consider whether it is in the Government’s best interest to excess, outlease ordispose of the property. We should be aware of the tradeoffs and open to other waysof doing business. For example, the policy of the Canadian government is to notsupply any space for contractors whatsoever.
When you look at performance measures as part of the strategic planning process, wewould like to reiterate that you should look at a broad range of performancemeasures to evaluate the real property function. Look at measures that tell you howmuch you are spending on real property, measures such as cost per employee, costper square foot, and percentage of administrative budget.
Recommendation #3 Utilization rate should be managed at the agencylevel in the strategic planning process.
In our Space Use Review, we advocated a more flexible, strategic and comprehensiveapproach to space management. Considering the continuous evolution of theworkplace, a return to the D-76 “building block” approach to space utilization isinappropriate. As we stated earlier, space planning is not the same thing as strategicinventory management. The Federal Government is not a highly centralizedbureaucracy. We are a collection of diverse agencies with different missions andspace needs. We could conceivably develop “standards” for every type of spaceneeded by each and every agency. This would be a costly effort that would not yield
24

commensurate benefits. We can accomplish the same end through the suggestedapproach of strategic planning, performance measurement and benchmarking.
A number of people that we spoke to expressed concern that OMB would attempt toenforce whatever benchmark we put forward through the budget process, in thesame way that OMB and GSA attempted to track adherence to the old 135 square feetper workstation standard in the GSA Form 3530. We recommend that OMB not usethe utilization rate as an indirect means of controlling real property cost. In the spiritof the National Performance Review, we recommend that agencies be empowered tomanage their own space use through the strategic planning process. In return, theOffice of Real Property will commit itself to an ongoing educational effort to identifyand disseminate best practices in space management.
The main point on the utilization rate is this: the utilization rate is what it is—ameasure of space efficiency in the traditional office building environment. Spaceefficiency is one thing that you can measure; utilization rate is the most commonlyused performance measure for space utilization.
Since it is simply a rule of thumb measure of space efficiency, don’t use the utilizationrate out of context as an indirect measure of cost. If you want to control cost, thenyou must measure cost. At best, a focus on utilization rate is a short-term strategy inlieu of a comprehensive long-term cost control strategy that considers a broaderrange of performance measures.
25
Next StepsGovernmentwide Real Property Performance Measurement Initiative
The Office of Real Property’s Governmentwide Performance Measurement Initiativestarted in August 1997. The project team will determine, in collaboration with otherFederal agencies, a set of appropriate Governmentwide real property performancemeasures and a methodology for annual measurement.
The initiative addresses two short-term goals:
1 ) Raise the awareness of and increase Governmentwide participation in realproperty performance measurement.
2 ) Establish a Governmentwide baseline for the agreed-to set of measures that willallow agencies and GSA to evaluate and benchmark performance.
The long-term goal is for the Government to demonstrate improved assetmanagement relative to the baseline measurements. So far, the initiative has generatedan enthusiastic response from our customer agencies.
Increased Leadership Role in Alternative Workplaces
The Office of Real Property will assume an increased leadership role in the area ofalternative workplaces through the establishment of a new Worklife Enterprisesdivision.
Follow Up on Recommendation #2 (Agency Planning Process)
GSA will explore ways to encourage agency planning for administrative costs, such asan appendix to the mission-focused strategic plan.
26
Research
I n th is s ection of our report, we s ummarize our res earch . Weencourage our audience to read this section since it contains valuableinformation beyond what we discuss in the findings and recommendations
sections of the report.
The following pages contain a broad overview of space use practices and trendsbased on our research and contacts with professional trade organizations, privatesector firms, other Federal agencies and national governments, and state and localgovernments.
The research was conducted informally by telephone, personal interview, electronicmail, and over the Internet. Some materials were obtained directly from print sourcesor via the Internet.
Note: Although every effort has been made to define measurement terms, spacemeasurement methods vary from market to market and sector to sector. Most of thespace standards are quoted in some sort of “net” as opposed to gross square feet (i.e.,measured from interior, not exterior walls). However, most of the net square feetstandards are comparable with what we call usable. With this in mind, the reader canmake broad comparisons based on the data.
Policies, Practices, and Background InformationFederal Property Management Regulation (FPMR) Temporary Regulation D-76
The FPMR Temporary Regulation D-76 established the basic GSA policy on space use.The regulation formally expired in November 1996. A brief summary of the policyfollows:
• Office space is divided into two principal components:Primary area and Support area.
• Primary office area is the personnel-occupied area in which an activity’s normaloperational functions are performed. The utilization threshold for the Primaryoffice area is 125 occupiable square feet per person.
• The 125 occupiable square feet per person review threshold was developed basedon a professional analysis of the use of space by employees housed in GSA-controlled locations. This included clerical, administrative, professional, managerialand executive level employees using either conventional furniture or systemsfurniture and includes circulation. The 125 occupiable square feet per personPrimary threshold is an average.
27
• Support office area is all secondary/shared workstations, extraordinary circulationspace, and those specific and discrete areas constructed as office space and used tomeet mission needs outside of the agency’s requirements for housing personnel.The utilization threshold for the Support office area is 22 percent of the Primaryoffice area utilization rate. When added to the 125 occupiable square feet allowedfor Primary area, the maximum allowable standard for overall office space use is153 occupiable square feet per person.
• The 22 percent review threshold is based on a survey and analysis of actualSupport area requirements of GSA clients. The 22 percent Support area thresholdis also an average.
• The threshold is the point at which further examination of a space request may berequired. Space requests producing utilization rates below the threshold are pro-cessed with a minimum of review. Those above the threshold are subject to a secondlook; but exceeding the threshold by itself is not grounds for denying the request.
Public Buildings Service (PBS) Space Assignment Data
We obtained current space assignment data from PBS. The data cannot be used toassess the current utilization of the PBS inventory because it consists primarily of thenumber of personnel reported during the initial assignments. There is no way ofknowing whether the data for any particular assignment represents full-timeequivalent (FTE), primary shift employees, or number of workstations. If an agencyadds or subtracts personnel during an assignment’s lifetime, there is no reason for theagency to report the personnel change and no reason for PBS to keep track of it. Thebasic fact is that PBS bills according to amount of space, not according to number ofpersonnel housed in that space.
We were able to analyze the data to compare relative ratios of space classified asoffice, storage and special. Based on our analysis, we concluded that the proposedbenchmark of 200 usable square feet per person is reasonable. In other words, theprevious FPMR overall office space standard of 153 occupiable square feet per personapproximates a total standard of 200 usable square feet per person when appropriateper person amounts are added for storage and special space.
The potential cost of updating the utilization rate (i.e., personnel assignments)information for the PBS inventory would be considerable, based on an estimate ofupdating this information for a small sample of PBS buildings.
1997 BOMA Experience Exchange Report
The Building Owners and Managers Association (BOMA) has published this reportannually since 1920. The Experience Exchange Report is a compilation ofperformance data from office building owners and managers across North America.The report is an industry benchmark that provides full income, operating andexpense data on more than 4,000 buildings - more than 790 million square feet - inthe public and private sectors. The report contains valuable benchmark data on officespace utilization rates.
28

The 1997 BOMA report provides 1996 data on the average amount of square feetoccupied by each individual office worker in a building. The average is calculated bydividing the total amount of occupied office square feet in the sample by the totalnumber of office workers. The average square feet per office worker reflects theaverage square footage allotted to an office worker regardless of position, andincludes workers at every level from receptionist to Chief Executive Officer.
Summary of BOMA 1996 Office Space Utilization Rates
. . . . . . . . . . . . . . . . . . . . . . . . . . . . . . . . . . . . . U.S. . . . . . . . . Canada
Private Sector . . . . . . . . . . . . . . . . . . . . . . . . . . . . . . . . . 282 . . . . . . . . . . . . 253Government Sector . . . . . . . . . . . . . . . . . . . . . . . . . . . . . 235 . . . . . . . . . . . . 336
The following utilization rate data is given in BOMA rentable square feet per officeworker and refers to the U.S. private s ector in 1996:
All buildings (2,286 in sample) . . . . . . . . . . . . . . . . . . . . . . . . . . . . . . . . . . . . 282
All downtown buildings . . . . . . . . . . . . . . . . . . . . . . . . . . . . . . . . . . . . . . . . . 288All suburban buildings . . . . . . . . . . . . . . . . . . . . . . . . . . . . . . . . . . . . . . . . . . 271
. . . . . . . . . . . . . . . . . . . . . . . . . . . . . . . Downtown . . . . . . . Suburban
Corporate facilities . . . . . . . . . . . . . . . . . . . . . . . . . . . . . 306 . . . . . . . . . . . . 290Financial buildings . . . . . . . . . . . . . . . . . . . . . . . . . . . . . 238 . . . . . . . . . . . . . n/aMedical buildings . . . . . . . . . . . . . . . . . . . . . . . . . . . . . . 255 . . . . . . . . . . . . 134Single purpose bldgs. . . . . . . . . . . . . . . . . . . . . . . . . . . . 339 . . . . . . . . . . . . 272
Building age (years) . . . . . . . . . . . . . . . . . . . . . . . . . . . . Utilization rate
Less than 9 . . . . . . . . . . . . . . . . . . . . . . . . . . . . . . . . . . . . . . . . . . . . . . . . . . . 28510 to 19 . . . . . . . . . . . . . . . . . . . . . . . . . . . . . . . . . . . . . . . . . . . . . . . . . . . . . 29420 to 29 . . . . . . . . . . . . . . . . . . . . . . . . . . . . . . . . . . . . . . . . . . . . . . . . . . . . . 28130 to 39 . . . . . . . . . . . . . . . . . . . . . . . . . . . . . . . . . . . . . . . . . . . . . . . . . . . . . 27540 to 49 . . . . . . . . . . . . . . . . . . . . . . . . . . . . . . . . . . . . . . . . . . . . . . . . . . . . . 197More than 50 . . . . . . . . . . . . . . . . . . . . . . . . . . . . . . . . . . . . . . . . . . . . . . . . . 280
The following utilization rate data is given in BOMA rentable square feet per officeworker and refers to the U.S. government s ector in 1996 (includes Federal, stateand local properties):
All buildings (223 in sample) . . . . . . . . . . . . . . . . . . . . . . . . . . . . . . . . . . . . . 235
All downtown buildings . . . . . . . . . . . . . . . . . . . . . . . . . . . . . . . . . . . . . . . . . 237All suburban buildings . . . . . . . . . . . . . . . . . . . . . . . . . . . . . . . . . . . . . . . . . . 211
29

Building age (years) . . . . . . . . . . . . . . . . . . . . . . . . . . . . Utilization rate
Less than 9 . . . . . . . . . . . . . . . . . . . . . . . . . . . . . . . . . . . . . . . . . . . . . . . . . . . 22410 to 19 . . . . . . . . . . . . . . . . . . . . . . . . . . . . . . . . . . . . . . . . . . . . . . . . . . . . . 26620 to 29 . . . . . . . . . . . . . . . . . . . . . . . . . . . . . . . . . . . . . . . . . . . . . . . . . . . . . 18930 to 39 . . . . . . . . . . . . . . . . . . . . . . . . . . . . . . . . . . . . . . . . . . . . . . . . . . . . . 20740 to 49 . . . . . . . . . . . . . . . . . . . . . . . . . . . . . . . . . . . . . . . . . . . . . . . . . . . . . 362More than 50 . . . . . . . . . . . . . . . . . . . . . . . . . . . . . . . . . . . . . . . . . . . . . . . . . 364
The following utilization rate data is given in BOMA rentable square feet per officeworker and refers to the Canada private s ector in 1996:
All buildings (144 in sample) . . . . . . . . . . . . . . . . . . . . . . . . . . . . . . . . . . . . . 253
Downtown corporate facilities . . . . . . . . . . . . . . . . . . . . . . . . . . . . . . . . . . . . 259Suburban corporate facilities . . . . . . . . . . . . . . . . . . . . . . . . . . . . . . . . . . . . . 276
All downtown buildings . . . . . . . . . . . . . . . . . . . . . . . . . . . . . . . . . . . . . . . . . 251All suburban buildings . . . . . . . . . . . . . . . . . . . . . . . . . . . . . . . . . . . . . . . . . . 260
Building age (years) . . . . . . . . . . . . . . . . . . . . . . . . . . . . Utilization rate
Less than 9 . . . . . . . . . . . . . . . . . . . . . . . . . . . . . . . . . . . . . . . . . . . . . . . . . . . 27310 to 19 . . . . . . . . . . . . . . . . . . . . . . . . . . . . . . . . . . . . . . . . . . . . . . . . . . . . . 26920 to 29 . . . . . . . . . . . . . . . . . . . . . . . . . . . . . . . . . . . . . . . . . . . . . . . . . . . . . 30230 to 39 . . . . . . . . . . . . . . . . . . . . . . . . . . . . . . . . . . . . . . . . . . . . . . . . . . . . . 23240 to 49 . . . . . . . . . . . . . . . . . . . . . . . . . . . . . . . . . . . . . . . . . . . . . . . . . . . . . 257More than 50 . . . . . . . . . . . . . . . . . . . . . . . . . . . . . . . . . . . . . . . . . . . . . . . . . 245
The following utilization rate data is given in BOMA rentable square feet per officeworker and refers to the Canada government s ector in 1995:
All buildings (57 in sample) . . . . . . . . . . . . . . . . . . . . . . . . . . . . . . . . . . . . . . 336
All downtown buildings . . . . . . . . . . . . . . . . . . . . . . . . . . . . . . . . . . . . . . . . . 342All suburban buildings . . . . . . . . . . . . . . . . . . . . . . . . . . . . . . . . . . . . . . . . . . 303
Building age (years) . . . . . . . . . . . . . . . . . . . . . . . . . . . . Utilization rate
Less than 9 . . . . . . . . . . . . . . . . . . . . . . . . . . . . . . . . . . . . . . . . . . . . . . . . . . . n/a10 to 19 . . . . . . . . . . . . . . . . . . . . . . . . . . . . . . . . . . . . . . . . . . . . . . . . . . . . . 29220 to 29 . . . . . . . . . . . . . . . . . . . . . . . . . . . . . . . . . . . . . . . . . . . . . . . . . . . . . 31430 to 39 . . . . . . . . . . . . . . . . . . . . . . . . . . . . . . . . . . . . . . . . . . . . . . . . . . . . . 32240 to 49 . . . . . . . . . . . . . . . . . . . . . . . . . . . . . . . . . . . . . . . . . . . . . . . . . . . . . 243More than 50 . . . . . . . . . . . . . . . . . . . . . . . . . . . . . . . . . . . . . . . . . . . . . . . . . 357
30
1996 National Summit on Building Performance
This conference, organized by the American Institute of Architects (AIA), theInternational Facility Management Association (IFMA), and the InternationalAssociation of Real Estate Executives (NACORE), provided some interestingconclusions about space use from a more strategic viewpoint. Key ideas are:
• High-quality buildings can increase employee productivity by 10 to 20 percent.With nearly 100 million white collar workers averaging a salary of $43,680, thisamounts to $437 billion annually from potential worker productivityimprovements.
• According to research conducted by Fortune magazine, the largest impact onproductivity would result from improvements in office layout, personal computers,and thermal comfort.
• Despite the potential impact on productivity, and by implication the bottom line,the majority of corporate strategic plans do not include real property andworkplace objectives.
• Company size, industry and amenities offered can distort measures such as occu-pancy cost as a percentage of gross corporate revenues or cost per employee. Theyare best used as yardsticks within one’s own company (source: FM DATA web page).
Benchmarking Occupancy Cost in the Private Sector
In most private sector benchmarking studies, the amount of space allocated peremployee is only one aspect of occupancy cost (source: Journal of Real EstateResearch). The other consideration is cost per square foot.
In a typical benchmarking study, a firm collects data on each competitor’s average realproperty cost per square foot and average square feet per employee (overallutilization rate). For any particular company, the product of these two numbers yieldsthe occupancy cost per employee. If we take the lowest average real property costper square foot found in any of the firms, and multiply by the lowest average squarefeet per employee (best utilization rate) found in any of the firms, the product yieldsthe “best in class”occupancy cost per employee for the benchmarking sample.
Unless the same firm has both the lowest cost per square foot and the lowestutilization rate, the best in class occupancy cost per employee is a fictional number, agoal to aspire to or a means of comparison (benchmark) for an individual firm’soccupancy cost.
It is feasible to perform a similar exercise to establish a best in class occupancy costper employee among Federal agencies. However, the following considerations shouldbe kept in mind:
• GSA has historically found it difficult to obtain space data from the other Federalagencies.
31

• Agencies must agree on a consistent method of evaluating owned space. GSA has aleadership role relative to this issue.
• “Employee” must be defined, i.e., there must be an agreed upon consistentapproach to handling issues such as FTE, contractors, shift work, and workstationsversus personnel.
Alternative Office Solutions
The November 1996 edition of Facilities Design and Managem ent reported on the1996 World Workplace, an event organized by the International Facility ManagementAssociation. Some important points about alternative office solutions are:
• “Organizations are more customer-focused, deconstructed, team-based, geography-neutral, dispersed, lean on human resources, yet keen on the idea of the workforceas intellectual capital.”
• Teleworkers are more productive because they spend less time commuting anddedicate one-third of that time to the job. Also, serious workers need less control.
• Telecommuting requires better remote managers and also threatens teaming, sogroupware is required to keep teams interconnected.
• Work is geography-neutral partially because of global work hours.
• Hotelling is highly effective with workers who already spend considerable time outof the office.
• Radical redesign of the workplace environment should be driven by businessstrategy with the twin goals to use design to increase performance and to optimizeor reduce space use.
A May 11, 1997 article in the Washington Post offers more insights about thehotelling concept:
• Because many executives, particularly people involved in sales or customer service,are out of the office most of the time, several can use the same space at differenttimes, just as travelers use the same hotel rooms on different days.
• These types of alternative office environments usually include a small, enclosedoffice that provides privacy; larger open areas where teams can meet; and storageareas. Users can configure the space to their needs quickly.
• At Tandem Computers, Inc., each alternative office, on average, accommodatesthree people. This means that the company leases less space; they estimate a 50percent reduction in leasing costs for people who use the alternative offices.
• Savings from real property should not be the only reason to adopt the hotellingconcept. For example, Hewlett-Packard Co. is expanding its hotelling pilot from 6to 23 offices as a way for employees to have greater flexibility and improve their
32

work-life balance. Big Six accounting firms in Silicon Valley (California) areadopting hotelling more frequently because of the area’s traffic problems.
• Most companies provide users of alternative space with equipment they can carrywith them or use in their home offices, such as laptop computers, cellular phones,fax-printers, monitors, keyboards, docking stations and business phone lines,including high-speed digital lines. In reality, the cost of connectivity is moresignificant than the cost of the equipment.
• Disadvantages to hotelling include loss of office camaraderie and personal contact,and increased difficulty in instilling corporate culture and values in new employees.
In April 1995, IFMA conducted a mail survey of facility managers in the United Statesand Canada on alternative officing practices. Key findings were:
• Most organizations are involved in some type of alternative officing practice. Theyexpect use to increase significantly by 2000, with the greatest increase expected inuse of telecommuting.
• The positions cited as most appropriate for alternative officing practices are salespositions.
• The primary barrier to implementing alternative officing practices is organizationalculture.
• Constraints of the existing building frequently were a barrier to implementing on-site workplace redesign practices.
• On-site redesign practices (e.g., flexible work schedules, modified office standards)yielded cost reductions and productivity increases, while off-site practices (e.g.,telecommuting) often resulted in improved morale and higher productivity.
• Most organizations supply telecommuting and home office employees withcomputers and modems. Six in ten companies provide other data lines and voicemail. Four in ten provide facsimile machines and telephones.
• Three-quarters of the facility managers surveyed evaluate the effectiveness ofalternative officing practices by observation, while half use employee interviewsand financial data.
• More than half of the facility managers reported cost reductions afterimplementation (rental, lease and property costs) while almost one-fourth reportedincreased costs (technological equipment and supplies).
Space Use Trends in the Private Sector
In May 1997 Arthur Andersen LLP provided us with a summary of space use trends inthe private sector. Key points are:
• In the past, workspace was typically assigned based on position, seniority or status.
33
The current approach is more team-oriented and egalitarian, promotingfunctionality over entitlement. Modern office layouts are designed to optimize thebenefits of technology; foster knowledge sharing and employee interaction; andimprove customer service.
• Companies today use fewer, simpler, strictly applied space use standards instead ofcomplex entitlement-based standards.
• Companies have improved space utilization rates (decreased average square feetper employee) on the order of 20 to 30 percent. These improvements vary widelydepending on the type of company.
• By improving space utilization, companies can achieve occupancy and operatingcost savings in the range of 20 percent. Again, this varies widely by type ofcompany.
• By implementing universal space plan concepts, companies can save “churn” costs(contraction, expansion and relocation of business units) resulting from tenant fitout and interruptions to business operations.
• The most commonly used performance measurements for space utilization aresquare feet per person housed and square feet per employee (FTE).
• Some other performance measurements companies use are:
34
• Assets as a percentage of revenues
• Revenues per square foot and peremployee
• Gross profit per square foot and peremployee
• Net income per square foot and peremployee
• Total square feet owned and leased
• Square feet by space use category
• Occupancy costs as percentage ofrevenue, expenses or income
• Occupancy costs per square footand per employee
• Companies are trying to lower their square feet per person housed performance tobelow 250 usable square feet.
• For companies burdened with older infrastructure and legacy properties, the targetof 250 usable square feet is too low and a higher target, closer to 300 to 350 usablesquare feet, seems more realistic.
• A sample of five mostly technology-oriented companies yielded an average usablesquare feet per employee rate of 206.
Institute of Real Estate Management (IREM)
Industry data was provided by IREM. The main source provided was an article in theNovember/December 1996 issue of the Journal of Property Managem ent entitled“Less Opulence More Options.” The article cites information from Equitable Real
Estate Investment Management Inc., and Real Estate Research Corp.’s Em ergingTrends in Real Estate 1996. Some relevant highlights are:
• 73 percent of the corporate real estate executives Emerging Trends surveyed saidthey were charged with reducing square footage per employee. Executives were tocut space by 25 percent, reducing from 265 square feet per employee to 200square feet.
• Three years ago a typical allocation was 350 square feet per employee; now, theallocation can be as low as 150 square feet.
• An important consideration is that, in order to attain the lower utilization rates,companies have moved to newer buildings with larger floor plates. Larger, moreefficient floor plates allow companies to consolidate and pack in more people persquare foot. Floor plates smaller than 18,000 square feet don’t lend themselves totoday’s more efficient, flexible office layouts.
• The Dallas/Fort Worth metroplex of 11 suburbs, for example, is seeing aproliferation of big-box type office buildings that yield greater efficiencies in termsof space. These two-to-six floor mid-rises of 100,000 to 150,000 square feettypically look rather square with a center atrium and two 25,000-square-foot wingsthat yield 50,000-square-foot floor plates.
• Corporate users are less interested in high-end finishes and are opting for vanilla-type office space to utilize their dollars more efficiently.
• Corporate users also are attracted to build-to-suit, since large users can realizereduced loss factors (fewer non-usable corridors), lower operating costs of HVAC,and janitorial tailored to the level they need. Tenants are willing to live with lowerlevels of services in order to lower their costs.
• A lot of corporate users are moving and consolidating office functions. Byleveraging their size, administrative functions, telecommunications, and mailroomservices are reduced.
• A side effect of consolidation is an increase in parking requirements. Where threeparking spaces per 1,000 square feet was once the rule, now five spaces areneeded for every 1,000 square feet. (If the “rule” is based on square feet, thenpacking more employees into office square feet requires more parking per squarefeet, since there are now more employees using that space.) Proximity to publictransportation is more desirable than ever among commercial tenants.
• Following the same rationale discussed for parking requirements, electrical powerdemands have increased from 2-3 watts per square foot to 4-6 watts per squarefoot.
• Continuing with the above logic, more bodies per square foot and more power persquare foot (for computers and peripheral equipment) results in more heat and aconcomitant need for more cooling.
35
• In addition to more electrical capacity, commercial tenants also want uninterruptedpower service (UPS) with dual feeds so that if the power fails, it can pick upwithout losing any data.
• While commercial tenants may be seeking plain vanilla space in terms of build-out,they are also seeking what is called “high-tech” space - spaces where the line ofsight for communications is already in place, spaces that have UPS systems, backupsystems in generators, improved roof access for communications, high-speed wiring(fiber optics), and raised floors to allow ease of access for data cabling upgrades.
The most important point to note from the information provided by IREM is that animprovement in the space utilization rate is not a simple matter of squeezing peopleinto less space. There are certain prerequisites that facilitate such an improvement:larger floor plates, ability to consolidate, higher power capacity, UPS, high-tech space,and generally a move towards newer, build-to-suit facilities. There are also certainoutcomes associated with improving the space utilization rate, such as increasedparking, power, and HVAC requirements.
Sydney, Australia, Private Sector Office Market
In 1995, BOMA and the Facility Management Association in Australia conducted anoffice space study of the Sydney market. Relevant findings were:
• Gross space use in the Sydney Central Business District (CBD) was 17.2 squaremeters (191 square feet) per person, down from 19.5 square meters (217 squarefeet) per person in 1993.
• Gross space use in the Sydney metropolitan area was 23.1 square meters (257 squarefeet) per person, up from 16.6 square meters (184 square feet) per person in 1993.
• Generally, the larger the tenancy, the smaller the workspace per employee.
• Executives, partners and directors in the Sydney CBD occupy the largest workareas at 17 net square meters (189 net square feet) per person.
• Support staff occupy 9.3 net square meters (103 net square feet) per person in theSydney CBD and 11.9 net square feet (132 net square feet) per person in theSydney metropolitan area.
• Of those firms that have introduced alternative space use practices, hot desking(workstation sharing) is the most common practice in the Metropolitan area, whilehotelling is the most popular practice in the CBD. The conclusion drawn is thatCBD offices have a greater need for allocating workspaces temporarily whileMetropolitan firms may have a greater need for providing a permanent workspacethat two or more people can share.
• Firms generally engage in hotelling and hot desking to achieve cost/space savings.The main reason firms undertake telecommuting was given as benefits to employees.
36

FM DATA Monthly: Kraft Foods, Inc.
Most of Kraft’s cost control efforts involve the comparison of facilities to identify bestpractices in the lowest-cost buildings. In addition, Kraft does monitor space monthlyto identify opportunities for consolidation or expansion, and they do keep track ofsuch measures as operating cost per occupant. An interesting point is that thefacilities management staff tries to help their operating divisions understand that itcosts as much to house a temp or a consultant as it does to house an employee. As aresult, they track contract workers and provide special smaller contractorworkstations for them. Compare this with the policy of the Canadian government,which does not supply space for contractors (source of information on Kraft Foods,Inc. - March 1997 issue of FM DATA Monthly, a Tradeline publication, Orinda, CA).
FM DATA Monthly: J.P. Morgan
J.P. Morgan uses an “Office and Work Station Annual Rent Cost Analysis” as part of theproject planning process. This analysis calculates a proposed project’s area, annualrent, annual rent cost per square foot, square feet per workstation, and annual costper workstation. Using a spreadsheet, the client can see how much money can besaved if all tenants keep their square feet per workstation below the J.P. Morganbenchmark of 130 square feet. The analysis quantifies the value of smallerworkstations and the cost of “vanity space” (source of information - February 1997issue of FM DATA Monthly, a Tradeline publication, Orinda, CA).
J.P. Morgan also measures annual facility cost per usable square foot, seat, andoccupant. The facility information is available on a Computer Aided Drafting system.Real property costs are captured in the accounting general ledger system, in accountsdedicated to this purpose. These accounts include cash items (salaries, taxes,insurance, utilities, materials) and non-cash items (depreciation and cost of funds orinterest). The human resources system captures headcount by various categories,including employees and contract personnel. The various systems (CADD,accounting, human resources) are not integrated; information is entered into aspreadsheet manually (source of information - March 1997 issue of FM DATAMonthly, a Tradeline publication, Orinda, CA).
FM DATA Monthly: Steelcase, Inc.’s Top Ten Telecommuting Tips
The following guidelines enhance a telecommuter’s relationship with his or hercompany or supervisor:
1. Communicate with managers and supervisors in writing regularly to outlinework for the week ahead.
2. Have a specific “at home” room dedicated to work.
3. Schedule regular face-to-face meetings with supervisors or managers.
4. Plan to attend team or group meetings at the company office.
5. Be as prepared as possible before attending meetings.
37

6. Organize the workday by batching tasks; compartmentalize like activities so thattime is used efficiently. Tasks that can only be done in the office, such ascopying, mailings, or meetings, should be saved for in-office time.
7. Budget time.
8. Establish “checkpoints,” either face-to-face or written updates via e-mail, to ensurethe work process is successful.
9. Learn methods of stress management.
10. Make time to periodically “reconnect” with in-office co-workers.
(Source of information - July 1997 issue of FM DATA Monthly, a Tradelinepublication, Orinda, CA).
PBS Office of Portfolio Management (PT) FORM Report
In February 1996, the PBS Office of Portfolio Management published its Federal Opera-tions Review Model (FORM) report, developed in conjunction with Arthur Andersen.Some relevant findings from the Industry Roundtable with the private sector are:
• The participants believed that the PBS target for general purpose office space wasimpressive; the private sector considers a utilization rate of 230 square feet perperson to be good.
• The private sector is increasing its use of shared workspace programs. Hotelling,telecommuting, shared work space, and other alternative housing strategies haveallowed some private sector companies to compress to a ratio of eight employeesper single workstation when using a combination of these methods.
• PBS identified an issue specific to the Government: the real property componentof the costs incurred by federal agencies is very small in relation to the othercategories of expenses, such as payroll. Therefore, agencies may not be veryconcerned about efficient space utilization. Also, since Federal agencies do notexperience profits or losses, there is a reduced incentive to save money, especiallybecause there is a tacit belief that OMB will reduce the following year’s budget bythe amount of money an agency fails to spend in this year’s budget.
International Centre for Facilities (ICF)
• ICF recommends benchmarking against other governments rather than the privatesector, due to the difficulty in finding public sector equivalents to private sectormeasures such as percentage of total revenue or percentage of gross operatingcost. Private sector sources generally recommended the opposite, citing culturaldifferences between countries. They argued that U.S. private sector companieswould yield the best comparisons.
• Since the private sector can relate real property cost to profit, there can actually besituations where increased real property costs are justified in order to boostproductivity and increase profits.
38
• A related point is something called undermanning theory. In downsized companieswhere a remaining worker is performing duties previously assigned to two workers,he or she can sometimes be more productive using two workstations to perform twodiscrete sets of duties. This is contrary to a simplistic emphasis on reducingutilization rates as well as the expectation that downsizing personnel automaticallyleads to a proportionate decrease in space use.
• The Federal Government is big enough that benchmarking space use between andamong agencies is a valid concept.
• In the absence of a direct relationship of cost to profit, geographic difference andmarket fluctuations make the use of cost-based measures to track the FederalGovernment’s space use problematic.
• For a true measure of real property cost, simply using operating costs for anagency-owned building is not enough. There must be some estimate of theopportunity cost of leasing the facility to make a valid comparison.
• Agencies lack incentives to manage space since it is just another appropriationrequest; we need to provide incentives.
• If agencies are to be accountable for real property costs, we must distribute theexpertise that traditionally resided in GSA throughout the agencies.
• Since many national governments (e.g., Great Britain,Australia, Sweden) havealready established incentives and distributed expertise, benchmarking againstthem may not be appropriate unless our government goes through similar steps.
City of Philadelphia, PA
A report on the city government’s space leasing activities is available on the Internetsite of the city Controller’s office. Some key points are:
• Although the city has established a space utilization goal of 200 square feet peremployee, a lack of commitment has resulted in many leases exceeding the goal.
• At the same time, some agencies that complained of cramped conditions hadassignments well below the space utilization goal.
• Interestingly, the report recommended the re-establishment of the Department ofPublic Property as the sole leasing authority for City space (which is the oppositedirection from “Can’t Beat GSA Leasing”).
• The report also recommends the establishment of a space allocation goal peremployee for general office space and the requirement for high level approval forspecial space such as unusual storage needs.
39

Private SectorAT&T
• The space use standard is 225 gross square feet per person.
• The standard covers all kinds of space, with the major types being call centers andmarketing space.
• The organization’s actual space use currently exceeds the 225 gross square feet perperson standard.
• There are also personal standards according to position. The largest private office is 300square feet. The other levels are 225 square feet, 150 square feet, and then cubicles.
• AT&T also fixes an occupancy cost target of $21 per gross square foot. This is thetotal occupancy cost including rent and operating costs.
• These standards were determined by benchmarking with their competition andother best-in-class corporate real property users.
• GSA should not benchmark with other national governments because of culturaldifferences. GSA should benchmark against best-in-class U.S. corporations.
• The Federal Government should match need with quality, i.e., certain industriesmight need to be located in class A space (e.g., corporate lawyers) whileGovernment operations might be more appropriately housed in lower cost class Bor C space.
• Having matched need with quality, we should procure according to competitivestandards (no “monuments”).
IBM
• Rather than benchmarking against industry standards (although that may be done),the approach is to measure current performance and to try to improve upon it.
• Space use varies according to the type of work being performed. For the productdevelopment environment, the range is 230 to 250 gross square feet per person(includes primary, core, building support, lab space, equipment labs).
• For the marketing environment, the average is 100 gross square feet per person allinclusive (core and common areas). Space use is minimized through the use of tele-commuting, hotelling and workstation sharing, which is appropriate for the marketingfunction. The ratio of staff to workstations can sometimes be as high as 6 to 1.
• For the administrative people, the range is 170 to 180 gross square feet per person.
40
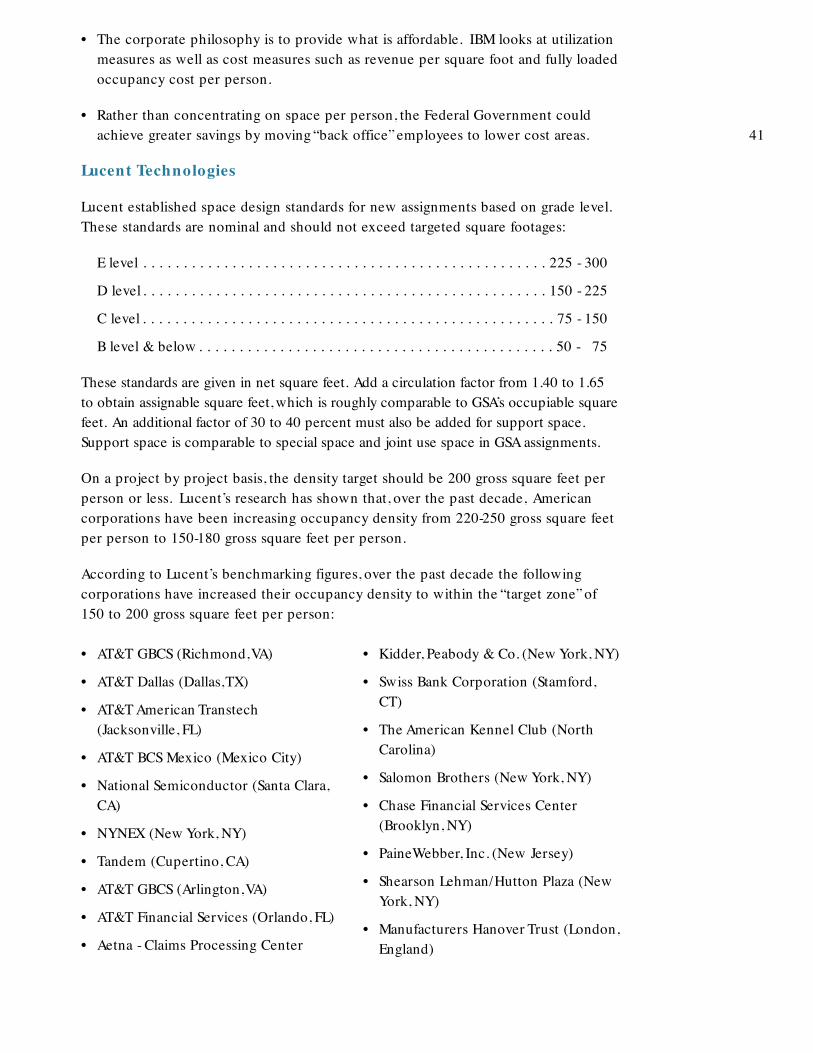
• The corporate philosophy is to provide what is affordable. IBM looks at utilizationmeasures as well as cost measures such as revenue per square foot and fully loadedoccupancy cost per person.
• Rather than concentrating on space per person, the Federal Government couldachieve greater savings by moving “back office” employees to lower cost areas.
Lucent Technologies
Lucent established space design standards for new assignments based on grade level.These standards are nominal and should not exceed targeted square footages:
E level . . . . . . . . . . . . . . . . . . . . . . . . . . . . . . . . . . . . . . . . . . . . . . . . . . 225 - 300
D level . . . . . . . . . . . . . . . . . . . . . . . . . . . . . . . . . . . . . . . . . . . . . . . . . . 150 - 225
C level . . . . . . . . . . . . . . . . . . . . . . . . . . . . . . . . . . . . . . . . . . . . . . . . . . . 75 - 150
B level & below . . . . . . . . . . . . . . . . . . . . . . . . . . . . . . . . . . . . . . . . . . . . 50 - 75
These standards are given in net square feet. Add a circulation factor from 1.40 to 1.65to obtain assignable square feet, which is roughly comparable to GSA’s occupiable squarefeet. An additional factor of 30 to 40 percent must also be added for support space.Support space is comparable to special space and joint use space in GSA assignments.
On a project by project basis, the density target should be 200 gross square feet perperson or less. Lucent’s research has shown that, over the past decade, Americancorporations have been increasing occupancy density from 220-250 gross square feetper person to 150-180 gross square feet per person.
According to Lucent’s benchmarking figures, over the past decade the followingcorporations have increased their occupancy density to within the “target zone”of150 to 200 gross square feet per person:
41
• AT&T GBCS (Richmond,VA)
• AT&T Dallas (Dallas,TX)
• AT&T American Transtech(Jacksonville, FL)
• AT&T BCS Mexico (Mexico City)
• National Semiconductor (Santa Clara,CA)
• NYNEX (New York, NY)
• Tandem (Cupertino, CA)
• AT&T GBCS (Arlington,VA)
• AT&T Financial Services (Orlando, FL)
• Aetna - Claims Processing Center
• Kidder, Peabody & Co. (New York, NY)
• Swiss Bank Corporation (Stamford,CT)
• The American Kennel Club (NorthCarolina)
• Salomon Brothers (New York, NY)
• Chase Financial Services Center(Brooklyn, NY)
• PaineWebber, Inc. (New Jersey)
• Shearson Lehman/Hutton Plaza (NewYork, NY)
• Manufacturers Hanover Trust (London,England)

The following corporations have yet to achieve the target zone (i.e., their occupancydensity exceeds 200 gross square feet per person):
The following corporations achieved an occupancy density below the 150 grosssquare feet per person target:
42
• GTE (Lewisville,TX)
• IBM (Cranford, NJ)
• New York Mercantile Exchange (NewYork, NY)
• AT&T Corporate Security(Bridgewater, NJ)
• AT&T GBCS (Basking Ridge, NJ)
• Southwestern Bell (San Antonio,TX)
• Merck (Whitehouse, NJ)
• Sun Microsystems (Milpitas, CA)
• Apple Computer (Austin,TX)
Traditional corporate space layouts have a ratio of dedicated space to shared spaceapproximating 70:30. Several factors are driving a movement toward a ratio of 50:50:
• Mobility afforded by technologicaladvances
• Reduction in size of space standards
• Fewer enclosed environment offices
• Team-oriented work spaces
• Task-oriented flexible furniture systems
Traditionally, enclosed environment offices have been apportioned on the basis ofrank within the corporate hierarchy. The ratio of enclosed environment offices toopen environment workstations has ranged from 30:70 to 20:80.
A greater emphasis on team work and shared team space, the desire to reduce churn,the need to “move people and not space,”and the goal of reducing fit-out costs haveall influenced the trend to have fewer “hard-walled”offices. Many companies now useenclosed environment offices only when a job function demonstrates very highsecurity or confidentiality requirements.
The ratio of enclosed environment offices to open environment workstations is nowapproaching 5:95 in many best-in-class companies. The most aggressive companiescan even achieve a ratio of 0:100 (i.e., all employees are housed in open environmentworkstations).
Lucent established targets to meet the following objectives:
• Improve space utilization
• Maximize real property asset value
• Improve productivity
• Promote teamwork
• Support cultural change

43
The targets are:
Occupancy Density . . . . . . . . . . . . . . . . . . 150 - 200 gross square feet per person
Building Efficiency . . . . . . . . . . . . . . . . . . . . 78 - 87 percent (high-rise buildings). . . . . . . . . . . . . . . . . . . . . . . . . . . . . . . 84 - 95 percent (low-rise buildings)
Building Quality. . . . . . . . . . . . . . . . . . . . . . . . . . . . . . . . . . . . . . . . . Class B or C
Shared Space . . . . . . . . . . . . . . . . . . . . . . . . . . . . . . . . . . . . . . . . . . . . 50 percent
Dedicated Space . . . . . . . . . . . . . . . . . . . . . . . . . . . . . . . . . . . . . . . . . 50 percent
Enclosed Offices . . . . . . . . . . . . . . . . . . . . . . . . . . . . . . . . . . . . . . . 5 - 10 percent
Open Plan Workstations . . . . . . . . . . . . . . . . . . . . . . . . . . . . . . . . 90 - 95 percent
Circulation Factor . . . . . . . . . . . . . . . . . . . . . . . . . . . . . . . . . . . . . . . . 1.45 - 1.65
On the subject of alternative work strategies, careful study of work patterns andprocesses will determine which technique (if any) will suit a particular organization’sneeds. Different areas of business practice require different tools and strategies.
For the implementation of an alternative work strategy to succeed, it is imperative tohave collaborative input from end-users early in the implementation process, as wellas throughout the design process. The input can be in the form of intensiveworkshops, focus groups and/or interviews.
Teaming environments encourage the exchange of ideas and communication.Teaming spaces should be flexible and easy to reconfigure in order to adapt tochanging requirements. All departments are candidates for teaming.
Significant space savings can be realized through the implementation of shared spaceprocedures. Potential candidates for shared space include sales, information services,operations and accounting.
Hotelling is work space that is reserved on a first-call basis. By providing oneworkspace for every 2 to 8 employees, a firm can achieve significant space savings.Potential candidates for hotelling spend a significant amount of time away from theoffice (e.g., at a client base or on the road). These candidates include sales, customerservices and audit.
Team settings, also known as group addressing, is a term that refers to a designatedgroup or team work space for specified periods of time. Team settings often result inincreased productivity and employee satisfaction. Potential candidates for teamsettings include legal, human resources, marketing, research and development, andengineering/design teams.
Activity settings provide a variety of work settings to fit diverse individual or groupactivities, such as a lounge area, desk work area, conference area, telephone workarea, etc. Activity settings encourage interaction across departmental boundaries.Potential candidates for activity settings include marketing, sales, research anddevelopment, and engineering/design teams.

44
Telecommuting can reduce space requirements if employee use of office space canbe held to a minimum. Potential candidates for telecommuting include sales,marketing, research and development, and customer service. Telecommuting is usedby about 60 percent of Lucent’s administrative people to some degree (1 or 2 days aweek). Telecommuting does not reduce real property costs. However, it contributesto worker morale and productivity. Lucent’s office space is specifically designed topromote interaction (small work areas, glass partitions). Working at home(telecommuting) provides “contemplative time” that is simply not available in thecurrent office environment.
Remote telecenters are located near customers and staffed by employees dedicated tothat site or by employees who split their time between that location and another.Potential candidates for remote telecenters include sales and customer service.
Satellite offices are located near employee residences and are used full time byemployees living closest to the satellite site. Potential candidates for satellite officinginclude accounting, operations, audit, legal and marketing.
In virtual officing, employees have the freedom to work anywhere (home, car, plane,or hotel) through the use of portable technology. Potential candidates include sales,legal, research and development, audit and customer service.
For example, Lucent makes use of the “virtual office” concept (hotelling) for salespersonnel. The physical space that supplements the portable technology can be assmall as a “phone booth.” The provision of virtual officing is actually a recruitingtechnique for sales personnel, many of whom do not want to commute to officefacilities far from home.
The virtual office can be used for non-sales functions, depending on the culture andkind of work. For example, Lucent has used it successfully for project managers whospend a lot of time on site and only need office space to write up reports. At Lucent,the use of virtual officing has led to space reductions and associated cost savings.
Wausau Insurance
• Wausau recently adopted four uniform space standards based on position andgrade (but excluding President and Vice-Presidents):
Standard 1 . . . . . . . . . . . . . . . . . . . . . . . . . 12 feet by 12 feet with walls to ceiling
Standard 2 . . . . . . . . . . . . . . . . . . . . . . . . . 8 feet by 12 feet modular
Standard 3 . . . . . . . . . . . . . . . . . . . . . . . . . 8 feet by 8 feet modular
Standard 4 . . . . . . . . . . . . . . . . . . . . . . . . . 8 feet by 6 feet modular
• These standards are part of the firm’s corporate culture; they allow very fewexceptions.
• There is a structural incentive to control space costs because each field office andbusiness center is responsible for expenses through a chargeback system.
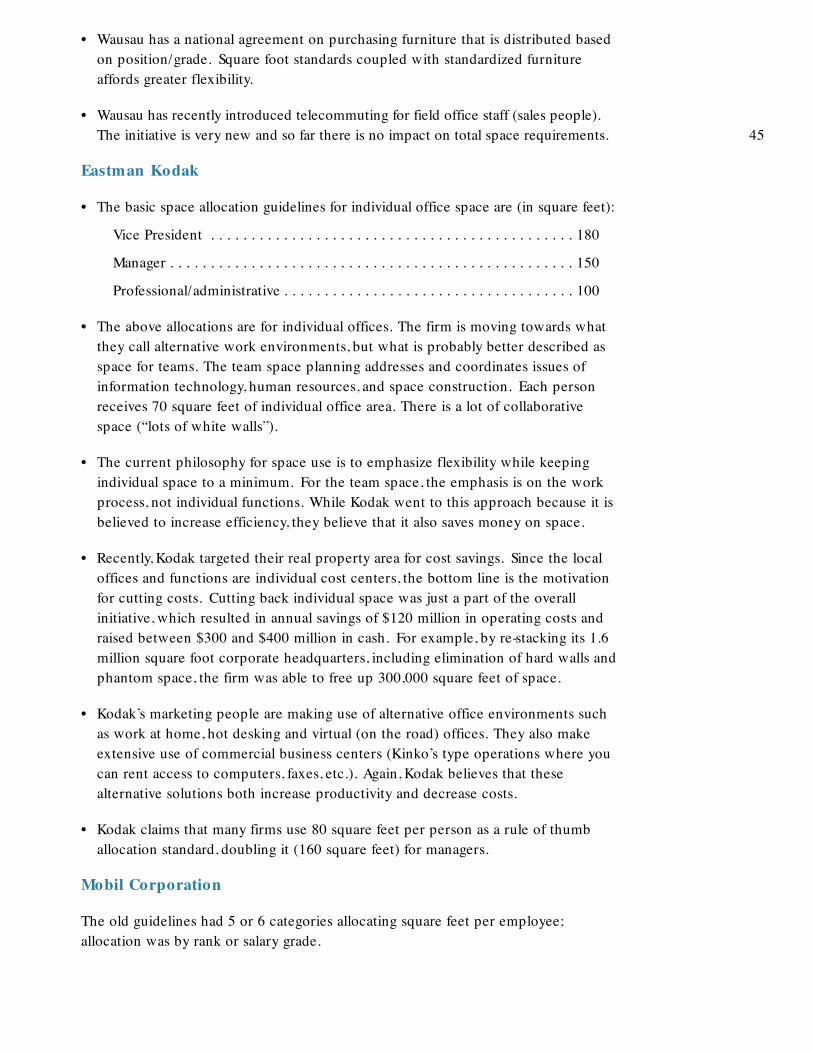
• Wausau has a national agreement on purchasing furniture that is distributed basedon position/grade. Square foot standards coupled with standardized furnitureaffords greater flexibility.
• Wausau has recently introduced telecommuting for field office staff (sales people).The initiative is very new and so far there is no impact on total space requirements.
Eastman Kodak
• The basic space allocation guidelines for individual office space are (in square feet):
Vice President . . . . . . . . . . . . . . . . . . . . . . . . . . . . . . . . . . . . . . . . . . . . . 180
Manager . . . . . . . . . . . . . . . . . . . . . . . . . . . . . . . . . . . . . . . . . . . . . . . . . . 150
Professional/administrative . . . . . . . . . . . . . . . . . . . . . . . . . . . . . . . . . . . . 100
• The above allocations are for individual offices. The firm is moving towards whatthey call alternative work environments, but what is probably better described asspace for teams. The team space planning addresses and coordinates issues ofinformation technology, human resources, and space construction. Each personreceives 70 square feet of individual office area. There is a lot of collaborativespace (“lots of white walls”).
• The current philosophy for space use is to emphasize flexibility while keepingindividual space to a minimum. For the team space, the emphasis is on the workprocess, not individual functions. While Kodak went to this approach because it isbelieved to increase efficiency, they believe that it also saves money on space.
• Recently, Kodak targeted their real property area for cost savings. Since the localoffices and functions are individual cost centers, the bottom line is the motivationfor cutting costs. Cutting back individual space was just a part of the overallinitiative, which resulted in annual savings of $120 million in operating costs andraised between $300 and $400 million in cash. For example, by re-stacking its 1.6million square foot corporate headquarters, including elimination of hard walls andphantom space, the firm was able to free up 300,000 square feet of space.
• Kodak’s marketing people are making use of alternative office environments suchas work at home, hot desking and virtual (on the road) offices. They also makeextensive use of commercial business centers (Kinko’s type operations where youcan rent access to computers, faxes, etc.). Again, Kodak believes that thesealternative solutions both increase productivity and decrease costs.
• Kodak claims that many firms use 80 square feet per person as a rule of thumballocation standard, doubling it (160 square feet) for managers.
Mobil Corporation
The old guidelines had 5 or 6 categories allocating square feet per employee;allocation was by rank or salary grade.
45

The current space allocation standards are based on function (these are maximumsizes, in square feet per person):
• 75 . . . . . . . . . . . . . . . . . . . . . . . . . . . . . . . . . . . . . . . . . . . . . . . workstation
• 150 . . . . . . . . . . . . . . . . . . . . . . . . . . . . . . . . . . . . . . . . . . . . . . . . . . . . office
• 300 . . . . . . . . . . . . . . . . . . . . . . . . . . . . . . . . . . . . . . . . . . . . . . . . . . . . office
The idea behind the standards is to maintain a 2:1 ratio to minimize the costsassociated with churn (normal moving around and reconfiguring). A 300 square footoffice can be turned into two 150 square foot offices by removing the common wall,a 150 square foot office can be turned into two 75 square foot workstations, etc.
Like the Federal Government, Mobil downsized staff significantly (more than 30percent) but did not see a proportional decrease in space. Part of the answer wasthat contractors were hired as staff was laid off, using the same space as the formeremployees. Mobil also decided to tighten their space standards, and to consider usersof the space, not just FTE. The facilities staff could not “take credit” for reduced spaceattributable to reduced staff; they could only take credit for reduced spaceattributable to tighter individual space allocation standards.
Mobil’s overall space per person was in the range of 250 to 300 square feet perperson. Mobil decided to target a 20 percent cut to an approximate topside numberof 225 square feet per person.
Mobil attained the 20 percent cut in space using the following methods:
• reducing the size of individual workspaces and offices
• collocation policy when geographically feasible to eliminate duplicate support spaces
• using hotelling and team spaces for marketing employees
• standardizing office and workstation sizes (churn issue discussed above)
• dramatic shift towards open office plans
The ratio of closed to open office space layouts used to range from 60:40 to as highas 80:20. This has completely turned around, with the ratio currently as low as 8:92in one location. The closed/open ratio in the corporate headquarters building wentfrom 70:30 to 35:65.
When planning new space, a planning factor of 35 percent is added to theworkstation allocations which includes circulation and a design contingency.
Mobil made use of virtual officing to an extent years ago since it’s more efficient forcertain types of workers.
Regarding team space, it sometimes reduces space (for business teams who alwayswork that way) but often does not (e.g., project teams for exploration or research,who are brought together for 6 months to 2 years but still maintain primaryworkstations).
46
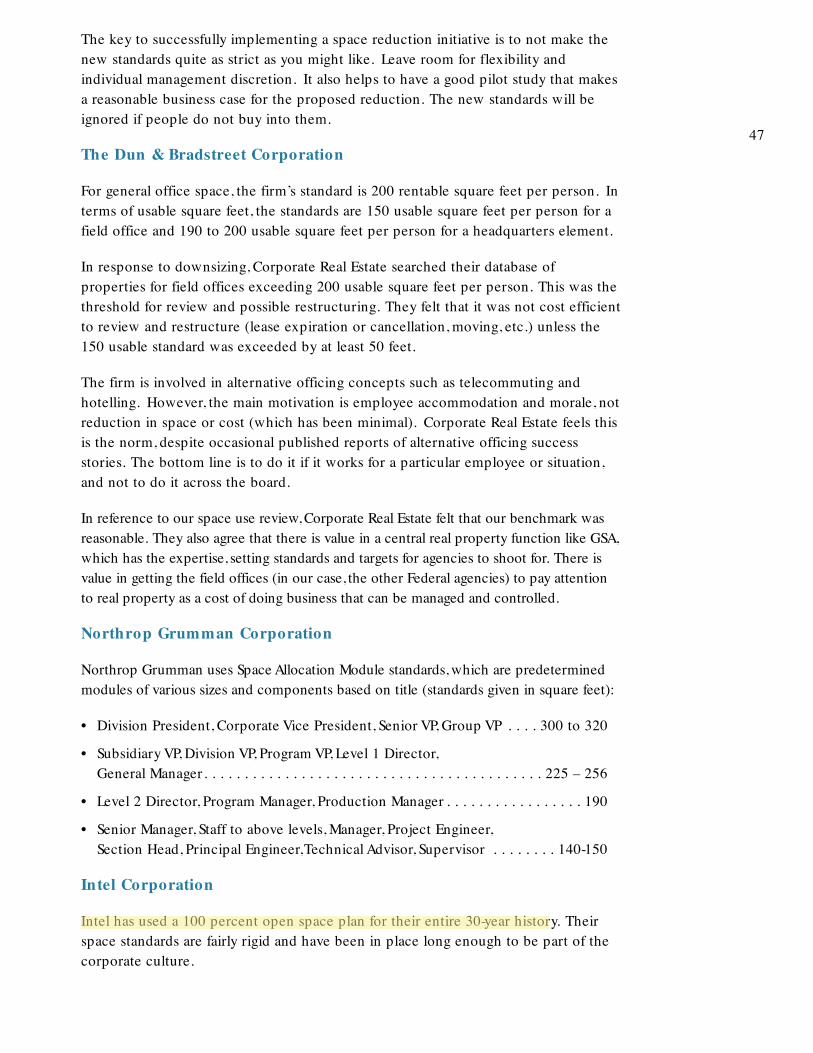
47
The key to successfully implementing a space reduction initiative is to not make thenew standards quite as strict as you might like. Leave room for flexibility andindividual management discretion. It also helps to have a good pilot study that makesa reasonable business case for the proposed reduction. The new standards will beignored if people do not buy into them.
The Dun & Bradstreet Corporation
For general office space, the firm’s standard is 200 rentable square feet per person. Interms of usable square feet, the standards are 150 usable square feet per person for afield office and 190 to 200 usable square feet per person for a headquarters element.
In response to downsizing, Corporate Real Estate searched their database ofproperties for field offices exceeding 200 usable square feet per person. This was thethreshold for review and possible restructuring. They felt that it was not cost efficientto review and restructure (lease expiration or cancellation, moving, etc.) unless the150 usable standard was exceeded by at least 50 feet.
The firm is involved in alternative officing concepts such as telecommuting andhotelling. However, the main motivation is employee accommodation and morale, notreduction in space or cost (which has been minimal). Corporate Real Estate feels thisis the norm, despite occasional published reports of alternative officing successstories. The bottom line is to do it if it works for a particular employee or situation,and not to do it across the board.
In reference to our space use review, Corporate Real Estate felt that our benchmark wasreasonable. They also agree that there is value in a central real property function like GSA,which has the expertise, setting standards and targets for agencies to shoot for. There isvalue in getting the field offices (in our case, the other Federal agencies) to pay attentionto real property as a cost of doing business that can be managed and controlled.
Northrop Grumman Corporation
Northrop Grumman uses Space Allocation Module standards, which are predeterminedmodules of various sizes and components based on title (standards given in square feet):
• Division President, Corporate Vice President, Senior VP, Group VP . . . . 300 to 320
• Subsidiary VP, Division VP, Program VP, Level 1 Director,General Manager . . . . . . . . . . . . . . . . . . . . . . . . . . . . . . . . . . . . . . . . . . 225 – 256
• Level 2 Director, Program Manager, Production Manager . . . . . . . . . . . . . . . . . 190
• Senior Manager, Staff to above levels, Manager, Project Engineer,Section Head, Principal Engineer,Technical Advisor, Supervisor . . . . . . . . 140-150
Intel Corporation
Intel has used a 100 percent open space plan for their entire 30-year history. Theirspace standards are fairly rigid and have been in place long enough to be part of thecorporate culture.

Within the last 5 years, Intel examined the “uni-office” concept, which is one size fitsall. This would provide benefits such as limited configurations and standardized parts.Intel found a need for multiple office sizes, but they did move from grade-based tomore functionally based criteria.
The standards are (in square feet): Standard size . . . . . . . . . . . . . . . . . . . . 72
Managers (5 or more direct reports) . . 96
Cooperative students (Co-ops),technicians, contractors . . . . . . . . . . . . 48
Two co-ops, technicians or contractors can also share a 72 square foot work area.
Intel has found these standards to be space effective. They have kept move costs low,despite a high churn rate.
Sandia National Laboratories
• Sandia prioritizes space allocation on the basis of the programs identified in theirStrategic Business Plan.
• Sandia has recently implemented a system of space chargebacks.
• SNL’s space goal is to average less than 115 net square feet of primary office space,based on total number of employees.
• The following are the maximum allowable allocations in net square feet based onthe existing configuration of offices. As renovations occur the standard one-personwork area will be approximately 96 square feet.
Management offices:
Vice Presidents, Directors, and their staffs are provided office suites.
Managers are provided private offices not to exceed 156 net square feet.
Staff offices: One-person office . . . . . . . . . . . . . . . . . . . . . . . . . . . 70 – 143
Two-person office . . . . . . . . . . . . . . . . . . . . . . . . . . . 144 - 210
Three-person office . . . . . . . . . . . . . . . . . . . . . . . . . 211 – 300
• For an open office space (non-cubicle) plan greater than 300 net square feet Sandiaassigns 56 to 96 square feet per person.
• Sandia assigns support space on an as-needed basis consistent with theorganization’s programmatic requirements.
• Sandia determines the proper utilization of laboratory space using a peer review of“line” scientists.
48
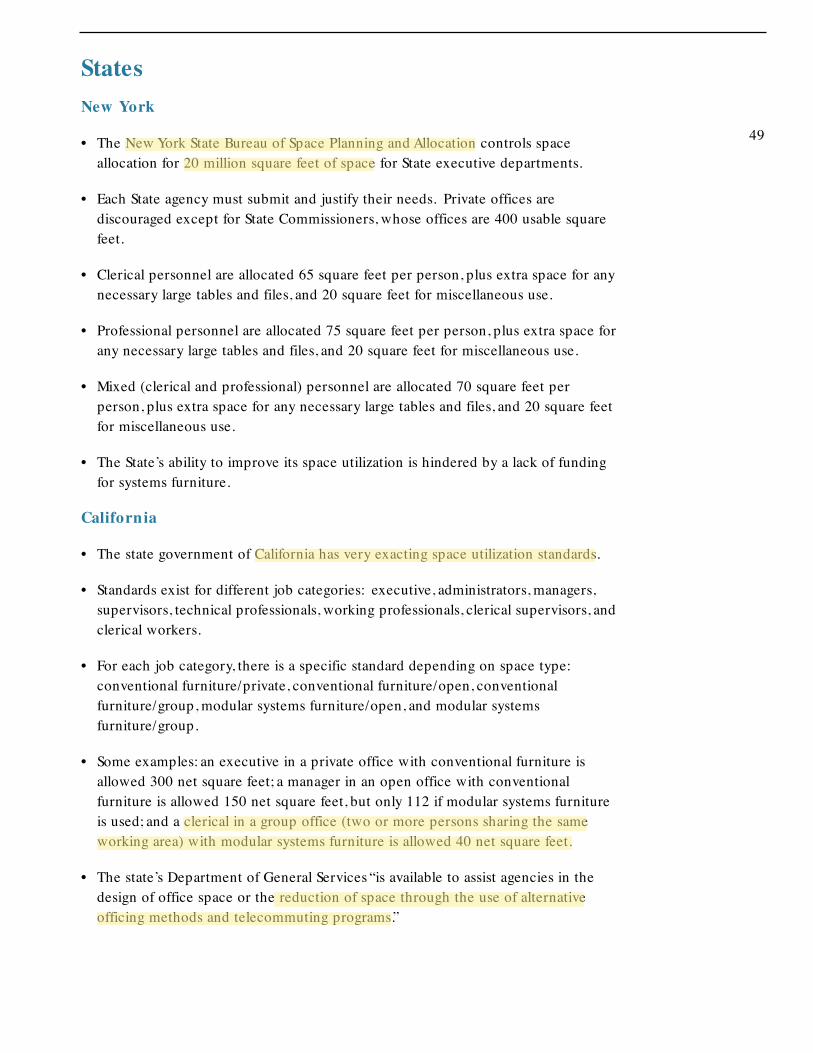
StatesNew York
• The New York State Bureau of Space Planning and Allocation controls spaceallocation for 20 million square feet of space for State executive departments.
• Each State agency must submit and justify their needs. Private offices arediscouraged except for State Commissioners, whose offices are 400 usable squarefeet.
• Clerical personnel are allocated 65 square feet per person, plus extra space for anynecessary large tables and files, and 20 square feet for miscellaneous use.
• Professional personnel are allocated 75 square feet per person, plus extra space forany necessary large tables and files, and 20 square feet for miscellaneous use.
• Mixed (clerical and professional) personnel are allocated 70 square feet perperson, plus extra space for any necessary large tables and files, and 20 square feetfor miscellaneous use.
• The State’s ability to improve its space utilization is hindered by a lack of fundingfor systems furniture.
California
• The state government of California has very exacting space utilization standards.
• Standards exist for different job categories: executive, administrators, managers,supervisors, technical professionals, working professionals, clerical supervisors, andclerical workers.
• For each job category, there is a specific standard depending on space type:conventional furniture/private, conventional furniture/open, conventionalfurniture/group, modular systems furniture/open, and modular systemsfurniture/group.
• Some examples: an executive in a private office with conventional furniture isallowed 300 net square feet; a manager in an open office with conventionalfurniture is allowed 150 net square feet, but only 112 if modular systems furnitureis used; and a clerical in a group office (two or more persons sharing the sameworking area) with modular systems furniture is allowed 40 net square feet.
• The state’s Department of General Services “is available to assist agencies in thedesign of office space or the reduction of space through the use of alternativeofficing methods and telecommuting programs.”
49
• “Existing state-owned or state-controlled space must be utilized before additionalleasing can be considered. Special requirements such as conference, hearing, andtraining rooms will only be provided if suitable alternate facilities are notconveniently available or it is not economical to rent such facilities periodically.”
• All requests for new warehouse or storage space exceeding 2,000 square feet mustbe reviewed.
Virginia
• Primary office space standards for open office plans range from 64 usable squarefeet per person for staff to 96 usable square feet per person for first leveladministrators. Primary office space standards for private offices range from 120usable square feet per person for staff to 256 usable square feet per person fordepartment or agency heads. (Note:Virginia uses usable area as calculated byANSI.)
• Circulation space is added to the above totals: 25 percent if the total office area isless than 50 percent open space, 30 percent if the total office area is 50 percent ormore open office space.
• The standards provide the maximum allowable area and do not constitute astandard to be followed. There is some flexibility from unit to unit, but in no eventshall the aggregate space exceed 250 square feet per person without approval ofthe Division of Engineering and Buildings.
• There are standard allowances for reception areas, conference rooms (30 squarefeet each up to 10 people, 20 square feet each for more than 10 people), interviewareas, training rooms, medical (examining) rooms, break rooms, and standardfurniture and equipment.
• For all other needs, including special type space such as warehouse, retail andstorage, the requesting agency must submit documentation for the approval of theDivision of Engineering and Buildings.
• The state conducted a study a few years ago that suggested leaving the standards as is.
• There is no incentive for an agency to reduce space. Money saved on space goesback to the Virginia treasury. Agencies must go back through the appropriationsprocess to obtain funds to recapture pockets of empty space.
• Currently, there are no space or cost reduction goals in place.
• Many state agencies are turning to the team concept management style, but spaceplanning and utilization have not changed accordingly.
50
Texas
• The baseline space standard is 153 square feet per person. Cost per person is not used.
• The more people in an assignment, the less space per person is allowed. For example,an assignment of 200 people would be allowed 130 square feet per person.
• The average space use statewide (including everything such as libraries, congress,etc.) is currently 234 square feet per person.
• The state owns 5.5 million square feet of space and leases 12 million square feet ofspace. Many of the older state buildings were designed to accommodate 200square feet per person.
• A recently constructed state building contains 70 percent open space built toaccommodate functional groups (teams). The space provides individual cubiclesand a group area.
• Legislation has been proposed which would reduce agency appropriations if spaceuse exceeds 153 square feet per person. Since agencies don’t pay rent for state-owned buildings, the cuts would come out of the agency’s program or operations.Enforcing this would seriously tax the resources (6 people) of the state’s FacilitiesManagement staff.
• Work at home has been initiated for energy savings and employee morale. Thereare no cost savings attributable to work at home. Facilities personnel like theconcept of hotelling, especially in the capital, but they have not been able toconvince others of the concept’s usefulness.
Colorado
• State agencies do not pay for space and the state government is not downsizing;therefore, there is no incentive to reduce space.
• The basic philosophy is to assign uniform workstation sizes according to jobdescription. The space standards manual includes a series of diagrams ranging from35 assignable square feet to 250 assignable square feet. There are also diagrams forvarious support space areas.
• Each assignment is then multiplied by a circulation factor of 1.37 to obtain usablesquare feet, or what is called the allowable tenant area.
• According to state policy, the standards apply to all executive branch groups thatare candidates for relocation, expansion, renewal, or capital construction projects.
• According to state policy, standards are used to set the maximum space allowable.Space assignments smaller than standards permit may be necessitated by existingfurniture, constrained real property budgets and other factors.
51

• According to state policy, where an organizational unit currently occupies morespace than the standards permit, the standards must be applied to the existingspace and the space fully occupied before any lease expansions will be allowed(except in rare instances where minimal tenant improvement costs exceed the costof leasing additional space).
• According to state policy, space allowances for future expansion needs cannot beincorporated into the initial build out or lease commitment. If future growth isjustified it can be considered only through the use of expansion options foradjacent vacant lease space.
• Although standards are employed when space is initially assigned, once a programis in place agencies have a tendency to drift away from the standards.
Florida
We obtained space use standards for the state government of Florida from the state’sDepartment of Management Services’home page.
• Basic space is assigned according to pay grade (in square feet per person):
Pay Grades 0 - 8 . . . . . . . . . . . . . . . . . . . . . . . . . . . . . . . . . . . . . . . . . . . . . . . . 60
Pay Grades 9 - 14 . . . . . . . . . . . . . . . . . . . . . . . . . . . . . . . . . . . . . . . . . . . . . . . 90
Pay Grades 15 and up . . . . . . . . . . . . . . . . . . . . . . . . . . . . . . . . . . . . . . . . . . . 120
Agency Head . . . . . . . . . . . . . . . . . . . . . . . . . . . . . . . . . . . . . . . . . . . . . . . . . 320
Division Director . . . . . . . . . . . . . . . . . . . . . . . . . . . . . . . . . . . . . . . . . . . . . . 270
Bureau Chief . . . . . . . . . . . . . . . . . . . . . . . . . . . . . . . . . . . . . . . . . . . . . . . . . 220
• Allocate positions with unusual requirements an additional 30 square feet each.
• Allow only 40 square feet for positions that are in the office very infrequently.
• Add 20 percent for internal circulation space.
• For reception areas, add 25 square feet each for the average number usually inattendance.
• For conference areas, add 20 square feet each for the average number usually inattendance.
• Add all support areas at unspecified standards (storage, libraries, lounges, machinerooms, etc.)
• For new state-constructed office buildings, the state has developed a prototype build-ing that is adaptable to change. The prototype is a functional building with a standardshell to facilitate flexibility in meeting organizational changes and tenant’s needs.
• The state estimates up to a 40 percent savings in required square footage throughthe use of the open space concept (work areas designated with easily movable
52

53
partitions), leading to reduced rental costs. The open space concept contrasts withthe suite concept (each unit has its own entrance, waiting area, offices and supportareas) and the conventional concept (offices are side by side on either side of ahallway).
North Carolina
The Office of State Property provided information on the state’s space usestandards.
• Office space is allocated based on position or function (in square feet per person):
Agency Head . . . . . . . . . . . . . . . . . . . . . . . . . . . . . . . . . . . . . . . . . . . . 360 to 400
Department Head . . . . . . . . . . . . . . . . . . . . . . . . . . . . . . . . . . . . . . . . 225 to 270
Manager . . . . . . . . . . . . . . . . . . . . . . . . . . . . . . . . . . . . . . . . . . . . . . . 140 to 180
Supervisor . . . . . . . . . . . . . . . . . . . . . . . . . . . . . . . . . . . . . . . . . . . . . . 100 to 120
Professional . . . . . . . . . . . . . . . . . . . . . . . . . . . . . . . . . . . . . . . . . . . . . . 96 to 108
Clerical . . . . . . . . . . . . . . . . . . . . . . . . . . . . . . . . . . . . . . . . . . . . . . . . . . 80 to 96
• Over the past 10 years, the introduction and enforcement of utilization standardshave significantly reduced space. Since the state is not currently in a downsizingmode, they can afford to be more lenient on the standards.
• The state favors open office plans and systems furniture which enables maximumefficiency in space use.
Oregon
The state’s Department of General Services (DGS) provided information on Oregon’sspace use standards.
• Workstation space is allocated by position, ranging from (for systems furniturelayout) 48 square feet for data entry to 96 square feet for a section manager to 280square feet for a director.
• There are different standards for conventional furniture layout. For example, asection manager would receive 150 square feet, which may be in an enclosed office.
• Support space is added to workstation space (30 percent of workstation space forconventional furniture, 45 percent of workstation space for systems furniture).
• Circulation space is added to the previous total of workstation and support (30percent of total for conventional furniture, 60 percent of total for systems furniture).
• Additional special program space can be added on (interview rooms, trainingrooms, computer rooms, bulk storage space, etc.).

• DGS reviews all space assignment requests for compliance with the allocationstandards. Requests that exceed the allowable square footage require writtenjustification.
• According to state policy, the space standards apply to space being remodeled ornewly constructed for use by a state agency. Application of the standards to anexisting facility, where no major alterations are involved, is limited to the extentfeasible and economically practical.
• According to state policy, the “square footages given are not entitlements, but arethe maximum allowed, and shall be based upon actual budgeted FTE only.”
• According to state policy, no space allocation can exceed an average of 200 usablesquare feet per FTE without written justification.
• The standard design approach is open office planning. The objective of this policyis “to reduce future remodeling costs by minimizing floor to ceiling walls withoutincurring major expenses for wall relocation, lighting and power reconfiguration,and air handling equipment modification.”
• The state’s policy encourages the use of systems furniture, which the state estimatescan result in space savings of approximately 20 percent. The state estimates that thecost of these systems can be amortized in 3 to 6 years through rent savings.
Minnesota
The Department of Administration provided information on the state’s spacestandards (all standards are given in square feet per person).
• The space standards for private offices are as follows:
Commissioner . . . . . . . . . . . . . . . . . . . . . . . . . . . . . . . . . . . . . . . . . . . . . . . . 320
Deputy Commissioner . . . . . . . . . . . . . . . . . . . . . . . . . . . . . . . . . . . . . . . . . . 224
Assistant Commissioner . . . . . . . . . . . . . . . . . . . . . . . . . . . . . . . . . . . . . . . . . 168
Manager . . . . . . . . . . . . . . . . . . . . . . . . . . . . . . . . . . . . . . . . . . . . . . . . . . . . . 140
Supervisor . . . . . . . . . . . . . . . . . . . . . . . . . . . . . . . . . . . . . . . . . . . . . . . . . . . 120
Technical/Professional . . . . . . . . . . . . . . . . . . . . . . . . . . . . . . . . . . . . . . . . . . 120
• The space standards for open areas with traditional furniture are as follows:
Manager . . . . . . . . . . . . . . . . . . . . . . . . . . . . . . . . . . . . . . . . . . . . . . . . . . . . . 144
Supervisor . . . . . . . . . . . . . . . . . . . . . . . . . . . . . . . . . . . . . . . . . . . . . . . . . . . 100
Technical/Professional . . . . . . . . . . . . . . . . . . . . . . . . . . . . . . . . . . . . . . . . . . . 80
Clerical. . . . . . . . . . . . . . . . . . . . . . . . . . . . . . . . . . . . . . . . . . . . . . . . . . . . . . . 64
Student Worker/Part Time . . . . . . . . . . . . . . . . . . . . . . . . . . . . . . . . . . . . . . . . . 48
54

• The space standards for open areas with modular furniture are as follows:
Manager . . . . . . . . . . . . . . . . . . . . . . . . . . . . . . . . . . . . . . . . . . . . . . . . . . . . . 140
Supervisor . . . . . . . . . . . . . . . . . . . . . . . . . . . . . . . . . . . . . . . . . . . . . . . . . . . 100
Technical/Professional . . . . . . . . . . . . . . . . . . . . . . . . . . . . . . . . . . . . . . . . . . . 64
Clerical. . . . . . . . . . . . . . . . . . . . . . . . . . . . . . . . . . . . . . . . . . . . . . . . . . . . . . . 64
Student Worker/Part Time . . . . . . . . . . . . . . . . . . . . . . . . . . . . . . . . . . . . . . . . . 36
Note: Add space to the above workstations allocations for special areas, special useareas, unfinished storage, and circulation space (unspecified amounts).
• The state emphasizes open space with modular furniture and discourages privateoffices.
• The state realizes space savings through the use of modular furniture. When theDepartment of Administration receives requests for additional space, they attemptto provide or reconfigure modular workstations instead of automatically leasingnew space.
• There are no incentives to reduce space since agencies don’t get to use the moneysaved for other purposes.
Spurred by legislation requiring agencies to prepare telecommuting plans ifrequesting funds for additional space, the Department of Administration conducted apilot from November 1995 to October 1996. The pilot was a success and will lead toa permanent telecommuting program for the department. The major findings of thepilot were:
• The telecommuting pilot did not demonstrate a reduction in office space use orreduced growth in space requirements. It had no impact on operating costs. Inorder to experience savings, the initiative would have to be dramatically increasedin scope.
• Telecommuting enhances recruitment by making the job more attractive and byexpanding the pool of potential candidates.
• Telecommuting can have a positive, measurable, and immediate effect on theenvironment, the community, and the family.
• There was no reported change in decision-making authority at the point ofcustomer contact, although many participants thought that, in the longer term,telecommuting would offer that opportunity.
• Most of the perceived long-term barriers to telecommuting revolved arounddifficulties with technology, such as remote connectivity.
55

Missouri
The Office of Administration provided information on the state’s space allocationstandards.
• The standards are highly specific and consist of hundreds of pages. Missouri hasdeveloped standards for each state agency, and for each position classificationwithin an agency.
• In general, the standards range from 48 square feet for clerical workers to 216square feet for agency division directors. Middle management receives 120 squarefeet, with professionals averaging 80 square feet. Circulation and support areas arenot included in the personal space standards.
• There are also standard for certain support areas like conference rooms, receptionareas, break rooms and auditoriums.
• With all areas combined, the state’s average is approximately 200 square feet perperson. The state would like to improve this average to 165 to 185 square feet perperson.
• The state is currently renovating an older building which they are consideringusing for hotelling.
GovernmentsCanada
Public Works and Government Services Canada (PWGSC) provided information onCanada’s Office Accommodation Allocation Limits.
• Office space allocation standards exist by office type (general administrative, quasi-judicial, much public contact). There is a variable factor for support area, anallowance for workstation area, and a standard 25 percent of workstation andsupport area inclusion for circulation area.
• For general administrative space assignments, the first 5 FTEs are each allowed 10square meters for support area, 8.3 square meters for workstation area, and 25percent for circulation area (yielding an equivalent standard of 246 square feet).The next 5 FTEs are each allowed the equivalent of 192 square feet, with theremaining FTE allowed 170 square feet each.
• The standards clearly state that the “limit does not establish or imply a minimumworkstation entitlement, and consideration should be given in each project to thepotential to meet requirements in less space.”
• The standards discuss special purpose space, but there are no set quantitativeallowances. Space allocation is funded when supported by a business case and “only
56

within the minimum functional space required to meet the operational needs of theusers of the facility.” Approval of business cases rests with the regional offices.
• PWGSC will provide common-use areas (boardrooms, libraries, training andconference rooms, etc.) in multi-tenant facilities based on population andeconomies of scale. Once again, there are no specific quantitative standards.
• PWGSC does have separate standards for executive offices ranging from 18.5usable square meters (206 square feet) to 37 usable square meters (411 squarefeet) for deputy heads of departments and agencies.
PWGSC conducted a study in 1994 to measure and report on the total andcomparative use of office space across the Canadian government. PWGSC houses167,000 people in more than 4,000 owned and leased facilities totaling over 42.8million square feet of space. PWGSC worked with their major client agencies toverify their space use, costs, and the number of people occupying the space. PWGSCthen cross-referenced the information with data in their own Facilities InventorySystem. The study focused on three measures: annual cost per square meter; annualcost per person; and space per person. (Note: below figures provide square footequivalents; however, costs are given in 1994 Canadian dollars.)
The findings on annual cost per square meter were:
• The annual space cost was found to be $219 per rentable square meter (or $20.35per rentable square foot).
• The Canadian annual space cost compared favorably with the Canadian privatesector cost of $247 per rentable square meter (or $22.95 per rentable square foot).
• The Canadian annual space cost compared favorably with the Australian governmentcost of $233 per rentable square meter (or $21.65 per rentable square foot).
• The Canadian annual space cost was greater than the U.S. government’s cost of$195 per rentable square meter (or $18.12 per rentable square foot).
• The space categorized as “office” includes normal workstation space, support areas,meeting and boardrooms, circulation corridors, and special purpose space such asquasi-judicial hearing rooms, public interface areas, and task force and RoyalCommission space.
• The definition of office space does not include warehouse and dedicated storagespace, laboratory space, and other facilities which are not subject to office spaceuse standards.
The findings on space per person were:
• The Canadian national average of rentable space used per person (FTE) was 23.8rentable square meters per FTE (or 256 square feet per person).
• The Canadian annual space use was roughly equivalent to the Canadian private
57
sector space use of 23.3 rentable square meters per FTE (or 251 rentable squarefeet per person).
• The Canadian national average of rentable space used per FTE compared favorablywith the Australian government average of 24.8 rentable square meters per FTE (or267 rentable square feet per person).
• The Canadian national average of rentable space used per FTE was greater than theU.S. government average of 21.0 rentable square meters per FTE (or 226 rentablesquare feet per person).
• The study involved verifying population data with the client agencies to updatenational inventory records and to take accurate account of major governmentrestructuring that had occurred.
• As a matter of policy, the Canadian government does not provide space forconsultants or contractors; they are not included in the population figures.
• Some departments appear to be using more than the national average space perperson, when in fact they require that space to meet the operational requirementsof their program mandates.
• Some departments appear to be using much less than the national average spaceper person because they are engaged in processing type operations that requireless space.
The findings on cost per person were:
• The Canadian national average for office space cost per FTE was $5,220 (in 1994Canadian dollars).
• The Canadian cost per FTE compared favorably with the Canadian private sectorcost per person of $5,842.
• The Canadian cost per FTE compared favorably with the Australian governmentcost per person of $5,537.
• The Canadian cost per FTE was greater than the U.S. government cost per personof $4,129.
Some other findings of the study were:
• There was a direct correlation between the size of an assignment and how spaceefficient the assignment was. (This may help explain the consistently betternumbers for the U.S. government, which probably has a greater number of largeassignments as well as additional economies of scale.)
• For a number of departments, space for specific uses such as hearing rooms orpublic interaction areas were included as office space. This skewed the data interms of assessment of more traditional office use.
58

• Some of the Canadian departments have mandates that require that they supplyspace to other levels of government, which also distorts the data.
• Departments that require a high degree of confidentiality tend to need a highernumber of closed offices, a factor that tends to increase space utilization.
• PWGSC anticipated changes in the data as a result of future restructuring anddownsizing, and the introduction of alternative work environment solutions suchas hotelling, telework, and space sharing initiatives.
Some other interesting information from PWGSC:
• Canadian Treasury directed a 10 percent reduction in space over 5 years. It wasfelt that this was feasible due to dramatic downsizing, technology, use of sharedworkspace, and more efficient design and layout concepts. The 10 percentreduction was roughly comparable to the announced reductions in departmentaloperating budgets. Most large occupancies were for 5-year periods and expired ona cyclical basis. PWGSC felt that the best case scenario for space recapture wastenant relocation in conjunction with lease expiration.
• PWGSC developed a spreadsheet to target individual agency reductions. Thisapproach made use of weighted, client-specific targets rather than across the boardreductions that punish efficient space users as much as inefficient space users.PWGSC claims success for this effort.
• Most agencies do not pay rent, as in our Federal Buildings Fund system. Forincentives, PWGSC makes available to agencies that reduce space the funds thatwould otherwise be expended on the space. If clients fail to achieve theirreduction targets, they must reimburse PWGSC for the excess space. Certainclients do pay rent. In their case, the same incentives and disincentives applyduring the budget process because Treasury supports the utilization targets.
• At the same time as the space reduction initiative, extensive downsizing occurredas the size of the federal public service was reduced by 20 percent over 3 years.This is a separate issue and PWGSC tracked this reduction separately. PWGSCstresses the importance of specifying space savings achieved through downsizingversus space savings achieved through more efficient space standards.
• PWGSC reports that total inventory is reducing very slowly but they expect thatactual tenant-occupied space will reduce more quickly. In other words, the spacereduction effects of downsizing will show up first in vacancy rates before,somewhere down the road, being reflected in disposal of assets or termination ofleases.
• PWGSC believes that the optimum benchmarks for our study are with othergovernments, since disparities between government and the private sectoroutweigh cultural differences among Western democratic governments. TheCanadian government sector provides parallels for courthouses, border stations andstate governments (provinces), whereas the private sector does not.
59

Australia
In 1975 the Department of Administrative Services (DAS) introduced theCommonwealth Office Accommodation Guidelines. They were based on an overallplanning figure of 10 square meters per person (which did not include circulationspace), or approximately 108 square feet per person.
In 1986, the guidelines were revised and the government adopted a “building block”approach rather than an “absolute” planning figure. Clients could assess theirrequirements across all functions and develop an accommodation profile that suitedtheir particular operational needs. In a building block approach, for example, oneallocates space for a desk, side table, filing cabinets, computer stand, and minimumallowances per person for meeting, training, public access space, etc.
As the management of government became less centralized, several problems relatingto the management of real property became evident:
• There is a lack of accountability for money spent on real property outside of theindividual department or agency.
• There is a lack of visibility of the real cost of the property management function,including the cost of in-house staff.
• Smaller departments and agencies lack the expertise to manage their real propertyholdings in a professional manner.
As a result, there is a move to revisit space accommodation standards. DAS iswrestling with the familiar problem of trying to achieve more efficient space usegovernmentwide while maintaining a decentralized management structure. Some ofthe obstacles foreseen by DAS:
• There is currently a lack of strategic real property planning by each and everydepartment and agency. “This appears to be an area where Ad Hocery is rampant.”
• Although there is a basic understanding of accommodation issues, most agencieslack understanding of strategic real property issues and the need to apply thephilosophy of “Total Asset Management” to real property.
• Only a few major departments have the in-house re-sources to develop their ownaccommodation standards.
• Agencies and departments do not recognize that real property is a vital input totheir core business of program delivery.
In order to ensure more efficient space use in a “devolved” government managementstructure, DAS foresees a need for the following:
• Responsibility must be accompanied by true accountability through the use ofperformance measurement and benchmarking to point the way to continuousimprovement. There must also be total visibility of cost.
60
• Departments and agencies must have the intellectual tools and capabilities tomanage their own real property operations including access to industry bestpractices through the publication of real property guidelines.
• Each department and agency must develop a strategic real property plan including details on current usage, proposed future usage, and financial and otherimpacts.
• The strategic real property plans should be reviewed centrally and consolidated inan annual report.
DAS has tried to assure efficient space by requiring strategic real property planningfrom the individual departments and agencies:
• Property operating expenses are treated as part of overall running costs. Once thedepartment’s accommodation profile has been established, a strategic propertyplan developed and a base level of funding agreed to (subject to an inflationfactor), the department doesn’t get any more funds.
• In an era of downsizing, each department must incorporate a strategy and planningtimetable for dealing with accommodations issues using a range of initiatives (sale,subleasing, alternative government uses) into its strategic property plan.
DAS used a new approach in fitting out their own new offices:
• Everyone from the CEO down is in open space with exactly the same personalspace allocation.
• There are a lot of enclosed meeting rooms that are available to all personnel fordiscussions, quiet work areas, etc.
• There are lounge settings sprinkled throughout the office for report reading orhaving an informal meeting.
• There are large team tables in each area for team-based discussions, spreading out abunch of files or papers, etc.
• Innovative use of storage features directs traffic and isolates open areas that can beused for larger meetings (complete with drop down screens for presentations).
• Effective acoustics make for a normally quiet environment around workstations.
• The fit-out looks professional and DAS achieved a planning figure of 14.5 squaremeters (or 156 square feet) per person. This is compared to a range for otherCommonwealth Government departments of 16 to 28 square meters (or 172 to301 square feet) per person.
We asked DAS for suggestions on how GSA can monitor real property transactionswithout being a central manager:
61
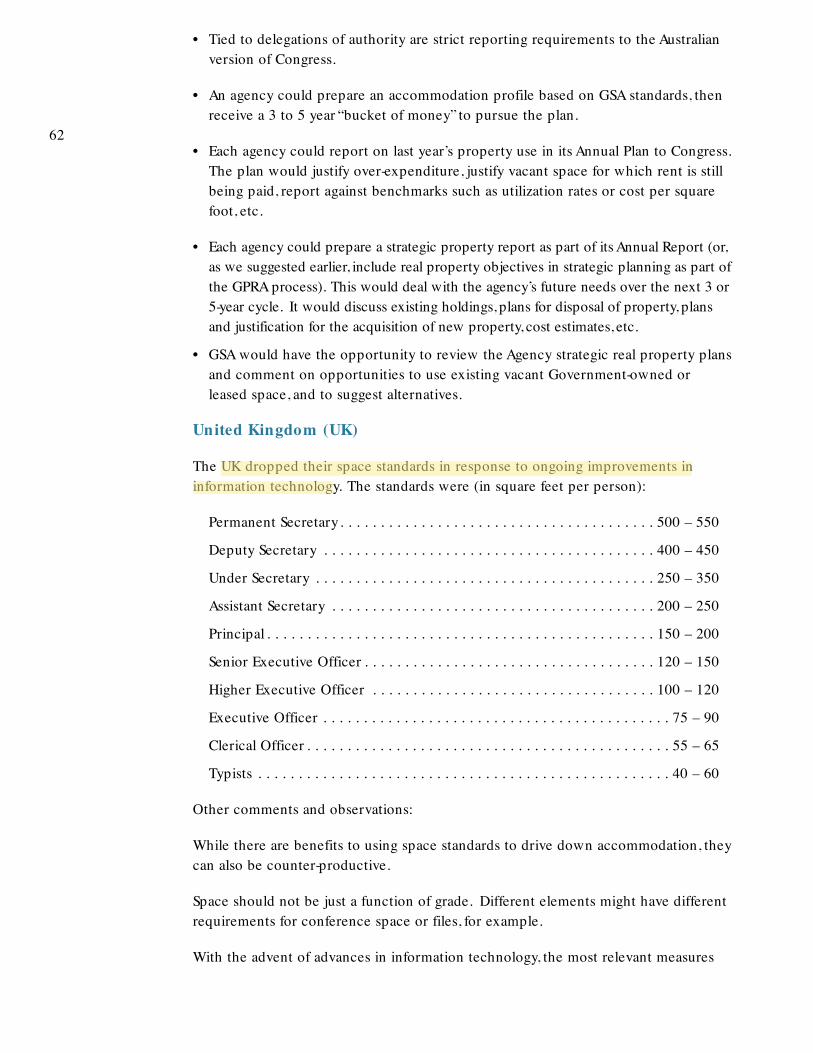
• Tied to delegations of authority are strict reporting requirements to the Australianversion of Congress.
• An agency could prepare an accommodation profile based on GSA standards, thenreceive a 3 to 5 year “bucket of money” to pursue the plan.
• Each agency could report on last year’s property use in its Annual Plan to Congress.The plan would justify over-expenditure, justify vacant space for which rent is stillbeing paid, report against benchmarks such as utilization rates or cost per squarefoot, etc.
• Each agency could prepare a strategic property report as part of its Annual Report (or,as we suggested earlier, include real property objectives in strategic planning as part ofthe GPRA process). This would deal with the agency’s future needs over the next 3 or5-year cycle. It would discuss existing holdings, plans for disposal of property, plansand justification for the acquisition of new property, cost estimates, etc.
• GSA would have the opportunity to review the Agency strategic real property plansand comment on opportunities to use existing vacant Government-owned orleased space, and to suggest alternatives.
United Kingdom (UK)
The UK dropped their space standards in response to ongoing improvements ininformation technology. The standards were (in square feet per person):
Permanent Secretary. . . . . . . . . . . . . . . . . . . . . . . . . . . . . . . . . . . . . . . 500 – 550
Deputy Secretary . . . . . . . . . . . . . . . . . . . . . . . . . . . . . . . . . . . . . . . . . 400 – 450
Under Secretary . . . . . . . . . . . . . . . . . . . . . . . . . . . . . . . . . . . . . . . . . . 250 – 350
Assistant Secretary . . . . . . . . . . . . . . . . . . . . . . . . . . . . . . . . . . . . . . . . 200 – 250
Principal . . . . . . . . . . . . . . . . . . . . . . . . . . . . . . . . . . . . . . . . . . . . . . . . 150 – 200
Senior Executive Officer . . . . . . . . . . . . . . . . . . . . . . . . . . . . . . . . . . . . 120 – 150
Higher Executive Officer . . . . . . . . . . . . . . . . . . . . . . . . . . . . . . . . . . . 100 – 120
Executive Officer . . . . . . . . . . . . . . . . . . . . . . . . . . . . . . . . . . . . . . . . . . . 75 – 90
Clerical Officer . . . . . . . . . . . . . . . . . . . . . . . . . . . . . . . . . . . . . . . . . . . . . 55 – 65
Typists . . . . . . . . . . . . . . . . . . . . . . . . . . . . . . . . . . . . . . . . . . . . . . . . . . . 40 – 60
Other comments and observations:
While there are benefits to using space standards to drive down accommodation, theycan also be counter-productive.
Space should not be just a function of grade. Different elements might have differentrequirements for conference space or files, for example.
With the advent of advances in information technology, the most relevant measures
62
are space per workstation and cost per workstation. Multi-occupancy with hotdesking and some staff working at home plus the introduction of new technology allserve to limit the number and potentially the size of workstations required.
Netherlands
The Dutch Government Buildings Agency (GBA) provided information on space usestandards for the national government:
• They use a square meters per person standard. Under the old policy, this wasbased on salary scale. The current policy relates space allocation to the type ofwork. They are considering moving towards a policy based on type of work andattendance needed at the office.
• Currently, agencies do not pay for use of space. However starting in January 1999,agencies will begin paying for space.
• GBA provided a copy of the actual space standards. Unfortunately, the publicationis written in the Dutch language. However, it is clear that the standards are,consistent with our findings, given in square meters per person. The actualnumbers seem to be comparable to the square meters per person standardsreported by Canada and Australia.
• GBA focuses on user requirements as they relate to building features andcapabilities. They believe that it is not the individual space’s characteristics thatadd value, but the availability of space and service - people need to interact. It isimportant that space accommodates present needs and has the potential to satisfyfuture needs, and it must effectively support the business process. GBA stressescontinuous interaction with clients and they have account managers for thedifferent ministries.
• Alternative officing needs to be promoted using management themes of lowerspace cost and improved performance. (GBA is not yet able to document wheredollars have been saved but they are working on a proposal).
• GBA monitors space and provides agencies with information on building use. Forexample, they provide information on how to improve communication, attendanceand occupancy rates. They provide management information on which to base realproperty decisions.
• GBA analyzes housing needs from different perspectives:
Sector analysis -- what’s happening in a given ministry and its effect on housing(long-term)
Client brief -- survey of all functions within the organization, linked to the numberof functions and the kind of space needed for each
Housing analysis -- looks at various solutions to a housing requirement and clienthelps decide (renovate existing, different accommodation, cost associated with each)
63

Alberta, Canada
Alberta Public Works, Supply and Services (APWSS) provided information on Alberta’sspace use standards.
• APWSS is responsible for approximately 21.5 million square feet of owned spaceand 5.5 million square feet of leased space. Office space totals about 10.5 millionrentable square feet or about 40 percent of government space. Office spacerepresents about 90 percent of leased space.
• Workstation standards are based on function and status (in square feet per person):
Executive Management . . . . . . . . . . . . . . 290 . . . . . . . . . . . (private)
Senior Management/Directors . . . . . . . . . 190 . . . . . . . . . . . (private)
Mid Level Managers . . . . . . . . . . . . . . . . . 160 . . . . . . . . . . . (open plan individual)
Senior Professional/Supervisor . . . . . . . . . 130 . . . . . . . . . . . (open plan individual)
Technical/Professional . . . . . . . . . . . . . . . . 95 . . . . . . . . . . . (open plan individual)
Senior Clerical/Secretarial . . . . . . . . . . . . . 85 . . . . . . . . . . . (open plan shared)
General Clerical. . . . . . . . . . . . . . . . . . . . . 85 . . . . . . . . . . . (bullpen)
• Client departments do not pay for accommodations. Non-government users (boyscouts, etc.) pay less than fair market value but a Minister has to sponsor them andit is reflected against his department. To keep clients aware of the cost of space,PWSS issues an annual accommodation cost report.
• Accommodation costs are very visible because they are included in an individualMinister’s annual budget. The Auditor General and Ministry make comparisons.
• Rather than forcing payment, Alberta believes they can achieve the same ends byadvising agencies on how they can improve space use and cost. (For example, theymight advise an agency to consolidate and move into a less expensive facility.APWSS has been able to obtain funding for such consolidations by proving that yousave in the end - “you have to spend money to save money”).
• Over the past four years the government went through a total reorganization.Based on estimates of the amount of space that would be surplus to governmentrequirements in light of downsizing, Alberta established a space reduction goal ofapproximately 5 million square feet to be accomplished by March 1998.
• Representing a shift in focus from reduction in space to effective utilization of space,Alberta recently established an average density target of 366 square feet of rentable areaper employee to be achieved by the end of the 1998-1999 fiscal year. Currently, thedensity across government office accommodation is 441 square feet per employee.
• The following information was abstracted from Benchmarking Surveys comparingspace management practices across a sample of Canadian public and privateorganizations of which APWSS was a participant.
64

65
Average Space Standards for all Participants in Square Feet
Work s tations . . . . . . . . . . . . . . . . . . . . 1 9 9 7 . . . . . 1 9 9 6 . . . . . 1 9 9 5
Executive Management . . . . . . . . . . . . . . . . . . . . 317 . . . . . . . 323 . . . . . . . 354
Senior Manager . . . . . . . . . . . . . . . . . . . . . . . . . . 198 . . . . . . . 215 . . . . . . . 255
Mid-Level Managers . . . . . . . . . . . . . . . . . . . . . . . 159 . . . . . . . 161 . . . . . . . 202
Sr. Professionals/Supervisors . . . . . . . . . . . . . . . . 116 . . . . . . . 118 . . . . . . . 148
Technical/Professional. . . . . . . . . . . . . . . . . . . . . . 98 . . . . . . . . 97 . . . . . . . 131
Sr. Clerical/Secretarial . . . . . . . . . . . . . . . . . . . . . . 90 . . . . . . . . 86 . . . . . . . 111
General Clerical . . . . . . . . . . . . . . . . . . . . . . . . . . 76 . . . . . . . . 75 . . . . . . . 101
The 1997 benchmarking survey indicated the following on the subject of AlternativeWork Strategies:
• The trend towards less square footage per workstation/occupant will continue asorganizations focus on cost savings from functionally designed workplaces andcontinue to respond to new ways of working.
• Alternative officing strategies will increasingly change the design of workenvironments, including the move away from the concept of my desk to anyone'sdesk. There will be fewer dedicated workspaces and increased use of generic spacetypes.
• Both the public and private sectors expect the use of alternative officing strategiesto triple by the year 2000.
• In the short term additional costs will be incurred to create the appropriateinfrastructure that will allow alternative officing practices to take place.
• New infrastructure will include training for both employees and managers, thedevelopment of policies and procedures for the new ways of working, and thespecification and supply of different types of furniture and equipment.
• Once infrastructure is in place, increased use of alternative officing strategies isexpected to reduce space requirements and increase employee productivity andflexibility.

Federal AgenciesUnited States Postal Service (USPS)
USPS published a space requirements handbook which includes very exactingstandards for all types of space use. Although most of it applies to specialized USPSspace, there are some relevant comparisons for office space in major facilities thatrequire administrative space:
• Private office space allocations for management staff range from 120 square feet fora supervisor to 270 square feet for an area vice president. Each category ofmanager (except for supervisor) also has an accompanying allowance for asecretary/reception area ranging from 75 to 225 square feet.
• Private offices are provided for certain human resources positions requiringconfidentiality at 120 square feet each. Additional conference rooms for remaininghuman resources staff are provided at 120 square feet each.
• Primary office space is allocated to staff at 100 square feet each and secretaries at75 square feet each. This allocation is reduced by 30 percent if the office usesmodular or systems furniture.
• There are specific space allocation standards for files, office supplies, conferenceareas, library and reference areas, mail room/photocopy centers, lunch/breakrooms, information systems/wiring, and employee assistance and training.
• For example, the standards provide 150 square feet for a library/reference area forthe first 50 administrative employees, and an additional 50 square feet for eachadditional increment of 50 employees up to 250 square feet maximum.
Tennessee Valley Authority (TVA)
The standards are in square feet per person:
Executive . . . . . . . . . . . . . . . . . . . . . . . . . . . . . . . . . . . . . . . . . . . . . 350 to 370
Vice President . . . . . . . . . . . . . . . . . . . . . . . . . . . . . . . . . . . . . . . . . . 230 to 250
Direct Report to VP or higher . . . . . . . . . . . . . . . . . . . . . . . . . . . . . . 140 to 160
Supervisor . . . . . . . . . . . . . . . . . . . . . . . . . . . . . . . . . . . . . . . . . . . . . . 95 to 115
All Others . . . . . . . . . . . . . . . . . . . . . . . . . . . . . . . . . . . . . . . . . . . . . . 50 to 80
TVA tries to reduce the high cost of churn (employees moving to new workstationsdue to reorganization or job changes) by using the following “planning concepts”:
• Evaluate specific function types.
• Incorporate unit assembly construction.
• Consider levels of flexibility: versatility, convertibility, and expandability.
66

67
• Simplify and reduce building general and systems furniture standards.
• Incorporate modular office/conference guidelines.
• Consider the building grid modular guidelines.
• Reduce electrical and telecommunications costs by using a fixed utility spine andsystems furniture standards.
• Move people, not walls.
Other notes of interest:
• TVA provides an open space environment and they have layouts to accommodatethe team concept.
• TVA continues to downsize. They are looking for additional ways to consolidate inorder to terminate additional leases.
National Aeronautics and Space Administration (NASA)
The following information on NASA’s space standards is from their “FacilitiesUtilization Program Implementation Handbook”:
• For general office space planning, 110 net useable square feet per person is the“optimum office density,”within a range of 95 to 125 net useable square feet perperson.
• An average density factor outside this range can be supported by the gradestructure of the personnel housed, special office equipment, or internal circulationspace.
• The handbook cautions that “ceaseless efforts to conform to rigid density standardscan result in continuous and costly adjustments to space allocation.”
• There are more efficient standards for facilities that accommodate systemsfurniture (square feet per person, including circulation):
• General Staff. . . . . . . . . . . . . . . . . . . . . . . . . . . . . . . . . . . . . . . . . . . . . . . . 88
• Supervisors, Senior Staff, GS-13/14 . . . . . . . . . . . . . . . . . . . . . . . . . . . . . . 132
• Secretaries to Supervisor . . . . . . . . . . . . . . . . . . . . . . . . . . . . . . . . . . . . . 108
• Managers/GS-15 . . . . . . . . . . . . . . . . . . . . . . . . . . . . . . . . . . . . . . . . . . . . 165
• Secretaries to Managers . . . . . . . . . . . . . . . . . . . . . . . . . . . . . . . . . . . . . . 132
Department of Commerce
• Commerce does not have their own policy on space use standards.
• Commerce leases most of their “vanilla”office space through GSA. They adhere tothe FPMR standards as discussed earlier.

68
• Non-GSA space tends to be technical facilities for agencies like NOAA. There areno associated space standards.
• Commerce has their own leasing authority to support the 2000 Census. There areno associated space standards for this temporary need.
Internal Revenue Service (IRS)
In 1994, IRS developed national workspace furniture and occupancy standards for itsComputing Centers, Customer Service Centers, District Offices, and SubmissionProcessing Sites. GSA approved the standards, which were developed in conjunctionwith the Tax System Modernization effort. The standards emphasize ergonomics and ahealthy and productive work environment.
The standards for a District Office are based on job classification (occupiable squarefeet):
Paraprofessional (e.g., tax examiner). . . . . . . . . . . . . . . . . . . . . . . . . . . . . . . . 70
Technical/Professional (e.g., revenue agent) . . . . . . . . . . . . . . . . . . . . . . . . . . 85
Technical/Professional (e.g., management analyst) . . . . . . . . . . . . . . . . . . . . 110
Technical/Professional (e.g., computer specialist) . . . . . . . . . . . . . . . . . . . . . 135
Secretarial/Clerical . . . . . . . . . . . . . . . . . . . . . . . . . . . . . . . . . . . . . . . . . . . . 110
Specialized (e.g., tax auditor) . . . . . . . . . . . . . . . . . . . . . . . . . . . . . . . . . . . . 150
Managerial/Supervisory . . . . . . . . . . . . . . . . . . . . . . . . . . . . . . . . . . . . . . . . 145
These workspace furniture standards define the square footage allocation forpersonnel office space. Office support space and special space are added per GSAspace classification guidelines to determine the overall space requirements for eachoperating site.
The National Occupancy Standards document indicates that the largest single issueaffecting the future District Office is the level of participation with respect toalternative work locations (work at home and hotelling). If assumptions hold true,there will be a dramatic effect on the Districts' overall space requirements.

Th e follow ing references / s ources were of significant value to our reviewand may be of interest to the reader:
Becker, F., Steele, F.,Workplace by Design: Mapping the High-Performance Workscape,Jossey-Bass, San Francisco, 1995.
Becker, F., et al, Report of Phase One Corporate Real Estate 2000, StrategicManagement of the Fifth Resource: Corporate Real Estate (Project of The IndustrialDevelopment Research Foundation, 1993).
Becker, F.,The Total Workplace: Facilities Management and the Elastic Organization,Van Nostrand Reinhold, New York, 1990.
Access America, A-17 Initiative: Increase The Productivity of Federal Employees,http:/ /www.cio.tres.gov
President’s Management Council National Telecommuting Initiative Act Plan.Washington, D.C., 1996.
General Services Administration. Interim Report: Federal Interagency TelecommutingCenters.Washington, D.C., 1995.
Herman Miller, Inc.,Various Publications and Research Summaries, Zeeland, Michigan,http:/ /www.hmiller.com
Telecommute America, http:/ /www.att.com/Telecommute_America/
International Workplace Studies Program, Cornell University,http:/ / iwsp.human.cornell.edu
FM DATACOM,A Service of Tradeline, Inc., http:/ /www.fmdata.com/
69
References

70
Notes

Office ofReal Property