official title: apollo: a phase 3 multicenter ...developed for the treatment of hattr patients with...
TRANSCRIPT
Official Title: APOLLO: A Phase 3 Multicenter, Multinational, Randomized, Doubleblind, Placebo‐controlled Study to Evaluate the Efficacy and Safety of ALN‐TTR02 in Transthyretin (TTR)‐Mediated Polyneuropathy (Familial Amyloidotic Polyneuropathy‐FAP)
NCT Number: NCT01960348
Document Date: Statistical Analysis Plan Version 2.1, 23 August 2017
Alnylam Pharmaceuticals, Inc. Statistical Analysis Plan, Protocol ALN-TTR02-004
Final Version 2.1
CONFIDENTIAL 3
TABLE OF CONTENTS
Section Page 1. Information from the Study Protocol ............................................................................ 8
1.1. Introduction and Objectives ................................................................................... 8
1.1.1. Introduction ............................................................................................. 8
1.1.2. Document and Study Objectives........................................................... 10
1.2. Study Design ........................................................................................................ 11
1.2.1. Synopsis of Study Design ..................................................................... 11
1.2.2. Randomization Methodology ............................................................... 12
1.2.3. Rapid Disease Progression.................................................................... 12
1.2.4. Withdrawals, Dropouts, Loss to Follow-up .......................................... 12
1.2.5. Unblinding ............................................................................................ 13
1.2.6. Study Procedures .................................................................................. 13
1.2.7. Efficacy, Pharmacokinetic, Pharmacodynamic, and Safety Parameters .............................................................................................................. 13
2. Patient Population .......................................................................................................... 15
2.1. Population Definitions ......................................................................................... 15
2.2. Protocol Deviations .............................................................................................. 15
3. General Statistical Methods .......................................................................................... 17
3.1. Sample Size Justification ..................................................................................... 17
3.2. General Methods .................................................................................................. 17
3.3. Computing Environment ...................................................................................... 17
3.4. Baseline Definitions ............................................................................................. 18
3.5. Randomization Stratification Factors .................................................................. 18
3.6. Multiple Comparisons/Multiplicity ..................................................................... 18
3.7. Initiation of Alternative Treatment for FAP ........................................................ 18
3.8. Missing Data with Efficacy Endpoints ................................................................ 19
3.8.1. Missing Subcomponents within Primary and Secondary Efficacy Endpoints .............................................................................................. 19
3.8.2. Summary of Missing Data .................................................................... 19
3.8.3. Handling of Missing Data ..................................................................... 19
3.9. Visit Windows ..................................................................................................... 20
3.10. Interim Analyses .................................................................................................. 20
Alnylam Pharmaceuticals, Inc. Statistical Analysis Plan, Protocol ALN-TTR02-004
Final Version 2.1
CONFIDENTIAL 4
Section Page 3.11. Final Analyses ...................................................................................................... 20
4. Study Analyses ............................................................................................................... 21
4.1. Patient Disposition ............................................................................................... 21
4.2. Demographics and Baseline Characteristics ........................................................ 21
4.3. Efficacy Evaluation .............................................................................................. 22
4.3.1. Primary Efficacy Evaluations ............................................................... 22
4.3.2. Secondary Efficacy Evaluations ........................................................... 25
4.3.3. Exploratory Efficacy Evaluations ......................................................... 26
4.3.4. Subgroup Analyses ............................................................................... 27
4.3.5. Component Analyses ............................................................................ 27
4.4. Pharmacodynamic Analyses ................................................................................ 27
4.5. Pharmacokinetic Analyses ................................................................................... 28
4.5.1. Study Variables ..................................................................................... 28
4.5.2. Statistical Methods ................................................................................ 28
4.6. Safety Analyses .................................................................................................... 29
4.6.1. Study Drug Exposure ............................................................................ 29
4.6.2. Adverse Events ..................................................................................... 29
4.6.3. Laboratory Data .................................................................................... 30
4.6.4. Vital Signs and Physical Examination .................................................. 31
4.6.5. Electrocardiogram ................................................................................. 31
4.6.6. Premedication ....................................................................................... 32
4.6.7. Prior and Concomitant Medications ..................................................... 33
4.6.8. Ophthalmology Examinations .............................................................. 33
4.6.9. Suicidality Questionnaire ...................................................................... 33
4.7. Anti-Drug Antibody ............................................................................................. 34
5. Changes to Planned Analyses ....................................................................................... 35
5.1. Primary Analysis Method for Efficacy Endpoints ............................................... 35
5.2. Multiple Imputation/ANCOVA Method.............................................................. 35
5.3. Hierarchical Testing Order of Secondary Endpoints ........................................... 36
5.4. Adjustment for Covariates in Statistical Models ................................................. 36
5.5. Binary Analysis of mNIS+7................................................................................. 37
5.6. Censoring Data Post Alternative FAP Treatment ................................................ 37

Alnylam Pharmaceuticals, Inc. Statistical Analysis Plan, Protocol ALN-TTR02-004
Final Version 2.1
CONFIDENTIAL 5
Section Page 5.7. Other Changes ...................................................................................................... 38
6. References ....................................................................................................................... 40
7. Appendices ...................................................................................................................... 41
7.1. Detailed Statistical Methodology for Pattern Mixture Model ............................. 41
7.2. Questionnaire/Scoring.......................................................................................... 43
7.2.1. Modified Neuropathy Impairment Score (mNIS+7) and Original Neuropathy Impairment Score + 7 Nerve Tests (NIS+7) ..................... 43
7.2.2. Norfolk Quality of Life-Diabetic Neuropathy (QOL-DN) ................... 51
7.2.3. EuroQOL-5-Dimension 5-Level (EQ-5D-5L) ...................................... 52
7.2.4. Rasch-Built Overall Disability Scale (R-ODS) .................................... 53
7.2.5. Composite Autonomic Symptom Score (COMPASS-31) .................... 53

Alnylam Pharmaceuticals, Inc. Statistical Analysis Plan, Protocol ALN-TTR02-004
Final Version 2.1
CONFIDENTIAL 6
LIST OF ABBREVIATIONS AND DEFINITION OF TERMS Abbreviation Definition Σ5 5 Attributes AA Amyloid A ADA Anti-drug Antibody AE Adverse Event ANCOVA Analysis of Covariance ATC Anatomic Therapeutic Class BMI Body mass index CMAP Compound Muscle Action Potential Cmax Post-Infusion Peak Concentration Cmax_ss Post-Infusion Peak Concentration at Steady State COMPASS-31 Autonomic Symptoms Questionnaire (Composite Autonomic Symptom
Score) Cp(30min) 30 Minutes Post-Infusion Concentration Cp_ss(30min) 30 Minutes Post-Infusion Concentration at Steady State CRO Contract Research Organization CSR Clinical Study Report Ctrough Pre-Infusion Trough Concentration Ctrough_ss Pre-Infusion Trough Concentration at Steady State CV Coefficient of Variation DMC Data Monitoring Committee ECG Electrocardiogram eCRF Electronic Case Report Form EQ-5D Euro Quality of Life- 5 Dimensions EU European Union FAC Familial Amyloidotic cardiomyopathy FAP Familial Amyloidotic Polyneuropathy hATTR Hereditary Transthyretin-Mediated Amyloidosis HP Heat pain HRdb Heart Rate Response to Deep Breathing ICH International Conference on Harmonisation IENFD Intraepidermal Nerve Fiber Density INN International Nonproprietary Name IRS Interactive response system IV Intravenous LNP Lipid Nanoparticle LS Least Squares mBMI Modified Body Mass Index MedDRA Medical Dictionary for Regulatory Activities

Alnylam Pharmaceuticals, Inc. Statistical Analysis Plan, Protocol ALN-TTR02-004
Final Version 2.1
CONFIDENTIAL 7
Abbreviation Definition MI Multiple Imputation mITT Modified Intent-to-Treat MMRM Mixed-Effects Model Repeated Measures mNIS Modified Neuropathy Impairment Score NCS Nerve Conduction Studies NIS Neuropathy Impairment Score NIS-W Neuropathy Impairment Score-Weakness Score Norfolk QOL-DN Norfolk Quality of Life-Diabetic Neuropathy Questionnaire NSAID Nonsteroidal Anti-Inflammatory Drug NT-proBNP N Terminal Prohormone of B-Type Natriuretic Peptide PD Pharmacodynamic PEG Polyethylene glycol PK Pharmacokinetic PMM Pattern Mixture Model PND Polyneuropathy Disability PP Per-Protocol QST Quantitative Sensory Testing RBP Retinol Binding Protein RNAi RNA interference R-ODS Rasch-Built Overall Disability Scale SAE Serious Adverse Event SAP Statistical Analysis Plan SD Standard Deviation SEM Standard Error of the Mean SGNFD Sweat Gland Nerve Fiber Density siRNA Small Interfering Ribonucleic Acid SNAP Sensory Nerve Action Potential SOC System Organ Class SUSAR Suspected Unexpected Serious Adverse Reaction T4 Thyroxine TP Touch pressure TTR Transthyretin V30M Val30Met Genotype VAS Visual Analog Scale VDT Vibration Detection Threshold WHO World Health Organization Drug Dictionary WT Wild-Type
Alnylam Pharmaceuticals, Inc. Statistical Analysis Plan, Protocol ALN-TTR02-004
Final Version 2.1
CONFIDENTIAL 8
1. INFORMATION FROM THE STUDY PROTOCOL 1.1. Introduction and Objectives 1.1.1. Introduction Hereditary transthyretin-mediated (hATTR) amyloidosis is an inherited, autosomal dominant, systemic disease caused by mutations in the transthyretin (TTR) gene [1]. Transthyretin is a tetrameric 127 amino acid protein that is secreted predominantly (> 95%) by hepatocytes, with a smaller fraction produced by the choroid plexus and retina [1]. Physiologically, TTR is a major serum carrier for retinol binding protein (RBP) and a minor carrier of thyroxine (T4). Mutations in the TTR protein lead to destabilization of the tetrameric form and dissociation into dimers and monomers. Misfolding of mutated monomers from the α-helical to the β-pleated sheet structure, results in tissue deposition of amyloid fibrils [2]. Amyloid deposits typically contain both mutant and wild-type (WT) TTR. The particular TTR mutation and site of amyloid deposition determines the clinical manifestations of the disease, which include sensory and motor neuropathy, autonomic neuropathy, and/or cardiomyopathy. hATTR is a progressive disease associated with severe morbidity, with a life expectancy limited to 5 to 15 years from symptom onset [2]. There are over 100 reported TTR mutations which are associated with 2 clinical syndromes: familial amyloidotic polyneuropathy (FAP) and familial amyloidotic cardiomyopathy (FAC) [2, 3, 4]. ‘Patisiran’ (the International Nonproprietary Name [INN] name for ALN-TTR02) is being developed for the treatment of hATTR patients with symptomatic polyneuropathy. The estimated worldwide prevalence of FAP is 5,000 to 10,000, with the majority of cases in Portugal, Sweden, France, Japan, Brazil, and the United States [2, 3]. The most common causative mutation of FAP is TTR Val30Met (V30M), with the onset of symptoms typically occurring between 30 and 55 years of age [4]. Amyloid deposition occurs largely in the peripheral nerves, starting as a nerve length-dependent sensory polyneuropathy in the feet causing numbness and pain and progressing to painful dysesthesias. Disabling motor neuropathy follows, characterized by leg weakness and eventually the inability to walk. Autonomic neuropathy is another common feature of the disease, resulting in severe gastrointestinal pathology (including diarrhea or constipation and malabsorption, leading to severe malnutrition), orthostatic hypotension, and bladder dysfunction with recurring urinary tract infections [4, 5, 6, 7]. For several mutations, cardiac pathology also occurs due to amyloid infiltration of the sinus node, atrioventricular conduction system, and infiltration of the myocardium [4, 5]. Involvement of the conduction system can lead to sudden death due to dysrhythmias, and myocardial infiltration can lead to diastolic dysfunction and right-sided heart failure [4]. Cardiomyopathy then proceeds inexorably, leading to death typically within 10 years [4]. Because the liver is the primary source of WT and mutant TTR, orthotopic liver transplantation has been used since 1990 in an attempt to treat FAP [2], and is the current standard of care in patients who are eligible for transplant (patients with minimal neuropathy symptoms and no cardiac involvement). When liver transplantation is performed early in the course of the disease, it can stabilize and slow the course of neuropathic disease in patients with FAP due to V30M, but is less effective in patients with other TTR mutations [2]. However, it is less effective in patients with more advanced disease, especially those with heart involvement, due to the continued production and deposition of WT TTR in tissues with pre-existing amyloid [2, 3, 4].
Alnylam Pharmaceuticals, Inc. Statistical Analysis Plan, Protocol ALN-TTR02-004
Final Version 2.1
CONFIDENTIAL 9
It is estimated that approximately two-thirds of FAP patients are not transplant-eligible. Furthermore, liver transplant poses risks from the surgical procedure and from life-threatening complications due to graft rejection or infections. The 1-year mortality rate post-transplant is 10% [2]. Nonsurgical options that are used for the treatment of FAP (depending on geographic location) include tafamidis (Vyndaqel®) and diflunisal. Tafamidis is a small molecule TTR stabilizer that binds to the thyroxine binding sites of the TTR tetramer, thus preventing its dissociation to monomers and potentially preventing fibril formation. While tafamidis is approved in the European Union (EU) for the treatment of hATTR in adult patients with Stage 1 symptomatic polyneuropathy to delay peripheral neurologic impairment, the pivotal trial data were primarily from FAP patients with the V30M mutation; furthermore, tafamidis is not considered the standard of care throughout the EU and it has not been approved for use in the US [2]. Diflunisal is a generic, nonsteroidal anti-inflammatory drug (NSAID) that is also a tetramer stabilizer and binds to TTR in a similar manner as tafamidis. An NIH- sponsored multicenter, placebo-controlled Phase 3 study in FAP patients was completed in 2012; data suggest an effect of diflunisal on neuropathic score NIS+7, the primary endpoint of the study [2]. Due to the restricted use of liver transplantation and tafamidis in patients with early stage of disease, and the non-standard use of diflunisal among practitioners, there remains an unmet medical need for a potent and effective therapy for FAP that will have an impact on patients across a broad range of neurologic impairment, regardless of their mutation (V30M or non-V30M). Patisiran comprises a small interfering ribonucleic acid (siRNA) which is specific for TTR, and is formulated in a hepatotropic lipid nanoparticle (LNP) for intravenous (IV) administration [2]. This TTR siRNA has a target region within the 3’UTR region of the TTR gene to ensure and confirm homology with WT TTR as well as all reported TTR mutations. Following LNP-mediated delivery to the liver, the siRNA targets TTR mRNA for degradation, resulting in the potent and sustained reduction of mutant and WT TTR protein via the RNA interference (RNAi) mechanism. Since circulating TTR is almost exclusively synthesized in the liver, the IV administration of patisiran is postulated to reduce the level of precursors that lead to amyloid fibril deposition, resulting in clinical benefit to patients with FAP. The therapeutic hypothesis that systemic amyloidoses can be managed by reduction in circulating levels of amyloidogenic protein has been validated in other acquired (e.g., immunoglobulin light chain systemic [AL], or amyloid A [AA]) and hereditary (e.g., Fibrinogen A α-chain, ApoA1) amyloidosis. The experience from these systemic amyloidotic disorders [2, 3, 4, 5], as well as the liver transplant data in FAP, suggest that lowering of the circulating amyloidogenic protein by at least 50% impacts the clinical course of the disease, with reductions in protein beyond 50% providing further incremental improvements in outcomes. It is therefore postulated that the > 80% suppression in both WT and mutant TTR observed upon administration of 0.3 mg/kg patisiran once every 21 days will result in clinical benefit in hATTR patients with polyneuropathy. This hypothesis is further supported by evidence from tafamidis suggesting that reduction in free TTR monomer can slow neuropathy progression in early-stage V30M patients with FAP [8]. Importantly, data from a Phase 2 open-label extension study with patisiran (ALN-TTR02-003) in 27 FAP patients showed a mean sustained TTR reduction of ~80% accompanied with stabilization of neuropathic impairment scores at 6 months, which compared favorably to the anticipated increase in scores based on natural history and other datasets [2].
Alnylam Pharmaceuticals, Inc. Statistical Analysis Plan, Protocol ALN-TTR02-004
Final Version 2.1
CONFIDENTIAL 10
Patisiran is currently being investigated in APOLLO, a Phase 3 pivotal study (ALN-TTR02-004) evaluating the efficacy and safety of patisiran in hATTR patients with polyneuropathy. This protocol was discussed with the Agency at the end-of-Phase 2 meeting on 23 September 2013 (FDA ref ID # 3394206 for meeting minutes). The original statistical analysis plan (SAP) Version 1.0 was submitted to the Agency on 07 April 2015 (FDA IND 117395 Serial No. 0019). The response to the Agency’s review comment on multiple imputation (MI) was submitted on 31 August 2015 (FDA serial No. 0028). The SAP amendment Version 2.0 was submitted to the Agency on 01 June 2017. This SAP Version 2.1 incorporates a few minor updates for analysis of data from this study.
1.1.2. Document and Study Objectives This SAP is designed to outline the methods to be used in the analysis of study data in order to address the study objectives of Study ALN-TTR02-004. Populations for analysis, data handling rules, statistical methods, and formats for data presentation are provided. The statistical analyses and summary tabulations described in this SAP will provide the basis for the results sections of the clinical study report (CSR) for this trial. This SAP will also outline differences, if any, in the currently planned analytical objectives relative to those planned in the study protocol and/or in the original SAP V1.0. The study objectives from protocol are listed below.
1.1.2.1. Primary Objective The primary objective of the study is to determine the efficacy of patisiran by evaluating the difference between the patisiran and placebo groups in the change from baseline of Modified Neuropathy Impairment Score (mNIS+7) score at 18 months.
1.1.2.2. Secondary Objectives The secondary objectives of the study are to determine the effect of patisiran on various clinical parameters by assessing the difference between patisiran and placebo in the change from baseline in the following measurements at 18 months:
• Norfolk Quality of Life-Diabetic Neuropathy (Norfolk QOL-DN) Total QoL Score. • Neuropathy Impairment Score-weakness (NIS-W) score. • Modified body mass index (mBMI), calculated by multiplying the BMI (kg/m2) by
serum albumin level (g/L). • Timed 10-meter walk test speed (meter/second), calculated as 10 meters divided by the
walking time (second). • Autonomic symptoms questionnaire (Composite Autonomic Symptom Score
[COMPASS-31]).
1.1.2.3. Exploratory Objectives The exploratory objectives of the study are:
• To determine the difference between the patisiran and placebo groups in the change from baseline in the following measurements at 18 months:
o NIS+7 score;
Alnylam Pharmaceuticals, Inc. Statistical Analysis Plan, Protocol ALN-TTR02-004
Final Version 2.1
CONFIDENTIAL 11
o Grip strength; o EuroQOL (EQ-5D) questionnaire; o Level of disability (Rasch-built Overall Disability Scale [R-ODS]); o Large vs. small nerve fiber function including nerve conduction studies (NCS) 5
attributes (Σ5), quantitative sensory testing by body surface area including touch pressure and heat pain (QST), vibration detection threshold (VDT), heart rate response to deep breathing (HRdb), postural blood pressure;
o Pathologic evaluation of sensory and autonomic innervation through voluntary skin punch biopsies and analysis of intraepidermal nerve fiber density (IENFD) and sweat gland nerve fiber density (SGNFD) )
o Assessment of ambulation through FAP stage and Polyneuropathy Disability (PND) score;
o Cardiac assessment through echocardiogram, troponin I, and N-terminal prohormone of B-type natriuretic peptide (NT-proBNP) levels;
o Pharmacodynamic (PD) biomarkers (TTR, RBP, vitamin A); • To compare the proportion of patients in the patisiran and placebo groups who meet the
pre-defined criterion for rapid disease progression (defined as ≥24-point increase in mNIS+7 from baseline [based on an average of 2 measurements] and FAP stage progression relative to baseline) at 9 months;
• To serially evaluate lower limb nerve injury via voluntary magnetic resonance (MR) neurography approximately every 6 months in a subset of patients receiving either patisiran or placebo who consent to perform this assessment.
1.2. Study Design 1.2.1. Synopsis of Study Design This is a multicenter, multinational, randomized, double-blind study comparing patisiran to placebo in hATTR patients with symptomatic polyneuropathy. Consented eligible patients will be randomized to receive either 0.3 mg/kg patisiran or placebo in a 2:1 ratio (patisiran to placebo) in a blinded manner. Randomization will be stratified by Neuropathy Impairment Score (NIS; < 50 vs. ≥ 50), early onset V30M (< 50 years of age at onset) vs. all other mutations (including late onset V30M), and previous tetramer stabilizer use (tafamidis or diflunisal) vs. no previous tetramer stabilizer use. Patients will receive patisiran or placebo once every 21 days for 78 weeks (18 months). Patients will have efficacy assessments at Screening/Baseline, 9 months, and 18 months. Study personnel performing assessments related to the efficacy endpoints will be different from the Investigator and other personnel managing the patient, and all of these study personnel will be blinded to any clinical laboratory results that could potentially unblind them (e.g., TTR levels, vitamin A levels, thyroid function tests). In addition, the study personnel performing assessments related to the efficacy endpoints will also be blinded to the results of any previous assessments (e.g., Screening/Baseline, Baseline, or 9-month assessments). Whenever possible, the same site personnel (individual) will conduct efficacy assessments for a given patient across time points.
Alnylam Pharmaceuticals, Inc. Statistical Analysis Plan, Protocol ALN-TTR02-004
Final Version 2.1
CONFIDENTIAL 12
At the 9-month time point, if the clinical adjudication committee determines that a patient is exhibiting rapid disease progression (defined as ≥24-point increase in mNIS+7 from baseline [based on an average of 2 measurements] and FAP stage progression relative to baseline), the patient’s treating physician will provide the patient with the option of discontinuing study drug and receiving local standard of care treatment for FAP. Patients who discontinue study drug will remain on study, following a modified schedule of visits, through completion of the 18-month efficacy assessments and blinding will be maintained throughout. Patients who complete the 18-month efficacy assessments can elect to participate in an extension study in which patients would receive open-label administration of 0.3 mg/kg patisiran once every 21 days. A Data Monitoring Committee (DMC) will be implemented for the study and will operate under a pre-specified charter.
1.2.2. Randomization Methodology Patients will be randomly assigned in a 2:1 ratio to receive either 0.3 mg/kg patisiran or placebo (normal saline 0.9%). Patients will be randomized via an interactive response system (IRS). Either designated site personnel or the pharmacist may request randomization for the patient, but only the pharmacist or pre-identified unblinded personnel will be allowed to receive the randomized treatment code. The treatment code will be delivered to the unblinded personnel or the pharmacist to prepare the necessary number of vials for that patient based on their weight. As described above in Section 1.2.1, the stratification factors for randomization include NIS (< 50 vs. ≥ 50), early onset V30M (< 50 years of age at onset) vs. all other mutations (including late onset V30M), and previous tetramer stabilizer use (tafamidis or diflunisal) vs. no previous tetramer stabilizer use.
1.2.3. Rapid Disease Progression Patients who have evidence of rapid disease progression at 9 months (defined as ≥24-point increase in mNIS+7 from baseline [based on an average of 2 measurements] and FAP stage progression relative to baseline) will be given the option of discontinuing study drug and receiving local standard of care treatment for their FAP. Those who elect this option will be asked to follow a modified study visit schedule and return for their 18-month efficacy assessment (blinding will be maintained throughout).
1.2.4. Withdrawals, Dropouts, Loss to Follow-up Patients are free to discontinue treatment or withdraw from the study at any time and for any reason, without penalty to their continuing medical care. There are 3 ways for a patient to discontinue treatment and/or withdraw from the study:
1) The patient or investigator decides to discontinue study treatment, but the patient agrees to remain in the study and undergo follow-up assessments;
2) The patient experiences protocol-defined rapid disease progression at Month 9 and elects to discontinue study treatment but remain in the study and return for protocol-specified visits, including follow-up assessment at Month 18;
3) The patient decides to no longer participate in the study and withdraws consent.
Alnylam Pharmaceuticals, Inc. Statistical Analysis Plan, Protocol ALN-TTR02-004
Final Version 2.1
CONFIDENTIAL 13
A patient will be considered to have completed the study if the patient does not withdraw consent from the study and completes protocol-specified procedures up through the 18-month efficacy assessment visit.
1.2.5. Unblinding Unblinding is only to occur in the case of patient emergencies or when necessary from a regulatory reporting perspective (e.g., Suspected Unexpected Serious Adverse Reaction [SUSAR] occurring in the EU), and at the conclusion of the study. Patients who discontinue study drug at 9 months due to rapid disease progression will remain blinded throughout the remainder of the study. In the event that the Investigator requests to know a patient’s study treatment assignment, the Investigator is instructed to contact the Contract Research Organization (CRO) Medical Monitor to discuss the need for unblinding. In case of an emergency, the treatment allocation for each patient will be available from the unblinded site personnel, pharmacist, or the IRS system. If a patient becomes pregnant or seriously ill during the study, the blind should be broken only if knowledge of the treatment administered will affect treatment options available to the patient. Before breaking the blind, the Principal or Sub-investigator should attempt to contact the CRO Medical Monitor. If the Medical Monitor is immediately unreachable, the Principal or Sub-investigator should break the blind as necessary using the code breaking information provided and contact the CRO Medical Monitor as soon as possible. A record will be kept of when the blind was broken, who broke it, and why.
1.2.6. Study Procedures The schedule of assessments is described in the study protocol (Table 1-1, Table 1-2, and Table 1-3).
1.2.7. Efficacy, Pharmacokinetic, Pharmacodynamic, and Safety Parameters
1.2.7.1. Efficacy Parameters
Efficacy parameters will include the following. All evaluations will be conducted at baseline and at 9 and 18 months (except for mBMI as described below).
Primary Endpoint
• Neurologic impairment will be assessed using the mNIS+7 composite score (range: 0 to 304 points). The mNIS+7 include the modified NIS (weakness and reflexes), Σ5 NCS, QST, as well as autonomic assessment through postural blood pressure. Two assessments will be performed at each visit; each component contributing to the composite score is the average of the 2 assessments. A scoring algorithm, including methods for handling missing components of the mNIS+7, is included in Appendix 7.2.1.
Secondary Endpoints
• Patient reported QOL will be evaluated using the Norfolk QOL-DN total score (range: -4 to 136 points). A scoring algorithm for this instrument is included in Appendix 7.2.2.
• Motor strength will be evaluated using NIS-W, calculated as the average of the 2 assessments performed at each visit (range: 0 to 192 points).

Alnylam Pharmaceuticals, Inc. Statistical Analysis Plan, Protocol ALN-TTR02-004
Final Version 2.1
CONFIDENTIAL 14
• Level of disability will be assessed using the Rasch-built Overall Disability Scale (R-ODS; range: 0 to 48). A scoring algorithm for the R-ODS is included in Appendix 7.2.4.
• Functional status will additionally be assessed by 10-meter walk gait speed.
• Nutritional status will be assessed using mBMI, calculated by multiplying the BMI (kg/m2) by serum albumin level (g/L). mBMI will be assessed at baseline, Day 84, Day 189, Day 357, Day 462 and Day 546.
• Autonomic symptoms will be assessed using the COMPASS-31 total score (range: 0 to 100 points). A scoring algorithm for the COMPASS-31 total score and domain scores is included in Appendix 7.2.5.
Exploratory Endpoints
Exploratory endpoints are detailed in Section 1.1.2.3.
In addition, the evaluation of dermal amyloid content (% Congo Red staining) using same skin punch biopsy specimens analyzed for nerve fiber density (SGNFD and IENFD) will also be assessed as an exploratory endpoint.
1.2.7.2. Pharmacokinetic Parameters Blood samples for determination of patisiran pharmacokinetics (PK) will be collected as outlined in the schedule of assessments. Plasma siRNA, DLin-MC3-DMA, and PEG2000-C-DMG concentrations will be determined in all patients in order to estimate individual PK parameters such as peak and trough concentrations. Urine will be collected with void volume recorded for all patients at time points specified in the schedule of assessments to determine concentration of siRNA and 4-dimethylaminodibutyric acid (the metabolite of DLin-MC3-DMA) after dosing with study drug. Pharmacokinetic parameters will be estimated by the Clinical Pharmacology and Pharmacometrics Department at Alnylam Pharmaceuticals.
1.2.7.3. Pharmacodynamic and Pharmacology Parameters Pharmacodynamic markers assessed serially will include serum TTR, vitamin A, and RBP. Additional blood samples will be collected for exploratory biomarkers related to FAP. Anti-drug antibodies (ADA) data will also be collected.
1.2.7.4. Safety Parameters Safety evaluations to be performed during the study include monitoring of adverse events (AEs) and concomitant medications, physical examinations, measurement of vital signs, 12-lead ECGs, clinical laboratory evaluations including hematology, clinical chemistry (including liver function tests), thyroid function parameters, urinalysis, and ophthalmology examinations. Suicidal ideation and behavior will be assessed using the Columbia–Suicide Severity Rating Scale (C-SSRS) questionnaire.
Alnylam Pharmaceuticals, Inc. Statistical Analysis Plan, Protocol ALN-TTR02-004
Final Version 2.1
CONFIDENTIAL 15
2. PATIENT POPULATION 2.1. Population Definitions The following patient populations will be evaluated and used for presentation and analysis of the data:
• Modified Intent-to-Treat (mITT) population: All patients who were randomized and received at least 1 dose of patisiran or placebo. Patients will be analyzed according to the treatment to which they were randomized.
• Per-protocol (PP) population: All randomized patients who received at least 1 dose of patisiran or placebo, completed baseline and either 9-month or 18-month mNIS+7 and Norfolk QOL assessments, and did not experience any major protocol deviations that may impact the efficacy results (Section 2.2). Patients will be analyzed according to treatment received.
• Safety population: All patients who received at least 1 dose of patisiran or placebo. Patients will be analyzed according to the treatment received.
• PK population: All patients in the Safety Population who provided at least 1 PK concentration measurement.
The primary population for efficacy analysis will be the mITT population; the primary endpoint and the first secondary endpoint (Norfolk QOL) will also be analyzed using the PP population. The remaining secondary and exploratory efficacy endpoints will be analyzed using the mITT population only. Safety analysis will be conducted in the safety population. PK analysis will be conducted in the PK population.
2.2. Protocol Deviations A deviation is considered any departure from the procedures set forth in the protocol. Protocol deviations will be classified into major and minor by medical review and recorded prior to database lock. A major deviation is a deviation that may impact patient safety or efficacy interpretation (for example, failure to meet key inclusion and exclusion criteria). Deviations not designated as major will be considered minor. The Sponsor or designee will be responsible for producing the final protocol deviation file (formatted as a Microsoft Excel file). This file will include a description of each protocol deviation and whether or not this deviation is classified as a major deviation. In addition, each major deviation will be clearly identified as to whether or not it warrants exclusion from the Per Protocol population, based on the potential impact on the efficacy results according to the judgment of the sponsor. This file will be finalized prior to database lock and unblinding of treatment assignments for all patients. The following are some examples of key inclusion/exclusion criteria. Failure to meet such criteria may warrant the exclusion from the Per Protocol population: Inclusion:
1. Have a diagnosis of FAP with documented TTR mutation; 2. Have an NIS of 5 to 130 (inclusive) and a PND score of ≤3b; 3. Have a Karnofsky performance status of ≥60%.
Alnylam Pharmaceuticals, Inc. Statistical Analysis Plan, Protocol ALN-TTR02-004
Final Version 2.1
CONFIDENTIAL 16
Exclusion: 1. Had a prior liver transplant or is planning to undergo liver transplant during the
study period; 2. Has known primary amyloidosis or leptomeningeal amyloidosis; 3. Has known type I diabetes; 4. Has had type II diabetes mellitus for ≥5 years; 5. Received an investigational agent or device within 30 days of anticipated study
drug administration or 5 half-lives of the investigational drug, whichever is longer;
6. Participated in a clinical trial with antisense oligonucleotide, must have completed a 3-month wash-out prior to start of the study drug administration in this study.
All protocol deviations and major protocol deviations will be presented in data listings.
Alnylam Pharmaceuticals, Inc. Statistical Analysis Plan, Protocol ALN-TTR02-004
Final Version 2.1
CONFIDENTIAL 17
3. GENERAL STATISTICAL METHODS 3.1. Sample Size Justification For the estimation of sample size, a mean (±SD) mNIS+7 progression rate (primary endpoint) in the placebo group of 24 ± 16 points over 18 months was estimated using natural history data [1] from FAP patients. A sample of 154 patients provides 90% power for a 2-sided t-test with an 8.95-point (37.5%) mean difference between treatment arms in the primary endpoint at 2-sided alpha = 0.05. Assuming a 25% random premature discontinuation rate (due to liver transplantation or other factors), the required sample size for this study is approximately 200.
3.2. General Methods All data listings that contain an evaluation date will contain a study day relative to the day of the first dose of study drug, which is designated as Day 1. On-treatment study days will be calculated as evaluation date – first dose date +1 and pre-treatment days will be calculated as evaluation date – first dose date. For example, the day prior to study drug administration will be Day -1, the first dose day of study drug will be Day 1 and the day after the first dose of study drug will be Day 2, etc. All output will be incorporated into Microsoft Word files, sorted and labeled according to the International Conference on Harmonisation (ICH) recommendations, and formatted to the appropriate page size(s). For categorical variables, summary tabulations of the number and percentage of patients within each category (with a category for missing data) of the parameter will be presented. For continuous variables, the number of patients, mean, median, standard deviation (SD), minimum, and maximum values will be presented. Laboratory data (including vitamin A and RBP) collected and recorded as below the limit of detection will be set equal to the lower limit of detection for the calculation of summary statistics. For assessments that are repeated multiple times on the study day (e.g., 10-meter walk tests, IENFD, SGNFD, etc.), the average will be calculated unless otherwise noted. Formal statistical hypothesis testing will be performed on the primary and secondary efficacy endpoints with all tests conducted at the nominal 2-sided 0.05 level of significance. Secondary endpoints will be tested in a prespecified hierarchy (Section 3.6). Summary statistics will be presented, as well as 2-sided 95% confidence intervals on selected parameters, as described in the sections below. All summaries will be presented by treatment arm. All data recorded on the CRF will be included in data listings.
3.3. Computing Environment All descriptive statistical analyses will be performed using SAS statistical software Version 9.3 (or later), unless otherwise noted. Medical history and AEs will be coded using the Medical Dictionary for Regulatory Activities (MedDRA) Version 18.0 (or later). Concomitant medications will be coded using the World Health Organization (WHO) Drug Dictionary Version March 2015 (or later).
Alnylam Pharmaceuticals, Inc. Statistical Analysis Plan, Protocol ALN-TTR02-004
Final Version 2.1
CONFIDENTIAL 18
3.4. Baseline Definitions For the mNIS+7/NIS+7 individual components, total scores and related endpoints, the Screening/Baseline and Baseline visits were performed on separate days. Baseline will be calculated as the average of 2 replicate measures each assessed at the Screening/Baseline and Baseline visits. For grip strength and 10m walk test, if replicate measures are obtained at the Screening/Baseline and Baseline visits, baseline will also be calculated as the average of the 2 replicates. For PD parameters (TTR, RBP, Vitamin A), baseline will be defined as the average of all records, including those from any unscheduled visits, prior to the date and time of first dose. For all other parameters, unless noted otherwise, baseline will be defined as the last non-missing measurement on or prior to the first dose of study treatment.
3.5. Randomization Stratification Factors Stratification factors for randomization include Neuropathy Impairment Score (NIS; < 50 vs. ≥ 50), early onset V30M (< 50 years of age at onset) vs. all other mutations (including late onset V30M), and previous tetramer stabilizer use (tafamidis or diflunisal) vs. no previous tetramer stabilizer use. Stratification factors are recorded in both the IVR and the clinical database. In statistical analyses that use randomization stratification factors as covariates, the stratum assignment will reflect the values as recorded in the clinical database. In the presence of stratification errors, the stratification used in analysis may not match that in the IVR.
3.6. Multiple Comparisons/Multiplicity Type I error control for secondary endpoints will be achieved by a hierarchical ordering procedure. Endpoints will be tested in the following pre-specified hierarchy:
1. Norfolk QOL-DN questionnaire [Total Score]
2. NIS-W score
3. R-ODS
4. 10-meter walk test speed
5. mBMI
6. COMPASS-31 total score Only if a comparison is significant at a 2-sided 0.05 significance level, the next endpoint in the hierarchy may be formally tested; if a given comparison is not significant at a 2-sided 0.05 significance level, the subsequent tests will be performed and the results summarized, but statistical significance will not be inferred.
3.7. Initiation of Alternative Treatment for FAP Rapid progression patients have the option to discontinue study drug, receive alternative FAP treatment, and return for their 18-month efficacy assessment. Non-rapid progressors may also initiate alternative FAP treatment during study, although this would be a major protocol violation. Alternative FAP treatment may confound the efficacy outcome. For the primary analysis of mNIS+7, Norfolk QOL-DN and NIS-W, the assessments collected after alternative FAP treatment (liver transplant or use of tafamidis or diflunisal for more than 14 days) will be
Alnylam Pharmaceuticals, Inc. Statistical Analysis Plan, Protocol ALN-TTR02-004
Final Version 2.1
CONFIDENTIAL 19
treated as missing. The data post alternative FAP treatment will be included in efficacy listings with a footnote and will also be used in sensitivity analyses as specified. For all other efficacy endpoints, data collected post alternative FAP treatment will be included in analyses. A separate listing will be provided for patients who initiate alternative treatment for FAP while on study.
3.8. Missing Data with Efficacy Endpoints
All efficacy data collected during study, regardless of whether before or after treatment discontinuation, will be included for analyses, with the exception of mNIS+7, Norfolk QOL, and NIS-W assessments collected post alternative FAP treatment (discussed in Section 3.7).
3.8.1. Missing Subcomponents within Primary and Secondary Efficacy Endpoints For each patient, missing subcomponents within the primary mNIS+7 endpoint and secondary efficacy endpoints will be imputed whenever possible according to the algorithm specified in Appendix 7.2.1 through Appendix 7.2.5. When this “partial imputation” is successful (i.e., complete mNIS+7 values are produced), these values will be used in all statistical analyses. When partial imputation is unsuccessful, the efficacy endpoint will be treated as completely missing.
3.8.2. Summary of Missing Data For each of the primary and secondary efficacy endpoints, the number and percentage of missing data (completely missing) at each visit (baseline, 9-month, and 18-month) will be summarized by study arm. Time to treatment discontinuation will be estimated descriptively using Kaplan-Meier method by treatment arm. Patients completing study treatment will be censored at the last dose of study drug. Spaghetti plots will be presented to display the trajectories over time for individual patient’s change from baseline in mNIS+7 and Norfolk QOL-DN for patients who have missing 18-month assessments.
3.8.3. Handling of Missing Data For the primary and secondary efficacy endpoints, the primary analysis will be based on the mixed-effects model repeated measures (MMRM) method, which makes use of fully and partially observed data sequences from individual patients by estimating the covariance between data from different time points. The MMRM will be implemented using an unstructured approach to modeling both the treatment-by-time means and the (co)variances, leading to what is essentially a multivariate normal model wherein treatment arm means at the primary time point are adjusted to reflect both the actually observed data and the projected outcomes from the patients with missing data [11]. In this primary analysis, missing data will not be imputed and are assumed to be missing-at-random (MAR). For the primary endpoint mNIS+7 and the first secondary endpoint Norfolk QOL, sensitivity analyses will be conducted to assess the impact of missing data as discussed in Section 4.3.
Alnylam Pharmaceuticals, Inc. Statistical Analysis Plan, Protocol ALN-TTR02-004
Final Version 2.1
CONFIDENTIAL 20
3.9. Visit Windows It is expected that all visits should occur according to the protocol schedule. All data will be tabulated and analyzed per the evaluation visit as recorded on the electronic case report form (eCRF) even if the assessment is outside of the visit window. For efficacy assessments, if the scheduled 9-month or 18-month visits are not performed, the unscheduled and/or discontinuation visits will be grouped with the 9-month or 18-month assessments if they are performed within 3 months of the scheduled assessment. The derived visits will be used for all analyses. Unless otherwise specified above, data collected at unscheduled visits will be included in by-patient data listings and figures, but no assignment to a study visit will be made for the purpose of by-visit summary tabulations. However, unscheduled visits may be used in the calculation of baseline values (as discussed in Section 3.4) and for inclusion in any categorical shift summaries (e.g., shift from baseline to “worst” post-baseline value).
3.10. Interim Analyses No interim analysis was conducted for this study.
3.11. Final Analyses After the last patient completes the 18-month efficacy assessment or the 18-month efficacy visit window per protocol has elapsed, the sponsor will prepare for the final analysis. The study will then be unblinded and the final analysis will be conducted. If there is additional safety data collected after the final analysis, the data will be presented in listings only.
Alnylam Pharmaceuticals, Inc. Statistical Analysis Plan, Protocol ALN-TTR02-004
Final Version 2.1
CONFIDENTIAL 21
4. STUDY ANALYSES 4.1. Patient Disposition Patient disposition will be tabulated and will include the following parameters: the number of patients in each analysis population, the number of patients randomized, the number of patients treated, the number of patients completing treatment, the number of patients completing study, the number of patients who discontinued treatment and primary reasons for treatment discontinuation, the number of patients who withdrew prior to completing the study and primary reasons for withdrawal, the number of patients meeting the protocol specified criteria for rapid disease progression, the number of patients who discontinued treatment but completed the study, and the number of patients who completed treatment but withdrew prior to completing the study. Patient disposition will be presented by randomized treatment arm (patisiran and placebo) and overall. The number and percent of patients enrolled by country and site will be summarized by randomized treatment arm and overall. The number and percent of patients in each randomization stratification factor recorded in IVR, and a comparison of the number and percent of patients in each randomization stratification factor in IVR versus the clinical database will be summarized by randomized treatment arm and overall. Data listings of treatment/study completion information including the reason for treatment discontinuation and/or study withdrawal will be presented.
4.2. Demographics and Baseline Characteristics Demographic and baseline characteristics, baseline disease characteristics, baseline efficacy parameters, and medical history information will be summarized by treatment arm and overall. No formal statistical comparisons will be performed. Age, height, weight, and body mass index (BMI) will be summarized using descriptive statistics (number of patients, mean, SD, median, minimum, and maximum). Sex, race, ethnicity, and region will be summarized by presenting the numbers and percentages of patients in each category. The following baseline disease characteristics will be summarized by presenting the numbers and percentages of patients in each category:
• Age at hATTR Symptom onset [< 50; ≥ 50] • Neuropathy Impairment Score (NIS) [< 50; ≥ 50 & < 100; ≥ 100] • Genotype [V30M; non-V30M] • Early onset V30M [< 50 years of age at onset] vs. all other mutations [including late
onset V30M] • Previous tetramer stabilizer use [tafamidis or diflunisal] vs. no previous tetramer
stabilizer use • Karnofsky Performance Status (KPS) [60; 70-80; 90-100] • Cardiac Subpopulation (defined below) • New York Heart Association (NYHA) Classification [I; II; III; IV]

Alnylam Pharmaceuticals, Inc. Statistical Analysis Plan, Protocol ALN-TTR02-004
Final Version 2.1
CONFIDENTIAL 22
The cardiac subpopulation will be comprised of patients with pre-existing cardiac amyloid involvement, defined as patients with baseline left ventricular (LV) wall thickness ≥ 1.3 cm and no aortic valve disease or hypertension in medical history. Time in years since diagnosis with hATTR will be summarized using descriptive statistics. For those who previously used tetramer stabilizers, the time from discontinuation of tetramer stabilizer to the start of study drug will be summarized using descriptive statistics. The number and percent of patients with each genotype will be summarized by country and treatment group. Continuous efficacy parameters will be summarized using descriptive summary statistics. The number and percent of patients in each category for PND score (I, II, IIIA, IIIB, IV) and FAP stage (I, II, III) will also be summarized. Medical history will be summarized by system organ class (SOC), high level term (HLT), and preferred term. A patient contributes only once to the count for a given condition (overall, by SOC, by HLT, by preferred term). All demographic and baseline data for each patient will be provided in data listings. Medical history data including prior neurological test scores, prior surgeries, and pregnancy test results will be presented in a data listing. Screening test results will also be presented in data listings.
4.3. Efficacy Evaluation The primary efficacy analyses will be conducted using the mITT population. The primary endpoint mNIS+7 and the first secondary endpoint Norfolk QOL will also be evaluated for the PP population.
4.3.1. Primary Efficacy Evaluations The primary efficacy endpoint is to compare change in mNIS+7 from baseline to Month 18 between treatment arms for the mITT population.
4.3.1.1. Primary Analysis using MMRM Method for the mITT Population The primary analysis will be performed using a restricted maximum likelihood (REML) based MMRM approach. The outcome variable is change from baseline in mNIS+7. The model includes baseline mNIS+7 score as a continuous covariate and fixed effect terms including treatment arm, visit (Month 9 or Month 18), treatment-by-visit interaction, genotype (V30M vs. non-V30M), age at hATTR Symptom onset (< 50; ≥ 50), region (North America, Western Europe, and Rest of World), and previous tetramer stabilizer use (yes vs. no). An unstructured covariance structure will be used to model the within-patient errors. The Satterthwaite approximation will be used to estimate the degrees of freedom. The primary comparison is the contrast (difference in least squares means [LS means]) between the patisiran and placebo groups at 18 months. Analysis will be implemented with SAS PROC MIXED.
4.3.1.2. Analysis using MMRM Method for the PP Population The analysis of the primary endpoint using MMRM method will also be conducted for the Per Protocol (PP) population (defined in Section 2.1).
4.3.1.3. Sensitivity Analyses Sensitivity analyses will be conducted using the following methods to assess the impact of missing data and the robustness of the primary analysis.
Alnylam Pharmaceuticals, Inc. Statistical Analysis Plan, Protocol ALN-TTR02-004
Final Version 2.1
CONFIDENTIAL 23
Multiple Imputation/ANCOVA Method Multiple Imputation is a broadly applicable technique for handling missing data. Missing data are imputed multiple times using a regression method. Each imputed data set is analyzed by analysis of covariance (ANCOVA) model, and the point estimates and standard errors are combined to provide inferences that reflect the uncertainty about the missing values. MI also makes assumption of missing at random (MAR) mechanism. Primary endpoint data that are missing will be multiply imputed separately for each treatment arm using a regression procedure, with baseline information including baseline score, genotype, age at ATTR onset, prior tetramer stabilizer use, region, KPS, FAP stage (I vs. II/III), cardiac subpopulation and gender, as well as 9-month efficacy assessment value (when available) as covariates. MI assumes monotone missingness. For non-monotone missing data, e.g., patients completely missing the 9-month assessment but for whom the 18-month assessment is available, the 9-month assessment will be imputed as the treatment group mean. The proportion of non-monotone missing data is expected to be very small. After imputation, the complete dataset will be analyzed using the ANCOVA model. In the model, baseline mNIS+7 will be used as covariate and treatment arm (patisiran vs. placebo), genotype (V30M vs. non-V30M), age at ATTR onset (Before age 50 vs. After age 50), prior tetramer stabilizer use (Yes vs. No), and region (Western EU, North America, and Rest of World) as factors. One hundred imputed datasets (per treatment arm) will be generated from the MI regression procedure. Each of the imputed datasets will then be analyzed via the ANCOVA model and the resulting estimates (LS means and standard errors) combined using SAS PROC MIANALZYE to produce inferential results (difference in LS means, 95% CI for the difference, and the p-value from the test that the difference is zero). Point estimates (LS means and differences) will be calculated as the average of the 100 complete-data estimates. A total variance estimate will be calculated as a weighted sum of within-imputation variance, which is the average of the complete-data variance estimates, and a between-imputation variance term. Complete details may be found in the SAS documentation for the MIANALYZE procedure (see Combining Inferences from Imputed Data Sets under Details). http://support.sas.com/documentation/onlinedoc/stat/131/mianalyze.pdf. Analyses will be conducted using PROC MI and PROC MIANALYZE in SAS 9.3 (or later).
Pattern-Mixture Model (PMM) A sensitivity analysis using pattern mixture model (PMM) will be performed to assess the robustness of the primary MMRM results to the possible violation of the missing at random (MAR) missingness assumption. The PMM accommodates situations where the missingness mechanism is missing not at random (MNAR). The model will be based on the following assumptions:
1. Patients who have missing data and are alive before Month 18: a. Placebo patients who have missing data (either Month 9 or 18): The missing data
are considered MAR and will be imputed using MI estimated from placebo patients. The imputation is done regardless of whether a patient was on-treatment or discontinued treatment before the scheduled efficacy assessment.
b. Patisiran patients who have missing data (either Month 9 or 18) while on treatment: Patients are expected to continue to show benefit from treatment
Alnylam Pharmaceuticals, Inc. Statistical Analysis Plan, Protocol ALN-TTR02-004
Final Version 2.1
CONFIDENTIAL 24
similar to that observed at the scheduled time point. Therefore, missing data during the on-treatment period (within 60 days of their last dose) are considered MAR and will be imputed using MI estimated from all non-missing data collected on treatment from the patisiran arm.
c. Patisiran patients who have missing data (either Month 9 or 18) after stopping their study treatment: Patients will no longer benefit from treatment in the future and will have trajectory similar to placebo patients. Therefore, missing data after treatment discontinuation (more than 60 days after last dose of study drug) will be imputed using the data from placebo patients.
2. Patients who die before Month 18 and have missing data: Assuming that deaths observed in the study will likely be related to worsening of disease, the missing data at Month 18 will be imputed by taking random samples from the worst 10% mNIS+7 change scores in the entire population. The imputation will be done for patients from both patisiran and placebo arms.
Missing values will be imputed 100 times to generate 100 complete datasets using procedures as described above. An ANCOVA model will be fit to each “complete” dataset for the change from baseline in mNIS+7 at Month 18. The ANCOVA model will include baseline mNIS+7 as a continuous covariate and treatment arm (patisiran vs. placebo), genotype (V30M vs. non-V30M), age at ATTR onset (Before age 50 vs. After age 50), previous tetramer stabilizer use (Yes vs. No), and region (Western Europe, North America, and Rest of World) as factors. The resulting estimates from the 100 analyses will be combined using Rubin’s formulae, and the 95% confidence interval will be constructed, similar to the procedure described in the MI/ANCOVA section. More details on the implementation of PMM are discussed in Appendix 7.1. Including Data Post Alternative Treatment for FAP The primary analysis will not include mNIS+7 assessments performed after the initiation of alternative treatment for FAP (Section 3.7). Sensitivity analysis including data post alternative treatment for FAP will be conducted using the MMRM model. In this sensitivity analysis, all assessments will be used in the analysis regardless of whether an assessment occurs before or after alternative treatment. Revised mNIS+7 Total Score Using a Different Algorithm to Handle Missing Components In the primary derivation of mNIS+7 total score, the “within treatment arm” imputation algorithm will be used for the imputation of missing component (Appendix 7.2.1). At each visit, if a patient has a missing component for mNIS+7, the value will be imputed using data from other patients who are on the same treatment arm and who had non-missing data for that component at that visit. In a sensitivity analysis, any such missing value will be imputed as the mean value for the component at the visit from all patients (combining placebo and patisiran arms). The analysis of this revised mNIS+7 derived scores will be conducted using the MMRM model.
4.3.1.4. Binary Analyses The number and percentage of patients with < 10-point increase in mNIS+7 composite score from baseline to Month 18 will be calculated for each treatment arm and compared between 2 arms using the Cochran-Mantel-Haenszel test, stratified by genotype (V30M vs. non-V30M). The percentage will be based on the mITT population. Patients with missing 18-month data will be counted in the denominators.

Alnylam Pharmaceuticals, Inc. Statistical Analysis Plan, Protocol ALN-TTR02-004
Final Version 2.1
CONFIDENTIAL 25
In addition, the number of percentage of patients with a decrease (change from baseline < 0-point) in mNIS+7 total score from baseline to Month 18 will also be calculated and analyzed similar as above. The planned analyses of the primary endpoint mNIS+7 are summarized in Table 1.
Table 1 Analysis of mNIS+7
Statistical Method Analysis Population Primary analysis: MMRM mITT Sensitivity analysis: • MI/ANCOVA • PMM • MMRM - including Data Post Alternative Treatment for FAP • MMRM - revised mNIS+7 Total Score Using a Different
Algorithm to Handle Missing Components
mITT
Other analysis: MMRM PP Other analysis: Binary analysis using stratified CMH mITT
4.3.2. Secondary Efficacy Evaluations Secondary efficacy endpoints include Norfolk QOL-DN total score, NIS-W, R-ODS, 10-meter walk test speed, mBMI, and COMPASS-31. To control overall type I error, these endpoints will be tested in a hierarchical order as described in Section 3.6. All the secondary endpoints are assessed at baseline, Month 9, and Month 18 with the exception of mBMI. mBMI is assessed at baseline, Day 84, Day 189, Day 357, Day 462 and Day 546. Day 546 will be used as Month 18 assessment. For 10-meter walk test, the walk speed for patients unable to perform the walk will be imputed as 0. The change from baseline will then be calculated as 0 – baseline walk speed. Change from baseline at Month 18 in the secondary efficacy endpoints will be analyzed for the mITT population, using an MMRM model similar to the model described for the primary analysis of mNIS+7 while adjusting for baseline value of the endpoint being modeled. For these secondary endpoints (except NIS-W), MMRM model will also include baseline NIS (< 50 vs. ≥ 50) as a factor. The MMRM model for NIS-W will not include baseline NIS since baseline NIS-W will be included as a covariate in the model. For the first secondary endpoint Norfolk QOL-DN Total Score, the MMRM method will also be conducted for the PP population. In addition, sensitivity analyses will be conducted using ANCOVA/MI and including data post alternative treatment for FAP similar as described for mNIS+7 (see Section 4.3.1.3). Month 18 change from baseline in mBMI will be estimated from the MMRM model using assessment results from all time points. The planned analyses of the secondary endpoints are summarized in Table 2.

Alnylam Pharmaceuticals, Inc. Statistical Analysis Plan, Protocol ALN-TTR02-004
Final Version 2.1
CONFIDENTIAL 26
Table 2 Analysis of Secondary Endpoints
Endpoint Statistical Method Analysis Population Special Notes
Norfolk QOL-DN total score
Primary analysis: MMRM mITT Sensitivity analysis: • MI/ANCOVA • MMRM - including Data Post
Alternative Treatment for FAP
mITT
Other analysis: MMRM PP NIS-W MMRM mITT Excludes data post
alternative treatment for FAP
R-ODS MMRM mITT 10-meter walk test speed
MMRM mITT For patients unable to perform the walk, walk speed imputed as 0
mBMI MMRM mITT Measured at baseline, Day 84, Day 189, Day 357, Day 462 and Day 546
COMPASS-31 MMRM mITT
4.3.3. Exploratory Efficacy Evaluations The continuous exploratory endpoints including grip strength, SGNFD, IENFD, dermal amyloid content, EQ-5D-5L index, EQ VAS, original NIS+7 and small/large fiber function (defined in Appendix 7.2.1) will be analyzed using an MMRM model similar to those employed for the primary analysis. The categorical exploratory endpoints PND score and FAP stage will be descriptively summarized by presenting the number and percentage of patients in each category for each visit. The number of percentage of patients with improving, no change, and worsening in PND/FAP at each visit will also be summarized. For EQ-5D-5L, a categorical summary of the numbers and percentages of patients reporting each ordinal response within each EQ-5D domain will be presented. Cardiac structure and function will be assessed for all patients through echocardiograms. Cardiac stress and injury will be measured using serum levels of the cardiac biomarkers NT-proBNP and troponin I. Quantification of these biomarkers will be performed at a central laboratory. Descriptive statistics will be provided for actual values, changes, and percentage changes from baseline in echocardiogram parameters, serum levels of troponin I and NT-proBNP by treatment arm. For cardiac subpopulation (defined in Section 4.2), the change from baseline to Month 18 in LV wall thickness, LV mass, LVEF, LV longitudinal strain, NT-proBNP and troponin I will be compared between the 2 treatment arms using MMRM. The model will include baseline value
Alnylam Pharmaceuticals, Inc. Statistical Analysis Plan, Protocol ALN-TTR02-004
Final Version 2.1
CONFIDENTIAL 27
as covariate and fixed effect terms including treatment arm, visit, and treatment-by-visit interaction. All echocardiogram and cardiac function biomarkers data will be presented in data listings. MR neurography data will be presented in a data listing.
4.3.4. Subgroup Analyses Subgroup analyses will be conducted to assess the consistency of treatment effect within various subgroups defined by the following baseline characteristics:
• Age [≥65; <65 at randomization] • Sex [Male; Female] • Race [White; Non-White] • Region [North America; Western Europe; Rest of World] • NIS [< 50; ≥ 50] • Genotype Class [Early-onset V30M; Other] • Previous Tetramer Use [Yes; No] • Genotype [V30M; non-V30M] • FAP Stage [I; II & III]
Subgroup analyses will be performed for the primary endpoint mNIS+7 and Norfolk QOL-DN using MMRM models with baseline mNIS+7 score as a continuous covariate and genotype (V30M vs. non-V30M) as a factor. A forest plot will be generated to illustrate the estimated treatment effect along with 95% CI within each subgroup.
4.3.5. Component Analyses Component analyses will be conducted to assess the consistency of treatment effect on the change from baseline at Month 18 for each of the component of mNIS+7 including NIS-W, NIS-R, QST, ∑5 NCS, and postural blood pressure. The analyses will be performed using MMRM models similar to those employed for the primary analysis. A forest plot will be generated to illustrate the estimated treatment effect along with 95% CI for each component.
4.4. Pharmacodynamic Analyses The PD parameters include serum TTR (ELISA), serum TTR (turbidimetric assay), RBP, and vitamin A. All summary tables and figures will be based on assessments within 21 days of last dose of study drug. Assessments more than 21 days after last dose will be presented in listings and individual patient plots only. Summary tables will be provided for observed values, changes and percentage changes from baseline for each scheduled time point by treatment arm. For serum TTR (ELISA), the maximum percentage reduction and mean percentage reduction over 18 months will be summarized using descriptive statistics. Subgroup analysis will be provided for age (≥ 65 vs. <65), sex (male vs. female), genotype (V30M vs. Non-V30M), and previous tetramer stabilizer use (yes vs. no).

Alnylam Pharmaceuticals, Inc. Statistical Analysis Plan, Protocol ALN-TTR02-004
Final Version 2.1
CONFIDENTIAL 28
For vitamin A and RBP, the mean percentage reduction over 18 months will be summarized using descriptive statistics. The correlation coefficient and p-value based on mixed model will be calculated to assess the correlation between the changes from baseline in ELISA TTR versus Turbidimetric TTR. A scatterplot will be provided to visualize the data. The therapeutic hypothesis for patisiran is that TTR reduction will result in clinical benefit in hATTR patients. The inter-patient variability in the degree of TTR reduction provides an opportunity to examine the relationship of TTR reduction to clinical endpoints. TTR reduction 22 days after the first dose of Patisiran as the first TTR assessment timepoint and prior to the second dose, will be used for analysis of the correlation between TTR reduction and change in mNIS+7 because this time point reduces the impact of missed doses or missed TTR assessments over 18 months of dosing. Pearson correlation coefficients and 95% confidence intervals will be calculated for Day 22 TTR % reduction and mNIS+7 total score change from baseline at the 9- and 18-month time points, for patisiran arm and placebo arm separately. Scatterplots will be provided to visualize the data. All PD data will be displayed in data listings.
4.5. Pharmacokinetic Analyses
4.5.1. Study Variables
4.5.1.1. Concentration Data Urinary concentrations of ALN-18328 (siRNA) and 4-dimethylaminobutyric acid, as well as plasma concentrations of ALN-18328, DLin-MC3-DMA and PEG2000-C-DMG will be obtained. Concentration values that are below the limit of quantification (LLOQ or BLQ) will be set to zero for analysis.
4.5.1.2. Plasma ALN-TTR02 Pharmacokinetic Parameters Model independent PK parameters to be calculated by study visit include:
• Observed post-infusion peak concentration (Cmax) • Observed 30 min post-infusion concentration (Cp (30 min)) • Observed pre-infusion trough concentration (Ctrough)
In addition, steady-state Cmax (Cmax_ss), steady-state Ctrough (Ctrough_ss) and steady-state Cp(30 min) (Cp_ss(30min)) will be calculated. Ctrough_ss is the average Ctrough on Days 253, 400 and 547. Cp_ss(30 min) is the average Cp(30 min) on Days 253 and 547. Cmax_ss is the Cmax on Day 400.
4.5.2. Statistical Methods Descriptive statistics for plasma PK parameters will include the number of patients, mean, SD, coefficient of variation (CV), median, minimum, maximum, geometric mean and geometric CV%. The plasma Cmax, Cp (30min) and Ctrough of ALN-18328 (siRNA), DLin-MC3-DMA and PEG2000-C-DMG will be summarized by nominal sampling day. Urinary amounts of ALN-18328 and 4-dimethylaminobutyric acid recovered will be estimated as urine concentration
Alnylam Pharmaceuticals, Inc. Statistical Analysis Plan, Protocol ALN-TTR02-004
Final Version 2.1
CONFIDENTIAL 29
times the associated urine volume and will be summarized by nominal sampling day. Mean concentrations (+/- SD) will be plotted versus nominal sampling time. Steady-state PK parameters for ALN-18328 (siRNA), DLin-MC3-DMA and PEG2000-C-DMG will be summarized overall and by subgroup (gender, anti-drug antibody status). Plasma concentration data will be presented in by-patient listings. The PK-PD relationship between the plasma concentration of ALN-18328 and the percent change from baseline in TTR protein, vitamin A and RBP will be explored graphically. The PK exposure-response relationships for the primary endpoint (mNIS+7), TTR, and incidence of relevant AEs may also be explored. These may be summarized by ALN-18328, DLin-MC3-DMA and PEG2000-C-DMG PK exposure quartiles at 18-months (Day 546). Population PK and exposure-response modeling will be reported separately.
4.6. Safety Analyses Safety analyses will be conducted using the Safety population. All safety summaries will be descriptive and will be presented by treatment arm.
4.6.1. Study Drug Exposure Duration of drug exposure will be defined as (the last dose of study drug – the first dose of study drug + 21)/30.44 months. Duration of drug exposure, the total number of doses received, duration of infusion (per infusion) and amount of study drug received (per infusion and in total) will be summarized by descriptive statistics. Summaries of the numbers and percentages of patients with missing dose, and the number of missing doses per patient will also be provided. The total amount of drug received and the total volume infused will also be summarized. The number of patients who experienced interruptions of infusions for any reason will be tabulated, as well as the number of patients with infusion interruptions due to an acute infusion reaction. Dosing information for each patient will be presented in a data listing.
4.6.2. Adverse Events All AEs will be coded using the MedDRA coding system (version 18.0 or later) and displayed in tables and data listings using SOC and preferred term. Analyses of AEs will be performed for those events that are considered treatment-emergent, where treatment-emergent is defined as any AE with onset during or after the administration of study drug through 28 days following the last dose of study drug. In addition, any event that was present at baseline but worsened in intensity or was subsequently considered drug-related by the Investigator through the end of the study will be considered treatment-emergent. Events with a fully or partially missing onset date will be assumed to be treatment emergent unless it can be unequivocally determined (from the partial onset date and/or a partial or complete stop date) that the event occurred prior to the first administration of study drug. Adverse events will be summarized by the numbers and percentages of patients reporting a given AE. A patient contributes only once to the count for a given AE (overall, by SOC, by preferred term). Overall event counts and frequencies may also be summarized.
Alnylam Pharmaceuticals, Inc. Statistical Analysis Plan, Protocol ALN-TTR02-004
Final Version 2.1
CONFIDENTIAL 30
An overall summary of AEs will include the number and percentage of patients with any AE, any AE assessed by the Investigator as related to treatment (definite or possible relationship), any severe AE, any severe AE related to treatment, any serious AE (SAE), any SAE related to treatment, any AE leading to treatment discontinuation, any study drug related AE leading to treatment discontinuation, any AE leading to study withdrawal, any study drug related AE leading to study withdrawal, and any deaths. Tabulations by SOC and preferred term will be produced for the following: all AEs; AEs related to treatment; severe AEs; AEs leading to infusion interruption; AEs leading to drug delay; AEs leading to treatment discontinuation; AEs leading to study withdrawal; and SAEs. Separate tables will be provided summarizing signs and symptoms of IRRs (overall and by premedication regimen) and AEs related to premedication (overall and by premedication regimen) by SOC and preferred term. The incidence and frequency of AEs and IRRs over time will also be summarized by SOC and preferred term. Adverse events and AEs related to treatment will also be tabulated by preferred term in decreasing order in frequency in the patisiran arm. Adverse events and SAEs will also be summarized by SOC and preferred term for the cardiac subpopulation. Separate tables will present AE incidence rates by maximum relationship to study drug and by maximum severity. Patients who report multiple occurrences of the same AE (preferred term) will be classified according to the most related or most severe occurrence, respectively. AEs mapping to the standardized MedDRA query (SMQ) Depression and Suicide/Self-injury will be summarized by preferred term. Adverse events mapping to the SMQ Drug Related Hepatic Disorder will be summarized by SOC and preferred term. Adverse events mapping to the SMQ Malignant or Unspecified Tumors will be summarized by high level term and preferred term. Other SMQs or AE groupings may be evaluated. All AEs will be presented in patient data listings. Separate listings will be provided for death, SAEs, AEs leading to treatment discontinuation, AEs leading to study withdrawal, IRRs, AEs related to premedications, AEs related to study procedures, and AEs mapping to the SMQ as described above. A listing of patients who underwent liver transplant will also be provided.
4.6.3. Laboratory Data Clinical laboratory values will be expressed in SI units. Summary data for each laboratory parameter will be presented for each continuous clinical laboratory parameter (including hematology, serum chemistry, coagulation studies and thyroid and liver function tests). Descriptive statistics will be presented for the actual values, change from baseline, and percent change from baseline by visit. For each continuous laboratory parameter, results will be categorized as low, normal, or high based on the laboratory normal ranges. Shift tables will be employed to summarize the baseline category versus the “worst” post-baseline category, where the “worst” post-baseline category will be based on the maximum difference (in absolute value) from the upper or lower limits of the normal range. A listing will be produced for all patients with abnormal liver function tests defined as an ALT > 3×ULN, AST > 3×ULN, and total bilirubin > 2×ULN at any time point. A table will be produced to summarize the number and percentage of patients in each of the below categories at any post-baseline time point.

Alnylam Pharmaceuticals, Inc. Statistical Analysis Plan, Protocol ALN-TTR02-004
Final Version 2.1
CONFIDENTIAL 31
• ALT > 1 & ≤ 3, > 3 & ≤ 5, > 5 & ≤ 10, > 10 & ≤ 20, > 20 ×ULN, • AST > 1 & ≤ 3, > 3 & ≤ 5, > 5 & ≤ 10, > 10 & ≤ 20, > 20 ×ULN, • ALT or AST > 1 & ≤ 3, > 3 & ≤ 5, > 5 & ≤ 10, > 10 & ≤ 20, > 20 ×ULN, • ALP > 1.5 ×ULN, • Total Bilirubin > 1.5 & ≤ 2, > 2 & ≤ 3, > 3 & ≤ 5 and > 5 ×ULN, • Total Bilirubin > 2 ×ULN concurrent with ALT or AST > 3 ×ULN.
A shift table from baseline to worst post-baseline for ALT, AST, and total bilirubin will also be provided. In separate figures, the peak total bilirubin (at any time post-baseline) will be plotted against the peak AST, the peak ALT, and the peak AST or ALT levels at any time post-baseline. For hematology and blood chemistry, summary tables of potentially clinically significant abnormalities will be provided. The results may also be graded according to the NCI CTCAE Version 4.0 or above. A shift summary of baseline to maximum post-baseline CTCAE grade may be presented, as appropriate. The estimated glomerular filtration rate (eGFR, mL/min/1.73 m2) will be categorized as below: ≥ 90; 60-89; 30-59; 15-29 and < 15. A shift summary of baseline to worst post-baseline eGFR category will be presented. All laboratory data will be provided in data listings. Out-of-range laboratory results will be identified in the listings.
4.6.4. Vital Signs and Physical Examination Descriptive statistics will be provided for vital signs, including blood pressure, pulse rate, oral body temperature and respiration rate. Vital sign measurements will be presented for each patient in a data listing. All physical examination findings will be presented in a by-patient data listing. Abnormal physical examination findings will be presented in a separate listing.
4.6.5. Electrocardiogram Electrocardiogram (ECG) findings will include rhythm, ventricular rate, PR interval, QRS duration, QT interval, and QTc interval. For each time point, the results will be the average of measurements from the triplicate ECGs for each patient recorded at that time point. Descriptive statistics will be provided for each measure over time. Change from pre-dose to each post-dose assessment will also be summarized. The number and percentage of patients with normal, abnormal, and clinically significant abnormal results at baseline and each study visit will also be summarized. Corrected QT interval (QTc) will be calculated using both Fridericia’s and Bazett's correction formula. Categorical analyses of the QTcF/QTcB data will be conducted and summarized as follows:
• The number and percentage of patients with maximum increase from baseline in QTcF/QTcB (< 30, 30 – 60, > 60 ms)
• The number and percentage of patients with maximum post-baseline QTcF/QTcB (< 450, 450 – < 480, 480 – 500, > 500 ms)

Alnylam Pharmaceuticals, Inc. Statistical Analysis Plan, Protocol ALN-TTR02-004
Final Version 2.1
CONFIDENTIAL 32
All ECG data for each patient will be provided in a data listing. A separate listing will be provided for patients with any post-baseline value > 500ms or an increase from baseline > 60 ms.
4.6.6. Premedication All patients received premedication in order to reduce the potential of an IRR. The original premedication regimen as outlined below was used at the start of the study. A subset of patients experienced AEs suspected to be related to steroids (e.g., flushing) and were transitioned to a modified premedication regimen, with a reduced dose of corticosteroid to mitigate these events, as sanctioned in the protocol. After observing that the subset of patients tolerated the lower corticosteroid dose with no increase in IRRs, the protocol was amended (Amendment 5.0) to transition the rest of the patients to the modified premedication regimen (see below). The following original premedication regimen was used prior to protocol amendment 5.0:
• Dexamethasone 8 mg PO or equivalent administered the evening before dosing and 20 mg PO at least 60 minutes prior to the start of the infusion of patisiran;
• Paracetamol 500 mg PO or equivalent administered the evening before dosing and at least 60 minutes prior to the start of the infusion of patisiran;
• H2 blocker PO (e.g., ranitidine 150 mg or famotidine 20 mg or equivalent other H2 blocker dose) administered the evening before dosing and at least 60 minutes prior to start of the infusion of patisiran; and
• H1 blocker PO, 10 mg cetirizine or equivalent (hydroxyzine 25 mg or fexofenadine could be substituted if patient did not tolerate cetirizine) administered the evening before dosing and at least 60 minutes prior to start of the infusion of patisiran.
The following reduced premedication regimen was instituted for all patients with protocol amendment 5.0:
• Dexamethasone 10 mg IV or equivalent, administered at least 60 minutes prior to the start of the infusion of patisiran;
• Paracetamol 500 mg PO or equivalent at least 60 minutes prior to the start of the infusion of patisiran;
• H2 blocker IV (e.g., ranitidine 50 mg, famotidine 20 mg, or equivalent other H2 blocker dose) at least 60 minutes prior to the start of the infusion of patisiran; and
• H1 blocker IV, diphenhydramine 50 mg (or equivalent other IV H1 blocker available at the study site) at least 60 minutes prior to the start of the infusion of patisiran. Hydroxyzine 25 mg PO or fexofenadine 30 or 60 mg PO or cetirizine 10 mg PO could be substituted for any patient who did not tolerate IV diphenhydramine or other IV H1 blocker.
A drug exposure table summarizing the treatment duration under “original” and “reduced” regimens will be provided. A patient who switches from “original” to “reduced” regimen during treatment will be counted in both categories. Premedications will be coded using the WHO Drug Dictionary (March 2015 or later). Results will be tabulated by anatomic therapeutic class (ATC) and preferred term.

Alnylam Pharmaceuticals, Inc. Statistical Analysis Plan, Protocol ALN-TTR02-004
Final Version 2.1
CONFIDENTIAL 33
Premedication data will be listed. In addition, a listing will be provided to present the durations of study drug exposure under original regimen and reduced regimen for each patient.
4.6.7. Prior and Concomitant Medications Prior and concomitant medications will be coded using the WHO Drug Dictionary (March 2015 or later). Results will be tabulated by ATC and preferred term. When there are partial or missing dates, imputed dates will be used to determine 1) if a medication is prior or concomitant, and 2) duration of exposure of alternative FAP treatment (tafamidis/diflunisal). Imputed dates will not be presented in the listings. For medications with partial start or stop dates: the first day/month will be imputed for start date, and the last day/month will be imputed for stop date. For medications with a completely missing start date, the medications will be considered as started prior to the first dose of study drug; medications will be classified as prior, concomitant or both depending on the medication stop dates. For medications with a completely missing stop date, the end of study date will be imputed. Prior and concomitant medications will be presented in data listings.
4.6.8. Ophthalmology Examinations Ophthalmology examinations include Visual Acuity, Visual Field, Slit Lamp Biomicroscopy, Intraocular Pressure, Dilated Indirect Ophthalmoscopy, and Fundus Photography. Visual Acuity, Visual Field, and Intraocular Pressure Results: The actual value and change from baseline results will be summarized. Biomicroscopy (Slit Lamp) and Dilated Indirect Ophthalmoscopy Exam Results: For the baseline results, the number and percentage of patients falling into each category of the examination status (normal, abnormal/not clinically significant, abnormal/clinically significant) will be summarized for each eye structure. For post-baseline results, the number and percentage of patients falling into each category of the examination status (new findings/worsening of finding, no change, improvement of finding, etc.) will be summarized for each eye structure. Abnormal fundus findings at baseline will be recorded in the medical history log. Treatment-emergent abnormal fundus findings that are considered clinically significant will be recorded in the AE log. Data for each of these assessments will be provided in a data listing.
4.6.9. Suicidality Questionnaire The number and percentage of patients experiencing the suicidal ideation, suicidal behavior, or self-injurious behavior composite outcomes (and individual components) will be summarized by visit. A shift table will be employed to summarize the baseline C-SSRS category versus the worst post-baseline C-SSRS category; the categories are defined as 1) no suicidal ideation or behavior, 2) suicidal ideation, and 3) suicidal behavior. Patients experiencing both suicidal ideation and suicidal behavior are included in the suicidal behavior category. Data from the C-SSRS questionnaire will be provided in a data listing.
Alnylam Pharmaceuticals, Inc. Statistical Analysis Plan, Protocol ALN-TTR02-004
Final Version 2.1
CONFIDENTIAL 34
4.7. Anti-Drug Antibody The number and percentage of patients with confirmed positive ADA assay results at any time point during study as well as at each scheduled visit will be summarized. The titer results for patients with confirmed positive ADA results will also be summarized using descriptive statistics. For patients with confirmed positive ADA results, spaghetti plots for the serum TTR (ELISA) over time and the plasma concentration of ALN-18328, DLin-MC3-DMA and PEG2000-C-DMG over time will be presented. Effect of positive ADAs on efficacy and safety (e.g., IRRs) may also be explored. Anti-drug antibody (ADA) data and patients with confirmed positive ADA results will be presented in data listings.
Alnylam Pharmaceuticals, Inc. Statistical Analysis Plan, Protocol ALN-TTR02-004
Final Version 2.1
CONFIDENTIAL 35
5. CHANGES TO PLANNED ANALYSES The SAP version 2.0 includes more details previously not discussed in the original SAP version 1.0. The following major changes will be implemented in the SAP version 2.0 that are different from the planned analysis specified in the SAP version 1.0 and/or the protocol version 6.0. This SAP Version 2.1 incorporates an additional change to censor data post alternative treatment for the analysis of NIS-W, which is documented in Section 5.6.
5.1. Primary Analysis Method for Efficacy Endpoints In the study protocol and the original SAP V1.0, the primary analysis method specified for the primary and secondary efficacy endpoints was the MI/ANCOVA. The original SAP V1.0 was submitted for FDA review (IND Serial # 0019). Following FDA’s comment received on 02July2015 and the sponsor’s responses on 31August2015, the primary analysis method for all efficacy endpoints will be changed to MMRM method. The history and rationales for the change of primary analysis method are described below. The change is aligned with the CHMP guideline on missing data in confirmatory clinical trials (EMA/CPMP/EWP/1776/99 Rev.1). Mixed-effects model repeated measures and MI are 2 common methods for handling missing data in analysis of continuous, longitudinal endpoints. For this study, ANCOVA/MI was originally selected as the primary analysis, with MMRM as a key sensitivity analysis. In the literature, MMRM and MI have been compared in several simulation studies. Collins et al. (2001) noted that the 2 methods yielded similar inference. However, Barnes et al. (2008) found a larger average standard error for MI relative to MMRM, suggesting that MI controls type I error conservatively and loses power to detect true treatment differences. Siddiqui (2011) compared MI/ ANCOVA and MMRM approaches using both simulated datasets and 25 New Drug Application (NDA) datasets of neuropsychiatric drug products, and concluded that MMRM appears to be a better choice in maintaining statistical properties relative to the MI approach when dealing with ignorable missing data. For the ALN-TTR02-004 trial setting, we compared the properties of these 2 methods via simulation. Our results demonstrated that, while both methods control type I error, MMRM appears to be more powerful in detecting true treatment effect compared with ANCOVA/MI. Moreover, White et al. (2012) argued that excessive focus on including all randomized patients with missing outcomes can lead to a choice of analysis that rests on implausible or unnecessarily complex imputation. The authors proposed that the main focus in choosing the primary analysis should be the plausibility of its assumptions, while inclusion of all randomized individuals is a requirement only for sensitivity analyses. The MI approach, which includes all randomized patients, is often designated as a sensitivity analysis. Given these findings – and consideration of the complexity inherent when using the multistep MI approach, the primary analysis method will be changed to MMRM for the primary and secondary efficacy endpoints. MI/ANCOVA will be performed as the key sensitivity analysis for the primary endpoint and for the first secondary endpoint (Norfolk QOL).
5.2. Multiple Imputation/ANCOVA Method The MI/ANCOVA method, as described in this document and in SAP V1.0, differs from that described in the current clinical protocol (Version 6: September 2015) in the MI method and in the explanatory covariates included in the (complete data) ANCOVA (discussed in Section 5.4).
Alnylam Pharmaceuticals, Inc. Statistical Analysis Plan, Protocol ALN-TTR02-004
Final Version 2.1
CONFIDENTIAL 36
The MI (for completely missing mNIS+7 assessments) described in the SAP differs from that in the clinical protocol in that 1) stepwise variable selection has been replaced with a pre-specified set of covariates to be included; 2) imputation is done separately by treatment arm. The rationale for these changes is outlined below.
• Stepwise variable selection was removed in order to simplify the analysis. • The SAP specifies that imputation is done separately by study arm; the current protocol
specifies says that treatment assignment will not be included in the imputation. This change is motivated by simulations demonstrating a non-negligible loss in power when a single imputation model is employed and treatment is not included in the model; this loss in power is due to “cross-contamination” of imputation models between randomized arms [9].
In the protocol, the number of imputed datasets was specified as 100. In SAP V1.0, the number of imputed datasets was reduced to 10 following the conclusion that 3-5 imputations are often sufficient [10], however, in this SAP V2.0, the number of imputed datasets is increased to 100 to have more precise estimates.
5.3. Hierarchical Testing Order of Secondary Endpoints In the protocol and SAP version 1.0, it was specified that secondary endpoints would be tested in the following order for the control of overall type I error: Norfolk QOL, NIS-W score, mBMI, 10-meter walk test, and COMPASS-31. In this SAP amendment, R-ODS has been added as a secondary endpoint for controlled hypothesis testing, and 10-meter walk test has been moved up in the hierarchy. The revised list and order of secondary endpoints is the following: Norfolk QOL, NIS-W, R-ODS, 10-meter walk test, mBMI and COMPASS-31. These changes were based on the Sponsor’s re-assessment of the clinical importance of these endpoints in hATTR amyloidosis patients.
5.4. Adjustment for Covariates in Statistical Models The table below summarizes the history of changes in baseline covariates used in the statistical models.
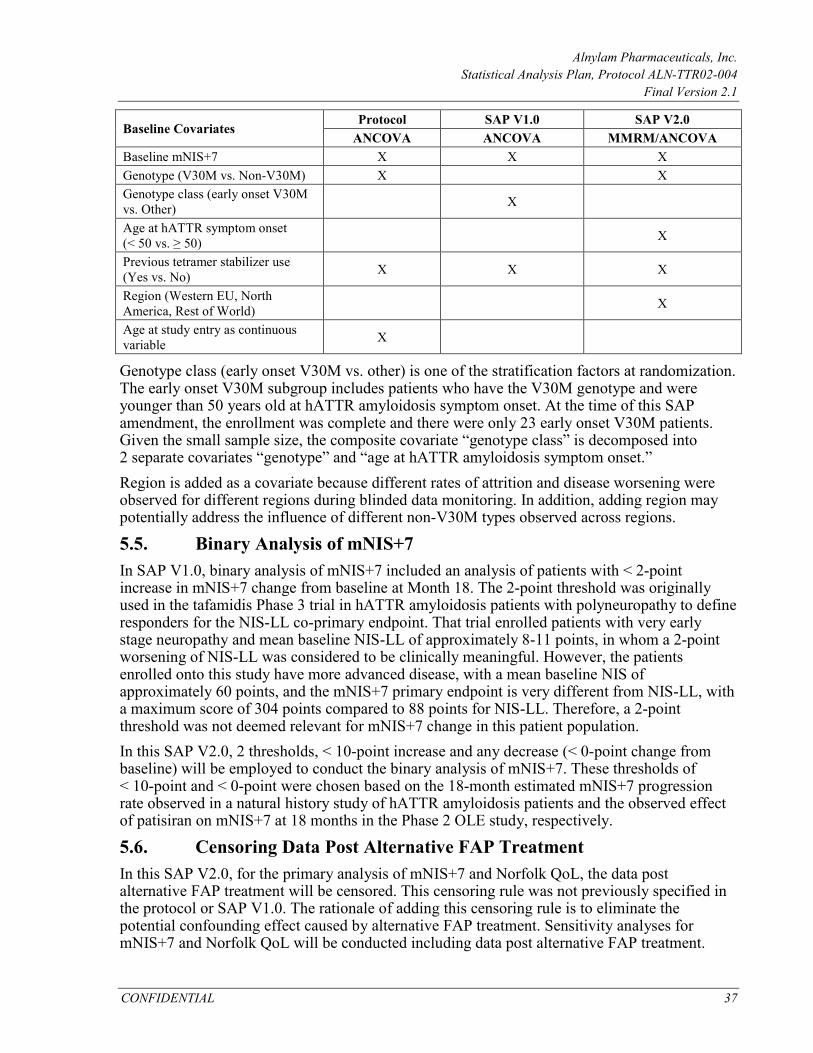
Alnylam Pharmaceuticals, Inc. Statistical Analysis Plan, Protocol ALN-TTR02-004
Final Version 2.1
CONFIDENTIAL 37
Baseline Covariates Protocol SAP V1.0 SAP V2.0
ANCOVA ANCOVA MMRM/ANCOVA Baseline mNIS+7 X X X Genotype (V30M vs. Non-V30M) X X Genotype class (early onset V30M vs. Other) X
Age at hATTR symptom onset (< 50 vs. ≥ 50) X
Previous tetramer stabilizer use (Yes vs. No) X X X
Region (Western EU, North America, Rest of World) X
Age at study entry as continuous variable X
Genotype class (early onset V30M vs. other) is one of the stratification factors at randomization. The early onset V30M subgroup includes patients who have the V30M genotype and were younger than 50 years old at hATTR amyloidosis symptom onset. At the time of this SAP amendment, the enrollment was complete and there were only 23 early onset V30M patients. Given the small sample size, the composite covariate “genotype class” is decomposed into 2 separate covariates “genotype” and “age at hATTR amyloidosis symptom onset.” Region is added as a covariate because different rates of attrition and disease worsening were observed for different regions during blinded data monitoring. In addition, adding region may potentially address the influence of different non-V30M types observed across regions.
5.5. Binary Analysis of mNIS+7 In SAP V1.0, binary analysis of mNIS+7 included an analysis of patients with < 2-point increase in mNIS+7 change from baseline at Month 18. The 2-point threshold was originally used in the tafamidis Phase 3 trial in hATTR amyloidosis patients with polyneuropathy to define responders for the NIS-LL co-primary endpoint. That trial enrolled patients with very early stage neuropathy and mean baseline NIS-LL of approximately 8-11 points, in whom a 2-point worsening of NIS-LL was considered to be clinically meaningful. However, the patients enrolled onto this study have more advanced disease, with a mean baseline NIS of approximately 60 points, and the mNIS+7 primary endpoint is very different from NIS-LL, with a maximum score of 304 points compared to 88 points for NIS-LL. Therefore, a 2-point threshold was not deemed relevant for mNIS+7 change in this patient population. In this SAP V2.0, 2 thresholds, < 10-point increase and any decrease (< 0-point change from baseline) will be employed to conduct the binary analysis of mNIS+7. These thresholds of < 10-point and < 0-point were chosen based on the 18-month estimated mNIS+7 progression rate observed in a natural history study of hATTR amyloidosis patients and the observed effect of patisiran on mNIS+7 at 18 months in the Phase 2 OLE study, respectively.
5.6. Censoring Data Post Alternative FAP Treatment In this SAP V2.0, for the primary analysis of mNIS+7 and Norfolk QoL, the data post alternative FAP treatment will be censored. This censoring rule was not previously specified in the protocol or SAP V1.0. The rationale of adding this censoring rule is to eliminate the potential confounding effect caused by alternative FAP treatment. Sensitivity analyses for mNIS+7 and Norfolk QoL will be conducted including data post alternative FAP treatment.

Alnylam Pharmaceuticals, Inc. Statistical Analysis Plan, Protocol ALN-TTR02-004
Final Version 2.1
CONFIDENTIAL 38
In SAP V2.1, an update was made to apply the censoring rule to NIS-W as well so that the results will be consistent with the component analysis of mNIS+7. For all other efficacy endpoints, the data will not be censored since no sensitivity analyses are planned.
5.7. Other Changes Additional changes are listed in the table below.
Change from Protocol and/or SAP V1.0 Detailed Description/Rationale In the protocol and original SAP V1.0, the first day of drug administration was designated as Day 0. In this SAP amendment and the TLF outputs, the first dose day will be defined as Day 1.
The change is made to follow CDISC convention. Each calculated study day after dosing is 1 day plus the reported study day following the protocol defined Schedule of Assessments.
In the protocol and original SAP V1.0, it was intended that an interim analysis for sample size re-estimation would be conducted; however, no interim analysis was conducted during the study.
In 2013, Berk et al. published results of a randomized placebo-controlled trial of diflunisal in FAP. This trial demonstrated that efficacy using a composite neurologic impairment score primary endpoint (NIS+7) could be established in a similar population with a similar study design and smaller study size (N=130). The sponsor believed that an interim analysis for sample size reassessment was therefore no longer necessary.
In SAP V2.0, dermal amyloid content is added as an exploratory endpoint.
In addition to IENFD and SGNFD, skin punch biopsies will also be assessed for dermal amyloid content, which has been added as an efficacy parameter in this SAP V2.0.
In SAP V2.0, the walk speed for patients unable to perform the walk will be imputed as 0.
The imputation algorithm is added to address the informative missing data for patients unable to perform the walk due to worsening of disease.
Renal clearance for siRNA and 4-dimethylaminobutyric acid (DMBA) will not be analyzed.
As per protocol, renal clearance for siRNA and 4-dimethylaminobutyric acid (DMBA) were to be determined whenever possible. Only sparse pre-dose urine collections (and volumes) were obtained in patients enrolled in this study on select days that patients returned to the clinic for dosing (Days 0, 21, 126, 252, 399, 546 and at time of early withdrawal). In order to estimate renal clearance, detailed serial urine and corresponding plasma collections that describe a time course of exposures in both matrices over a dosing interval within individual subjects are required. As it is not possible to reliably estimate the renal clearance for either siRNA or DMBA in individual patients using standard pharmacokinetic methods based on the limited urine and plasma sampling implemented in this outpatient study, renal clearance estimation for either analyte were not performed and cannot be reported for this study.

Alnylam Pharmaceuticals, Inc. Statistical Analysis Plan, Protocol ALN-TTR02-004
Final Version 2.1
CONFIDENTIAL 39
Change from Protocol and/or SAP V1.0 Detailed Description/Rationale In SAP V2.0, the definition for cardiac subpopulation was added. This subpopulation was not previously defined in the protocol or in SAP V1.0.
In SAP V2.0, the cardiac subpopulation was defined in Section 4.2 as the following: the cardiac subpopulation will be comprised of patients with pre-existing cardiac amyloid involvement, defined as patients with baseline left ventricular (LV) wall thickness ≥ 1.3 cm and no aortic valve disease or hypertension in medical history.

Alnylam Pharmaceuticals, Inc. Statistical Analysis Plan, Protocol ALN-TTR02-004
Final Version 2.1
CONFIDENTIAL 40
6. REFERENCES 1 Yazaki M., Tokuda T, et al. Cardiac amyloid in patients with familial amyloid
polyneuropathy consists of abundant wild-type transthyretin. Biochem Biophys Res Commun. 2000; 274(3): 702-706.
2 Stangou AJ and Hawkins PN. Liver transplantation in transthyretin-related familial amyloid polyneuropathy. Current Opinion in Neurology. 2004;17(5): 615-620.
3 Reixach NS. Deechongkit, et al. Tissue damage in the amyloidoses: Transthyretin monomers and nonnative oligomers are the major cytotoxic species in tissue culture. Proc Natl Acad Sci U SA. 2004;101(9): 2817-2822.
4 Suhr OB, Herlenius G, et al. Liver transplantation for hereditary transthyretin amyloidosis. Liver Transpl. 2000;6(3): 263-276.
5 Benson MD. Familial amyloidotic polyneuropathy. Trends Neurosci. 1989;12(3):88-92.
6 Connors LH, Yamashita T, et al. A rare transthyretin mutation (Asp18Glu) associated with cardiomyopathy. Amyloid. 2004;11(1):61-66.
7 Buxbaum JN. (2007). Transthyretin and the Transthyretin Amyloidoses. Protein Reviews: Protein Misfolding, Aggregation, and Conformational Diseases. V. N. a. F. Uversky, A. New York, Springer US. 7: 259-283.
8 Coelho T, Adams D, Silva A, et al. Safety and Efficacy of an RNAi Therapeutic Targeting Transthyretin (TTR) for TTR Amyloidosis. NEJM. 2013, accepted for publication.
9 Rubin, DB (2006). http://www.fda.gov/ohrms/dockets/ac/06/briefing/2006-4269b1_05_sponsor.pdf.
10 Rubin, DB. Multiple Imputation after 18+ Years. Journal of the American Statistical Association, 1996; 91:473–489.
11 Mallinckrodt CH, Lane PW, Schnell D, Peng Y, Mancuso JP. Recommendations for the primary analysis of continuous endpoints in longitudinal clinical trials. Drug Inf J. 2008;7:303–319.
12 Collins, L.M., Schafer, J.L., and Kam, C.M. (2001). A comparison of inclusive and restrictive missing-data strategies in modern missing-data procedures. Psychological Methods, 6, 330-351.
13 Barnes, S. A., Kallin, C., David, S. R., Mallinckrodt, C. H (2008). The impact of missing data and how it is handled on the rate of false positive results in drug development. Pharmaceutical Statistics 7:215–225.
14 Siddiqui, O. (2011). MMRM versus MI in Dealing with Missing Data – A Comparison Based on 25 NDA Data Sets, Journal of Biopharmaceutical Statistics, 21: 423–436, 2011.
15 White I.R., Carpenter J, Horton N.J. (2012). Including all individuals is not enough: lessons for intention-to-treat analysis, Clinical Trials. 2012 Aug; 9 (4):396-407.
Alnylam Pharmaceuticals, Inc. Statistical Analysis Plan, Protocol ALN-TTR02-004
Final Version 2.1
CONFIDENTIAL 41
7. APPENDICES 7.1. Detailed Statistical Methodology for Pattern Mixture Model In the PMM analysis, similar to the primary analysis, mNIS+7 assessments performed after the initiation of alternative treatment for FAP will be treated as missing. For non-monotone missing data, the 9-month assessment will be imputed as the treatment group mean. The non-monotone missing data is expected to be rare. As an initial step, an intermediate mNIS+7 dataset for all mITT patients will be prepared which will include the key variables listed in the table below. Key Variables Description Patient number Unique subject ID for each patient in mITT population Treatment arm Placebo or patisiran Baseline variables Including gender, genotype, age at ATTR onset, previous tetramer stabilizer
use, region, KPS, FAP stage (I vs. II/III), and cardiac subpopulation. Baseline mNIS+7 score mNIS+7 total score change from baseline at Month 9
Set as missing if a patient does not have 9-month data; If a patient has 18-month mNIS+7 but is missing 9-month (non-monotone missingness), the 9-month value will imputed as the treatment group mean.
On-treatment flag for Month 9 If 9-month assessment is non-missing: If assessment date – last dose date ≤ 60 days, then flag = “yes” otherwise flag = “no”
If 9-month assessment is missing: If Day 254 (scheduled 9-month visit) – last dose date ≤ 60, then flag = “yes” otherwise flag = “no”
mNIS+7 total score change from baseline at Month 18
Set as missing if a patient does not have 18-month data
On-treatment flag for Month 18 If 18-month assessment is non-missing: If assessment date – last dose date ≤ 60 days, then flag = “yes” otherwise flag = “no”
If 18-month assessment is missing: If Day 554 (scheduled 18-month visit) – last dose date ≤ 60, then flag = “yes” otherwise flag = “no”
Death flag Flag = “yes” if a patient has missing 18-month mNIS+7 and death day ≤ 561; otherwise flag = “no”
Step 1: For patients who have missing data and are alive before Month 18: imputation of missing data for the placebo arm and for the patisiran arm during the on-treatment period. In the first step, missing data for the placebo arm and missing data for the patisiran arm during the on-treatment period will be imputed under the MAR assumption. Multiple imputation will be conducted among patisran and placebo patients separately using a regression procedure, including the following covariates: baseline mNIS+7 score, genotype, age at ATTR onset, prior tetramer stabilizer use, region, KPS, FAP stage (I vs. II/III), cardiac subpopulation and gender. The input dataset DATAIN will include a subset of the above dataset with Death Flag = “no.” For patisiran patients, the mNIS+7 data collected after treatment discontinuation will be excluded (set as missing). If Treatment Arm = “patisiran”:

Alnylam Pharmaceuticals, Inc. Statistical Analysis Plan, Protocol ALN-TTR02-004
Final Version 2.1
CONFIDENTIAL 42
i) If On-Treatment Flag for Month 9 = “no” then mNIS+7 change at Month 9 will be set as missing.
ii) If On-Treatment Flag for Month 18 = “no” then mNIS+7 change at Month 18 will be set as missing.
Below is a sample SAS code:
proc mi data=DATAIN out=DATA_STEP1 seed=234 nimpute=100; by treatment; monotone method=reg;
var baseline_variables mNIS_BASE mNIS_chg_m9 mNIS_chg_m18; run;
For patisiran arm, the imputed scores during the on-treatment period will be kept while the imputed scores after treatment discontinuation will be discarded and replaced by either observed non-missing values or imputed values described in the next step. In the output dataset DATA_STEP1, if Treatment Arm = “patisiran”:
i) If On-Treatment Flag for Month 9 = “no” then mNIS+7 change at Month 9 will be replaced by the value in DATAIN.
ii) If On-Treatment Flag for Month 18 = “no” then mNIS+7 change at Month 18 will be replaced by the value in DATAIN.
Denote this updated dataset as DATA_STEP1_2. Step 2: For patients who have missing data and are alive before Month 18: imputation of missing data for the patisiran arm after treatment discontinuation. In the second step, missing data for the patisiran arm after treatment discontinuation will be imputed using the PMM approach by creating control-based pattern imputation. Below is a sample SAS code:
proc mi data=DATA_STEP1_2 out=DATA_STEP2 nimpute=1 seed=xxx; by _imputation_;
class treatment; monotone method=reg; mnar model (mNIS_chg_m9 mNIS_chg_m18/modelobs=(treatment=’placebo’)); var baseline_variables mNIS_BASE mNIS_chg_m9 mNIS_chg_m18;
run; Step 3: Imputation of missing data for patients who died before Month 18, regardless of treatment arm. For patients with Death Flag = “yes,” missing 18-month mNIS+7 change from baseline scores will be imputed 100 times, using a random draw from the worst 10% 18-month mNIS+7 change scores among all non-missing values in the dataset DATAIN. Concatenate these records with DATA_STEP2, and sort by dataset number and patient number. After step 3, each of the complete dataset will be analyzed by an ANCOVA model. The resulting estimates (LS means and standard errors) will be combined using SAS PROC MIANALYZE.
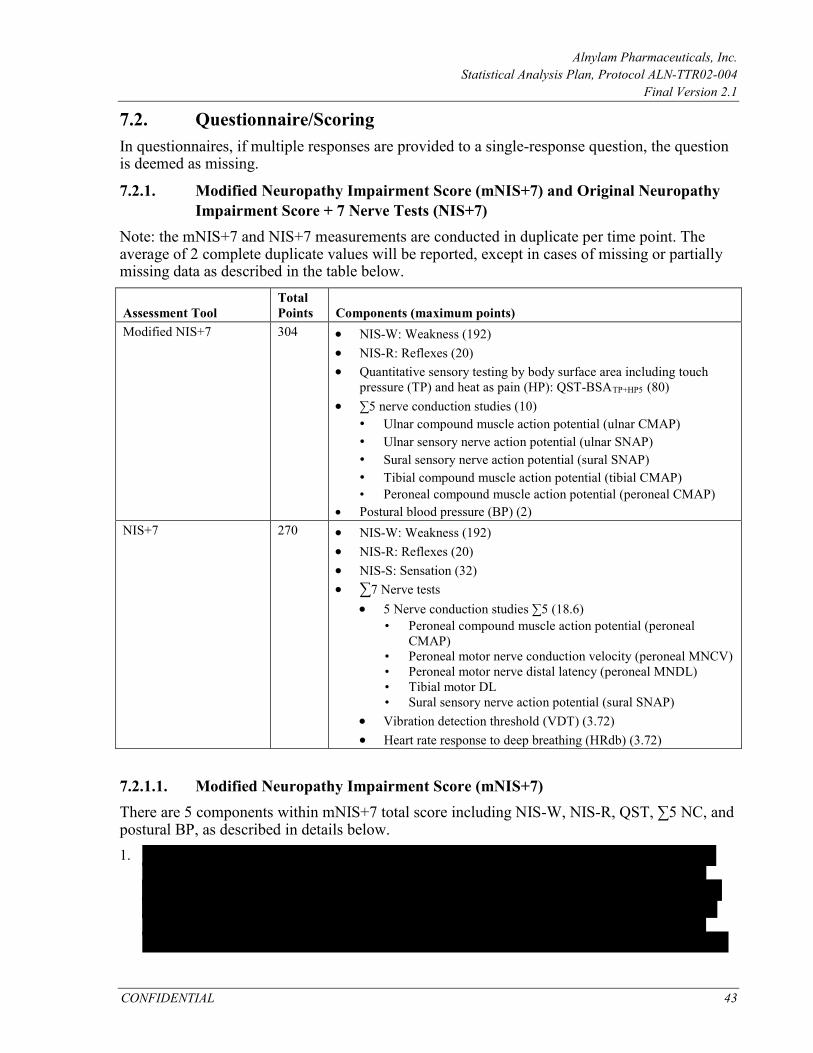
Alnylam Pharmaceuticals, Inc. Statistical Analysis Plan, Protocol ALN-TTR02-004
Final Version 2.1
CONFIDENTIAL 43
7.2. Questionnaire/Scoring In questionnaires, if multiple responses are provided to a single-response question, the question is deemed as missing.
7.2.1. Modified Neuropathy Impairment Score (mNIS+7) and Original Neuropathy Impairment Score + 7 Nerve Tests (NIS+7)
Note: the mNIS+7 and NIS+7 measurements are conducted in duplicate per time point. The average of 2 complete duplicate values will be reported, except in cases of missing or partially missing data as described in the table below.
Assessment Tool Total Points Components (maximum points)
Modified NIS+7 304 • NIS-W: Weakness (192) • NIS-R: Reflexes (20) • Quantitative sensory testing by body surface area including touch
pressure (TP) and heat as pain (HP): QST-BSATP+HP5 (80) • ∑5 nerve conduction studies (10)
• Ulnar compound muscle action potential (ulnar CMAP) • Ulnar sensory nerve action potential (ulnar SNAP) • Sural sensory nerve action potential (sural SNAP) • Tibial compound muscle action potential (tibial CMAP) • Peroneal compound muscle action potential (peroneal CMAP)
• Postural blood pressure (BP) (2) NIS+7 270 • NIS-W: Weakness (192)
• NIS-R: Reflexes (20) • NIS-S: Sensation (32) • ∑7 Nerve tests
• 5 Nerve conduction studies ∑5 (18.6) • Peroneal compound muscle action potential (peroneal
CMAP) • Peroneal motor nerve conduction velocity (peroneal MNCV) • Peroneal motor nerve distal latency (peroneal MNDL) • Tibial motor DL • Sural sensory nerve action potential (sural SNAP)
• Vibration detection threshold (VDT) (3.72) • Heart rate response to deep breathing (HRdb) (3.72)
7.2.1.1. Modified Neuropathy Impairment Score (mNIS+7) There are 5 components within mNIS+7 total score including NIS-W, NIS-R, QST, ∑5 NC, and postural BP, as described in details below. 1.

Alnylam Pharmaceuticals, Inc. Statistical Analysis Plan, Protocol ALN-TTR02-004
Final Version 2.1
CONFIDENTIAL 44
Alnylam Pharmaceuticals, Inc. Statistical Analysis Plan, Protocol ALN-TTR02-004
Final Version 2.1
CONFIDENTIAL 45
•
7.2.1.2. Original Neuropathy Impairment Score (NIS+7) The components of NIS+7 include the following: 1. NIS-W as described in previous section. 2. NIS-R as described in previous section. 3. NIS-S is the sum of the finger and toe sensation components (touch pressure, pin-prick,
vibration, joint position). Assessments are performed separately for the right- and left-hand side of the body. Scoring for the sensory assessment is 0 (normal), 1 (decreased) and 2 (absent). The maximum total score for NIS-S is 32.
4. ∑7 nerve tests normal deviates includes the following: • ∑5 nerve conductions:
o For peroneal DL and tibial DL, using normal deviate o For peroneal CMAP, peroneal CV and sural SNAP, using (-1) × normal deviate
• Vibration detection threshold (VDT): using normal deviate • Heart rate response to deep breathing (HRdb): using (-1) × normal deviate
Each normal deviate ranges from -3.72 to +3.72. The total score is calculated as the mean normal deviates of the non-missing 7 nerve tests and multiply this value by 7. The total score ranges from -26 to +26.
Missing values will be handled as follows:
• Missing items within the 7 nerve tests are handled in step 5 above. • If a component of NIS+7 (NIS-W, NIS-R, NIS-S, and 7 nerve tests) is missing from
replicate A, then impute the component from replicate B recover 2 complete replicate NIS+7 measures A and B.
• If both replicates A and B are incomplete at different components, insert A components into B and B components into A as necessary recover 2 complete replicate NIS+7 measures A and B.
• If NIS-W component is missing from both replicates A & B, NIS+7 score is considered as missing. If 1 of the other NIS+7 components (NIS-R, NIS-S, and 7 nerve tests) is missing from both replicates A and B, impute this component as the average of the other patients at this time point who had non-missing data (within study arm).
• If 1 entire NIS+7 replicate is missing, use the singular (other) replicate rather than the average of the 2 in subsequent calculations.
• If no single complete NIS+7 measure can be found or recovered, NIS+7 score is considered as missing.
7.2.1.3. NIS Total Score NIS total score is the sum of NIS-W, NIS-R, and NIS-S. The handling of missing data is similar as the steps described for mNIS+7. If NIS-W is missing from both replicates, NIS score is considered as missing.
Alnylam Pharmaceuticals, Inc. Statistical Analysis Plan, Protocol ALN-TTR02-004
Final Version 2.1
CONFIDENTIAL 46
7.2.1.4. Large Fiber Nerve Function The large fiber nerve function is the sum of the point scores of the following:
•
The maximum possible large fiber nerve function score is 52.
The handling of missing data is similar as the steps described for mNIS+7. If QST-BSATP is missing from both replicates, the large fiber nerve function score is considered as missing.
7.2.1.5. Small Fiber Nerve Function The small fiber nerve function score is the sum of the point score of the following:
. The maximum possible small fiber nerve function score is 44. The handling of missing data is similar as the steps described for mNIS+7. If QST-BSAHP5 is missing from both replicates, the small fiber nerve function score is considered as missing.
7.2.1.6. Algorithms for Setting Normal Deviates and Points For nerve conductions and HRdb tests, raw values are provided by the Mayo Clinic. Each raw value is first converted to a z-score which is then used to set either normal deviate or point score.

Alnylam Pharmaceuticals, Inc. Statistical Analysis Plan, Protocol ALN-TTR02-004
Final Version 2.1
CONFIDENTIAL 47
For a given parameter, the calculated z-score is then compared to 2 lookup tables (see below) using the following procedure to assign the normal deviate score:
1.

Alnylam Pharmaceuticals, Inc. Statistical Analysis Plan, Protocol ALN-TTR02-004
Final Version 2.1
CONFIDENTIAL 48
6.
The points for the parameters are calculated as follows: 1.

Alnylam Pharmaceuticals, Inc. Statistical Analysis Plan, Protocol ALN-TTR02-004
Final Version 2.1
CONFIDENTIAL 49
Alnylam Pharmaceuticals, Inc. Statistical Analysis Plan, Protocol ALN-TTR02-004
Final Version 2.1
CONFIDENTIAL 50
Alnylam Pharmaceuticals, Inc. Statistical Analysis Plan, Protocol ALN-TTR02-004
Final Version 2.1
CONFIDENTIAL 51
Extended Percentiles Table
Variable WLOWER WUPPER ZLOWER ZUPPER HRdb UMAE PMAK PMCVK PMLA TMAK TMLA USAW SSAB
7.2.2. Norfolk Quality of Life-Diabetic Neuropathy (QOL-DN) QOL-DN is a tool for assessing patients’ perception of the effects of diabetes and diabetic neuropathy. There are 35 questions divided into 5 domains. The range of possible total scores is -4 to 136. Part I: Symptoms

Alnylam Pharmaceuticals, Inc. Statistical Analysis Plan, Protocol ALN-TTR02-004
Final Version 2.1
CONFIDENTIAL 52
Part II: Activities of Daily Life
Subscales and Scoring Algorithm The Total QOL and 5 domains should be summed as follows:
• Total QOL • Physical Functioning/Large Fiber • Activities of Daily Living (ADLs) • Symptoms • Small Fiber • Autonomic
The total score and domain scores are calculated without weighting of any kind, and reported as the integer sum of the listed questionnaire items. Domain scores are calculated as the rounded integer value of the average scores of non-missing included items multiplied by the number of items if at least 50% of the items are non-missing. A domain score is missing if more than 50% of the included items are missing. If the scores for all 5 domains are non-missing, then Total QOL is the sum of scores of the 5 domains; however, if at least 1 of the domains is missing and at least 50% of the items (18 items) are non-missing, then Total QOL is calculated as 35 times the mean of the non-missing items, rounded to the nearest integer. Otherwise, Total QOL is deemed as missing.
7.2.3. EuroQOL-5-Dimension 5-Level (EQ-5D-5L) Each of the 5 dimensions (Mobility, Self-Care, Usual Activities, Pain/Discomfort, Anxiety/Depression) is scored on a 5-point Likert scale from 1 (“I have no problems/pain/anxiety”) to 5 (“I am unable to…,” “I have extreme anxiety/depression”). The 5 scores are concatenated together (in the order of Mobility, Self-Care, Usual Activities, Pain/Discomfort, Anxiety/Depression) to create an EQ-5D-5L profile (e.g., 11111, 55555). The profile is then used to obtain an index value using the United States value set. The index values range from –0.109, associated with a profile of 55555, to 1.0, associated with a profile of 11111. Smaller index values indicate greater impairment. Missing values are handled as follows:
• Missing items are coded as “9” in creating patient profiles. • The index value is deemed as missing when responses are missing for 1 or more of the
5 dimensions. • If the entire instrument is missing, the EQ-5D-5L index value is considered as missing.

Alnylam Pharmaceuticals, Inc. Statistical Analysis Plan, Protocol ALN-TTR02-004
Final Version 2.1
CONFIDENTIAL 53
7.2.4. Rasch-Built Overall Disability Scale (R-ODS)
The R-ODS consists of 24 items scored on a scale of 0 (unable to perform), 1 (able to perform, but with difficulty) or 2 (able to perform without difficulty). A total score will be calculated as the average of all non-missing items multiplied by 24 if at least 90% of the items are non-missing. The total score will be deemed as missing if more than 10% of the items (3 or more items) are missing.
7.2.5. Composite Autonomic Symptom Score (COMPASS-31) The COMPASS-31 questionnaire comprises 6 domains: Orthostatic intolerance, Vasomotor, Secretomotor, Gastrointestinal, Bladder, and Pupillomotor. Within each domain, individual questions are scored as follows: Simple yes or no questions are scored as 0 points for no and 1 point for yes. Questions about a specific site of symptoms or symptoms under specific circumstances are scored as 0 if not present and as 1 if present for each site or circumstance. All questions regarding the frequency of symptoms are scored as 0 points for rarely or never, 1 point for occasionally or sometimes, 2 points for frequently or “a lot of the time,” and 3 points for almost always or constantly. All questions regarding the severity of symptoms are scored as 1 point for mild, 2 points for moderate, and 3 points for severe. Questions assessing the time course of a symptom are scored 0 points for responses such as “gotten somewhat better,” “gotten much better,” “completely gone,” and “I have not had any of these symptoms,” 1 point for “stayed about the same,” 2 points for “gotten somewhat worse,” and 3 points for “gotten much worse.” The scores for changes in bodily functions depend on the individual question asked. For example, “I get full a lot more quickly than I used to when eating a meal” is scored 2 points and “I get full a lot less quickly than I used to” is scored 0 points, while the answer “I sweat much more than I used to” is given 1 point and “I sweat much less than I used to” is scored 2 points. The overall scoring proceeds as follows:
•

Alnylam Pharmaceuticals, Inc. Statistical Analysis Plan, Protocol ALN-TTR02-004
Final Version 2.1
CONFIDENTIAL 54

Alnylam Pharmaceuticals, Inc. Statistical Analysis Plan, Protocol ALN-TTR02-004
Final Version 2.1
CONFIDENTIAL 55

Alnylam Pharmaceuticals, Inc. Statistical Analysis Plan, Protocol ALN-TTR02-004
Final Version 2.1
CONFIDENTIAL 56

Alnylam Pharmaceuticals, Inc. Statistical Analysis Plan, Protocol ALN-TTR02-004
Final Version 2.1
CONFIDENTIAL 57

Alnylam Pharmaceuticals, Inc. Statistical Analysis Plan, Protocol ALN-TTR02-004
Final Version 2.1
CONFIDENTIAL 58
The SAP version 2.0 includes more details previously not discussed in the original SAP version 1.0. The following major changes will be implemented in the SAP version 2.0 that are different from the planned analysis specified in the SAP version 1.0 and/or the protocol version 6.0. This SAP Version 2.1 incorporates an additional change to censor data post alternative treatment for the analysis of NIS-W, which is documented in Section 5.6.
In the study protocol and the original SAP V1.0, the primary analysis method specified for the primary and secondary efficacy endpoints was the MI/ANCOVA. The original SAP V1.0 was submitted for FDA review (IND Serial # 0019). Following FDA’s comment received on 02July2015 and the sponsor’s responses on 31August2015, the primary analysis method for all efficacy endpoints will be changed to MMRM method. The history and rationales for the change of primary analysis method are described below. The change is aligned with the CHMP guideline on missing data in confirmatory clinical trials (EMA/CPMP/EWP/1776/99 Rev.1). Mixed-effects model repeated measures and MI are 2 common methods for handling missing data in analysis of continuous, longitudinal endpoints. For this study, ANCOVA/MI was originally selected as the primary analysis, with MMRM as a key sensitivity analysis. In the literature, MMRM and MI have been compared in several simulation studies. Collins et al. (2001) noted that the 2 methods yielded similar inference. However, Barnes et al. (2008) found a larger average standard error for MI relative to MMRM, suggesting that MI controls type I error conservatively and loses power to detect true treatment differences. Siddiqui (2011) compared MI/ ANCOVA and MMRM approaches using both simulated datasets and 25 New Drug Application (NDA) datasets of neuropsychiatric drug products, and concluded that MMRM appears to be a better choice in maintaining statistical properties relative to the MI approach when dealing with ignorable missing data. For the ALN-TTR02-004 trial setting, we compared the properties of these 2 methods via simulation. Our results demonstrated that, while both methods control type I error, MMRM appears to be more powerful in detecting true treatment effect compared with ANCOVA/MI. Moreover, White et al. (2012) argued that excessive focus on including all randomized patients with missing outcomes can lead to a choice of analysis that rests on implausible or unnecessarily complex imputation. The authors proposed that the main focus in choosing the primary analysis should be the plausibility of its assumptions, while inclusion of all randomized individuals is a requirement only for sensitivity analyses. The MI approach, which includes all randomized patients, is often designated as a sensitivity analysis. Given these findings – and consideration of the complexity inherent when using the multistep MI approach, the primary analysis method will be changed to MMRM for the primary and secondary efficacy endpoints. MI/ANCOVA will be performed as the key sensitivity analysis for the primary endpoint and for the first secondary endpoint (Norfolk QOL).
The MI/ANCOVA method, as described in this document and in SAP V1.0, differs from that described in the current clinical protocol (Version 6: September 2015) in the MI method and in the explanatory covariates included in the (complete data) ANCOVA (discussed in Section 5.4).

The MI (for completely missing mNIS+7 assessments) described in the SAP differs from that in the clinical protocol in that 1) stepwise variable selection has been replaced with a pre-specified set of covariates to be included; 2) imputation is done separately by treatment arm. The rationale for these changes is outlined below.
Stepwise variable selection was removed in order to simplify the analysis. The SAP specifies that imputation is done separately by study arm; the current protocol specifies says that treatment assignment will not be included in the imputation. This change is motivated by simulations demonstrating a non-negligible loss in power when a single imputation model is employed and treatment is not included in the model; this loss in power is due to “cross-contamination” of imputation models between randomized arms [9].
In the protocol, the number of imputed datasets was specified as 100. In SAP V1.0, the number of imputed datasets was reduced to 10 following the conclusion that 3-5 imputations are often sufficient [10], however, in this SAP V2.0, the number of imputed datasets is increased to 100 to have more precise estimates.
In the protocol and SAP version 1.0, it was specified that secondary endpoints would be tested in the following order for the control of overall type I error: Norfolk QOL, NIS-W score, mBMI, 10-meter walk test, and COMPASS-31. In this SAP amendment, R-ODS has been added as a secondary endpoint for controlled hypothesis testing, and 10-meter walk test has been moved up in the hierarchy. The revised list and order of secondary endpoints is the following: Norfolk QOL, NIS-W, R-ODS, 10-meter walk test, mBMI and COMPASS-31. These changes were based on the Sponsor’s re-assessment of the clinical importance of these endpoints in hATTR amyloidosis patients.
The table below summarizes the history of changes in baseline covariates used in the statistical models.

Baseline mNIS+7 X X X Genotype (V30M vs. Non-V30M) X X Genotype class (early onset V30M vs. Other) X
Age at hATTR symptom onset (< 50 vs. ≥ 50) X
Previous tetramer stabilizer use (Yes vs. No) X X X
Region (Western EU, North America, Rest of World) X
Age at study entry as continuous variable X
Genotype class (early onset V30M vs. other) is one of the stratification factors at randomization. The early onset V30M subgroup includes patients who have the V30M genotype and were younger than 50 years old at hATTR amyloidosis symptom onset. At the time of this SAP amendment, the enrollment was complete and there were only 23 early onset V30M patients. Given the small sample size, the composite covariate “genotype class” is decomposed into 2 separate covariates “genotype” and “age at hATTR amyloidosis symptom onset.” Region is added as a covariate because different rates of attrition and disease worsening were observed for different regions during blinded data monitoring. In addition, adding region may potentially address the influence of different non-V30M types observed across regions.
In SAP V1.0, binary analysis of mNIS+7 included an analysis of patients with < 2-point increase in mNIS+7 change from baseline at Month 18. The 2-point threshold was originally used in the tafamidis Phase 3 trial in hATTR amyloidosis patients with polyneuropathy to define responders for the NIS-LL co-primary endpoint. That trial enrolled patients with very early stage neuropathy and mean baseline NIS-LL of approximately 8-11 points, in whom a 2-point worsening of NIS-LL was considered to be clinically meaningful. However, the patients enrolled onto this study have more advanced disease, with a mean baseline NIS of approximately 60 points, and the mNIS+7 primary endpoint is very different from NIS-LL, with a maximum score of 304 points compared to 88 points for NIS-LL. Therefore, a 2-point threshold was not deemed relevant for mNIS+7 change in this patient population. In this SAP V2.0, 2 thresholds, < 10-point increase and any decrease (< 0-point change from baseline) will be employed to conduct the binary analysis of mNIS+7. These thresholds of < 10-point and < 0-point were chosen based on the 18-month estimated mNIS+7 progression rate observed in a natural history study of hATTR amyloidosis patients and the observed effect of patisiran on mNIS+7 at 18 months in the Phase 2 OLE study, respectively.
In this SAP V2.0, for the primary analysis of mNIS+7 and Norfolk QoL, the data post alternative FAP treatment will be censored. This censoring rule was not previously specified in the protocol or SAP V1.0. The rationale of adding this censoring rule is to eliminate the potential confounding effect caused by alternative FAP treatment. Sensitivity analyses for mNIS+7 and Norfolk QoL will be conducted including data post alternative FAP treatment.

In SAP V2.1, an update was made to apply the censoring rule to NIS-W as well so that the results will be consistent with the component analysis of mNIS+7. For all other efficacy endpoints, the data will not be censored since no sensitivity analyses are planned.
Additional changes are listed in the table below.
In the protocol and original SAP V1.0, the first day of drug administration was designated as Day 0. In this SAP amendment and the TLF outputs, the first dose day will be defined as Day 1.
The change is made to follow CDISC convention. Each calculated study day after dosing is 1 day plus the reported study day following the protocol defined Schedule of Assessments.
In the protocol and original SAP V1.0, it was intended that an interim analysis for sample size re-estimation would be conducted; however, no interim analysis was conducted during the study.
In 2013, Berk et al. published results of a randomized placebo-controlled trial of diflunisal in FAP. This trial demonstrated that efficacy using a composite neurologic impairment score primary endpoint (NIS+7) could be established in a similar population with a similar study design and smaller study size (N=130). The sponsor believed that an interim analysis for sample size reassessment was therefore no longer necessary.
In SAP V2.0, dermal amyloid content is added as an exploratory endpoint.
In addition to IENFD and SGNFD, skin punch biopsies will also be assessed for dermal amyloid content, which has been added as an efficacy parameter in this SAP V2.0.
In SAP V2.0, the walk speed for patients unable to perform the walk will be imputed as 0.
The imputation algorithm is added to address the informative missing data for patients unable to perform the walk due to worsening of disease.
Renal clearance for siRNA and 4-dimethylaminobutyric acid (DMBA) will not be analyzed.
As per protocol, renal clearance for siRNA and 4-dimethylaminobutyric acid (DMBA) were to be determined whenever possible. Only sparse pre-dose urine collections (and volumes) were obtained in patients enrolled in this study on select days that patients returned to the clinic for dosing (Days 0, 21, 126, 252, 399, 546 and at time of early withdrawal). In order to estimate renal clearance, detailed serial urine and corresponding plasma collections that describe a time course of exposures in both matrices over a dosing interval within individual subjects are required. As it is not possible to reliably estimate the renal clearance for either siRNA or DMBA in individual patients using standard pharmacokinetic methods based on the limited urine and plasma sampling implemented in this outpatient study, renal clearance estimation for either analyte were not performed and cannot be reported for this study.
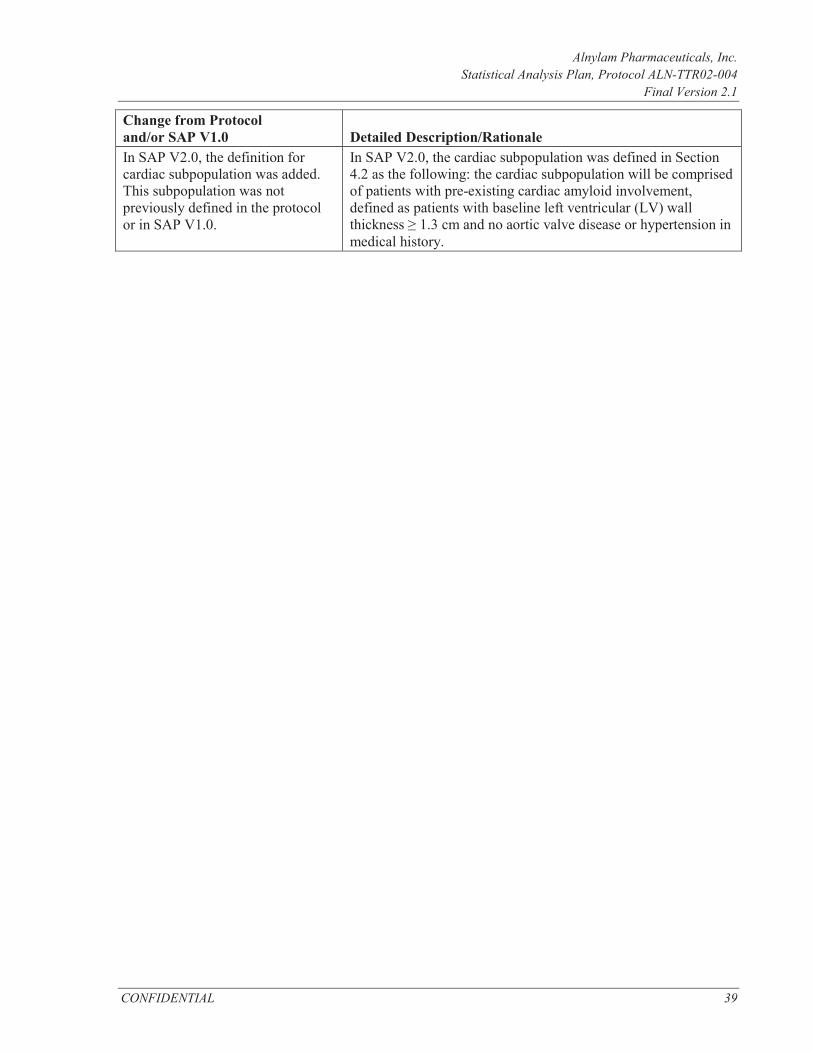
In SAP V2.0, the definition for cardiac subpopulation was added. This subpopulation was not previously defined in the protocol or in SAP V1.0.
In SAP V2.0, the cardiac subpopulation was defined in Section 4.2 as the following: the cardiac subpopulation will be comprised of patients with pre-existing cardiac amyloid involvement, defined as patients with baseline left ventricular (LV) wall thickness ≥ 1.3 cm and no aortic valve disease or hypertension in medical history.