official use - agricultural research service among tillage treatments. the standard error is...
TRANSCRIPT
Reprinted from SOIL SCIENCE SOCIETY OF AMERICA PROCEEDINGS Vol. 27, No. 6, November-December 1983, pages 697-700
677 South Segoe Road, Madison 11, Wisconsin hrchaSed by the united st&= -
Department of Agriculture for Official Use
A Field Measurement of Total Porosity and Surface Microrelief of Soils1 R. E. BURWELL, R. R. ALLMARAS AND M. AMEMIYA~~
ABSTRACT
Total porosity of the layer to be plowed was estimated from undisturbed cores collected before primary tillage. Using a point quadrant instrument, soil surface elevation measurements were made before and after preplant tillage, and after each cultivation to determine the effects of till- age on total porosity of the plowed layer. Large apparent differences in capacity to detain water, as inferred from total porosity, were observed among preplant tillages and among particular combinations of preplant and postplant tillage that are used in the western Corn Belt.
When total porosity of the plowed layer was measured in the ensuing fall and spring, relatively small changes in total porosity were observed. This result suggests that this physical property persists over a long time in a Barnes loam.
To evaluate the effects of tillage on surface geometry and temporary water storage in surface depressions, macro and random surface roughness as measured by the point quadrant instrument are considered. Estimates of the standard error among logarithm of the elevation heights differed among tillage treatments. The standard error is suggested as an index of random roughness.
v ARIOUS TILLAGE PRACTICES used in the Corn Belt can create different soil hysical conditions in the tilled
layer. These soil physicJ conditions may be important both for plant growth and for proper soil and water man- agement.
'Contribution from the Soil and Water Conservation Research Division, ARS, USDA, in cooperation with the Iowa Agr. and Home Econ. Exp. Sta. and the Minnesota Agr. Exp. Sta. Journal Paper No. J. 4485 of the Iowa Agr. and Home Econ. Exp. Sta., Ames. Project No. 1486. Presented before Div. VI, Soil Science Society of America, Ithaca, N. Y., August 1962. Re- ceived Jan. 23, 1963. Approved Apr. 24, 1963.
'Soil Scientists, Soil and Water Conservation Research Division, ARS, USDA, headquartered at Morris, Minn., and Ames, Iowa.
'The authors express their appreciation to Leon Sloneker, Agricultural Research Technician, for assistance with field lot experiments, and Elton A. Hallauer, Digital Computer Fro- grammer, for computational assistance.
Total porosity and surface microrelief may vary markedly among soils and among tillage systems within a given soil. As considered by Larson (4), a method is needed to provide simple measurements of soiI porosity and surface microrelief throughout the cropping season. Such measure- ments are needed to evaluate tillage practices as they relate to principles of soil and water management of the inter-row area of row crops.
Within a growing season, air porosity and surface micro- relief are subject to change by rainfall action, plant canopy, tillage, soil moisture changes and erhaps other factors. This aper describes a field metho$ for measur- ing changes t \ a t occur in total porosi and in surface microrelief characteristics of lowed so%. Representative data obtained with the metfod are presented and dis- cussed relative to the evaluation of the several tillage methods studied.
REVIEW OF LITERATURE The total porosity of portions of the tilled layer of soil has
been measured by air pycnometry (3, 6, 8) . Kummer and Parks ( 3 ) and Pa e ( 6 ) measured noncapillary pore volume on undisturbed so8 cores in the laboratory. They found that the greatest increase in noncapillary pore volumes resulted from tillage operations such as moldboard and disc plows, and that an ensuing radual decrease of noncapillary pore volume occurred during tfe growing season (3). Total omsity changes were noted due to management in long-term &ld e eriments ( 6 ) . Such pore volume estimations have been madeTy deter- mnin the dry bulk density of undisturbed cores from portions of t d d layers. The chief limitation of these methods for estimating total porosity is that undisturbed cores are required for each measurement. Frequently, these cores are obtained under conditions of hi h soil moisture content and low bulk densi conditions not ileal for accurate sampling. Furthermore, the aztrary depth selected for each time of measurement often may not include the total layer of tilled soil.
A description of the distribution of heights of constant length pins impinging on the soil surface has been used to measure soil com action ( 7 ) , lateral soil movement during tillage operations ?5), and surface roughness of seedbeds (2). Kuipers (2) formulated a roughness index as 100 times the logarithm of the standard deviation of arithmetic heights. Thus far, most of the applications of this measurement principle have not been carefully evaluated, nor has the distribution of meas- ured heights been carefully considered.
METHODS AND MATERIALS Most of this study was conducted durin the 1961 growing
season at Morris, Minnesota, on a Barnes &am, having a 0 to
JAN 3 0 196(

measured to the nearest 0.1 inch on a % by lcinch grid for a 40- by 4O-inch area ( % w e I). The measusemeats were taken between 2 center corn rows of tke && eyer .w&d there was no wheel trasc for the pos lnnt &G operations. Two steel rods, .l8 inches long, plackPto a of 12 h h e s in each of the 2 corn rows, served as sup ort pins for the micro- relief meter. Reference points were esta%lished in border areas, .and. ordinary surveying procedures .were wployed for the pro er alignment and elevation settiug of the support pins.
&e &croreliel Geter was placed on die support pins, with the scale board in the startin position, and the measwin pins were gdtl lowered mtil alfpins wese re~fhg on the so% sur- face. The leis& measurements were read from the scale board at the top of the measuring ins. The measuring pins were then raised to clear the soil s d c e , tbe measuring pins and scale board advanced 2 inches, lowered, and again height meas- urements were made. This procedure was re ted until 400 point stations were measured and r eco rde r~he readings were systematically recorded for orientation of readings with respect to direction of tihge.
Microrelief measurements were made before tillage. The sup- port pins were removed from the lots fos tillage and plasting operations and then were restore8 to their previous positions and remained thfoughout the season without elevation realign- ment to the elevation of the reference point. Measurements were made after preplant tillage, after each cultivation, and at other times.
The total porosity of the plow layer for an arbitrary date was obtained by summing the! eqaivalent inches of porosity in the initiaI 0- to Bmch layer prior to tillage and the change in average surface elevation obWed as the difference between the average surface eIevation prior to a g e and that at the
Figme 1-Microrelief meter used in the : I to determine total porosity and microrelief charactemties of plowed soils.
arbitrary date. Thus, total PO-ty for a i&ven,,date u the "inches of porosity per initial 0- to &inch yer.
T U L T S AND DISCUSSION The average&oal porosity of the 0- to 6-inch soil layer
before tillage as computed from M undisturbed core samples was 3.20 inches, with a standard error of 0.01 inch. The coeffihnt of variability for determination of the porosity in a sjngle Eat was 1.4%. These data indicate that the soil condition %fore tillage was sdciently mi- form far accurate measurement of the initial porosity, which is the absolute base for the estimates of total porosity.
Comparisons amon treatments at an arbitrary date reveal measurable real differences in total porosity due to tillage (table 1). The Herence of 0.7 inch between the total porosity due to wheel-track and to conventional preplant tillage can be attributed to the
effects of diseing and harrowing. Effects of postplant *nm'ida?f c tivation on total pordity were relatively minor except when 3 dtivatians in the wheel-track planting sage reduced the total porosity by 0.8 inch.
If the total porosity af the plowed soil layer can be considered as an indeg of the amount of water that can be temporarily stored in that layer of soil, the differences in total porosity observed above have a real significance with respect to water management of the area between crop rows. In the Com Belt and the Northern Plains States the greatest e~osive rainfall predicted for a given occurs during the first 2 rnonhs following seeg!; preparation for corn and soybeans (11). At the end of the cultivation season 6 weeks following seedbed preparation) there were 1.4 in A es (table 1) more total porosity in the wheel-track system without cultivation than in the con- ventional system with 3 cultivations. Hence, this porosity difference could influence the potential erosion during the early art of the growing season.
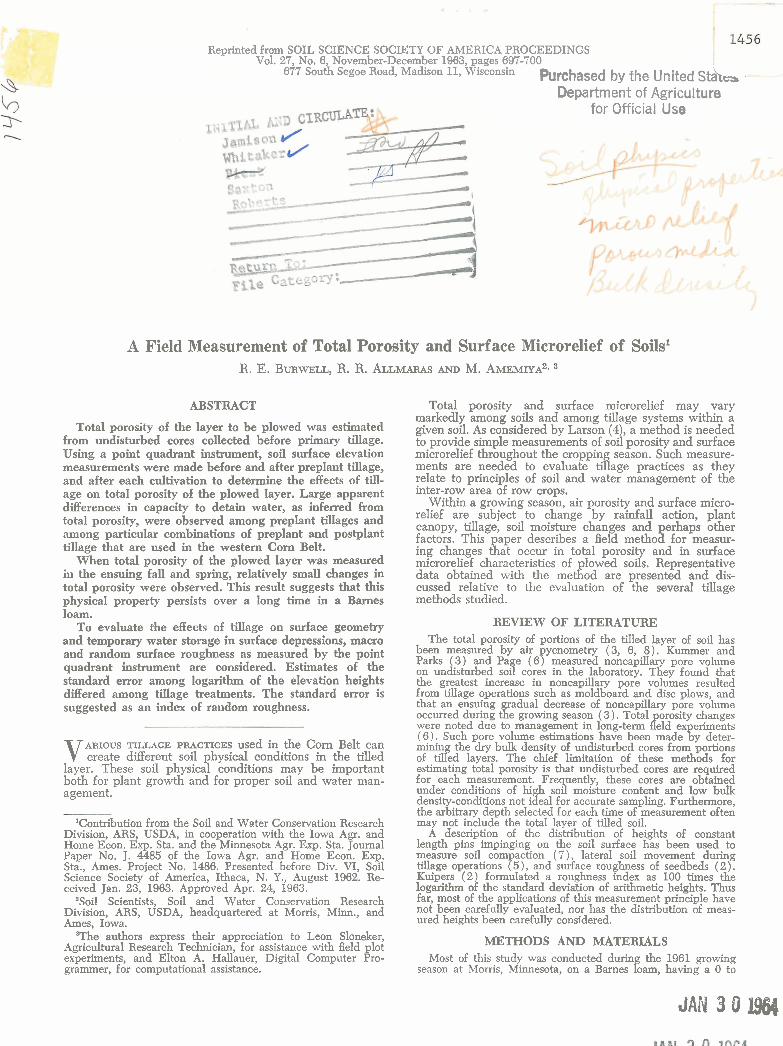
In $e wheel-track and mnventional tillage systems with no cultivation, the total porosity at the end of the 1961 growing season and at the beginning of the 1962 rowin season was at least 0.7 inch greater than that o%servee[ at the beginnin of the 1961 season (figure 2). During the same perid, the unplowed treatment remained at nearly the same total porosity observed at the beginnin of the 1961 growing season. Hence, the differences in to t3 porosity noted in 1962 (fi e 2) are deemed to be real effects. These effects are o&ecial interest with respect to raihfall because 11.4 inches of rain occurred from April 9 to June 1&1962. Several factors inherent in the measure- ment process could have caused inaccuracy of these measurements, es ecially if they did not &ect all treat- ments alike. swe%ing and shrinkage of the 1% to 7% inch soil layer (delineated by the base of the support pins and the reference pin, respectively) caused elevation changes that were within the random error of the survey-
Table 1-Effect of preplant and postplant tillage on total . porosity per initial 0- to &inch layer of a Barnes loam."
Tllhge treatment Before After After After After Prepht PwwIpnt U I W Praplnat Ilmt s e m d thM
culti- culu- cultI- 6% vatlon vation vation
6/22/61 7/5/61 711 7/61
Total porosity, inebeat CanvenUmal Cultivated j4. 98 ::;; 3.62 ab 3.66 ab
Ncnoultivaled a 9 4 b c 4 . M b
Whe6l-traCk C&%gted 3. U)t ) 6.06 5.13 C 4.56 cd 4.26 b 5.03 C 4.39 d 5.03 c
&plowed cuitivatad ) 3.20 a 3.66 a 3.63 Pb 3.23 a Nmdltw(ed 3 . 1 7 s 3 . a a a 3 0 a
* Preplnnl r m e indicates d rnsdbsd preparatlm, and postplvrt tlllage indica- ten cultivatia~ normally prformed for praed control.
T PoroaiQ averaged Rom 9( Uhlaad oors namplw, aad the atanctard error of thla average in 0 .5U fnches. : P m i t y anputd as indicated b e . Wtthin a column values not followadby the
aeme MtteI pre afgrdffo.llntly (p = 0.06) different a s wahraSad by Um Duncan Multiple Range Teat.'
BURWELL ET AL: FIELD MEASUREMENT OF TOTAL POROSITY AND SURFACE MICRORELIEF OF SOILS
Figure &Effect of preplant tillage on total porosity per initial 0- to %-inch layer of a Barnes loam (plowing performed June 2, 1961).
ing procedures. Therefore, height readings were not corrected for changes in elevation of the sup respect to the reference pin. If swelling an Ft shrinkage pP'"S with of the 6- to 12-inch soil layer (delineated by the plowin depth and the base of the support pins, respectivel$ occurred, it is confounded with total porosity estimates for the initial 0- to 8inch layer. Frost action could also have raised the support pins relative to the soil surface as illustrated by Decker and Ronningen (1). Thus, the total porosity estimates for 1962 in figure 2 could be negatively biased. These factors are being evaluated relative to
orosity estimates for as long a period as illustrated in [*re 2.
In addition to temporary storage of water in the total void space of tilled soil layers, temporary storage of water may be provided in soil surface depressions created by tillage operations. The ma itude of such surface storage depends on the type of sur Y' ace roughness or confi Macro surface depressional-volumes created by til Ytion. age tool marks may be great. Examples of this type of surface roughness would be furrows formed between plow slices, and furrows made by cultivator shovels, and by listing and rid 'ng implements. These surface configurations are espe- cia W' y relevant to water management.
Temporary storage capacities of these depressions are influenced by their orientation with respect to slope direc- tion. Depressional volumes that occur at random on the soil surface may also be considered as having temporary water storage capacities. This random roughness is likely to be more relevant to water management problems in the conventional and reduced tillage systems than in tillage systems such as contour listin and contour ridge tillage.
Estimation of random rouaness requires some knowl- edge of the distribution of hei t measurements made by the microrelief meter. Althoug ti" no exact test for distribu- tion of height measurements can be made, three points of evidence are presented to demonstrate that the logarithm of the heights is normally distributed. The 400 height measurements for each setting of the microrelief meter
extending in 2 directions on the soil tool impressions were resent they
to one direction of %e grid ex- greater variation among mar inal
height averages each obtained by summing paralle 7 to the direction of tillage than among the marginal height averages each obtained by summing perpendicular to the direction of tilla e. This observation was made for all til- lage systems, inc f uding the conventional, wheel-track, list- ing and ridging systems. Plots of the marginal averages, obtained by summin in the direction of tillage, versus the dispersion among%eights associated with the marginal average revealed a linear relation between mean and
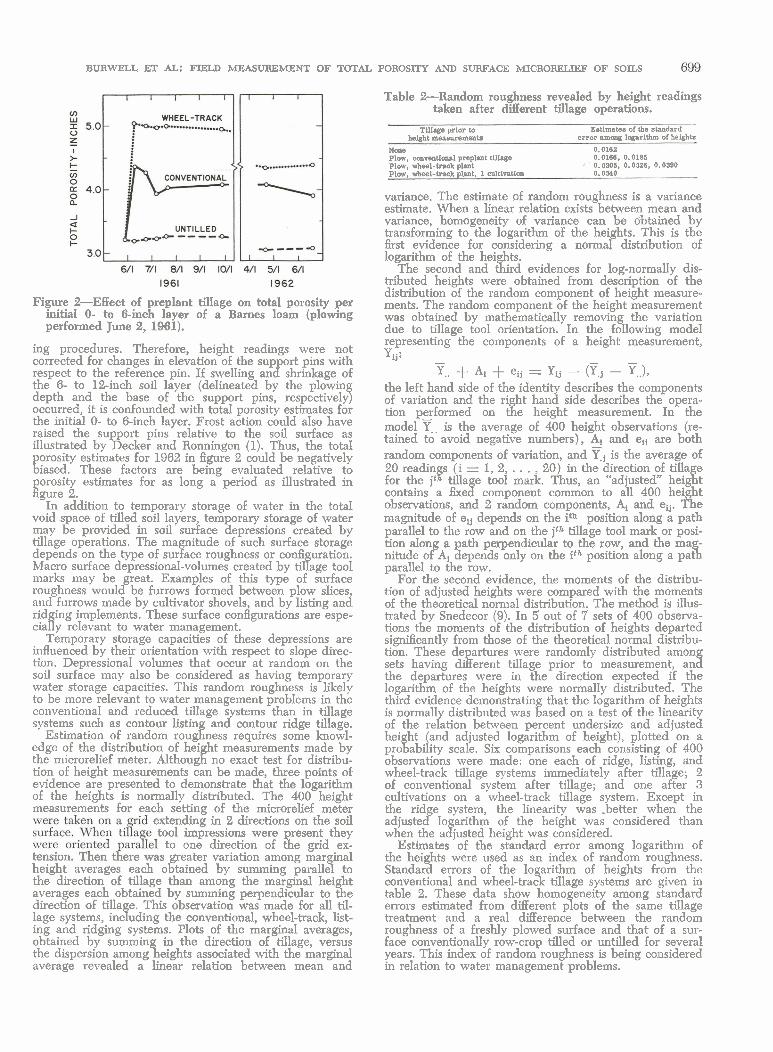
Table %Random roughness revealed by height readings taken after different tillage operations.
Tillage prlor to Estimates of tbe standard height meaauremsnta error among logarithm 01 helghts
Nale 0.0162 plow, wmvenUorul preplant Ullage 0.0166. 0.0185 Plow, wheel-tnak plant : ' O.oS08, 0.0326. 0.0390 Plow, wheel-hrck plant. 1 culUvaUon 0.0340
variance. The estimate of random roughness is a variance estimate. When a linear relation exists between mean and variance, homogeneity of variance can be dbtained by transforming to the logarithm of the hei hts. This is the first evidence for considering a norm distribution of logarithm of the hei hts.
2 The second and %ird evidences for log-normally dis-
tributed heights were obtained from description of the distribution of the random component of height measure- ments. The random component of the height measurement was obtained by mathematically removing the variation due to tillage too1 orientation. In the following model representing the components of a height measurement, Ytj: -
Y.. + Ai + ejj = Yij - (rj - r.1, the left hand side of the identity describes the components of variation and the ri t hand side describes the opera- tion performed on if!' e height measurement. In the model Y, is the average of 400 height observations (re- tained to avoid negative numbers), A, and ef+ are both - random components of variation, and rj is the average of 20 readings ( i = 1, 2, . . . , 20) in the direction of tilla e a for the jth tilla e tool mark. Thus, an "adjusted" heig t contains a fixei component common to all 400 height observations, and 2 random components, 4 and eii. The magnitude of eij depends on the ith position along a path parallel to the row and on the jth tillage tool mark or posi- tion along a ath perpendicular to the row, and the ma
parallel to the row. Si; nitude of A, sepends only on the ith position along a pat
For the second evidence, the moments of the distribu- tion of adjusted heights were compared with the moments of the theoretical normal distribution. The method is illus- trated by Snedecor (9). In 5 out of 7 sets of 400 observa- tions the moments of the distribution of heights departed significantly from those of the theoretical normal distribu- tion. These de artures were randomly distributed amon sets having d' & erent tillage prior to measurement, an d the departures were in the direction expected if the logarithm of the heights were normally distributed. The third evidence demonstrating that the logarithm of heights is normally distributed was based on a test of the linearity of the relation between percent undersize and adjusted hei ht (and adjusted logarithm of height), plotted on a % pro ability scale. Six comparisons each consisting of 400 observations were made: one each of ridge, listing, and wheel-track tillage systems immediately after tillage; 2 of conventional system after tillage; and one after 3 cultivations on a wheel-track tillage system. Except in the rid e system, the linearity was .better when the adjustef lo arithm of the height was considered than when the a$usted height was considered.
Estimates of the standard error amon logarithm of the heights were used as an index of ran d om roughness. Standard errors of the lo arithm of heights from the conventional and wheel-tras tillage systems are given in table 2. These data show homo eneity among standard errors estimated from different p f ots of the same tillage treatment and a real difference between the random roughness of a freshly plowed surface and that of a sur- face conventionally row-crop tilled or untilled for several years. This index of random roughness is being considered in relation to water management problems.

SOIL SCIENCE SOCIETY
LITERATURE CITED Decker, A. M. Jr., and Ronningen, T. S. Heaving in forage stands and in bare ground. Agron. J. 49:412-415. 1957. Kui ers, H. A relief meter for soil cultivation studies. ~ege r l ands J. Agr. Sci. 5:255-262. 1957. Kurnmer, F. A. and Parks, R. Q. A report of the progress on soil porosi measurements at the Tennessee Valley Substation, Alzama. Soil Sci. SOC. Am. Proc. 11:74-75. 1946. Larson, W. E. Tillage requirements for corn. J. Soil Water Conserv. 17:3-7. 1962. Mech, S. and Free, G. R. Movement of soil during tillage operations. Agr. Eng. 23:379-382. 1942.
6. Page, J. B. Advantages of the pressure pycnometer for measuring the pore space in soils. Soil Sci. Soc. Am. Proc. ( 1947) 12:Bl-84. 1948.
7. Ram, Dip N. and Zwennan, P. J. A convenient soil com- paction integrator. Agron. . 52:484. 1960.
8. Russell, M. B. A simplifie d air-pycnometer for field use. Soil Sci. SOC. Am. Proc. (1949) 14:73-76. 1950.
9. Snedecor, G. W. Statistical Methods. Iowa State Univer- sity Press, Ames, Iowa. Ed. 5. 1957.
10. Uhland, R. E. Physical pro erties of soils as modified by crops and management. so8 Sci. Soc. Am. Proc. 14:361- 366. 1949.
11. Wischmeier, W. H. Storms and soil conservation. J. Soil Water Conserv. 1755-59. 1962.