offshore renewable energy for · pdf fileseumas mackenzie, harry newton, edward olivier, shaun...
TRANSCRIPT

Offshore Renewable Energy for Guernsey
A Short to Medium Term Strategic Plan
Plymouth University MSc Marine Renewable Energy 2012

OFFSHORE RENEWABLE ENERGY FOR GUERNSEY
The following document has been produced by Masters students at the University of Plymouth, working in partnership with the Renewable Energy Team, group project and so is an independent document. As such, while the study is endorsed by RET and was undertaken in conjunction with RET, there may be views expressed and conclusions drawn that are not shared by RET. There may also be some factual inaccuracies within the report, and whilst we appreciate them being brought to our attention, we are unable to alter them.

OFFSHORE RENEWABLE ENERGY FOR GUERNSEY
EXECUTIVE SUMMARY
The proposed report, produced by the MSc Marine renewable energy students from Plymouth University in association with the School of Marine Science and Engineering at Plymouth University, the States of Guernsey‟s government department of Commerce and Employment, and the Guernsey Renewable Energy Team (RET); presents plans for the deployment of renewable energy technology off the shores of Guernsey. The current global energy industry is severely affected by social, political, economic and environmental problems which have created concerns towards the future of secure energy supply and introduced fears towards climate change induced by by-products of the global industries. The effects of this current energy climate are ever so evident in an island such as Guernsey, where the location and the distances characterising the energy supply chain amplify the issues related to a secure and stable supply of electricity. The current state of Guernsey‟s energy supply chain includes the import of electricity from France via the Channel Islands Electrical Grid (CIEG) and on-island generation based on the use of fossil fuel based generators. Recent failures of the undersea electricity cable between Guernsey and Jersey have caused blackouts causing disruption to the local community. This problem has been alleviated by increasing the use of the local generators. This solution, despite providing immediate resolution to the problem caused an increase of the cost of electricity to the customer of approximately 9%. The reality of the insecurity of the supply chain and the increased cost to the customer induced by the said failures has reiterated the requirement for Guernsey to invest in a supply chain of electricity which is independent of imports. Mitigation actions to the islands supply problems have already been introduced in the form of a new diesel generator for additional local energy generation capacity and a new contract with EDF energy to provide a further 10 years‟ worth of electricity supply to the island. These plans provide an immediate solution, but do not overcome the overall issues related to the energy supply chain. As part of the process of investigating alternative solutions in compliance to Guernsey‟s ethos and following the global trends towards the use of sustainable energy resources, this report assesses the viability and feasibility of deploying renewable energy devices off the shore of Guernsey. In particular it establishes a potential short-term deployment plan using four 6MW offshore wind turbines, and also considers the possibility of developing Guernsey‟s tidal resources in the medium-term. The report demonstrates how the proposed solutions would increase the security of Guernsey‟s energy supply in accordance with the Bailiwick‟s sustainability targets and also how it would reduce the Bailiwicks dependency upon fossil fuel generation contributing towards a close to zero carbon emission electricity supply chain. The research undertaken during the course of the project has proved that Guernsey has a viable wind resource that could be successfully exploited in the short-term, using one of the most mature renewable energy technologies available to date: wind turbines. Figure 1 is compiled using the data obtained from the evaluation of Guernsey‟s wind resource, which if implemented with the wind to power output specifications for a Siemens SWT-3.6-107 and SWT-6.0-154 wind turbine delivers the average monthly potential power production of the respective turbines if deployed off the shore of Guernsey. Figure 1 shows how implementation of the bigger 6MW wind turbine from Siemens produces an approximate annual average of 25GWh of energy, thus delivering a total production of 100GWh from four SWT.6.0-154 turbines. This target as shown in figure 2 demonstrates how the plan would aid a reduced dependency on local fossil fuel energy generation, contributing towards an approximate 20% of the total energy generated.

OFFSHORE RENEWABLE ENERGY FOR GUERNSEY
Figure 1: Average monthly power production (2006-2010), monthly trends of the turbines power output
Figure 2: Locally generated and imported electricity. Power capacity of 4x6MW turbines (denoted by black line) in relation to the overall electricity production from 2003 to 2011
Furthermore an assessment of the Big Russel also finds this as being a viable tidal stream resource for the potential generation of clean electricity, although the technology to utilise it is considered immature at present.
Power Output (M
Wh)

OFFSHORE RENEWABLE ENERGY FOR GUERNSEY
In the short-term, this report recommends that Guernsey utilises the “outstanding” wind resource that the Bailiwick possesses by deploying an array of four Siemens SWT-6.0-154 6MW wind turbines off the northeast coast of the island. By connecting these structures together using a ring main of 33kV cable, they could be connected relatively simply to the island using a 33kV undersea cable. This would provide Guernsey with an installed capacity of 24MW and the potential to generate up to 100GWh a year. In the medium term the report recommends the OpenHydro 2MW tidal stream turbine as the most viable and environmentally benign technology to exploit the resources of the Big Russel. In relation to the recommendations presented thus far, the report includes a detailed deployment plan for the renewable energy technology including all aspects from the planning, installation and management of the arrays along with the estimation of financial and environmental impacts of the deployment process on Guernsey. An estimate of lead time for implementation will also be provided with further recommendations on tasks to be completed prior to the installation process such as accurate bathymetry surveys, geotechnical surveys, full marine spatial planning exercises and a detailed hydrodynamic survey of the Big Russel.

OFFSHORE RENEWABLE ENERGY FOR GUERNSEY
AUTHORS
Students from Plymouth University studying MSc Marine Renewable Energy.
Joe Barnaby, Stuart Campbell, Thomas Clyde, Shane Crowley, Alexandros Drymonakos, Benjamin Fisher,Francesca Ford, Jesse Gyan, Blair Gordon, Kerry Hayes, Hamish Kerr, Seumas MacKenzie, Harry Newton, Edward Olivier, Shaun Rafferty, Adam Roberts, Giovanni Rosato, Elizabeth Rudd, Matthew Rundle, Olusesi Tajudeen, Joseph Wellard, Richard Wheal and Thomas van Lanschot

OFFSHORE RENEWABLE ENERGY FOR GUERNSEY
ACKNOWLEDGEMENTS
There are numerous people that have made this project possible in particular; Mat Desforges and Peter Barnes from the Guernsey Commerce and Employment Renewable Energy Team for supporting the project, acting as a point of contact, supplying information and setting up meetings with stakeholders whilst we were in Guernsey. The School of Marine Science and Engineering for support, both financial and academic, with special thanks to Phil Hosegood for organising the project and giving us the chance to be involved with a real life task and the continued support throughout the project, Daniel Conley and Paul Russell for their academic interest and support throughout the activity. The University of Plymouth‟s Marine Institute for their financial support. We would also like to thank to Alan Bates, Sally-Ann David and the team at Guernsey Electricity Ltd, for sparing their valuable time in showing us around their facilities, providing information on Guernsey power consumptions, answering questions and attending the presentation. To Richard Lord from Sustainable Guernsey for his enthusiasm and support. Chris Morris and the team at Guernsey Sea Fisheries Agency, for taking the group out in the patrol vessel on the Big Russel, and sparing their time in attending the presentation. Damon Hackley from Guernsey‟s strategic planning office for taking time to meet with us. St Peter Port Harbour Master for answering numerous questions concerning the implication of such a project. To all of the staff at the Les Cotils and everyone else in Guernsey who made it a comfortable and enjoyable stay.

OFFSHORE RENEWABLE ENERGY FOR GUERNSEY
CONTENTS
1 Introduction 1
1.1 Ambitions of Guernsey 2 1.2 Guernsey’s energy supply chain 3 1.3 Report Scope 7 1.4 Report Methodology 8
2 Short Term Strategic Option (Wind) 9
2.1 Off-Shore Wind Technology 10 2.2 Device selection 12 2.3 Wind Resource Assesment 16 2.4 Array 30 2.5 Site Selection 31 2.6 Visualisation 38 2.7 Installation 42 2.8 Maintenance: 60 2.9 Grid Connection 62 2.10 Environmental Impacts 64 2.11 Modelling the economics for wind energy 74 2.12 Economics of Wind Energy 80
3 Medium Term Strategic Option – Tidal energy 82
3.1 Tidal Resource Assessment 83 3.2 Tidal Technology 90 3.3 Tidal Option Installation & Maintenance 98 3.4 Associated Environmental Impacts of Tidal Devices 102 3.5 Economics of Tidal Energy 104
4 Long Term Strategic Considerations 106
5 Conclusions & Recommendations 109
6 References 110
7 Appendix 115

OFFSHORE RENEWABLE ENERGY FOR GUERNSEY
LIST OF FIGURES
Figure 1: Maximum Demand (Best Case Scenario, no Efficiency Measures) (States of
Guernsey, 2011) 3 Figure 2: Locally Generated and Imported Electricity (States of Guernsey, 2011) 4 Figure 3: Overview of the CIEG (ABB Power Technologies) 5 Figure 4 : Temporal Evolution of Wind Turbines 10 Figure 5 : Power Output for Varying Ratings and Blade Diameter 12 Figure 6: Typical Failure of a Wind Turbine (Sakar et al, 2012). 13 Figure 7 : Wind rose from Guernsey airport (windfinder.com, 2012) 16 Figure 8 : Satellite image of Guernsey identifying the location of the two anemometers, showing
the different sections and their relative exposure to prevailing winds (Lee. O, 2012). Le Chouet is shown to the northeast (top right) and the Airport is shown to the south (bottom middle) 18
Figure 9: Data showing the factor of difference between the wind speeds at the airport and Le Chouet 22
Figure 10: Power curves of the wind turbines selected 24 Figure 11: Percentage of time for which the SWT-6.0-154 would have generated the indicated
power based on historical data collected from the airport during the period 2006-2010. Wind speeds have been adjusted with the correction factor described in the text to enable the airport wind speeds to be applied to Le Chouet, for which only 9 months data was available. Key shows Power (kW). 25
Figure 12: As for Figure 11 for the SWT-3.6-107 turbine. 26 Figure 13: Annual and average power output and downtime for SWT-6.0-154 27 Figure 14: Annual and average power output and downtime for SWT-3.6-107 27 Figure 15: Annual and average comparison of capacity factors 28 Figure 16: Monthly trends of the turbines power output 29 Figure 17 -Constraints map for Guernsey, demonstrating areas of conflict within the marine
zone. Dark blue represents 50+m depth 34 Figure 18 : Schematic of the 10 x 3.6MW array (top) and 4 x 6MW array (bottom) 38 Figure 19. Wind turbine model specifications as utilised for the visualisation created using
TRANSAS 39 Figure 20 : 10 x 3.6MW Siemen s Turbines 40 Figure 21 : 4 x 6MW Siemens turbines 41 Figure 22 : Components of a monopile foundation (source Garrad Hassan) 43 Figure 23 : Components of a monopile foundation (source Garrad Hassan)Installation of a
transition piece (source Vattenfall) 43 Figure 24 : Components of a Tripod foundation (source Gerrad Hassan) 44 Figure 25 : Components of a jacket foundation (source Garrad Hassan) 44 Figure 26 :Jack-Up Barge installs Germany‟s first offshore wind turbine (source MarineLog)45 Figure 27 :The self propelled Jack-up “Seajacks Zaratan” in the Gunfleet Sands farm, 2012,
(source Seajacks) 45 Figure 28 : Installation of jacket and 5mw wind turbine generator at the Beatrice Offshore
Windfarm (source SCALDIS SMC) 46 Figure 29 : A2SEA Sea installer. (source MarineLog) 46 Figure 30 : Vessel displaying fully-assembled installation capabaility (source W3G Marine) 47 Figure 31 : Respectively a feeder, direct transit and indirect transit methods. (source
Fraunhofer, 2011) 47 Figure 32 : Offshore Wind Turbine Installation Ship (OWTIS). (source W3G Marine) 48 Figure 33 :The pre-piling phases. (source LORC) 48 Figure 34 : Different methods with the number of lift to be done offshore. (source Kaiser, &
Snyder, 2010) 49 Figure 35 : Locations of external port 51 Figure 36 : Quay Des Flamands (PNA, 2012) Figure 37 : Quay Des Mielles (PNA, 2012)
52 Figure 38 : Gantt chart for scenario 1 58 Figure 39 : Gantt chart for scenario 2 58
OFFSHORE RENEWABLE ENERGY FOR GUERNSEY
Figure 40: Simplified Grid Connection Circuit Diagram (DM Energy, 2001) 62 Figure 41 : Environmental considerations from all aspects of the report (adapted from REA
2011) 64 Figure 42: Estimated annual bird deaths from wind turbines & cars in Denmark and domestic
cats in the UK. (Source (MacKay, 2008)) 66 Figure 43: Pink sea fan (Charlotte Bolton 2012) 67 Figure 44: An example of an artificial rock dumped reef 69 Figure 45: The three proposed sites for offshore wind farm to the north east of Herm. 75 Figure 46: The inputs (blue) and constrains (white) to the economic model. 76 Figure 47: Project profile of a Germany wind farm (A-LORC, 2011) 78 Figure 48: Project profile of a United Kingdom wind farm (B-LORC, 2011) 78 Figure 49: Map of Guernsey showing the ADCP locations. Site 1 located at 49o27‟12.80,
02o24‟.51.90. Site 2, located at 49o27.00, 02o23.56.00. 83 Figure 50: The Eastward (blue) and Northward (red) components of flow velocity taken from
ADCP site 1 (section A) and site 2 (section B). 85 Figure 51: Tidal ellipses plotted from the predicted tidal harmonic analysis for the two major
components, M2 and S2, from both ADCP site. Ellipse a shows data from site 1 and b from site 2. 87
Figure 52: Major tidal axis velocities from site 1(a) and 2(b), with both the long (red) and cross (blue) axis velocity components plotted. 88
Figure 53: Graph showing average maximum flow velocities from both ADCP sites on flood and ebb tides. 88
Figure 54: Velocity distribution curve of along channel and cross channel velocity components. 89
Figure 55 : Artists Impression of Andritz Hammerfest Hydro Device (Source - Andritz Hammerfest) 93
Figure 56 : Atlantis Device (Source - Atlantis) 94 Figure 57 : Image of the Proposed Delta Stream Device (Source - Delta Stream) 94 Figure 58 : MCT Demonstation Device (Source - MCT) 95 Figure 59 : OpenHydro Prototype Device (source OpenHydro) 96 Figure 60 : Deployment of Tidal Generation Device (source - Tidal Generation Limited) 96 Figure 61 : Open Hydro Manufacture Facility 98 Figure 62: Image of the foundation structure for the OpenHydro device 100 Figure 63: Capital expenditure for tidal stream technologies (Ernst & Young and Black &
Veatch, 2010) 104 Figure 64: Operational expenditure for tidal stream technologies (Ernst & Young and Black &
Veatch, 2010) 105 Figure 65 Flow Though a Disk 119 Figure 66 : Pile Mounted Horizontal Axial Turbine (Source, EMEC 2013) 120 Figure 67 : Vertical Axis Turbine (Source, EMEC 2013) 120 Figure 68 : Oscillating Hydrafoil (Source, EMEC 2013) 121 Figure 69 : Archimedes Screw (Source, EMEC 2013) 121 Figure 70 : Enclosed Tip/Venturi (Source, EMEC 2013) 122 Figure 71 : Tidal Kite (Source, EMEC 2013) 122

OFFSHORE RENEWABLE ENERGY FOR GUERNSEY
LIST OF TABLES
Table 1: Currently Installed Local Generators (Guernsey Electricity, 2005) 4 Table 2 :Summary of Option Matrix (See Appendix xx for full option matrix) 14 Table 3 : Classes of wind power density (D Elliot, 2006) 17 Table 4 : Measurement of wind resource assessment parameters (AWS Scientific, Inc. 1997)19 Table 5: Optional parameters to monitor for wind resource assessment (AWS Scientific, Inc.
1997). 20 Table 6: Statistics from average wind speed at Chouet 24 Table 7: Percentage of time spent at specific power for SWT-6.0-154 25 Table 8: Percentage of time producing what power SWT-3.6-107 26 Table 9: Summary of wind data analysed 29 Table 10 : Evaluation matrix of offshore wind ports 51 Table 11: Foundation Details 53 Table 12: Hydraulic Hammer Charecteristics 53 Table 13: Service Vessel Charecteristics 53 Table 14: Foundation Operational Data 53 Table 15: Calculated Data (Pre-piling Phase) 54 Table 16: Turbine Charecteristics 54 Table 17: Installation Vessel Charecteristics 54 Table 18: Operational Input Data 54 Table 19: Calculated Data (Scenario 1) 55 Table 20: Installation Vessel Charecteristics 55 Table 21: Operational Input Data 56 Table 22: Calculated Data (Scenario 2) 56 Table 23: Cable Characteristics 56 Table 24: Operational Input Data 57 Table 25: Calculated Data (Cable-laying) 57 Table 26: Turbine and Array Output Capacities (Siemens) 62 Table 27: Illustration of Approximate Cable Costs 63 Table 28: Key cetacean species reported in Guernsey's waters (REA, 2011) 65 Table 29: Seal sightings in Guernsey (REA, 2011) 65 Table 30: Fisheries of economic importance in Guernsey (REA,2011) 67 Table 31: Investment risk matrix in context of project development stage 74 Table 32: Increase in capital cost due to location proposed sites for proposed wind Farm
(Agency, 2009). 75 Table 33: estimated capital cost for site 3 shown on figure 4.1 77 Table 34: capital cost share structure and ownership structure for proposed wind farm 79 Table 35: Tidal harmonic analysis data for Site 1 showing the major tidal driving components.
M2 is the principal lunar semidiurnal component, S2 the principle solar semi diurnal component, N2 the larger lunar elliptic semidiurnal and M4 the shallow water overtides of principal lunar. 86
Table 36: Tidal harmonic analysis data for Site 2 showing the major tidal driving components. M2 is the principal lundar semidiurnal component, S2 the principle solar semi diusrnal component, N2 the larger lunar elliptic semidiurnal and M4 the shallow water overtides of principal lunar. 86
Table 37: The average power density (kw/m2) at the depth deployment depth and the power density over the device cross-section (kw), for both ADCP sites. 89
Table 38 : Concept Option Matrix Summary 92 Table 39: Tidal Device Option Matrix Summary 97 Table 40 : Decision matrix for Tidal option ports 99

OFFSHORE RENEWABLE ENERGY FOR GUERNSEY
1
1 INTRODUCTION Since the advent of the industrial revolution, human kind has learnt to exploit nature‟s resources to generate electricity to power its industries. In the recent decades, the ever increasing population and the ever growing global technological development have contributed towards a constant increase in energy demand; producing severe effects on the environment and on the resources available. From a time when resource depletion was no concern, we are now facing an era where the demand for energy is consuming the natural reserves available and contaminating the environment with the by-products of the global industries. Climate change induced by the production of green-house gases has in fact been deemed responsible for the increased environmental disasters experienced around the globe in the recent decades (NASA, 2012). Rising temperatures, the related glacial melting and altered salinity densities from increased amounts of freshwater entering North Atlantic may disrupt important ocean circulation systems. Furthermore the depletion of fossil fuel and consquent supply constraints causes a drastic fluctuation of the price of oil and has resulted in political problems across the globe (ISN ETH Zurich, 2012). To continue to promote the lifestyle we currently enjoy and to further promote the continual improvement of human society it is paramount to investigate and implement alternative energy solutions, aimed to ensure the sustainability of our use of resources and increase the stability of the energy supply chain.

OFFSHORE RENEWABLE ENERGY FOR GUERNSEY
2
1.1 Ambitions of Guernsey
In the recent decades, actions to tackle climate change concerns have been visible across the globe in the form of project proposals to determine alternative energy sources. Increasingly governments are pursuing the exploitation of renewable resources. Guernsey has established targets and plans to progress to a future of reduced carbon emissions in an energy resource plan (States of Guernsey, 2011). To ensure the investigation of the potential deployment of renewable energy technology off the shore of Guernsey complies with Guernsey will, it is important to understand these targets and assess their suitability in relation to the proposed scope of this project. The main targets and actions of the Guernsey Energy Resource Plan that are specific to renewable energy have been listed below:
“The States of Guernsey remain committed to reducing carbon dioxide emissions by 30% on 1990 levels by 2020 and then by 80% by 2050”.
“The States of Guernsey are committed to 20% of its electricity supplies to be met by renewable sources by 2020”.
“The introduction of any bias in favour of “more expensive” imported low carbon energy (or indeed renewable energy) should not be considered in isolation, but as part of this comprehensive Energy Resource Plan”.
“A target of 10% renewable resources provided that the cost does not imply an increase of more than 15% of the cost of electricity”.
These statements demonstrate Guernsey‟s commitment to reducing carbon dioxide emissions with the help of renewable sources of electricity, as part of a broad energy plan which will the cost of electricity by no more than 15%. “The States therefore believe that the development of local renewable electricity generation, in whatever form, should be determined by the maturity and cost of available technology, with the full scale exploitation of our local resources delayed until demonstrably viable technology is available at an affordable cost.” (States of Guernsey, 2011). Although Guernsey is committed to introducing renewable sources of energy to help reduce carbon dioxide emissions, any form of technology that is not financially viable will be rejected until the technology becomes affordable. This report therefore focuses on this statement with the aim to demonstrate that some renewable energy technologies have become a realistic and financially viable option for energy supply. In order to do this, the report establishes a potential short-term renewable energy deployment of 5-10 years based on wind power, and investigates the potential of a medium-term plan of <15 years based on tidal power. These plans will increase the security of Guernsey‟s energy supply in compliance with the targets of sustainability.

OFFSHORE RENEWABLE ENERGY FOR GUERNSEY
3
1.2 Guernsey’s energy supply chain
This section of the report describes Guernsey‟s current electricity demands and supply methods, including a breakdown of the Bailiwick‟s current energy mix. This allows for the assessment of issues facing the current supply chain of electricity, including total dependence upon imports. These issues highlight the need for Guernsey to develop an independent, self-sufficient solution by harnessing the natural resources of the island. 1.2.1 Current electrical demand
In 1950, a total of 25GWh of energy was consumed on Guernsey. Since then, consumption has increased by 1500%, so during 2011/12 over 400GWh of energy was consumed on the Bailiwick (Guernsey Electricity, 2011). This hunger for energy is expected to continue growing, with a further 13% rise predicted by 2023. This increase in demand is shown inFigure 1 .
Figure 1: Maximum Demand (Best Case Scenario, no Efficiency Measures) (States of Guernsey, 2011)
1.2.2 Current Electrical Supply
Electricity on Guernsey is currently supplied by two methods. It is generated on island at the Guernsey Electric power station in Vale, and also electricity generated in France is imported via the Channel Island Electricity Grid (CIEG) Figure 2 shows how much electricity these two methods supplied from 2003 to 2011, with an additional comparison with Jersey‟s electrical supply in 2010.

OFFSHORE RENEWABLE ENERGY FOR GUERNSEY
4
Figure 2: Locally Generated and Imported Electricity (States of Guernsey, 2011)
1.2.3 The Vale Power Station
At the power station in Vale there are currently eight generators in total. Five slow-start Sulzer diesel generators cover base load capacity. The generators operate on heavy (residual) fuel oil, and have a combined capacity of 65.3MW. In addition to these are three fast-start gas turbine generators. These operate on gas oil (35cSt diesel) and have a combined generation capacity of 50MW, and are primarily used for peak lopping and in emergencies. These generators are detailed further in Table 1.
Table 1: Currently Installed Local Generators (Guernsey Electricity, 2005)
Plant Manufacturer and Type
Capacity (MW) Year Installed
Total Running Hours (*)
Retirement Year
25 Year 35 Year
1C Sulzer RNF-68 12.2 1979 99792 2004 2014
2C Sulzer RNF-68 12.2 1980 111334 2005 2015
3C Sulzer RNF-68 12.2 1982 126501 2007 2017
4C Sulzer RNF-58 14.2 1987 95868 2012 2022
1D Sulzer RNF-58 14.5 1992 54495 2017 2027
GT2 Thomassen 19.5 1996 229 2021 n/a
GT3 Thomassen 19.5 1998 116 2023 n/a
GT4 Alstom (Cyclone) 11 2003 267 2028 n/a
**Running hours at 31 March 2005 A new 17MW diesel generator, purchased for £14m, is currently being installed at the Vale power station, ready to replace the first retiring diesel generator. It is scheduled to begin producing power in March 2013. 1.2.4 The Channel Island Electricity Grid
Electricity is also supplied to Guernsey via the Channel Island Electricity Grid (CIEG). This consists of a 90kV AC submarine cable that runs from France to Jersey, which has a total capacity of 85MVA, less than the peak demand of both Jersey and Guernsey during winter. A second 90kV cable, with a capacity for 50MVA of electricity, connects Jersey to Guernsey. This system is detailed in Figure 3.

OFFSHORE RENEWABLE ENERGY FOR GUERNSEY
5
Figure 3: Overview of the CIEG (ABB Power Technologies)
The cable between Jersey and Guernsey failed during March 2012, and was not repaired and reenergised until October the same year. During this period, all electricity had to be generated using the on-island fossil fuel generators, resulting in a 9% price increase (This is Guernsey, 2012). 1.2.5 Energy supply chain and associated issues
In 2011/12, Guernsey imported 82.1% (380GWh) of electricity via the CIEG, while locally producing 17.9% using the turbines at the Vale Power Station. It was calculated that of the overall energy consumption, 76.4% of this electricity originated from nuclear and low carbon renewable sources. Therefore during this year, approximately 100GWh of the 440GWh consumed by Guernsey came from unclean sources. However, both of these energy sources rely on some form of imports from the global market, be it fuel oil for the on-island generators or the electricity itself from France, meaning that Guernsey is ultimately not able to fully control its own energy supply. This, combined with the aging plants at the Vale Power Station, the apparent unreliability of the CIEG, and the new shipping legislation relating to oil and gas imports, lead to the conclusion that Guernsey‟s current energy supply is not secure. With regards to the future of Guernsey‟s energy supply, there are three distinct options. The first is to increase the amount of electricity imported through the unreliable CIEG, which is a possibility given the new contract with EDF beginning in 2013 (This is Guernsey, 2012). The second is to update the local generation capacity by installing new generators on-island and continuing to rely on imports from the fossil fuel market. Again, this is already being explored as highlighted by the installation of the new 17MW diesel generator at the Vale Power Station. The third possibility is to research the feasibility of harnessing the renewable energy resources of the island. Of these possibilities, the CIEG is known to be unreliable and has a maximum import capacity, while the price of fossil fuels on international markets remains volatile. The current supply chain on the island also restricts the supply of these fuels, and the storage of the fuel

OFFSHORE RENEWABLE ENERGY FOR GUERNSEY
6
is also a critical issue due to the unavailability of capital resources to promote adequate storage (States of Guernsey, 2011). These issues highlight the need for an import independent solution, and the harnessing of Guernsey‟s natural resources.

OFFSHORE RENEWABLE ENERGY FOR GUERNSEY
7
1.3 Report Scope
The RET have already done a great amount of work and commissioned several other reports investigating the potential deployment of renewables on Guernsey, as per the ambitions of the States of Guernsey. This report was commissioned to develop both short and medium term plans for the deployment of offshore renewables. To achieve this, all of the factors that govern the deployment of marine renewable energy devices were to be considered. In relation to the fact and figures provided in section 1.2, the specific objectives of this project are:
To consider all the factors that govern the deployment of marine renewable energy devices;
To develop a short-term (3-5 years) strategy for the deployment of marine renewable energy technology in Guernsey based on offshore wind technology;
To suggest a roadmap that considers the Bailiwick‟s medium term (up to 15 years) energy requirements and evaluate the potential of tidal stream technology;

OFFSHORE RENEWABLE ENERGY FOR GUERNSEY
8
1.4 Report Methodology
It is important that this report addresses all the necessary factors that will govern the development of plans for implementation of renewable energy in Guernsey. To account for this requirement, the team has identified key areas to be addressed to be able to fulfil the requirement for a detailed and effective deployment plan. In relation to such specifications; the following areas, and subsequent research topics, were identified as key to the production of the implementation scheme:
Technology – performed an assessment of the available and potential renewable energy technologies in both the wind and tidal stream sectors;
Resource – assessed the viability of the Bailiwick‟s wind and tidal resources, including the quantity, intermittency and reliability;
Planning – examined the potential conflicts with other marine users, as well as the social and legal implications of development to provide a basis for selecting a site;
Installation & Maintenance – explored the many possibilities pertaining to the construction and maintenance of offshore renewables to produce a viable installation process;
Electrical – investigated the current state of the Bailiwick‟s electrical infrastructure to produce a plan for connecting the proposed short-term site to the Bailiwick‟s electrical grid;
Environmental – assessed the environmental impacts of the plans, advising the other groups on the most environmentally friendly choices;
Economics – produced an approximate costing of both plans by taking into account the potential risks involved, the impact on local energy prices and the availability of subsidies;
The plans that are presented in this report are broken down in the same format to be able to provide some insight into the methodology used to produce the plans, as well as all the options considered in doing so. Following an interim market investigation to establish the maturity of renewable energy technology; it was established that wind turbines provide the most viable solution in a short term plan whilst tidal technology has been selected for the medium term (details to back up such definitions are available in sections 2 and 3). The selection of the respective technologies will divide the report into two sections:
Short term deployment plan based on wind power (Section 2)
Medium term deployment plan based on tidal power (Section 3)

OFFSHORE RENEWABLE ENERGY FOR GUERNSEY
9
2 SHORT TERM STRATEGIC OPTION (WIND) Compared to many other renewable energy technologies, such as tidal or wave power, wind turbine technology has been developed for over 30 years and is now proven to be a viable and mature technology for clean energy generation. It is therefore a notable option and forms the basis of the recommended short-term plan as outlined in this section of the report.

OFFSHORE RENEWABLE ENERGY FOR GUERNSEY
10
2.1 Off-Shore Wind Technology
There is a significant amount of technology and engineering going into the development of wind turbine, over the last 30 year there has been convergence in technology, the convergence is of a three blade design, with a horizontal axis, at present the only viable solution to commercial scale energy production, when picking the right turbine there is a number of different factors to consider. Advances in offshore wind technology has brought about an evolution towards larger turbines (blade diameter and rating) that are able to capture greater amounts of the available wind resources, (Figure 4). These technological progressions have led to wind devices becoming competitive with conventional fossil fuel and nuclear electricity production, and as we see ever increasing costs of fuel, the levelisation will only continue.
Figure 4 : Temporal Evolution of Wind Turbines
Worldwide installations of offshore wind has a power capacity of approximately 4.84GW, with the Greater Gabbard Array being the largest array as of August 2012, located 23 miles off the Suffolk coast UK, with an installed capacity of 504MW (4C Offshore, 2012).
2.1.1.1 Current Market Leader
The device most widely installed is the SWT 3.6 107 wind turbine; the Siemens 3.6MW turbine with 107m blade diameter has been used in 9 sites throughout Europe between 2007 and 2009 (Siemens 2012). Continuing development has led to a 120m diameter blade design of the SWT 3.6MW; the increase in size of the diameter of the blade has the advantage of a larger swept area (an increase of 2317.71m², 25.8%). The advantage of the larger swept area is an increase in the power produced at low wind velocities. The 120m diameter blade design has been installed at several recent projects, fpr example the recently completed 630MW London Array, that uses 175 of these devices (Siemens 2012).
2.1.1.2 Efficiency considerations
Wind speed is not constant, so annual energy production is never as much as the generator nameplate ratings multiplied by the total hours in a year. The capacity factor is the ratio of actual annual productivity in a year to the theoretical maximum (rated). Typically the capacity factors are around 20% to 40%.

OFFSHORE RENEWABLE ENERGY FOR GUERNSEY
11
There will be some loss due to mechanical efficiency. Direct drive turbines reduce the number of components needed to generate power, hence reducing this mechanical loss. Percentage down time due to routine maintenance mechanical failure needs to be taken into consideration. For more information on the theory based around how wind turbine works see Appendix : Wind Technology Theory.

OFFSHORE RENEWABLE ENERGY FOR GUERNSEY
12
2.2 Device selection
A range of factors need to be considered when selecting a device. The principal motivation for choosing the Siemens SWT was the maturity of the design and uptake by the commercial market. Below, the detailed aspects that substantiate this choice are discussed
2.2.1.1 Power Rating
The nameplate rating of the turbine demonstrates the maximum power output generated by the turbine when operating under optimal wind speeds. The larger the power rating, the larger power potential can be harnessed from the wind resource. The actual power output of the turbine is likely to be lesser than the nameplate rating, dependent on specific environmental conditions.
2.2.1.2 Operating Envelope
How often a wind turbine is generating power is determined by the operating envelope, different turbine designs and different turbine blade diameters change the operating envelope of a device. The larger the envelope the better, as the device can generate power over a broader spectrum of a wind resource, which will lead to higher energy generation. The lower limit of the envelope is the cut in speed and the upper limit is the cut out speed. Cut out speed is where, within modern designs, the turbine angles its blade into the wind to limit rotation, to protect itself in survival mode in extremely high winds.
Figure 5 : Power Output for Varying Ratings and Blade Diameter
The area under a power curve represents the amount of energy produced across an entire wind spectrum. A larger area demonstrates that a greater amount of energy can be generated, averaged out over a year. Figure 5 illustrates 4 different turbine configurations; a 6MW turbine with either a 150 metre or a 120 metre diameter blade, and 3.0MW turbine with either a 120 metre or a 100 metre diameter blade, which are typical approximations of current turbine.
2.2.1.3 Reliability
Statistics related to reliability of turbines (mechanical failure) often remain confidential intellectual property: potentially, unfavourable rates of mechanical failure would be detrimental to the reputation of the company. Some of the factors in reliability are a consequence of the design. The evolution of proven products combined with the incorporation of designs that reduce complexity, allow improved device reliability. An example of this evolution can be seen in refinements to the gearbox. Failures of

OFFSHORE RENEWABLE ENERGY FOR GUERNSEY
13
conventionally geared gear boxes account for 4% of all turbine failures (Sarkar et al, 2012): these are now replaced in modern designs with simplistic direct drive turbines with fewer components and higher reliabilities.
Figure 6: Typical Failure of a Wind Turbine (Sakar et al, 2012).
The reliability of wind turbines is improving as device design evolves and refinements are made to new turbines. First generation turbines had significantly higher failure rates than the latest generation of turbines. With current technology, the average turbine installed today achieves a reliability figure of about 98, although there are a high number of possible malfunctions that can occur (Figure 6). There is also a tendency in the first year of operation for a greater number of failures due to components „wearing in‟, however this has also been significantly reduced with the new turbine designs (Sarkar et al, 2012).
2.2.1.4 Installed Capacity
The number of devices installed globally gives an indication of industrial acceptance and how long the device has been fully operational. The more installed capacity, the more proven the technology and as companies converge on specific design features, they start to generates 'stables' of products, where the proven technology is just scaled to provide more varying power capacities.
2.2.1.5 Production Capability
The larger the production capability, the higher the production output, reducing order time, meaning more product can be built in a shorter period, resulting in a reduction of „lay‟ time. However orders have to be done early, in Guernseys position possibly in cooperation with larger developers, so as to take advantage of potential saving due to larger economies of scale.
2.2.1.6 Other considerations
Some factors cannot be quantified with the information available, such as cost. Cost can be roughly estimated by the size of the turbine and number order for installation. A large cost factor with offshore wind is the number of turbines installed and the subsea aspect of the support structure, so to a certain extent the larger the turbine, the fewer required, while still meeting the same output target, resulting in a cheaper overall project cost per mega watt installed.
Gearbox 4%
Generator 4%
Drive Train 2%
Electrical Systems 23%
Plant Control Systems
18% Sensors
10%
Hydraulic Systems 9%
Yaw Systems 8%
Rotor Blades 7%
Mechanical Brake 6%
Rotor Hub 5%
Structural Parts/Housing
4%

OFFSHORE RENEWABLE ENERGY FOR GUERNSEY
14
2.2.1.7 Manufacturers
There are several major industrial players in the development of turbines for the offshore wind industry. These are REpower, Vestas, Siemens, Gamesa and Sinovel. All of these turbine developers have started designing products around 5MW rated capacity and above. The large Gamesa and Sinovel Wind turbines are in prototype stage, and are years off finished products. REpower 6MW (126m diameter blades), the Siemens SWT 6.0 154 (154m diameter blades), and the Vestas V164 8MW (just recently boosted from 7MW output as of 08/12, rotor diameter 164m) the development of these turbines demonstrates the market trend towards, and viable nature of 5MW plus turbines (Vestas, 2012). With all considerations of wind power the key element is size as maximum rated output limits the considerable cost of installation of piles and maintenance. If we were to consider a large scale device primarily, there would be 3 devices above the 5MW threshold to consider. These would be the REpower 6MW device, the Vestas 8MW device and the Siemens 6MW. REpower is the most tried and tested of the three devices, with 30 devices installed at Thornton Bank phase II off the coast of the Vlaanderen region of Belgium, with a further 18 to be introduced in phase III (4coffshore, 2012). Vestas has the largest output value, but consideration of it is unrealistic within the short term as installation of the first prototype is not due until 2014 (Vestas, 2012). The Siemens SWT 154 6MW device was installed in pre commercial form in May 2011, onshore in Osterild, Denmark, and will have two prototypes installed at Gunfleet Sands II array ,UK in 2013 (Siemens 2012). Between the Siemens and the REpower turbine, the defining aspect was output capacity of production. REpower has signed a Memorandum of Understanding with RWE Innogy (2012) to be supplied with 1.9GW capacity of its 6MW device by 2016. This memorandum came about partly from RWE's concerns over future turbine shortage (4coffshore, 2012). Siemens has signed a similar framework agreement with Dong Energy for an installed capacity of 1.8GW between 2014 and 2017 (Dong, 2012). These figures differentiate little between the two devices, but when you consider the installed capacity of Siemens wind turbines (2.4GW worldwide) and REpowers wind turbines (250MW), the output capacity of Siemens demonstrates a far more developed and capable supply and service chain than Repower. 2.2.2 Options Matrix
Using the above criteria for device selection, an option matrix was designed to quantify what the best device would be. Each characteristic is given an associated weighting due to its relevance, and then each criteria is scored between 1 and 5, 5 being the best, and the summation of these relative benefits of each device derives the most suitable device.
Table 2 :Summary of Option Matrix (See Appendix xx for full option matrix)
Device V164 - 8.0
SWT 6.0 154
SL6000 G125-5 6M SWT 3.6 120
V 90 3.0
Brand Vestas Siemens Sinovel Gamesa REpower Siemens Vestas
Score 38 39 34 23 38 33 28
Rating 2 1 4 7 2 5 6

OFFSHORE RENEWABLE ENERGY FOR GUERNSEY
15
2.2.3 Justification for the Device Choice
The Siemens SWT 154 6 6MW turbine marginally came out as the favourable choice. When fully operational, the 6MW device can potentially generate 25GWh per year (Siemens, 2012). There is a significant swept area advantage over the similar 6M device for REpower, meaning that the Siemens device is capable of producing larger amounts of power at lower wind speeds. The Siemens 6MW turbine, after pre commercial testing proves the technology, should be the best device for a proposed offshore installation in the next 5 to 10 years, with the most up to data „intelligent‟ technology incorporated in the design (Siemens 2012) The SWT 154 6 turbine is a new product on the market with the real test of reliability yet to be fully known, however intelligent engineering has gone into simplifying the design to reduce the amount of components by 50%, cutting out gearbox problems, which are a common area of mechanical failure. Siemens engineer have a vast technical data base from many year of turbines operations (Siemens, 2012). Dong Energy, placing a large order demonstrates the manufacturing capacity and industrial acceptance. Siemens are a Global company based in Germany, and are the market leader for wind technology with their proven 3.6MW turbine being extensively installed though out the North Sea, Baltic, and Irish Sea (Siemens, 2012). The manufacturing centre is within close proximity to Guernsey, meaning a reduction in transport cost with initial construction, and minimising time of part delivery for the inevitable repair and maintenance reducing down time. Additional monitoring is needed over the next few years to make sure the development of the product stays competitive and to ensure the device continues on to full scale production. Product specification can be seen in Appendix 1 for the Repower 6MW device, Appendix 2 for the Siemens 6MW device and Appendix 4 for the Vestas 8MW device.

OFFSHORE RENEWABLE ENERGY FOR GUERNSEY
16
2.3 Wind Resource Assesment
To understand exactly how and to what extent a wind farm will benefit the community on Guernsey a detailed look into the available resource of wind energy is needed. This is conducted by an investigation of the past wind data available and comparing it with the power curves of the selected wind turbines. Knowledge of wind energy at a proposed site is essential to understand the viability of such a project. The power that can be produced from a site depends on the wind speed, therefore a detailed look into the local wind climate needs to be completed to determine how much power can be extracted. The amount of energy that could have been extracted from a proposed site can be established through the historical data collected over several years. Data can come from near-by anemometers. This record of wind speeds will give details of variation of the climate through different seasons of the year. The average power and the reliability can then be calculated. Simulations can then be run and the revenue stream from the sale of that electricity can be determined. In order to complete a thorough resource assessment at least 5 year‟s worth of data is required.
Figure 7 : Wind rose from Guernsey airport (windfinder.com, 2012)
Figure 7 provides a wind rose from Guernsey airport. This shows that the predominant wind direction is west-south-west with 28% of the time the wind blowing between west and south west. Windfinder also states that the average wind speed is 12 knots. When translated to the Le Chouet equivalent (see below) this results in an average wind speed of 16kts. Wind as a resource is expressed in wind power classes ranging from Class 1 to Class 7, with each class representing a range of mean wind power density or equivalent mean wind speed at specified heights above the ground.

OFFSHORE RENEWABLE ENERGY FOR GUERNSEY
17
Table 3 : Classes of wind power density (D Elliot, 2006)
Wind turbines require a Class 4 classification or higher, however Class 3 areas can be suitable for wind energy development if tall turbines (~50 m hub height) are used. Class 2 areas are marginal and Class 1 areas are unsuitable for wind energy development. Elliot (2006) notes that this indicated broad areas where a high wind resource is possible, but does not account for local variability. It can be seen that the data from Chouet would fall into Class 6, ranking this location as having an outstanding wind resource. It must be noted that mean average power output of a wind turbine cannot be equated from the average wind speed. This is because the power curve of the wind turbines is non-linear. The mean wind speed can also be a misleading indicator of the available wind resource. Therefore it is necessary to carry out a detailed analysis and gain further information regarding the amount of time the wind was blowing and at what speed. 2.3.1 An Industry Standard Wind Resource Assessment for Guernsey Renewable
Energy Team.
2.3.1.1 Monitoring and Measurement Parameters:
When assessing the wind resource on Guernsey for the purpose of renewable energy it is imperative to appropriately quantify the available wind resource on the island. Currently the wind measurements are taken at one anemometer located at Guernsey Airport (Long/Lat: 49.4331°, -2.5981°) (Gladstone. P., 2012) which is centrally located on the island. It currently takes measurements 10m above the runway (Lee. O, 2012). Measurements are also collected from another anemometer installed at the location of Le Chouet mast in the north-east of Guernsey (Figure 8) and produces data on a minute by minute basis for speed and direction.
30m 50m
Wind Power Class Wind Power Density (W/m2)
Wind Speed m/s
Wind Power Density (W/m2)
Wind Speed m/s
1 - Poor ≤160 ≤5.1 ≤200 ≤5.6
2 - Marginal ≤240 ≤5.9 ≤300 ≤6.4
3 - Fair ≤320 ≤6.5 ≤400 ≤7.0
4 - Good ≤400 ≤7.0 ≤500 ≤7.5
5 - Excellent ≤480 ≤7.4 ≤600 ≤8.0
6 - Outstanding ≤640 ≤8.2 ≤800 ≤8.8
7 - Superb ≤1600 ≤11.0 ≤2000 ≤11.9

OFFSHORE RENEWABLE ENERGY FOR GUERNSEY
18
Figure 8 : Satellite image of Guernsey identifying the location of the two anemometers, showing the different sections and their relative exposure to prevailing winds (Lee. O, 2012). Le Chouet is shown
to the northeast (top right) and the Airport is shown to the south (bottom middle)
For the collection of wind data the minimum monitoring duration should be one year (Lee. O, 2012 and AWS Scientific, Inc. 1997), but two or more years will produce a greater quantity and more reliable results. The collection of one year‟s data is usually sufficient to determine the diurnal and seasonal variability of the wind in the chosen locations (AWS Scientific, Inc. 1997). When assessing data for this report only a limited amount was available, which included the wind speed and direction for the two sites (Airport and Le Chouet). To produce an industry standard assessment of the wind resource found on Guernsey the following measurement parameters are suggested. The power available depends of the swept area of the proposed wind turbine, once this has been established. Using Betz Limit or Betz' Law, the theoretical maximum power efficiency can be calculated (Raeng. 2011). P = 1/2 ρ A v3 where P = power (W) ρ = density of air (kg/m3) A = area wind passing through perpendicular to the wind (m2) v = wind velocity (m/s) It is important to understand the relationship between all of these factors and to utilise this equation to calculate the power. Having knowledge of how a chosen turbine behaves in different wind speeds is critical to understanding down time of the turbine and correctly calculating and assessing the available resource on Guernsey.

OFFSHORE RENEWABLE ENERGY FOR GUERNSEY
19
These nominal parameters are recommended to obtain the basic information and assessment needed to evaluate the wind resource and identify feasibility issues (Det Norske Veritas. 2011 and AWS Scientific, Inc. 1997).
Table 4 : Measurement of wind resource assessment parameters (AWS Scientific, Inc. 1997)
MEASURED PARAMETERS MONITORING HEIGHTS
Wind Speed (m/s) 10 m, 25 m, 40 m
Wind
Direction 10 m. 25 m, 40 m
(degrees)
Temperature (°C) 3 m
2.3.2 Wind Speed:
A focus should reside on wind speed as the most important indicator of the resource available during the assessment, due to the dependence of power on the wind speed cubed (AWS Scientific, Inc. 1997 and Brower. M. C., 2012). Numerous measurement heights are suggested in order to critically assess the resource at the designated sites inclusive of wind shear characteristics. Heights suggested by the NREL affiliated wind measurement programs are 40m, 25m, and 10m (AWS Scientific, Inc. 1997). Data should be collected for wind speed using either a cup or propeller anemometer which is the current technology utilised at Guernsey Airport mast and the Chouet mast.
40 m:
This height represents the approximate hub height for wind turbines and is the height at which data can be compared against power curve data from different manufacturers of offshore wind turbines. Actual hub heights are usually in the 50 m to 65 m range, so a height of 40m is not ideal, however gives sufficient indication to be valid.
25 m:
This level approximates the minimum height reached by the blade tip portion of a rotating turbine rotor and will help define the wind regime encountered by a typical turbine rotor over its swept area.
10 m:
This is the universally standard meteorological measurement height. However, in locations where the interference of local vegetation (e.g. forest) at this height is unavoidable, an alternative low-level height of 10 m above the forest canopy may be used. 2.3.3 Wind Direction:
Wind vanes should be installed at all significant monitoring levels as shown in Table 4. Wind direction frequency information is important for identifying preferred terrain shapes / orientations and for optimizing the layout and array of wind turbines within an offshore wind farm. It may also identify topographic barriers which decrease the wind speed in certain directions

OFFSHORE RENEWABLE ENERGY FOR GUERNSEY
20
2.3.4 Air Temperature:
Air temperature is an important descriptor of a wind farm‟s operating environment and is normally measured either near ground level (2 to 3 m), (Environmental Change Institute. 2005, and AWS Scientific, Inc. 1997), or in close proximity to hub height. The importance of temperature is its influence on air density, a variable required to estimate the wind power density density and a wind turbines power output (Brower. M. C., 2012). Due to this being a specific variable required to estimate the wind power density and a wind turbine's output, power output can be extremely sensitive to the surrounding air temperature. This sensitivity can greatly alter the overall power output of the wind turbine. As a result this would change power calculations and greatly affect the resource assessment and its accuracy. Ammonit, (2011) identifies that a 10°C variation in temperature will generate a difference of approximately 4 % in air density and therefore in the wind energy power output. There are other suggested but not obligatory parameters to measure in order to increase the effectiveness and overall accuracy of the resource assessment. These are outlined and suggested by the report as follows and summarised in Table 5: Optional parameters to monitor for wind resource assessment (AWS Scientific, Inc. 1997).;
Solar radiation at the site location.
Vertical wind speeds
Change in temperature with height (delta temperature)
Barometric pressure
Table 5: Optional parameters to monitor for wind resource assessment (AWS Scientific, Inc. 1997).
Measured Parameters Monitoring Heights
Solar Radiation (W/m2) 3 - 4 m
Vertical Wind Speed (m/s) 38 m
Delta Temperature (°C) 38 m 3 m
Barometric Pressure (kPa) 2 - 3 m
2.3.5 Sampling Intervals:
It is suggested in AWS Scientific, Inc. (1997) that the sampling intervals while collecting data for the parameters of wind speed, wind direction and air temperature must be at every 1-2 second intervals and recorded as averages, standard deviations, and maximum and minimum values (Brower. M. C., 2012). Currently the data being collected at Guernsey Airport and the Chouet mast is collected on a minute basis.
Averages: Calculated for all parameters every 10 minutes and recorded.
Standard Deviation: Determined for both wind speed and wind direction.
Maximum and Minimum values: This should be determined for wind speed and temperature on a daily basis.
After taking into account wind direction, speed and air temperature it is possible to quantify the potential energy resource available.

OFFSHORE RENEWABLE ENERGY FOR GUERNSEY
21
2.3.6 Estimating the Resource at Hub Height.
Both of the anemometers at the airport and Chouet are collecting data at approximately 10m from ground height. If an accurate portrayal of the wind resource is to be carried out, measurements at heights closer to the centre of the rotor is required. This means taking measurements at heights of 40m as discussed in and AWS Scientific, Inc. (1997). If this cannot be achieved, extrapolating speed measurements between heights must be carried out as explained in Brower. M. C., (2012) which involves the analysis of observed shear, local meteorology, topography and land cover. Power curve data from different manufacturers of offshore wind turbines (produced for the hub height), using different types of turbine technology can then be used to evaluate their suitability at a potential deployment site. Appropriate analysis of local topography is required as this could greatly affect the level of resource available due to topographic barriers and the influence of surface roughness. In our assessment of the wind resource on Guernsey we did not take into account individual values for surface roughness which could have a great effect on the potential energy generated (Griffiths. R. F, et al 1998), and is something recommended during further assessment of the resource. 2.3.7 Wind Speed Variation (Airport and Chouet).
When assessing more detailed daily averages from the Airport and Chouet wind data, it is shown that Chouet experiences higher wind speeds and for longer periods of time compared to the data received at Guernsey Airport. This is due to the predominant south westerly wind direction found on Guernsey (Lee. O, 2012 ) and due to the fact that the Chouet is significantly more exposed from the south west as identified in Figure 8. The location of the Chouet mast has been advantageously placed in close proximity to the potential deployment site so that the wind resource available can be correctly estimated (Brower. M. C., 2012). . This is beneficial in assesing the wind resource of Guernsey, however installing additional measurement stations in offshore locations would be greatly beneficial to future research. 2.3.8 Future Considerations for Wind Resource Assessment.
Despite the use of anemometers for collecting wind data on Guernsey there are now much for accurate technologies to do this including remote wind sensing: light detection and ranging (LIDAR) and sonic detection and ranging (SODAR). This may be a recommendation for future data collection techniques with a higher degree of accuracy. In a recent report by Lee. O. (2012), the use of wind models is discussed. This would be future improvement to assist in obtaining the most accurate data and assessment of the wind resource. Four models suitable for quantifying the wind resource found on Guernsey include:
Measure Correlate Predict (MCD Model)
Atmospheric Motion Vectors (AMV)
Virtual Met Mast
3Tier Prospecting Model The use of a wind speed model such as virtual met mast would provide good means of verifying data collected from the two anemometers. The use of the virtual met mast would help provide key wind climatology statistics including mean wind speed, wind direction, exceedance values, air density, wind shear and turbulence intensity (Met Office. 2012).

OFFSHORE RENEWABLE ENERGY FOR GUERNSEY
22
Using exisiting data as inputs to a wind model is often a cost effective solution and removes the time require to collect new data sets from physical met masts (Met Office, 2012). Met masts such as those installed on wind research platforms, an example being the offshore wind research platform in the Baltic Sea produce high quality reliable data, but are expensive (Offshore Wind, 2012). 2.3.9 Neural Networks
Neural networks could be used to translate the data from the airport to match the data from the Chouet mast. A Neural network is a computer system modelled on the human brain and nervous system. It can be trained using a small sample of input and output data (in this case the data from the same time from the airport and from the Chouet mast respectively) and it will learn the pattern and correlation between the two. This new knowledge can then be applied to all of the data from the airport for which there is not any data from the Chouet mast from the same time. This will then effectively increase the available data from the Chouet mast and a thorough and accurate resource analysis at Chouet can be completed using all of the data gathered from the airport. Neural networks can be run as add ins to mathematical software such as Matlab. This method is very time efficient and can produce very accurate results. In a matter of hours the network could be set up trained and run with all the previous data from the airport to predict what the wind would have been recorded at Chouet. 2.3.10 Methodology
Data from the airport was available for 2000 to 2010, and the same 8 months as the data from Chouet. It has been previously discussed as to how, with further knowledge gained about the local area, a highly detailed and accurate conversion factor could have been implemented. A comparison was done using the known data between the airport and the Chouet wind speeds. It was discovered that there was a trend between the two sites and that wind data from the Chouet mast was on average a factor of 1.33 times greater than the wind speeds given at the airport. The comparison is shown in Figure 9. The data from Chouet mast also showed that there was no considerable difference between the direction of the wind at the airport and at Chouet.
Figure 9: Data showing the factor of difference between the wind speeds at the airport and Le Chouet
Given this information, the data from the airport between 2000 and 2010 was converted to match the data from the Chouet mast.

OFFSHORE RENEWABLE ENERGY FOR GUERNSEY
23
The recording interval was an average of every minute. This provides a very detailed view of the wind data. The industry standard is once every 10 minutes (Roeth, 2010). The sampling frequency is unknown to the author as is the standard deviation required to determine or identify any anomalies within the data. Frequency distribution charts were used to estimate the amount of time the wind was blowing at certain strengths. This method allows for the analysis and comparison of the wind resource from a monthly, seasonal, yearly and total basis. The frequency distribution charts can then be compared to the power curve of the chosen wind turbine. A number of key figures can be determined. These are: Mean power output, from:
Where P is the percentage of minutes recorded the wind blows at the given speed x, O is the power output of the turbine (kW) at speed x
Total power generated in a given timescale (MWh), from
Where H is the number of hours in the given timescale
Percentage of "downtime"
Capacity factor (calculated from maximum possible power output divided by actual power output)
N.B To calculate the mean power output and total power generated, the percentage of the minutes recorded has been used. This is because if the actual number of minutes over the timescale were used it would count any minutes where there were no data available for as zero, hence reducing the true average value. This method will give the closest possible results to the true results, without being able to obtain any missing minutes from the data. 2.3.11 Extractable Power Available
In order to understand the true amount of power that wind energy could be delivered to the island of Guernsey, a comparison between the wind speed and the power output of the turbines needs to be completed. The decision was made to use two turbines from Siemens for further analysis. These are;
SWT-3.6-107, with a nominal power output of 3.6MW and a swept diameter of 107m
SWT-6.0-154, with a nominal power output of 6MW and a swept diameter of 154m
Each of these turbines produces a different power curve. A power curve relates the wind speed to the power output of the turbine. Figure 10 shows the power curve of the turbines selected and hence the wind speed to power relationships used to analyse the potential wind power available. All of the power values shown are for the equivalent per one turbine.

OFFSHORE RENEWABLE ENERGY FOR GUERNSEY
24
Figure 10: Power curves of the wind turbines selected
The average power available from the wind available to each of these turbines is given by:
Where P is the power output (Watts), ρ is the density of air (1.225 kg/m3), A is the swept area of the turbine (m2), D is the diameter of the turbine (m) and U is the average wind speed (m/s).
Table 6: Statistics from average wind speed at Chouet
SWT-3.6-107 SWT-6.0-154
Diameter (m) 107.00 154.00
Area (m2) 8992.02 18626.50
Average Power Available (MW) 3.06 6.34
Annual Average Power Output (MWh) 26796.81 55508.18
The data from Table 6 shows the average power available to the swept area of the wind turbines. The turbines are about 51% efficient, therefore the power generated will be less. The power generated will not decrease linearly, because as seen in Figure 9 there is not a linear relationship between wind speed and power output. 2.3.12 Available Wind Power
Thissection examines the performance of the selected turbines had they been installed during the period of 2006-2010. To distinguish and compare between the two sizes of device, the results from the SWT-6.0-154 turbine are displayed consistently in red, and results from the SWT-3.6-107 are consistently in blue. Using the power curves of Figure 10 and the converted data from the airport frequency distribution charts were generated for each of the turbines being analysed. These frequency distribution charts can be seen as and . Graphical representations of these tables can be seen as Figure 11 and Figure 12. These show that the amount of downtime due to the wind conditions is the same for each turbine, approximately 17%, but that the SWT-6.0-154 is producing its maximum power for a much greater period of time, about 7% of the time more. These graphs therefore show the variation in power generation from the turbines.

OFFSHORE RENEWABLE ENERGY FOR GUERNSEY
25
Table 7: Percentage of time spent at specific power for SWT-6.0-154
Power (kW) Percentage of time
6000 13.8
5550 7.32
4860 4.50
4170 10.6
3490 6.15
2800 13.5
2120 7.19
1430 13.8
740 6.52
0 16.6
Figure 11: Percentage of time for which the SWT-6.0-154 would have generated the indicated power based on historical data collected from the airport during the period 2006-2010. Wind speeds have
been adjusted with the correction factor described in the text to enable the airport wind speeds to be applied to Le Chouet, for which only 9 months data was available. Key shows Power (kW).

OFFSHORE RENEWABLE ENERGY FOR GUERNSEY
26
Table 8: Percentage of time producing what power SWT-3.6-107
Power (kW) Percentage of time
3600 6.37
3500 4.47
3250 2.98
2800 7.32
2150 4.50
1600 10.6
1100 6.15
750 13.5
500 7.19
350 13.8
200 6.52
0 16.6
Figure 12: As for Figure 11 for the SWT-3.6-107 turbine.
The data from the 5 years was then used to discover the amount of power that the turbines would have generated had they been installed during this period. This was achieved by using the results above and multiplying the amount of time during the year that the wind was blowing at a speed by the power generated by the turbine at that speed. Figure 13 and Figure 14 show that there is slight variation in the amount of power generated from year to year. These figures also show that the SWT-6.0-154 would produce an average of 25GWh per year and the SWT-3.6-107 would produce an average of 10.5GWh per year.

OFFSHORE RENEWABLE ENERGY FOR GUERNSEY
27
These graphs also show that although the amount of downtime might be greatest in one year it doesn't mean that the power output will be the least. This shows that to meet the target of 100GWh a year generated by an offshore wind farm either; 4 SWT-6.0-154 turbines or 10 SWT-3.6-107 turbines would be required.
Figure 13: Annual and average power output and downtime for SWT-6.0-154
Figure 14: Annual and average power output and downtime for SWT-3.6-107
The capacity factor is "the ratio of the actual energy produced in a given period to the hypothetical maximum possible, i.e. running full time at the rated power" (University of Massachusetts at Amherst, 2004) meaning that it is the actual yearly power output divided by the maximum possible yearly power output. The capacity factor will affect the LCOE

OFFSHORE RENEWABLE ENERGY FOR GUERNSEY
28
(Levelised Cost of Energy). If the capacity factor is very high the cost of energy will be lower than if the capacity factor is very low. Typical capacity factors for offshore wind farms installed in 2012 would be a minimum of 38.9%, a median of 45.6% and a maximum of 54% (OpenEI, 2012) The maximum annual power output can be equated from: Maximum annual power output (GWh) Where P is the rated power of the turbine in GWs and h is the number of hours in a year. Therefore the maximum annual power output for the SWT-6.0-154 and SWT-3.6-107 is 52.56 GWh and 31.536 GWh respectively for a year with 365 days. Due to the higher levels of efficiency the SWT-6.0-154 has a much higher capacity factor averaging about 48% compared to 34% from the SWT-3.6-107. This can clearly be seen in Figure 15. According to Open EI (2012) this places the SWT-6.0-154 in Guernsey above the average capacity factor for offshore wind farms. The capacity factor of the SWT-3.6-107 at this location would be below the minimum stated capacity factor of installed wind farms in 2012.
Figure 15: Annual and average comparison of capacity factors

OFFSHORE RENEWABLE ENERGY FOR GUERNSEY
29
Figure 16: Monthly trends of the turbines power output
Figure 16 shows the monthly trends in power production of the turbines. It is clear that the months of the highest production fall in the autumn and winter seasons. It is expected that this will correlate to the seasonal demand for electricity. This is due to an increase in demand for heating and lighting during the colder and darker periods of the year. 2.3.13 Summary
To summarise the 2006-2010 wind resource assessment for using either the SWT-3.6-107 or SWT-6.0-154 turbines, was created.
Table 9: Summary of wind data analysed
SWT-3.6-107 SWT-6.0-154
Min Mean Max Min Mean Max
Capacity Factor (%)
30.38 33.87 38.23 45.45 48.06 52.53
Downtime (%) 13.34
16.69 18.96 13.34
16.69 18.96
Annual Power Output (GWh)
9.58 10.68 12.06 23.89 25.26 27.61
shows the comparison between the two turbines analysed. It clearly shows the advantages of the SWT-6.0-154 over the SWT-3.6-107. It would have produced about 2.5 times more power, meaning that fewer turbines would need to be installed, and had a much higher capacity factor which in turn would mean a lower Levelised Cost of Energy (LCOE). The downtime of the two turbines due to the wind conditions was however, the same. The improved performance of the SWT-6.0-154 arises from its capacity for higher production at low wind speeds.

OFFSHORE RENEWABLE ENERGY FOR GUERNSEY
30
2.4 Array
2.4.1 Array size
With an indication of the available wind resource and the technology selected the size of the array can be determined; our aim is to cover around 25% of Guernsey energy demand satisfying the 2020 energy targets. From the wind data we have established that the SWT-6.0-154 will produce 23.89GWh per year given the wind data from 2010. The energy demands that we are trying to cover are 89.9GWh. To calculate the number of turbines required we divide demand by predicted output of 1 turbine.
89.9GWh/ 23.9GWh = 3.7615 turbine required This equates to a requirement of 3.76 turbines to generate the required output. 4 Turbines will fulfil this energy demand with allowances made for down time for maintenance and repair. 2.4.2 Array spacing
The array spacing will depend on the location, ground conditions, number of turbines and available space. Wind turbine studies have shown that turbines spaced at eight to ten times the rotor diameter in the downwind direction and five times the rotor diameter in the crosswind direction have as little as 10% wake interaction due to turbulence (Sangur, 2010). The London Array, consisting of 175 SWT-3.6-120 turbines are spaced 8.33 times the diameter downwind (1000m) and 5.41 time the diameter (650m) cross wind (London Array n.d). A rectangular array spaced at 10 times the rotor diameter downwind to the prevailing wind direction (west south west for Guernsey) and 5.5 times the rotor diameter cross wind would minimise turbulence and be the most efficient layout for the infrastructure: see Appendix 5 for a plan of the array layout. 2.4.3 Comparison to SWT-3.6-107 Turbine
The predicted output for 1 SWT-3.6-107 turbine using 2010's wind data will produce 9.5812GWh per year. To meet the demand of 89.8GWh per year with the SWT-3.6-107 turbines, we will need to divide the demand by the production from 1 turbine
89.9GWh/ 9.6GWh = 9.3646 turbine required This equates to a requirement of 10 turbines to generate the required output. 10 turbines will fulfil this energy demand with allowances made for down time for maintenance and repair.

OFFSHORE RENEWABLE ENERGY FOR GUERNSEY
31
2.5 Site Selection
2.5.1 Introduction
Human activities in the marine environment are ever-increasing in number, intensity, and distance from shore. When not correctly sited and managed, these activities can create conflicts across space and time, reducing the capacity of ecosystems to provide valued services (Collie et al, 2012). These conflicts may result in extensive and largely irreversible damage and loss to the biodiversity in marine and coastal areas. Due to limited resources (in both area and quantity) multiple-use conflicts are emerging between the different uses themselves e.g. wind farms and shipping (UNESCO, 2007). In response to these pressures, marine spatial planning (MSP) is gaining popularity and priority in many parts of the world (Collie et al, 2012). MSP provides an integrated process that can deal effectively with these conflicts and is considered a key tool to make ecosystem-based, sea use management a reality (Douvere, 2008). MSP is „„a public process of analysing and allocating the spatial and temporal distribution of human activities in marine areas to achieve ecological, economic, and social objectives that are usually specified through a political process‟‟ (Ehler and Douvere, 2007). MSP is often seen as a practical strategy to apply the ecosystem-based approach to the management and conservation of the marine resources (Qiu and Jones, 2013). The concept originally started over 30 years ago as a management approach for the sustainable conservation of the Great Barrier Reef Marine Park. It has now been advanced and used more recently in the seas of European counties as an effective tool for achieving multiple objectives. Several countries within Asia (Vietnam and China) use MSP to accomplish both environmental and economic objectives. When applied at an ecosystem-based level, it is a practical approach that progresses towards ecosystem-based management of the marine systems (UNESCO, 2009). While the purpose of the MPS is to set out the policy framework for the surrounding areas of Guernsey, marine plans are necessary to outline how the MPS will be implemented. Marine plans will present and interpret policies to create area-specific policy for the management of activities and resources. Marine plans will need to be forward looking and flexible. The use of constant monitoring and review of processes will allow flexibility to anticipate and accommodate a number of future scenarios and demands. Examples of this may include evolving technologies, techniques or evidence that may be present within the marine environment. MSP and other marine planning systems should work together and interact with existing planning regimes within the area (MMO, 2011), for Guernsey this should include surrounding Countries. 2.5.2 A Step-by-Step Approach
In recent years there have been several attempts to define both the scope and nature of an MSP. However, relatively few propose how to put MSPs into practise. UNESCO has created a guide which aims to answer how to make MSP operational. The guide uses an understandable, straightforward, step-by-step approach showing how MSP can be implemented and developed. It is principally intended for professionals in charge of the management of marine areas and their resources. The guide gives an understanding of different tasks, skills and expertise needed to develop and preserve the MSP efforts. It also examines issues such as organising stakeholders, obtaining financial resources, and monitoring and evaluating performances. The steps proposed in this guide are mainly based on the investigation of other MSP initiatives from around the world. This has allowed analysis and documentation of the steps that can lead to successful implementation of the MSP process (UNESCO, 2012). The following part of this section will provide a brief overview of the steps involved with step-by-step approach to marine spatial planning.

OFFSHORE RENEWABLE ENERGY FOR GUERNSEY
32
It is important to note that we can only manage and plan human activities within the marine environment; we do not have the same control over marine ecosystems or components of them. We can however assign human activities to specific marine areas with objectives, e.g. by specific uses (wind farms, aquaculture etc.), development sites or preservation areas. MSP does not lead to a one-off plan, it takes a continual, „holistic‟, interactive process that adapts and changes over time. According to UNESCO the development and implementation of MSP involves 10 key steps, which are:
Identifying need and establishing authority
Obtaining financial support
Organizing the process through pre-planning
Organizing stakeholder participation
Defining and analysing existing conditions
Defining and analysing future conditions
Preparing and approving the spatial management plan
Implementing and enforcing the spatial management plan
Monitoring and evaluating performance
Adapting the marine spatial management process These 10 steps must not be considered as a linear process that moves from step to step. As the planning process is dynamic, planners have to be open to change and accommodate this as the process evolves over time. Many feedback loops should be present within MSP. For example, existing and future conditions will change and adapt as new information is identified or included in the planning process. Early identified goals and objectives are expected to be modified as cost and benefit of different management measures are identified later in the planning process. Further to this, stakeholder participation will adapt the planning process as it develops over time. Comprehensive MSP provides integrated framework for management that provides a guide for single-sector planning. MSP can provide important background information for different management sectors within the marine area, such as marine protected areas or fisheries. The MSP must be used in association with these sectors and is not aimed at replacing single-sector planning. Instead, it aims to provide supervision for a number of decision-makers responsible for certain activities, sectors or concerns. This ensures they will have the ability to make the decisions confidently in a more integrated, comprehensive and harmonising manor (UNESO, 2009). 2.5.3 Stakeholder engagement
It has been identified by UNESCO, in the ten steps to Marine Spatial Planning (MSP), that engaging with stakeholders is key in successful planning for a renewable energy project (UNESCO, 2009). Stakeholder engagement should be carried out throughout the entire planning process. It is believed that through effective engagement, concerns about renewable energy projects can be addressed. This can induce positive changes in behaviour, increased knowledge and skills in stakeholders (Pomeroy, 2008). Effective engagement can, and should, take many different forms in order to be accessible to all parties. These exercises should be wide ranging and innovative, avoiding solely taking the form of forums that just collect public comments (Pomeroy, 2008). Examples of these exercises include:
Facilitation of workshops and one on one meetings
Making information public and transparent
Providing education
Providing financial compensation, if necessary

OFFSHORE RENEWABLE ENERGY FOR GUERNSEY
33
Stakeholders in the case of Guernsey are numerous and include recreational fishers, commercial fishers, home owners and the shipping industry. A more detailed guide to these can be found in the constraints map Figure 17. 2.5.4 Site constraints
For site selection of an offshore wind farm, it is vital to recognise the constraints that could potentially conflict with a proposed site. The Guernsey Renewable Energy Commission (GREC) produced a Regional Energy Assessment (REA) from which data was used to determine constraints on the location of a potential wind farm. A constraints map was created to identify spatial limitations and locate a suitable area for the proposed site. This included bathymetric data, major shipping routes, and environmental data etc. which were layered onto this map. As can be identified by the square box (Figure 17), three sites have been suggested on the north east of the island, where other activities have not been identified as being carried out. The water depth here is also of a suitable depth, compared to the north west of the island where depths exceed 50m.

OFFSHORE RENEWABLE ENERGY FOR GUERNSEY
34
Figure 17 -Constraints map for Guernsey, demonstrating areas of conflict within the marine zone. Dark blue represents 50+m depth

OFFSHORE RENEWABLE ENERGY FOR GUERNSEY
35

OFFSHORE RENEWABLE ENERGY FOR GUERNSEY
36
2.5.5 Guernsey’s Regional Environmental Assessment (REA)
Guernsey falls outside the legislation of the UK and EU, therefore Strategic Environmental Assessment legislative requirements do not apply. However, Guernsey has used the basic principles and framework of SEA. Their REA was completed to provide a strategic assessment of the potential bearings that marine renewable energy devices may cause to the environment of Guernsey. The REA recognises, evaluates, and defines the possible significant effects, both positive and negative, of developing marine renewable energy (GREC, 2011). As well as considering the impacts on the sea and seabed, human beings and their existing health, transportation, resources, industry, culture, and landscapes are also taken into account (GREC, 2011). 2.5.6 Bathymetry
The Bathymetric data was downloaded from the Marine Digimap in the Seazone Digital Survey Bathymetry (Digimap, 2012). The Sea Zone bathymetry was chosen as it has the highest resolution of the region. Depth measurements extends to only 50m depth, but depths beyond 50m currently pose unresolved technical challenges and would therefore be deemed unsuitable. It is essential for a detailed hydrographic survey to be carried out for the development of an offshore wind farm. This provides information on the water depth, seafloor slopes, outcropping and other topographical features that may be present on the sea floor. These accurate and detailed data sets are required for the planning of cable routing, foundation design for turbine support structures, and on-going inspections. 2.5.7 Navigation and Shipping
The proposed offshore wind farm was located accordingly to cause minimal disruption, economic loss and safety risk of other users of the sea. It is stated in the Offshore Energy Strategic Environmental Assessment (SEA, 2009), that development should not interfere with major commercial navigation routes. This includes causing a significant increase in collision risk, or causing considerably longer transit times and result in significant detriment to tourism, recreation and quality of life. Key shipping channels include the Big Russel and Little Russel as well as the east of Sark which, have therefore been excluded as areas for the proposed site. Outside key shipping routes, it is essential to establish Safety Zones around the development sites with clear marking and lighting to avoid the risk of collision. 2.5.8 Marine Mammals
The REA provides data on marine mammal sighting which is displayed on the constraints map. However, this cannot be considered entirely reliable due to the highly mobile nature of cetacean (GREC, 2011). Due to the lack of baseline data on the population of other marine species and important habitats, it is not possible to take them into account in allocating our proposed site. The REA suggests, prior to development, a significant baseline survey and monitoring of marine mammals needs to be undertaken using passive acoustic monitoring devices deployed at the proposed site (GREC, 2011). There is an important haul out area for Grey Seals at „The Humps‟ North of Herm. This area and highlighted mammal sightings are listed in Annex 2 and 5 of the EU Habitats Directive, which require that Special Areas of Conservation (SACs) be established for their protection (GREC, 2011). Even though Guernsey is not subject to this EU legislation, avoiding haul out zones will be a precautionary principle for proposing a site.

OFFSHORE RENEWABLE ENERGY FOR GUERNSEY
37
2.5.9 Ramsar Sites
Ramsar is the Convention on Wetlands of International Importance, an intergovernmental treaty that offers the framework for national action and international cooperation for the conservation and wise use of wetlands and their resources (Ramsar, Iran, 1971). Considered as a Site of Special scientific interest (SSSI) it‟s protected within the EU by The Conservation of Habitats and Species Regulations 2010. Guernsey has two Ramsar sites that area indicated one on the west coast of Guernsey and one on the west of Sark. 2.5.10 Landscape Buffer Zone
The areas of coast on all the islands are identified as having important landscape value. The landscape buffer zone round the islands, to 1 nautical mile, was a step taken by the RET recommended in their REA. It‟s protected to preserve the visually important landscape views for residents and tourists. 2.5.11 Grid Connections
Telecommunication cables are shown Figure 17 on the north of Guernsey going to UK and France. With the power cables shown on the south east of the island, connecting Guernsey‟s power supply from France via Jersey. 2.5.12 Bird Breeding
The REA has identified the vital bird breeding areas on the islands of Guernsey, Herm and Sark. They include the entire South coastline of Guernsey, the whole of Sark‟s coastline, as well as the south west of Herm and The Humps. There is limited data on the migration of birds making it difficult to develop it into the plan. The primary concern of potential disturbance to breeding birds can be avoided through the timing of the installation, as advised in the REA. The impacts to birds are also relative to the device; therefore mitigation through device design is important. 2.5.13 Commercial Fishing
The effects that the development of an offshore wind farm could have on commercial fishing activities depend largely on the type of fishery and the extent of the fishing grounds. Due to the lack of research, it is very difficult to assess the effect of offshore wind farm developments on commercial fish and shellfish species. For the proposed site, commercial fishing areas were avoided but when comprehensively planning for a development, engagement with the fishing industry is advised. There are various practices for liaison with the fishing industry such as the FLOWW model (BERR, 1998). This should be undertaken by the developer as part of any site selection process to determine the key areas of importance for commercial species (GREC, 2011). 2.5.14 Historic environment
The areas identified in Figure 17 of great importance are: the area surrounding Vazon Bay on the east of Guernsey; outside Guernsey Harbour; between Herm and Jethou; and to the north of Herm. These are locations with high concentration of wrecks that require a licence to disturb. War graves require a significant exclusion zone at all times (GREC, 2010).

OFFSHORE RENEWABLE ENERGY FOR GUERNSEY
38
2.6 Visualisation
In order to provide stakeholders with a better understanding of what the potential site could look like, a simulation was created using the Plymouth University‟s TRANSAS NTPRO 5000 navigation simulator. In order to design the site, the array spacing had to be established for both the 3.6MW and 6MW turbines. A schematic of the image can be seen in Figure 18.
Figure 18 : Schematic of the 10 x 3.6MW array (top) and 4 x 6MW array (bottom)

OFFSHORE RENEWABLE ENERGY FOR GUERNSEY
39
Once the array spacing had been specified, a wind turbine design was loaded onto TRANSAS based on the specifications in Figure 19. These specifications correspond directly to the design requirements for the 3.6MW turbines. The model turbines were then spaced according to the 10 turbine array design (Figure 18) and screenshots were taken from distances of 1nm, 3nm and 6nm at a height of 2 metres above sea level, as shown in Figure 20.
Figure 19. Wind turbine model specifications as utilised for the visualisation created using TRANSAS
The same model turbines were then used in the creation of the 6MW array visualisation. In order to provide an accurate representation of the height of the 184m high turbines, the turbines were brought closer to the viewer. In order to calculate the distance, trigonometry was used to provide a visual perception that the maximum blade tip heights correspond to. The 4 turbines were then spaced accordingly (Figure 18) and screenshots were taken at distances of 1nm, 3nm, and 6nm, as shown in Figure 21.

OFFSHORE RENEWABLE ENERGY FOR GUERNSEY
40
Figure 20 : 10 x 3.6MW Siemen s Turbines

OFFSHORE RENEWABLE ENERGY FOR GUERNSEY
41
Figure 21 : 4 x 6MW Siemens turbines

OFFSHORE RENEWABLE ENERGY FOR GUERNSEY
42
2.7 Installation
The installation of off-shore wind turbine devices relies on the knowledge of seabed conditions and seabed depth to be able to understand what foundation structures and drilling equipment are required for the deployment in the selected area. The process then requires the definition of suitable port facilities to be used in proximity to the manufacturing firms and the identifiction of suitable vessels to carry out the process. Various installation processes and vessels were investigated for the production of a detailed plan of deployment. The information characterising each different process in relation to the conditions of the sea-bed were taken into account to be able to select the most suitable solution for the planning of the installation process in Guernsey. This section of the report presents the installation, operation and maintenance processes required for deploying four Siemens 6.0 MW turbines off the shores of Guernsey. The study carried out provides an evaluation of the different options available and recommendations have been given along with validations for the choices. The vessels required have been discussed and the ports to be used have been justified. A time assessment was also carried out to give an indication of the length of time required to install the 4 turbines. 2.7.1 Installation Processes Review
The installation process is worth a considerable part of the whole cost of an offshore wind farm (BVG Associates, 2010) so there must be great care taken in order to optimize installation methods for a given project. In general the choice of the installation methods depends upon several characteristics that are particular for each project. The main ones are the water depth of the site, the type and thickness of the sediment on the seabed, and the physical characteristics of the site like current speed and wave climate. Other important features include the distance from the base port, availability of specialised vessels. (Kaiser & Snyder, 2010). In the following subsection a review for each stage of the installation process is given. In our report it is supposed that the foundation is installed separately from the actual turbine. The opposite case is in principal possible but not broadly used (Herman S.A., 2002). However, before starting to introduce the installation process it is necessary to explain some of the concepts of foundations and also some of the most used installation vessels. 2.7.2 Foundations Review
The foundation is the first object to be installed offshore. It consists of a structure capable of transferring both axial load and the overturning moment of the device from the turbine to the seabed. The most common structures used include steel monopiles, steel lattice structures (like jackets or tripods) and concrete gravity foundations. In this report floating turbines are not considered. The reasons for choosing a particular type of foundation depend upon water depth, maximum wind speed, wave height, water current speed, the type of seabed, and the size and the weight of the turbine (Kaiser & Snyder, 2010). Sections 2.7.3 and 2.7.4 describe the main futures of monopile and lattice structures. The gravity foundation method is not detailed because of its limited use in both current and future projects (BVG Associates, 2012).

OFFSHORE RENEWABLE ENERGY FOR GUERNSEY
43
2.7.3 Monopile Review
Monopiles are large diameter, thick walled steel tubes that are driven directly into the seabed. The diameter of the monopile range usually from 4 to 6 m and 40 to 50% of the total length of the monopile inserted into the seabed (Kaiser & Snyder, 2010). These characteristics depend mainly on the water depth and sediment conditions, but also on the environmental conditions (wave height, water current and wind speed). The monopile also requires a transition piece before the installation of the actual turbine is possible, as seen in Figure 23. The transition piece creates a level platform for the correct installation of the wind turbine tower.
Figure 23 : Components of a monopile foundation (source Garrad Hassan)Installation of a transition piece (source
Vattenfall)
Monopiles are the most commonly used type of foundation for offshore wind turbines, with 80% of currently installed turbines having a monopole, while it is expected that 50-60% of proposed wind farms will also use this type of foundation (Bluewater Wind, 2010). Monopiles are competitively priced for shallower water and for smaller turbine sizes. They are the best choice for installation in waters up to 20m deep (Kaiser & Snyder, 2010) but became less suitable as the depth increases. For instance, an example weight of a monopile for a 5MW turbine in 20 meters of water is 600tons, which is similar to the weight of a jacket foundation. In 30 meters the jacket would have to be 800tons while the monopile would be of much higher mass (BVG Associates, 2010). 2.7.4 Tripod or Jacket Assessment
Tripods consist of a tubular steel piece connected to three pile sleeves through smaller diagonal braces as in Figure 24. The attachment with the seabed is provided by driving piles into these sleeves. The piles are significantly smaller in diameter and length than the monopile and they are coupled to the structure with concrete or grouting (LORC, 2012). The tripod design is more robust than monopile and therefore more useful in deeper water (above 25 meters) (Kaiser & Snyder, 2010). However the additional cost in building a tripod means this solution is less common. The Alpha Ventus project is the only operating wind farm that has six turbines using this kind of foundation (OWEC, 2013).
Figure 22 : Components of a monopile foundation (source Garrad Hassan)

OFFSHORE RENEWABLE ENERGY FOR GUERNSEY
44
Figure 24 : Components of a Tripod foundation (source Gerrad Hassan)
Jackets are open lattice steel trusses, consisting of welded tubular members that rise from the seabed to above the surface. Piling is driven through the each leg or through pile sleeves welded to the structure. Jackets are heavy and complex structures but became competitive with other foundation in water deeper than 25m, and they are the only choice for waters below 40m. Theoretically, jackets can be used in very deep water, in oil platforms for instance jackets were used in waters up to 400m deep, but economic reasons may limit their deployment to water depths less than 100m (Kaiser & Snyder, 2010). The use of jackets in shallower water is expensive and currently there are few turbines installed using this type of foundation. Among these however are two of the deepest developments, Beatrice (45 meters) and Alpha Ventus (30 meters, only six turbines) supporting large 5 MW turbines. It is a common feeling that in the next round of offshore wind projects the number of installed jackets will increase significantly, and it is likely to become the most used type of foundation (BVG Associates, 2012).
Figure 25 : Components of a jacket foundation (source Garrad Hassan)

OFFSHORE RENEWABLE ENERGY FOR GUERNSEY
45
It is important to highlight that in tripods and jackets there is no need to install a transition piece before the installation of the turbine. This feature reduces the number of operations required offshore. 2.7.5 Installation Vessels Review
The installation of an offshore wind turbine requires specialist equipment and vessels. With regards to the vessels used, they can be either built or adapted to meet the requirements of the wind industry, but they can be also a general offshore installation ship, in other words a multi-purpose vessel (MPV). The most used MPV‟s are:
Jack-up barges (Figure 26): these can easily operate in rough sea conditions thanks to their legs. This vessel requires a tug to move so is not the best choice in transiting process (see Section 2.7.6);
Jack-up vessels (Figure 27): as they are self-propelled these are one of the most used types of vessel (Fraunhofer, 2011). Because of their multi-purpose design they are often limited in operability by water depth and their crane capabilities.
Figure 26 :Jack-Up Barge installs Germany‟s first offshore wind turbine (source MarineLog)
Figure 27 :The self propelled Jack-up “Seajacks Zaratan” in the Gunfleet Sands farm, 2012, (source Seajacks)
Crane ships (Figure 28): these have large sheerleg or pedestal-mounted cranes that allow them to install large structures. On the other hand they are usually limited in deck space and have lower cruise speeds than other vessels. They are also typically unable to work in conditions with significant wave height over 0.75 m (BVG Associates, 2012);

OFFSHORE RENEWABLE ENERGY FOR GUERNSEY
46
Semi-submersible vessels: these have good stability, good crane capacity and often good deck space. However they are significantly more expensive than other solutions (Fraunhofer, 2011).
Figure 28 : Installation of jacket and 5mw wind turbine generator at the Beatrice Offshore Windfarm (source SCALDIS SMC)
The performance limitations of MPV‟s have led the wind industry to develop its own Wind farm Installation Vessel (WIV) vessel class. There is only one WIV active today but 18 more are on schedule to be deployed by 2014 (Fraunhofer, 2011) (Figure 29). The general concepts of WIVs according to the classification society Germanischer Lloyds (Fraunhofer, 2011) are:
The ability to operate in 50 m of water;
Self-propulsion;
The ability to jack up the platform 10 to 15 m above sea level;
Deck space to carry 900 to 1,000 t foundations;
The ability to drive foundations piles into the seabed;
The ability to transport a 90 m wind turbine tower;
On-board crane to install the tower on its foundations and lift the nacelle (400 to 500 t) 110 m high;
Deck space for preparatory work on large components;
Accommodation for construction and ship crew;
Dynamic positioning (DP) system.
Figure 29 : A2SEA Sea installer. (source MarineLog)
In the long-term the trend in installation vessels is expected to lean towards floating vessels that are capable of working in deeper water and have the possibility to install fully assembled

OFFSHORE RENEWABLE ENERGY FOR GUERNSEY
47
turbines (W3G or A2SEA-TEEKAY concept) (Figure 30). The expected delivery time for these types of vessels is 2014 onwards (TEEKAY, 2011).
Figure 30 : Vessel displaying fully-assembled installation capabaility (source W3G Marine)
2.7.6 Foundations installation
The first consideration necessary in choosing an installation strategy involves the type and number of installation vessels needed. In particular the vessels can be used in three manners: feeding, direct transiting and indirect transiting (Fraunhofer, 2011) (Figure 31). In the feeding process a feeder vessel or a barge and tug transport foundations from the manufacturing port to the wind farm area, where the items are transferred to the installation vessels. In this process the utilization time of the costly installation vessel is optimized. On the other hand the time for transferring the pieces offshore might be the 20% more than the same operation on port (Fraunhofer, 2011), and for assuring a constant flow of items more than 1 feeder vessel is required. In the transiting process the foundations are loaded directly onto the installation vessel in the manufacturing port (direct transitioning). If the manufacturing port is too far from the wind farm site, the items to be installed can be transferred to a local port by transport vessels (indirect transiting). BVG Associates states that transiting has been the dominant strategy used for wind farm projects (Fraunhofer, 2011).
Figure 31 : Respectively a feeder, direct transit and indirect transit methods. (source Fraunhofer, 2011)
In this section a transiting method is considered to describe typical installation options for the two types of foundations 2.7.7 Tripod or Jacket Installation
In relation to the specifications of the deployment site, Tripod and Jacket foundations have been identified as the only potential solutions. Depths of the location are in fact limiting to the use of monopiles foundations. In regards to the installation process, the vessel loads the jackets (or tripod) in the designated port. An average jacket to be installed in 40 meters depth could weigh about 650 tons so a jack-up barge like the SeaJack (presented above) can transport 2-3 jackets for each trip. A purpose designed vessel like the W3G‟s OWTIS can transport up to 6 jacked for each trip (Figure 32).

OFFSHORE RENEWABLE ENERGY FOR GUERNSEY
48
Figure 32 : Offshore Wind Turbine Installation Ship (OWTIS). (source W3G Marine)
The structure is secured to the seabed with the installation of 4 (or 3 for tripod) piles. These piles can be driven before the installation of the jacket with a cheaper vessel and a special template (pre-piling, Figure 33).
Figure 33 :The pre-piling phases. (source LORC)
When the jacket reaches the right position the piles are grouted inside the sleeves. In this case there is no need to install a separate transition piece and scour protection is also less important (Kaiser & Snyder, 2010). 2.7.8 Turbine Installation
There are several options for installing a wind turbine (Kaiser & Snyder, 2010) depending on how many operations are required offshore. The turbine typically can be divided into a tower (one or more pieces), nacelle, hub and three blades. A diagram of different installation methods is reported in Figure 34.

OFFSHORE RENEWABLE ENERGY FOR GUERNSEY
49
Figure 34 : Different methods with the number of lift to be done offshore. (source Kaiser, & Snyder, 2010)
The main reason for choosing the first two methods is that these configurations optimize the use of the vessel deck, meaning these methods are useful when the site is considerably far from the operational port. However these methods require many lifts to be done offshore, and in particular the blade installation is very susceptible to weather conditions. The third method does not require a separate blade installation but it is more difficult to transport the components. The fourth and fifth methods use the bunny ear configuration of the rotor, which allow for easy transport of more than one rotor for each time without increasing the number of lifts. In this case there is only the need to install one blade offshore. The last method consists of installing the fully mounted turbine on the foundation. It minimizes the number of dangerous lifts needed but requires bigger vessels. The one-lift approach has not been employed at any large scale project, but is likely to be used more often in the future (Kaiser & Snyder, 2010). Usually where more than one lift is required for the installation it will be performed by the same vessel in the same position. It can be also possible to employ more than one vessel that consequently performs the various phases as in Horns Rev 1 (Kaiser & Snyder, 2010). 2.7.9 Cable installation
Typically the cable is laid and buried in the same operation. There are several methods but the most commonly used is to employ a plough pulled directly by the cable-laying vessel (Kaiser & Snyder, 2010). The plough buries the cable fed by the vessel in a 2m deep trench made using high-pressure water jet. Two important phases of the cable laying operation are the shore approach and the turbine inlet. The first is done generally pulling the cable from the shore through a pre-drilled horizontal hole. The latter is done pulling the cable with a winch inside the turbine through a J-tube mounted on the substructure (Kaiser & Snyder, 2010).

OFFSHORE RENEWABLE ENERGY FOR GUERNSEY
50
2.7.10 Wind Turbine port options:
In order to construct the planned array, substantial port facilities will be required to accommodate large vessels and materials. There is also a need for storage areas for both machinery and parts that require a heavy lifting plant. There are two key issues that should be considered when embarking on a MRE project such as this, which include: Assembly: Consists of the pre-assembly of the components and the moving of deployment ready parts onto vessels. Operations & Maintenance: Includes the deployment of CTV‟s (Crew Transfer Vessels) and MPV‟s (Multi-purpose vessels) for servicing wind arrays for either planned or unplanned events (Bard J, 2012).
2.7.10.1 Development of Ports and storage facilities on Guernsey:
There are two ports on the island of Guernsey; St. Peters port and St Sampson's Harbour. The main port serving the island is St. Peters port, which accommodates the ferries that travel to the UK, France and other islands. Aside from this there are also large number of small pleasure craft and fishing vessels. Saint Sampson‟s Harbour on the north of the island is smaller and does not have ferry traffic. However, both ports are surrounded by densely inhabited spots on the island and there is little storage space or room for manoeuvring large scale equipment. Both harbours are susceptible to large tidal ranges and the room for large vessels would be restrained.
2.7.10.2 Features of the wind port options:
Three of the most feasible external port options to Guernsey have been chosen for study (see Figure 35 for location details):
Cherbourg: The port of Cherbourg has experience with handling wind turbine parts and large-scale heavy metal goods, which would be crucial with the loading and unloading of the parts. The port also has nearby storage areas that have access to road and rail links. The port is also looking to expand and develop for renewable energy use. (Offshore Wind b, 2012);
Southampton: This is one of the most important and largest ports in the UK. Southampton has experience with wind energy component handling and installation with the „Solent and Isle of Wight array‟. The British government are planning on investing large amounts into the port to develop it as a renewable energy hub (ABP a, 2013);
Plymouth: The Devonport dockyards are a vast array of naval maintenance and production plants. It has good connections by rail and road. However, this is reserved for naval use and large commercial endeavours. The Port of Plymouth itself is small and houses a ferry terminal with limited space and is surrounded by the city. An arrangement could be made to utilize the Devonport area but this would require further planning. The entrance to Plymouth port is narrow and the main shipping channel is narrow and does not hold much room for manoeuvrability (ABP b, 2013).

OFFSHORE RENEWABLE ENERGY FOR GUERNSEY
51
Figure 35 : Locations of external port
2.7.10.3 Major assembly and installation non-Guernsey based wind ports:
The decision to choose one of the three ports outside of Guernsey to handle the large equipment and vessels required for installation was done using an evaluation matrix. The reason for choosing a port not based on the island itself is to reduce the impact on the relatively small port capacity and local infrastructure of Guernsey. The matrix was based upon several criteria to filter the choices to find the ideal option. Each of the criteria was assigned a score that was relevant to its importance. A description of the evaluation matrix results and data collection can be seen in Appendix A.
Table 10 : Evaluation matrix of offshore wind ports
As can be seen above Cherbourg was the most viable option. There were severe constraints on Plymouth due to the option of using Devonport is uncertain. Southampton followed closely in the scoring and lost to Cherbourg on the distance to the site, which was deemed highly important as installation time would be reduced and weather constraints would not be as impacted. The manoeuvrability and constraints in Cherbourg were also seen as more favourable than Southampton. Over the last few years Cherbourg has been handling the components for offshore wind turbines and has the necessary equipment to do this, however it is not carried out on a large scale (PORT de CHERBOURG SAS, 2012). The PNA wants to establish a major port in the marine renewable sector. It is set to be used by energy companies EDF and Alstom who have won a contract to install 240 wind turbines in the channel and the west coast of France. The result of this will be a €40m investment from the PNA into the port‟s facilities and its eastern Quai des Flam (Offshore Wind b, 2012).
Ports located outside of Guernsey Plymouth Cherbourg Southampton
Distance to manufacturer 2 4 5
Distance to proposed wind array 3 5 2
Port Size 2 3 5
Access to Port 3 5 4
Capacity for large vessels 2 4 4
Vessel accommodation 2 3 4
Manoeuvrability/Constraints 2 5 3
Heavy Goods handling 3 5 5
Total 19 34 32
Plymouth
Southampton
Cherbourg

OFFSHORE RENEWABLE ENERGY FOR GUERNSEY
52
The ports itself is split into the east and western ports of Cherbourg. The western portion is dominated by several quays and berths for ferries and cruise liners. The east side has two usable quays which can be seen in Figure 36 and 42.
Figure 36 : Quay Des Flamands (PNA, 2012) Figure 37 : Quay Des Mielles (PNA, 2012)
As seen in in Figure 36 and 42 there are large areas behind both quays that could be utilized for component storage. The Larger and deeper Quay Des Flamands also has heavy goods cranes which could be used for equipment handling. The port has the capability to carry out unique maintenance, modifications and repairs on large scale vessels with the use of ship elevators and dry-docks. The ship elevator is adapted for barges and catamarans, which can be considered ideal for the vessels being used in the installation processes, being able to handle up to 4500tonnes and accommodate approximately vessels 32m wide (beam width) and 90m long.
2.7.11 Proposed process
In this section an installation process for 4 Siemens 6MW is presented. The average water depth of the site is over the 30 meter mark in low tide so a jacket foundation is chosen. The distance between the site and the operational port is about 30 nautical miles so the installation vessel can transport the items to be installed. The vessel chosen for the installation of the foundation could be either a self-propelled jack-up vessel or a crane vessel. The option of using different types of vessel can give much more flexibility in relation to vessel availability. The use of the main installation vessel is optimized with the pre-piling technique. A cheaper vessel could be used during the piling phase. In the timing assessment section two scenarios are reported: one using an MPV and another with a purpose built vessel (OWTIS). The same two scenarios are reported for the turbine installation; in the first one the chosen option is to install the tower, the nacelle and the three blades separately (option n°2). In the OWTIS scenario the best option is to install the turbine full mounted (option n°6). The cable will be loaded onto the turntable of the cable-laying vessel in the manufacturing port. It is transported to a position near the landing shore and then pulled through a directional-drilled hole from the shore. The cable is buried along the specified route. At the site an underwater substation is deployed with the two pieces of inner array cable connected. The inner array pieces are deployed from another vessel the same characteristics as the first. The cable pieces are loaded together and transported during the same trip. Each piece is deployed and pulled inside the turbine tower. These cables can be buried with a remote operated vehicle (ROV) in a separate operation. 2.7.12 Timing assessment (engineering approach)
The engineering approach allows for the creation of a timing assessment tailored to the specific project. In this approach all the main phases of the installation process are divided into sub processes, and the results are then assessed. The definition of the timing and equipment requirement identifies figures for the foundations selected, the drilling equipment to be used, service vessels and assesses the time requirement for the transportation phase, drilling and installation of the foundations and turbine. The data has been based on the guidelines provided

OFFSHORE RENEWABLE ENERGY FOR GUERNSEY
53
by industrial standards in relation to the proposed deployment scheme. Values have been tailored to the specific conditions of the deployment site off the shores of Guernsey.
2.7.12.1 Foundations and operational data
Table 11 details the type of foundations selected,
Table 11: Foundation Details
The piling operation could be achieved using a hydraulic hammer with the characteristics given in Table 12
Table 12: Hydraulic Hammer Charecteristics
HYDRAULIC HAMMER CHARACTERISTICS
Blow per minute 40 blow/min
Rated striking energy 24 kNm
Weight 4 t
The service vessel selected is a smaller vessel with the minimum characteristics given in Table 13
Table 13: Service Vessel Charecteristics
SERVICE VESSEL
Type Lifeboat
Cruise speed 12 kn
Deck length 35 m
Deck width 15 m
Deck space 525 m^2
Deck load 110 t
Main crane 50 t
The operational input data for the piling phase is given in Table 14.
Table 14: Foundation Operational Data
FOUNDATION OPERATIONAL DATA SOURCE
Time for berthing the vessel 2 h Estimate
Time for loading a pile 1 h Estimate
Time for loading the template
2 h Estimate
Time for positioning 2 h (Kaiser & Snyder, 2010)
Time for laying the template 2 h Estimate
Time for preparing the pile 2 h (Kaiser & Snyder, 2010)
Driving speed 0.15 m/min
(Kaiser & Snyder, 2010)
Weather disruption 75% Estimate
FOUNDATION
Type of foundation Jacket
Height 60 m
Max width 20 m
Weight 600 t
N° of piles 4
DxtxL of pile 0.760mx0.03mx30m
Weight of single pile
16 t
Weight of template 43 t

OFFSHORE RENEWABLE ENERGY FOR GUERNSEY
54
2.7.12.2 Time estimated for the deployment of the foundations
The output data for the installation of the foundation phase is given in Table 15.
Table 15: Calculated Data (Pre-piling Phase)
CALCULATED DATA (PRE-PILING PHASE)
Number of pile transported for each trip 4
Time spent on port for each trip 8 h
Time for trip go to and return from the site 5 h
Time for deploying piles and template (with 2 positioning)
26 h
Total time considering weather disruption 22 days
2.7.12.3 Turbine installation process
Table 16 details the characteristics of the proposed turbines.
Table 16: Turbine Charecteristics
TURBINE
Tower height 75 m
Hub height 100 m
Tower weight 200 t
Nacelle weight 125 t
Rotor weight 100 t
Note: The installation process for the wind turbines follow two distinct scenarios based on the research carried out and presented previously
2.7.12.4 Scenario 1
The characteristics of the main installation vessel are given below (A2SEA, 2012).
Table 17: Installation Vessel Charecteristics
MAIN VESSEL CHARACTERISTICS
Category Multi-purpose vessels
Type Self-propelled jack-up vessel
Service speed 12 kn
Deck length 88 m
Deck breadth 38 m
Free deck space 3350 m^2
Total net deck load
5000 t
Max water depth 45 m
Main crane 800 t
Table 18 gives the operational input data for the main installation phases.
Table 18: Operational Input Data
JACKET INSTALLATION OPERATIONAL DATA
SOURCE
Time for berthing the vessel 5h Estimate
Time for loading Jacket 4 h Estimate
Time for positioning 4h (Kaiser & Snyder, 2010)
Time for laying the jacket 6 h (Kaiser & Snyder, 2010)
Time for levelling and grouting 10 h (Kaiser & Snyder, 2010)
Weather disruption 85% Estimate (more stable vessel)
TURBINE INSTALLATION OPERATIONAL DATA
Time for berthing the vessel 5h Estimate
Time for loading the tower 3 h (Kaiser & Snyder, 2010)

OFFSHORE RENEWABLE ENERGY FOR GUERNSEY
55
Table 19 gives the calculated timings for scenario 1
Table 19: Calculated Data (Scenario 1)
CALCULATED DATA (INSTALLATION-SCENARIO 1)
JACKET
Number of jackets transported for each trip 4
Time spent on port for each trip 21 h
Time for trip go to and return from the site 5 h
Time for deploying the jackets transported 80 h
Total time considering weather disruption 13 days
Time for each jacket 1.3 days
TURBINE
Number of turbines transported for each trip 5
Time spent on port for each trip 60 h
Time for trip go to and return from the site 5 h
Time for deploying the turbines transported 240 h
Total time considering weather disruption 20 days
Time for each turbine 2 days
2.7.12.5 Scenario 2
In this scenario a different installation vessel is used. Its characteristics are given in Table 20 (W3G, 2012).
Table 20: Installation Vessel Charecteristics
MAIN VESSEL CHARACTERISTICS
Category Wind Installation Vessel (WIV)
Type Floating crane vessel
Service speed 14 kn
Deck length 118 m
Deck breadth 38 m
Free deck space 4500 m^2
Total net deck load
6800 t
Max water depth + 100 m
Main crane 1500 t
Time for loading the nacelle 2 h (Kaiser & Snyder, 2010)
Time for loading the blade 2 h (Kaiser & Snyder, 2010)
Time for positioning 4h (Kaiser & Snyder, 2010)
Time for mounting the tower 12 h (Kaiser & Snyder, 2010)
Time for mounting the tower 12 h (Kaiser & Snyder, 2010)
Time for mounting the tower 10 h (Kaiser & Snyder, 2010)
Weather disruption 75% Estimate (more delicate operation)

OFFSHORE RENEWABLE ENERGY FOR GUERNSEY
56
Table 21 gives the operational input data for scenario 2.
Table 21: Operational Input Data
Table 22 gives the calculated timings for scenario 2.
Table 22: Calculated Data (Scenario 2)
2.7.12.6 Cable installation
The main characteristics of the cables to be installed are given in Table 23.
Table 23: Cable Characteristics
CABLE CHARACTERISTICS
Export cable length 18 km
Export cable weight 620 t
Number of Inner array pieces 10
Length of each inner array piece (min, max)
Min 600 m(8), max 1200 m(10)
Total inner array length 7.2 km
Weight of each inner array piece (min, max)
Min 20,5 t, max 41 t
Total inner array weight 247 t
JACKET INSTALLATION OPERATIONAL DATA
SOURCE
Time for berthing the vessel 5h Estimate
Time for loading Jacket 4 h Estimate
Time for positioning 2h (Kaiser & Snyder, 2010)
Time for laying the jacket 6 h (Kaiser & Snyder, 2010)
Time for levelling and grouting 10 h (Kaiser & Snyder, 2010)
Weather disruption 75% Estimate
TURBINE INSTALLATION OPERATIONAL DATA
Time for berthing the vessel 5h Estimate
Time for loading the full mounted turbine
10 h Estimate
Time for positioning 2h (Kaiser & Snyder, 2010)
Time for mounting the turbine 12 h (Kaiser & Snyder, 2010)
Weather disruption 75% Estimate (more delicate operation)
CALCULATED DATA (INSTALLATION-SCENARIO 2)
JACKET
Number of jackets transported for each trip 5
Time spent on port for each trip 20 h
Time for trip go to and return from the site 5 h
Time for deploying the jackets transported 90 h
Total time considering weather disruption 13 days
Time for each jacket 1.3 days
Time gained respect to scenario 1 0%
TURBINE
Number of turbines transported for each trip 4
Time spent on port for each trip 45 h
Time for trip go to and return from the site 5 h
Time for deploying the turbines transported 56 h
Total time considering weather disruption 15 days
Time for each turbine 1.5 days
Time gained respect to scenario 1 25%
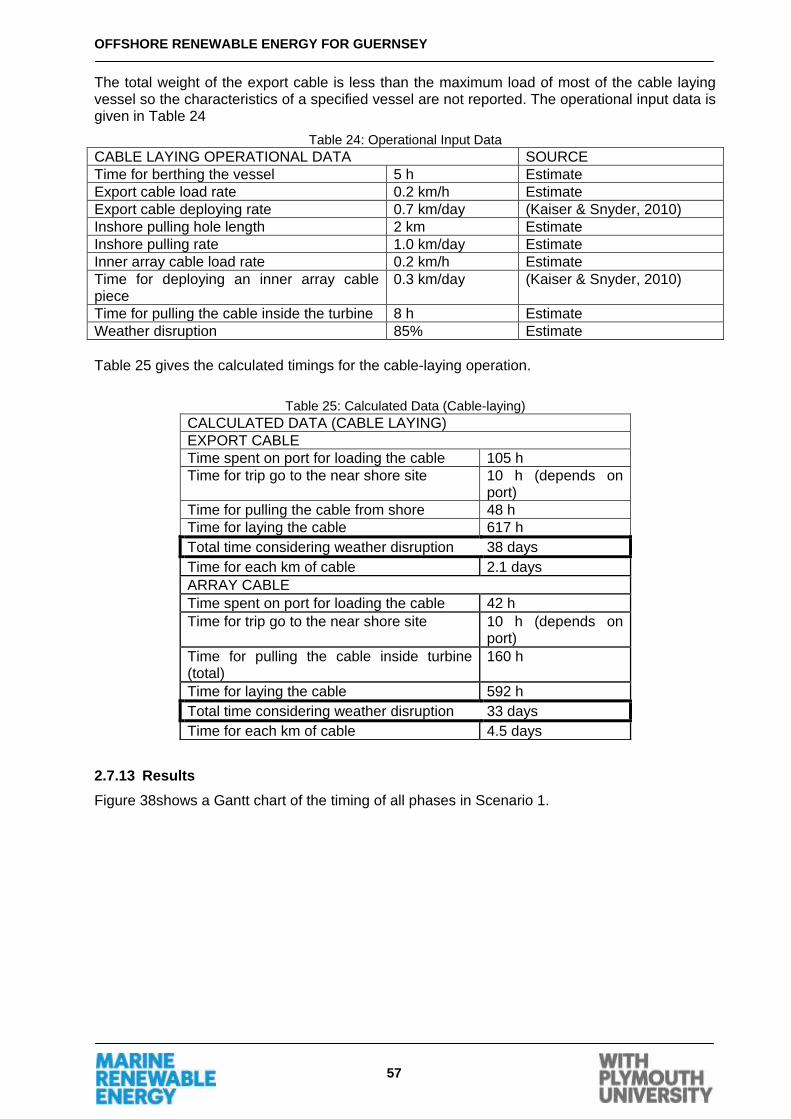
OFFSHORE RENEWABLE ENERGY FOR GUERNSEY
57
The total weight of the export cable is less than the maximum load of most of the cable laying vessel so the characteristics of a specified vessel are not reported. The operational input data is given in Table 24
Table 24: Operational Input Data
CABLE LAYING OPERATIONAL DATA SOURCE
Time for berthing the vessel 5 h Estimate
Export cable load rate 0.2 km/h Estimate
Export cable deploying rate 0.7 km/day (Kaiser & Snyder, 2010)
Inshore pulling hole length 2 km Estimate
Inshore pulling rate 1.0 km/day Estimate
Inner array cable load rate 0.2 km/h Estimate
Time for deploying an inner array cable piece
0.3 km/day (Kaiser & Snyder, 2010)
Time for pulling the cable inside the turbine 8 h Estimate
Weather disruption 85% Estimate
Table 25 gives the calculated timings for the cable-laying operation.
Table 25: Calculated Data (Cable-laying)
2.7.13 Results
Figure 38shows a Gantt chart of the timing of all phases in Scenario 1.
CALCULATED DATA (CABLE LAYING)
EXPORT CABLE
Time spent on port for loading the cable 105 h
Time for trip go to the near shore site 10 h (depends on port)
Time for pulling the cable from shore 48 h
Time for laying the cable 617 h
Total time considering weather disruption 38 days
Time for each km of cable 2.1 days
ARRAY CABLE
Time spent on port for loading the cable 42 h
Time for trip go to the near shore site 10 h (depends on port)
Time for pulling the cable inside turbine (total)
160 h
Time for laying the cable 592 h
Total time considering weather disruption 33 days
Time for each km of cable 4.5 days

OFFSHORE RENEWABLE ENERGY FOR GUERNSEY
58
Figure 38 : Gantt chart for scenario 1
Figure 39 provides a Gantt chart for Scenario 2.
Figure 39 : Gantt chart for scenario 2
2.7.14 Recommendations
Figure 38 and 39 show the predicted time requirement of the whole installation process following the specifications of scenario 1 and 2. Despite the different equipment and vessels adopted for process, both scenarios have an estimated lead time of 2 months. The definition of the most suitable scenario will be reflected availability of the proposed vessels and the suitability of either of the processes in regards to Guernsey‟s plans.
0 10 20 30 40 50 60 70
Pre-piling
Foundation Installation
Turbine Installation
Export Cable laying
Inner array cable laying
Days
0 10 20 30 40 50 60 70
Pre-piling
Foundation Installation
Turbine Installation
Export Cable laying
Inner array cable laying
Days

OFFSHORE RENEWABLE ENERGY FOR GUERNSEY
59
To optimise timings, the foundation installation begins before the pre-piling is fully complete. Cable laying starts as soon as possible while the inner array cable laying starts when at least two turbines are installed. Turbine installation is not a critical operation in the overall project so the performance of the OWTIS in this phase will not greatly affect the final result.

OFFSHORE RENEWABLE ENERGY FOR GUERNSEY
60
2.8 Maintenance:
Maintenance of an offshore structure exposed to the elements is crucial in order to ensure that the device operates at it‟s peak. According to EU offshore wind (ORECCA - Off-shore Renewable Energy Conversion Platforms Coordination Action) (Bard J, 2012)) guidelines the servicing of one turbine would be carried out by a team of 5 technicians. It was calculated by manufacturers that 6 to 7 technical malfunctions per turbine per year could be solved in 1 day or less. All wind turbines will be inspected at least once a year and this will entail a detailed survey and operating supply components will be replaced. All of the foundation structure and base off the turbine will need to be inspected every year and 50% of the cabling will undergo inspections once a year. Maintenance will be carried out with the variety of trained personnel and highly specific equipment. ROVS (Remotely operated vehicles) and divers will be necessary for subsea maintenance operations. It will be highly important to have a trained crew on standby in order to respond to faults quickly. This requires a network of vessels and equipment. The majority of large-scale projects have dedicated crews, for example the E.ON Robin Rigg array has 30 staff including boat handlers and crew, engineers and technicians. However, due to the small scale of the Guresey project it would be costly to keep such staff on hand. Therefore a centralised maintenance centre that could operate for multiple arrays in the area is an option that should be considered (BVG associates, 2012). 2.8.1 Device Maintenance aspects:
The SWT-6.0-154 device is an exceptionally large device; the turbine hub sits 105m high and the blade diameter is 154m. In order carry out major maintenance operations such as blade replacement, the use of large-scale crane or jack up barges to remove and replace the blades will be required. The issue with requiring such large equipment to carry out operations is that these vessels are expensive and take time to get to the site location. Highly skilled crew will also be required for operations in circumstances including high winds, foul weather and extreme heights. 2.8.2 Maintenance issues in relation to port location:
Maintenance will routinely be required on any structure placed in the harsh environment of the open sea. Devices exposed in this situation will require parts being replaced and tending by maintenance crews. Ports of operations located too far from the array will incur certain issues including:
Higher Costs due to logistics of man power and vessels;
Increased lengths of down time when turbines are not operational resulting in other issues such as power shortage;
A higher risk to weather disrupting maintenance due to long travel times (Garrad Hassan, 2008).
2.8.3 Maintenance ports:
In order to minimise the down times of the devices, the importance of a trained and dedicated maintenance crew cannot be understated. The location of a maintenance port will therefore play a critical role. The use of local Guernsey based tug crews and vessels could be utilized for certain activities such as the towing and manoeuvring of larger vessels. Smaller local support vessels could be used from ports in Guernsey for offshore wind turbines in order to transport maintenance crews quickly. With the high number of small vessels around Guernsey the use of local fishing crews could potentially become an option, though further investigation of this possibility is required.
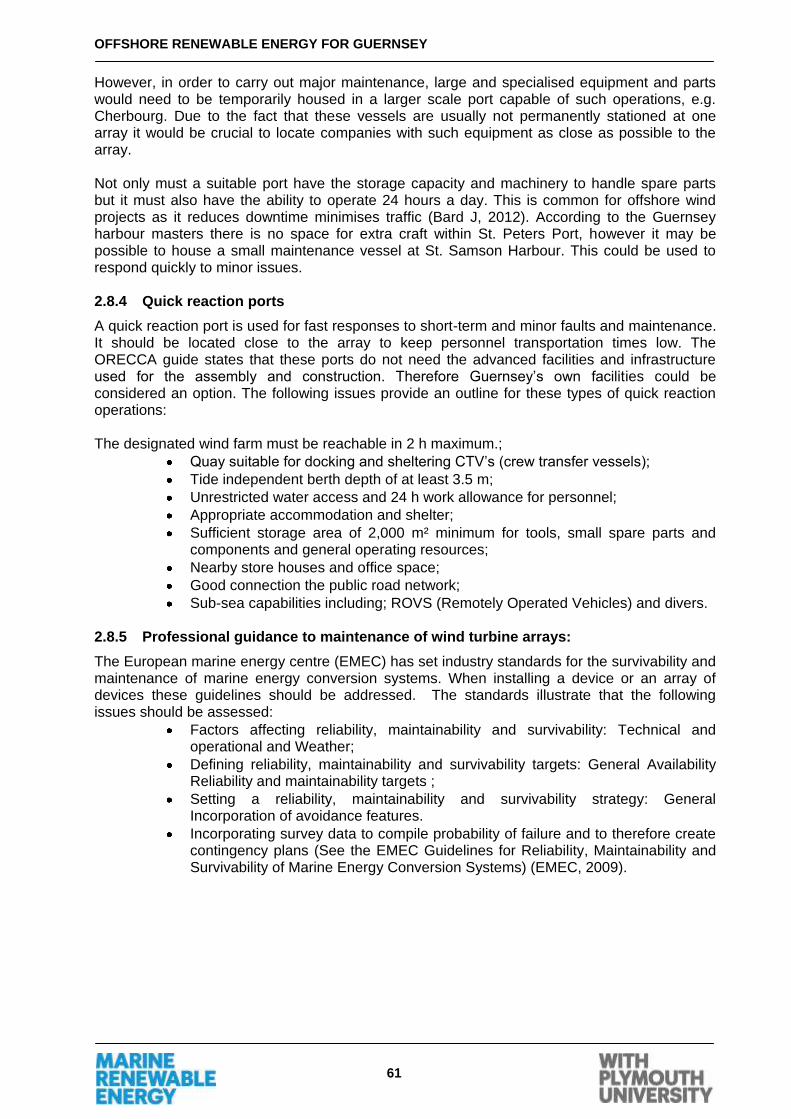
OFFSHORE RENEWABLE ENERGY FOR GUERNSEY
61
However, in order to carry out major maintenance, large and specialised equipment and parts would need to be temporarily housed in a larger scale port capable of such operations, e.g. Cherbourg. Due to the fact that these vessels are usually not permanently stationed at one array it would be crucial to locate companies with such equipment as close as possible to the array. Not only must a suitable port have the storage capacity and machinery to handle spare parts but it must also have the ability to operate 24 hours a day. This is common for offshore wind projects as it reduces downtime minimises traffic (Bard J, 2012). According to the Guernsey harbour masters there is no space for extra craft within St. Peters Port, however it may be possible to house a small maintenance vessel at St. Samson Harbour. This could be used to respond quickly to minor issues. 2.8.4 Quick reaction ports
A quick reaction port is used for fast responses to short-term and minor faults and maintenance. It should be located close to the array to keep personnel transportation times low. The ORECCA guide states that these ports do not need the advanced facilities and infrastructure used for the assembly and construction. Therefore Guernsey‟s own facilities could be considered an option. The following issues provide an outline for these types of quick reaction operations: The designated wind farm must be reachable in 2 h maximum.;
Quay suitable for docking and sheltering CTV‟s (crew transfer vessels);
Tide independent berth depth of at least 3.5 m;
Unrestricted water access and 24 h work allowance for personnel;
Appropriate accommodation and shelter;
Sufficient storage area of 2,000 m² minimum for tools, small spare parts and components and general operating resources;
Nearby store houses and office space;
Good connection the public road network;
Sub-sea capabilities including; ROVS (Remotely Operated Vehicles) and divers. 2.8.5 Professional guidance to maintenance of wind turbine arrays:
The European marine energy centre (EMEC) has set industry standards for the survivability and maintenance of marine energy conversion systems. When installing a device or an array of devices these guidelines should be addressed. The standards illustrate that the following issues should be assessed:
Factors affecting reliability, maintainability and survivability: Technical and operational and Weather;
Defining reliability, maintainability and survivability targets: General Availability Reliability and maintainability targets ;
Setting a reliability, maintainability and survivability strategy: General Incorporation of avoidance features.
Incorporating survey data to compile probability of failure and to therefore create contingency plans (See the EMEC Guidelines for Reliability, Maintainability and Survivability of Marine Energy Conversion Systems) (EMEC, 2009).

OFFSHORE RENEWABLE ENERGY FOR GUERNSEY
62
2.9 Grid Connection
The proposed wind turbine array consists of four Siemens SWT-6.0-154 6MW wind turbines. The capabilities of these turbines individually and in an array of four are outlined in Table 26 below.
Table 26: Turbine and Array Output Capacities (Siemens)
Output Single Turbine Four Turbine Array
Maximum Power 6MW 24MW
Predicted Yearly 25GWh 100GWh
Terminal Voltage 690V N/A
As can be seen from Table 26Table 26, the voltage output of each individual turbine is 690V, which is ineffective for transmitting 6MW of power over long distances. This is because such transmission would require an extremely large current, and thus would incur much greater energy losses due to high levels of electrical resistance. Increasing the transmission voltage for a certain power level reduces the current required to transmit it, and thus also reduces the energy loss due to resistance. To achieve this, a low to medium voltage step-up transformer would need to be installed in each turbine. We propose a 33kV step-up transformer, as this would not only greatly reduce power loss, but also allow for connection to the grid without the need for a substation and also allow for future expansion of the site without the need for new cable if desired. With each turbine producing power at 33kV, they could then be connected together using a ring main of 33kV cable, as outlined in the Figure 40 below.
Figure 40: Simplified Grid Connection Circuit Diagram (DM Energy, 2001)
The ring main connection is a safeguard against cable failure. If one section of the ring main fails, it can be bypassed using a series of switches, allowing the power generated by all four wind turbines to still be transmitted to shore. The two ends of the ring main are combined in an underwater offshore hub, and the electricity is then transmitted ashore via a 33kV submarine cable to a suitable substation near the shoreline, from where it can be fed into the grid. The hub can be designed to allow for a potential expansion site to be easily connected to this setup. One of the main costs associated with offshore developments is that of the cabling, as illustrated in Table 27 below.

OFFSHORE RENEWABLE ENERGY FOR GUERNSEY
63
Table 27: Illustration of Approximate Cable Costs
Site Distance (NM) Distance (km) Approx. Cost (£m)
Near 1.00 8.00 2.08
Medium 3.00 11.7 3.04
Far 6.00 17.3 4.50
The data for this table was compiled assuming a cost of £260m-1 for a three-core 33kV submarine cable, similar to the one used at Wave Hub in Northern Cornwall. The distances are approximate and measured as the crow-flies. In reality the cable will be longer than the approximations given here, as it would have to negotiate undersea obstacles such as trenches and rocks. These approximations are also purely for that amount of cable, and do not include installation or maintenance costs. This is due to the requirement for a full bathymetric survey to be undertaken before the cable can be laid, so that its route to shore can be plotted and to determine how the cable is installed, i.e. whether it can be entrenched under the seabed or if it can be simply covered with rocks. Ocean currents will also pose an issue with laying the cable, and will have to be considered when planning such an undertaking.

OFFSHORE RENEWABLE ENERGY FOR GUERNSEY
64
2.10 Environmental Impacts
Due to the immaturity of the industry, the environmental impacts of marine renewables are
relatively understudied compared to conventional fossil-fuel energy generation. This section
aims to consolidate data and recommendations available to assist in mitigating the effects to the environment and users. The following section deals specifically with high priority issues which may affect the project proposal. It assesses the impacts on a temporal basis highlighting impacts during installation and throughout operation on potential receptors.
Figure 41 : Environmental considerations from all aspects of the report (adapted from REA 2011)
2.10.1 Marine Mammals
The Bailiwick of Guernsey has a rich marine environment in terms of its biodiversity. The strong currents increase the flow of nutrients which consequently increases marine life from all trophic levels including cetaceans (dolphins and whales) and pinnipeds (seals). According to the Renewable Energy Assessment of Guernsey by the Marine renewable team the key species are:

OFFSHORE RENEWABLE ENERGY FOR GUERNSEY
65
Table 28: Key cetacean species reported in Guernsey's waters (REA, 2011)
Species Species Group Feeding Strategy
Bottlenose Dolphin Odontocete Raptorial Feeder
Harbour Porpoise Odontocete Raptorial Feeder
Long-finned Pilot Whale Odontocete Raptorial Feeder
Sperm Whale Odontocete Raptorial Feeder
Risso‟s Dolphin Odontocete Raptorial Feeder
Common Dolphin Odontocete Raptorial Feeder
Killer Whale Odontocete Raptorial Feeder
Fin Whale Mysticete Bulk/Filter Feeder
Common Minke Whale Mysticete Bulk/Filter Feeder
Table 29: Seal sightings in Guernsey (REA, 2011)
Species How common
Grey Seals Common (up to 8 sighted)
Common Seals Rare
2.10.1.1 Installation Impacts
Marine mammals use sound for foraging, orientation and communication and therefore are possibly susceptible to negative effects of man-made noise generated from construction and operation of large offshore wind turbines (P. T. Madsen, 2006). For wind turbines the device is outside of the water column; however the foundations are still inside of the pelagic zone. The ecological effects of this type of device are mainly of noise and habitat alteration. The most significant source of noise is from the piling of offshore wind turbine foundations. Pile driving can lead to damage of the mammalian auditory system whilst the noise generated from pile driving is above the auditory threshold for marine mammals, in this case whales and dolphins (P. T. Madsen, 2006). Prolonged exposure causes permanent damage to hearing, which is essential for the stated reasons above. This noise can lead to marine mammals avoiding sites which were used in the past, such as feeding grounds or routes to feeding grounds.
2.10.1.2 Operational Implications
The presence of underwater structures and associated reefs could attract fish species which in turn attracts their predators (marine mammals). The overall positive productivity of artificial reefs could increase the level of biomass and diversity in the area, leading to better feeding grounds for marine mammals, which provide positives to industries such as tourism. A further positive of the proposal which can be applied to all environmental receptors is that through the device selection. By selecting the 6MW turbine rather than the 3.6MW, fewer turbines are required to generate the desired amount of energy, therefore the installation time and the associated impacts are significantly reduced. 2.10.2 Ornithology
Guernsey, Herm and Sark are home to several species of birds, 4 of these being of international importance, as stated in the REA. In order to minimise the impacts of the proposed wind project on local ornithology, several factors have been considered. As with all other environmental receptors, the site was selected in order to minimise the potential effects. As is visible in Figure 41 the bird breeding sites would not be directly affected by the wind proposal. This does not, however, take into account the feeding sites of the various species as there is currently a lack of data in this area.

OFFSHORE RENEWABLE ENERGY FOR GUERNSEY
66
2.10.2.1 Installation Impacts
Birds are known to be easily disturbed by marine traffic and this may lead to species displacement (Mendel, 2008). Through avoidance of key time periods for local bird life, the impacts can be minimised. The installation period has been designated as between July and August. The months of March to July were identified in the REA as those that are most important for breeding birds. Unfortunately, these months are those where the conditions at sea would be best suited for installation. However, considering the distance from shore of the proposed site and the route of the installation vessel from Cherbourg, it is hoped that the impact during July would be minimal.
2.10.2.2 Operational Implications
It is commonly thought that wind turbines lead to vast numbers of bird deaths. The threat and occurrence of collisions cannot be denied, however it is vital to maintain perspective. In Denmark where 9% of energy is created using wind turbines it is estimated that 30,000 birds die per year due to collisions (MacKay, 2008). However, it is also estimated that 1 million birds die through collisions with cars and in the UK 55 million are killed by domestic cats (Figure 42) with a similar number dying due to collisions with buildings (MacKay, 2008). With this is mind, the impact of 4 large, slow moving turbines 6 nautical miles from the coast could hopefully be considered as minimal. The increase in biomass that is often found in areas of offshore renewable energy structures (Attrill, 2012) could have both a positive and negative effect. Increased availability of food could have a positive impact by allowing number of birds in the area to increase. However, increased attraction to the wind turbine area could increase the possibilities of collisions.
Figure 42: Estimated annual bird deaths from wind turbines & cars in Denmark and domestic cats in the UK. (Source (MacKay, 2008))
2.10.3 Benthic Processes
When looking at marine renewable energy and the benthic substratum it is important to define what the benthos is. Benthic ecology encompasses the study of the organisms living in and on the sea floor, the interactions between them and impacts on the surrounding area. Within the scope of marine renewables there are important areas to pay attention to with respect to all areas of benthic ecology. The major implication is that of damage to eel grass beds, Zostera marina and maerl which are highlighted from existing biological surveys and local sightings in Guernsey. The importance of these grasses is that they support a high level of biodiversity and sustain commercially viable juvenile fisheries. According to the REA report, (2011), Zostera marina is located throughout the REA study area however maerl is much patchier in distribution with little evidence of local sightings in the Big Russel. Any construction in these areas can significantly alter that of the benthic habitat which is relatively unknown and partially studied. From Seasearch surveys, priority benthic species are derived and compared with the BAP and ABW guidelines. The most likely species to be affected by marine devices is Eunicella

OFFSHORE RENEWABLE ENERGY FOR GUERNSEY
67
verrucosa or the pink sea fan which is an IUCN redlisted vulnerable species. This can have potential problems to project proposals, if certain species are seen to be prevalent at the proposed sites.
Figure 43: Pink sea fan (Charlotte Bolton 2012)
2.10.3.1 Installation Impacts
Current research predictions suggest that during these stages there can be direct substratum loss resulting from attachment of devices to the seabed. This can possibly lead to indirect population changes of surrounding local benthic species including marine algae, invertebrates and vertebrates. Sediment can be affected from installation and cabling of devices, which once disturbed becomes suspended in the water column. Upon settling this can smother important habitat such as sea grass beds which are important for marine diversity and the wellbeing of fish stocks. During the decommissioning this can also occur, which negates any positive growth which occurred at the site (Department of Enterprise, Trade and Investment, 2011). During installation and decommissions the impact of noise is very prevalent. The benthic zone hosts a variety of important fish species. Noise can displace and disturb local fish species and affect adjacent fish community structures.
2.10.3.2 Operational Implications
While there are negative impacts, wind farms can potentially positively increase benthic habitats and species (Attrill, 2012). These devices act as potential artificial reef structures, increasing the biodiversity, provide shelter for smaller species of fish which can lead to increased fishing returns for fishermen. Further impacts during operation of the wind turbines are related to scour, discussed in the marine processes & water quality section. 2.10.4 Fisheries
Fisheries are an important industry to Guernsey and provides significant economic benefits for the country and people. The total weight of landings of fish in 2012 was 1426.3 tonnes with a value of £4214000 (States of Guernsey, 2012). The Bailiwick licensed fleet of August 2012 registered 158 vessels under 10 meters and 8 over 10 meters. According to the REA (2011) report the most important fish stocks in tonnage are;
Table 30: Fisheries of economic importance in Guernsey (REA,2011)
Species Tonnes(1000)
Edible Crab 693
Ray 158.8
King Scallop 108.2
Lobster 101.5
Pollack 85.8
Bass 74
Spider Crab 40.1
In terms of tonnage and value, potting for edible crabs, spider crabs and lobster is the most important fishery in the Bailiwick. The main crustacean species are present on all sites in the study, with peak landings for edible crab and lobster during the summer months and spider crab during the annual spring migration between April and June.

OFFSHORE RENEWABLE ENERGY FOR GUERNSEY
68
2.10.4.1 Installation Impacts
The installation of devices and cables may lead to mortality of commercially important shellfish species from direct damage. The installation and decommissioning of the renewable devices could result in fishing fleets being temporarily displaced into other fishing grounds, leading to a concentration of fishing vessels and increased fishing effort for catches. In the scope of this report the proposed first site for the wind devices is within a heavily potted area. As stated in the benthic section of this report, the installation of devices alters and destroys the natural habitat and can lead to habitat destruction. Sea grass beds are essential for the shelter and growth of commercially important fishery such as lobsters and destroying them can lead to a direct reduction in the abundance of fish. Marine noise can affect fish by changing their behaviour. It is well documented that noise either attracts or repels fish, according to factors such as species and type of feeder (Knudsen, 2003). The types of noise can occur from both the installation process and marine operations which in the section on marine mammals was described to be negligible. 2.10.5 Cabling
The process of subsea cabling impacts the benthic habitat; however the extent of the impact is dependent on the laying technique used. Ploughing the sea bed and then burying the cable is commonly done as is laying the cable on the sea bed and then rock dumping upon it. These are the two main possibilities, with the later having fewer negatives impacts and also positives impacts.
2.10.5.1 Installation Impacts
Firstly a suitable route must be calculated once the local area has been hydrographically mapped. This is done in order to avoid sensitive areas such as nursery areas for fish and areas of historical importance. This immediately lowers the negatives impacts created by the cabling process. The installation itself however may cause species displacement due to increased marine traffic and also the introduction of a foreign object into the ecosystem. This is most likely to impact the sessile benthic species; however a key point is that the main impacts are only present during installation, decommissioning and repair work (OSPAR Commission, 2012). There will be further impacts when the cable comes onshore. One point that must be noted is that the proposal uses current onshore electrical structures to connect to the grid. This therefore limits the impact on the onshore environment as there would be less construction work necessary than if a new substation and grid network had to be constructed. When the cable comes ashore it is likely to be buried to avoid exposure to the elements. This burying of the cable will impact the sedimentary species and could impact the natural sedimentary processes of the beach. Studying the sedimentary processes on the beach would be recommended so that the cable can be buried to appropriate depths to avoid exposure. Exposure of the electrical cable occurred at the beach in north Cornwall where the Wave Hub cable comes onshore due to these natural sedimentary processes. Fully mapping and understanding the sedimentary processes of the beach would be beneficial to attempting to avoid such occurrences.
2.10.5.2 Operational Implications
As with many receptors, the main impacts occur during the installation phase. During the operational phase, the impacts through the presence of subsea cables are not fully known. The presence of electromagnetic fields (EMFs) surrounding subsea cables is known, however their full impact on local fauna and flora are not fully understood other than small-scale behavioural changes (Attrill, 2012). Positives can however be created through the technique of rock dumping the cable in order to protect it. This positive would come through the creation of an artificial reef - an example is shown in Figure 44. This would provide the perfect habitat for fish and in particular crustaceans; one of Guernsey‟s most important and lucrative fisheries (REA, 2011). This was found at the Wave Hub site off the north Cornish coast where fisherman have

OFFSHORE RENEWABLE ENERGY FOR GUERNSEY
69
found rich fishing grounds on the rock dumped cable route. The cable was deployed in 2010 and increased fishing has already been reported; this emphasises the short time scale before the positive impact is experienced.
Figure 44: An example of an artificial rock dumped reef
2.10.6 Marine Processes & Water Quality
These two receptors are linked to each other as the marine processes and their interactions with the wind turbine foundation structures directly impact the water quality of the surrounding area. With the proposed area being in deeper waters, the foundation structure that has been selected is a jacket structure.
2.10.6.1 Operational Implications
The main negatives during operation will be from the introduction of an underwater structure which will change the natural physical processes of the seafloor. This could lead to the process known as scour. This is erosion/accretion in un-natural places, it can however be predicted through accurate modelling (MORL, 2012). A positive impact on the water quality can come through the increased biomass that is associated with offshore structures; this increase in biomass positively influences the benthic and pelagic environment (Attrill, 2012). 2.10.7 Air Quality
From a human perspective, air quality is extremely important to public health, but it‟s also equally important for all air-breathing animals. In addition to a resident human population, Guernsey has important numbers of mammals and birdlife that permanently reside, breed or feed in the both the marine and in the terrestrial environment. According to the States of Guernsey Health and Social Services (HSSD), data collection since 1992 indicates that air quality in Guernsey is considered, "very good". It is therefore important to maintain this level of quality. There are likely to be implications in air quality from the introduction of marine renewable arrays to Guernsey. Essentially, the net effect will be determined by the phase of the developments lifecycle.
2.10.7.1 Installation Impacts
During installation, and future decommissioning, the impact is likely to be negative with measurable increases in CO, CO2 and various nitrous oxides (NOx). Emissions will primarily originate from an increase in marine traffic but will also be generated from a variety of land-based construction works and onshore transport. In addition, there is also the possibility of

OFFSHORE RENEWABLE ENERGY FOR GUERNSEY
70
increased dust coming from any onshore work which has the potential to temporarily reduce air quality. The length of installation, and consequently the potentially negative impact on air quality, will depend on the type of installation method coupled with device selection; the suggested four turbine array will ensure the shortest installation period - approximated at around 2 months. Regarding timescales for decommissioning, there is little precedent for this at present but it is likely to have the similar impacts to installation.
2.10.7.2 Operational Implications
During operation, there should be no adverse effects on overall air quality from the proposed offshore wind farm. In fact, it is highly likely that the introduction of marine renewables would have a beneficial effect on air quality substituting the production of significant quantities of electricity without combustion. It would essentially reduce the reliance of diesel generators on the island. However, the amount of air quality improvement will be dependent on the energy mix; renewable energy will have to directly replace energy generated by Guernsey Electricity‟s generators as opposed to replacing any nuclear derived energy through the cable from France. Indeed, the Strategic Tidal Stream Assessment for Alderney (date not given) notes that a 1GW renewable array could potentially reduce CO2emissions by between 360,000 te(CO2) and 700,000 te(CO2) per year, through displaced fossil fuel generation. Any „no go‟ zones created around the offshore array could also improve localised air quality. Throughout the operation phase, devices will require maintenance, and this will inevitably lead to a slight, but measurable, increase in shipping with the potential to marginally reduce localised air quality. Therefore, it is more than likely that, over the entire lifetime of devices, the net impact on air quality will be positive. 2.10.8 Marine Coastal History
Guernsey has a rich historic and archaeological record which includes hundreds of known shipwrecks dating as far back as the Gallo-Roman period. According to the REA (2011), there are also a number of „submerged landscapes‟ that are of historical importance including Palaeolithic, Mesolithic and Neolithic ancient landscapes. Undoubtedly, these sites are a finite resource that forms an important part of the cultural heritage of the Bailiwick making a significant contribution to education, leisure and tourism. The deployment of renewable energy devices has the potential to impact on the marine and coastal historic environments during initial installation as well as throughout their operation.
2.10.8.1 Installation Impacts
Offshore turbines, such as the proposed Siemens 6MW device, are pile mounted to secure the device base to the seabed. These have the potential to damage sites and artefacts in the marine environment. However, site selection has taken this into consideration, and the three marked sites have little or no identified historic importance. The biggest potential impact arises from cabling. Cabling is required to link the turbines and transverse the seabed to an onshore substation. This has implications for the foreshore and seabed. The laying method will determine the extent of the impact. Trenches will induce the largest amount of damage while proposed methodologies, such as rock dumping, can actually enhance the seabed creating new micro-marine environments. The cabling route should be carefully planned and mapped to avoid and mitigate potential damage to historic sites.
2.10.8.2 Operational Implications
There are few negative impacts during operation. However, turbines and the associated infrastructure will inevitably alter tidal flow and displace wave energy to some degree. This may result in sensitive sites becoming buried under accumulations of new sediment while others may become exposed during device operation.

OFFSHORE RENEWABLE ENERGY FOR GUERNSEY
71
2.10.9 Shipping & Navigation
As with any work carried out in the marine environment there will be an impact on the local shipping and navigation. The benefit of correct planning and execution of marine work is that the impacts on the local marine users can be minimised; as has been planned for with this proposal. Through the use of the environmental constraints identified in the REA, the proposed wind farm area does not interfere with major shipping lanes. A further point to note is that as the installation team will be based in Cherbourg, there will be no impacts on the local shipping industry‟s use of the port facilities. There will be impacts on navigation with industry standard 500m safety zones being enforced. 2.10.10 Seascape & Landscape
The installation of 4 turbines off the north east coast of Guernsey would have an impact on the landscape but mainly on the seascape. Through the visualisations created on the Plymouth University TRANSAS NTPRO 5000 navigation simulator, it is evident that the visual impact is much less pronounced than could be perceived.
2.10.10.1 Installation Impacts
The impacts on the seascape during installation will be due to the increase in boat activity as the turbines are constructed. There will be physical impacts on the landscape during the installation process, mainly where the cable comes ashore. This will be unavoidable, however, through accurate planning, surveying and learning from experiences at other marine energy sites, these impacts can be limited.
2.10.10.2 Operational Implications
There will inevitably be a on the seascape during operation due to the presence of the turbines on the horizon. It is hoped that through the accurate planning leading to the proposed location of the site, the visual impact will be negligible as can be seen through the visualisations. 2.10.11 Tourism & Recreation
With 186,000 visitors and 55,000 cruise passengers a year (REA, 2011), Guernsey has a thriving tourism industry. Indeed, Treasury and Resources estimate that the industry accounts around 9.6% of GDP contributing in the region of £60-70million a year (REA, 2011). Consequently, any large scale infrastructure development would need careful consideration to avoid changing the island‟s character and appeal as a holiday destination.
2.10.11.1 Installation Impacts
During installation, the development zone will be significantly larger than any safety zones during the arrays operational lifespan. There could be noticeable adverse effects to tourism during installation, but the extent of these effects will be largely determined by installation methods. The methodology suggested by this report mitigates the majority of impacts and optimises installation time. Moreover, any impacts during installation should be temporary. Construction, where logistically possible, should be undertaken outside of the peak tourist season that runs from April to September to minimise impacts.
2.10.11.2 Operational Implications
An offshore wind farm will inevitably have dramatic implications for the seascape. Indeed, site selection has been carefully considered to minimise the visual impact; the four turbine array is located away from key tourist areas such as the cliffs on the South coast. Furthermore, the severity of these visual impacts has been reduced by device selection. Using four 6MW 154m devices, as opposed to ten 3.6MW 107m turbines, the horizontal visual impact will be greatly reduced, albeit at the expense of a slightly increased vertical impact. The wind array has potential to have negative impacts on recreational activities in the immediate and surrounding area. While permanent exclusion zones may prohibit marine activities in a relatively small area (1.58km x 2.56km), they are no known significant tourist recreational activities in the suggested deployment zones. As suggested in the 2011 REA, a

OFFSHORE RENEWABLE ENERGY FOR GUERNSEY
72
well-publicised campaign and an active promotion of the renewable scheme could create added interest for tourists, particularly if there was a dedicated visitor centre developed in conjunction with device deployment. The added „learning‟ experience, especially in an era of increased awareness of climate change, could actually boost tourist numbers and enhance visitor experience. 2.10.12 Environmental Recommendations
2.10.12.1 Marine Mammals
There is limited knowledge of the effects on marine mammals from construction and operating offshore wind farms. The lack of data on behavioural reactions of the exposed animals is the main issue which needs to be addressed. Research needs to be done on the long and short term consequences of exposure to noise. Potential effects can be reduced by avoiding breeding and spawning seasons, using marine mammal observers and exclusion zones. This will lead to the negative impacts being negligible to marine mammals. Due to the lack of data and variability of marine mammals within the waters of Guernsey at different locations it is difficult to deduce whether marine mammals will be directly affected, however site selection was done to minimise the effects on marine mammals with the current data available.
2.10.12.2 Ornithology
At least 2 years survey data is required for conclusive results to be gained (BVG Associates). By combining the current information available and following the guidelines identified by the Crown Estate - for example radio tagging and aerial surveys - accurate, scientific data could be collected. This would help with planning and directly lead to a reduced risk to the local bird life.
2.10.12.3 Benthic Processes
Benthic ecology interactions with marine renewable energy devices such as wind turbines are currently very limited. However with increased information on species, habitat distributions and exact site location would enable sensitive habitats and species to be avoided leading to the likely residual effects being negligible. Much research has to be taken in conjunction with all steps of marine renewable devices in order to be better informed about the impacts of devices on the benthic environment.
2.10.12.4 Fisheries
Monitoring changes in catch levels during and post device installation to identify any significant trends both positive and negative in catch levels will give an indication of how the devices affect landings and the fishery as a whole. Developing a liaison with the fishing industry is critical to success of all future developments of marine renewables. Much interaction has to take place between both of the parties to work out the best way in which to proceed so that all steps are clarified before full operation.
2.10.12.5 Marine Processes & Water Quality
The most important work that can be done to identify possible impacts is the collection of relevant data to enable accurate modelling of sedimentary movement to be carried out. The current sampling work using the “Blue Flag” classification system discussed in the REA should be continued in order to identify any possible contaminants or changes to local beaches.
2.10.12.6 Seascape & Landscape
As the majority of the environmental impacts upon the seascape and landscape will be during operation it is vital that a Seascape and Landscape Visual Impact Assessment (SLVIA) is carried out as part of the EIA. Guidelines created by Enviros in 2005 (Enviros, 2005) for the then Department of Trade and Industry, state that the main aims of the scoping aspects of the SLVIA are to:
Identify important receptors, potential effects and project alternatives
Identify the appropriate methodologies and which stakeholders to consult

OFFSHORE RENEWABLE ENERGY FOR GUERNSEY
73
Establish communication between all parties involved as early as possible
Highlight any areas that may create potential problems for the developer.
The key aspects of carrying out a SLVIA are that local stakeholders get the opportunity to have their say and possible areas of concern are highlighted early on in the process.

OFFSHORE RENEWABLE ENERGY FOR GUERNSEY
74
2.11 Modelling the economics for wind energy
This section considers variables and constraints involved in installing an offshore wind farm in the waters surrounding Guernsey, and will be placed in a global context in the following section. 2.11.1 Spreading the risk and funding options
Any project of this size comes with risk and difficulties in sourcing funding. A key part is the study of risk management to ensure investment into this project is financially sound as well as technically feasible.
Table 31: Investment risk matrix in context of project development stage
Project Stages Investment needed Risk Investor Return
Preplanning consent Low Very high High
Preconstruction Medium High Medium
Construction High Medium Medium
Commissioning Low Low Low
Project Maturity Very low Very low Low
Table 31 shows how the risk changes at each stage of a typical construction project as well as the level of investment needed. This reflects the importance of having a mixed investment pool. Ideally, there will be investors prepared to accept higher levels of risk and seeking greater returns at early stages and low risk investors at the latter stages to widen the funding pool. Therefore, it would be advisable to have rounds of investment to encourage a variety of investor leading to a larger investment pool, similar to how method employed by the UK Channel Tunnel project. 2.11.2 The cooperative proposal
Despite significant investment from the Guernsey financial sector invested globally in clean technology, such as wave, tidal and wind (Poidevin, 2012), at present there is very little incentive for investment in projects directly, e.g. development of renewable energy devices in Guernsey waters. Additionally, the State does not have sufficient revenue for such a large project for such small return. An introduction of a carbon tax for cars, industry and even residents would be treated as politically sensitive and the likelihood of such a tax coming into force is small. The idea of a wind farm in Guernsey waters has seen objections in the past due to spoiling the natural beauty and would most likely increase electricity bills, while being financially unviable for the State. All of this makes the funding for a project of this type almost impossible, unless it would be seen benefitting financially and socially everyone on the island; hence the proposal of a community cooperative wind farm, financed mostly by shareholders. Currently, there are nine community-owned onshore wind farms in the UK, evidence that the concept works and is very effective. Community engagement benefits the local community financially as well as environmentally. Though it never has been applied to off-shore wind farms but may be just as feasible. The State of Guernsey is a closed market for mains electricity, supplied by Guernsey Electric Ltd (GE Ltd). Under the 2001 Guernsey Electricity Act (States-of-Guernsy, 2012), the GE Ltd has the sole rights to supply electricity to the Guernsey community. This means the proposed co-op would own the wind farm itself and income will be generated via feed-in tariff with GE Ltd, with the added possibilities to export surplus electricity to Jersey and the EU market.

OFFSHORE RENEWABLE ENERGY FOR GUERNSEY
75
2.11.3 Case-study highlights the financial consequences of site selection with regards to depth
Figure 45: The three proposed sites for offshore wind farm to the north east of Herm.
An increase in depth plays a large role in total capital costs, to any offshore wind farm. When the depth becomes more than 40-45 meters below sea level the required foundation system changes from pile design to jacket design, which is traditionally a more costly foundation to construct (Agency, 2009). Additionally, capital cost increases with distance from the shoreline, mainly due to increasing cable lengths and increased exposure to the elements. Foundation and distance cost occur hand in hand, as the further offshore the deep the water becomes. For example, if Site 3 in Figure 45 becomes the most viable due to no other reason than cost, this would mean a predicted increase of 43% to the capital cost companied to site 1 in Figure 45, as shown in Table 32.
Table 32: Increase in capital cost due to location proposed sites for proposed wind Farm (Agency, 2009).
Site No
Depth (m)
Nautical miles from shore line
Cost (EUR/kw installed) due to depth
Scale factor due offset from shore line
Cost (EUR/kw installed) offset from shore line
Capital cost Increase (%)
One 0 to 10 1 1800 1 1800 1
Two 20 to 30
3 1920 1 1920 6.7%
Three 40 to 50
6 2514 1.427 2568.6 43%

OFFSHORE RENEWABLE ENERGY FOR GUERNSEY
76
2.11.4 The modelling
An economic forecast for the proposed offshore wind farm has to take all consideration into account. These include limiting the impact to electricity bills and ensuring the shareholders gain a respectable return on their investment.
Figure 46: The inputs (blue) and constrains (white) to the economic model.
Figure 46 shows all constraints the economic model has taken in to account. The first key constraint is the stated maximum tolerated 15% increase to electrical bills (Guernsey, 2011). The other key constraint is the island‟s electrical supply mix, which is set at 25%:75% split between renewable supply and conventional supply, respectively, after assessing the wind resource. The conventional supply is the current electricity mix which is 82.1% imported and 17.9% is on-island generation (Guernsey, 2011). It came to a combined cost of 6.5p/kwh in 2011, excluding grid connexions and fixed running cost. The estimated figure for 2014, which is earliest start date for the proposed wind farm, is 6.9p/kwh (RET, 2011). 2.11.5 The principle argument of the model
The two main inputs to the model, capital cost and annual electricity produced, based on the wind resources available, are highlighted in green in Figure 46. The capital cost governs the running costs giving the overall life cycle cost of the project. These two inputs determine the price per Kwh as shown in Eq. 1 Figure 46.
Eq. 1
Eq. 2

OFFSHORE RENEWABLE ENERGY FOR GUERNSEY
77
Eq. 1 shows the main structure for the cost of the energy generation by the wind farm. Referring back to Figure 46, one of the constraints is the energy mixture which is 25% renewable and 75% conventional. Integrating Eq. 1 into Eq. 2, including the energy mix, shows the argument to the economic model. Assuming the “current cost”, “Grid connection” and “RenE” being fixed values, ignoring inflation, the only variable is “shareholders return” and “1.15 or less ” value acting as the maximum increase to electricity bills. These means the model becomes balanced between these two variables. An argument can be made that the increase to electricity bills is directly fuelling the return for the investors hence why the cooperative system was proposed: the revenue is being returned to consumers. 2.11.6 Assessing and verifying inputs to economical model
To establish the economic forecast for the proposed offshore wind farm two inputs are needed. Site location is required and due to the natural beauty most of Guernsey and Herm is surrounded by, the assumption can be made the further offshore the better. This is likely to be the local consensus, despite the increase to capital cost. This leaves the preferred location is site 3, as shown in Figure 46, which is 6nm offshore to the NE of Guernsey and Herm. Now an estimated capital coast for the location is needed, this was achieved by costing the installation method, supply chain length, the cost of cable and using guiding cost published by The Crown Estate (CE) for round three of offshore wind farms in the UK (Crown-Estate, 2011).
Table 33: estimated capital cost for site 3 shown on figure 4.1
Selected Array sizes: 4 x 6MW wind turbines
Approximant Water depth: 40-50m
Distances offshore: 6. n.m.
Estimated capital cost: £86.6m
To establish that the capital cost in Table 33 is of reasonable values for an array of this size, a comparison of two wind farms have been selected for similar properties e.g. depth, turbine size and distances offshore then scale to 24MW capacity to suit the proposed array size at site 3. Referring to Figure 47 and Figure 48, shows a similar project that has been active for several years. Starting with the case in Figure 47, the 60MW array cost £95.5m if scaled to 24MW capacity (A-LORC, 2011). This is a larger sum than that predicted for the proposed array but 60MW array does have additional cost in the form an installation of an offshore substation (costing £40m) and the array being 26-35nm offshore adds a significant increase to the cabling cost. Both of these factors will have an effect on the capital costs, this is reinforced by Figure 48 which has no offshore substation, is closer to shore and was only a demonstration model which had a scaled capital cost of £77.1m (B-LORC, 2011). On reflection of both case-studies the estimated capital cost in Table 33 is realistic for project of this scale and location.

OFFSHORE RENEWABLE ENERGY FOR GUERNSEY
78
Figure 47: Project profile of a Germany wind farm (A-LORC, 2011)
Figure 48: Project profile of a United Kingdom wind farm (B-LORC, 2011)
The last input needed was based on the State of Guernsey capacity of capital expenditure for this project. Referring to the recent approval of Guernsey airport runway exstension, estimated baseline cost to be £57.8m, this can be used as a limit marker e.g. no high than £57.8m for State project (Airport, 2008). For this reason a State projects of this size requires private investment as well, in this case the cooperative system but this even has limits in raising significant funds for capital cost and so bank credit is needed as well.

OFFSHORE RENEWABLE ENERGY FOR GUERNSEY
79
Table 34: capital cost share structure and ownership structure for proposed wind farm
Table 6.2 shows the proposed capital cost funding structure as well as ownership structure used in the model. The bank loan covers 50% of capital cost to ensure the project achieves sufficient funds to start construction of the wind farm. The ownership structure based on cooperative means that no one party will become majority share holder but it would be advised that GG Ltd has a “golden share” to allow them to influence, if not manage, the new infrastructure whilst still acting as cooperative. 2.11.7 Reflection on the economical model results
Economic Model inputs Capital cost: £86.6m
Predicated Annual energy production: 95,544MWh
Expected wind farm life: 20 years
For model constrains reference to Figure 46
For ownership structure reference to Table 34 Economic model output Payback period to bank loan: 11 years
Life cycle cost: £182.64m (2014)
Avg return to investor: 7.6% Annual rate of return (ARR)
Increase to electric bills: 9% (Total increase during life cycle excluding inflation)
The increase to electricity bills is lower than predicted (9%) and still ensures a respectable return to investors (Avg 7.6%ARR). This is a typical return for a wind farm project (Acher, 2012). Most crucial is the payback period of 11 year, despite the capital cost is bankrolled by 50% the payback period is short. This leaves room for the increase of array size from 24MW to 48MW at later date, which might suit the future economy of Guernsey. The project is financially feasible while still respecting all the constraints. There are limitations to this model as it only reflects direct impacts and not externalities. Externalities cover environmental impacts, impacts to local economy and changes to international market, all these externalities could have significant impact to financial feasibility to this project. With such a larger capital project it would be strongly advisable to have a full Cost Benefit Analysis (CBA) Study that takes in to account the direct cost and externalities before project progresses. Overall the model cannot predict the impacts to Gross Domestic Product (GDP) for the State of Guernsey but can indicate that with a small increase in electricity bill now can substantial stabilise the cost electricity over next 20 years and reduces the amount of on-island generation reducing the green-house gas and improving air quality.
Capital Investors Capital cost shear Capital investment (£m) Ownership
GG Ltd/SoG 20% 17.3 40%
Cooperative 30% 26 60%
Bank loan 50% 43.3 Pay period - 13 years

OFFSHORE RENEWABLE ENERGY FOR GUERNSEY
80
2.12 Economics of Wind Energy
This section will briefly highlight the threat of the increasing volatility of global fuel prices and the importance of security of supply before discussing the impact of the proposed 24MW wind farm in terms of reduced oil consumption, potential carbon savings and cost to the consumer. The potential export market will be considered before interim conclusions are presented. 2.12.1 Security of Supply and Global Fuel Costs
Assuming constant levels of consumption, global fuel prices are increasing. This results in a higher cost to the consumer. Guernsey electricity prices are already slightly higher than those in the UK and in continental Europe. If Guernsey were to be increasingly reliant on diesel generators, as is likely with the unsound import cable, this is likely to result in an increase in electricity price. Electricity prices would become similar to those experienced in Alderney, where electricity generation is highly dependent on imported fuel (Alderney Renewable Energy Commission, 2007). It is becoming increasingly important that states protect the security of supply of their energy and look to self-sufficient and reliable solutions. 2.12.2 Oil Consumption
The proposed 24MW wind farm would annually reduce unclean energy consumption by 100GWh and reduce reliance on oil-fired generation methods. Financial benefits of the project can be seen primarily through reduced oil consumption. In order to ensure that any financial statistics are reliable, site specific data is required. For a project such as this, confidential data such as efficiency statistics for existing fuel-fired generation techniques would be required. It is not possible to source the required data to work these figures out from basics, lest the figures become misleading. Therefore figures produced by the Alderney Renewable Energy Commission, (2007) were used to provide a basis for estimations presented in the following calculations regarding oil and carbon costs. These figures must be treated as merely an indication, as variables used in the calculation will have changed (for example, increase from 2007 fuel price, exchange rate fluctuations). Alderney Renewable Energy Commission, (2007) estimates 8.1GWh of oil-fired electricity requires £1.15m worth of oil to generate and therefore 100GWh of oil-fired electricity requires £14.2m worth of oil to generate. 2.12.3 Carbon Cost
Often, the carbon cost of a project is used as an indicator of the level of environmental impact the project will have.. Annually to produce 100GWh of energy, 27.16 million litres of fuel oil would be required: when burned, this emits a total of 78,788 tonnes of CO2 (Alderney Renewable Energy Commission, 2007). If the proposed wind farm could produce 100GWh, this could replace the 100GWh of fuel used by diesel generators and the 78,788 tonnes of CO2 could be saved. A wind farm project would be highly beneficial to Guernsey. If 100 GWh were produced by the proposed wind farm, then significant carbon savings could be made along with a decreased reliance on fossil fuel based technology: this additionally prevents such significant rises in costs to the consumer resulting from oil price increase. Continuing to consider the cost to the consumer, an initial increase in electricity prices may occur to cover the high capital expenditure from renewable energy. Often the higher costs in the short term are subsidised by the government. This may not be possible on Guernsey due to the comparatively small size of the economy. Longer term electricity prices should be more stable or even reduced due the low running costs of renewable energy (Marsh, 2009)

OFFSHORE RENEWABLE ENERGY FOR GUERNSEY
81
2.12.4 Expansion Beyond 24MW
As discussed previously in the report, the proposed wind farm leaves opportunity for expansion. On the basis of a 24MW wind farm, Guernsey is unlikely to produce sufficient excess energy to export. If expansion of the site occurred to the extent that Guernsey had a high enough energy to export, the logical solution would be to utilise the 55MW Guernsey-Jersey cable to export energy to Jersey. Of the 1000GWh the Channel Island Electricity Grid imports from France, two thirds is used on Jersey (Jersey Electricity) so the possibility of demand from Jersey could be explored as a longer term option. Additionally. Guernsey is unlikely to be able to take advantage of UK “Renewables Obligation Certificate” or French “feed-in tariffs” until it has a high enough energy output to export. 2.12.5 Interim Summary of Economics
The economics models that have been presented in this report indicate that the proposal for a 24MW wind farm is financially viable. It is also clear that it is a prime strategic choice given the requirement for security of supply. Against a backdrop of increasing fuel price volatility, reducing reliance on oil-fired fuel generation methods is an essential step for Guernsey to take in terms of the wellbeing of its economy and its contribution towards an environmentally sound future. Offshore wind is a proven technology and consequently the costs involved in establishing a wind farm are not extreme. Provided that appropriate funding can be found, the project is feasible with current levels of technology.

OFFSHORE RENEWABLE ENERGY FOR GUERNSEY
82
3 MEDIUM TERM STRATEGIC OPTION – TIDAL ENERGY As can be seen in the previous section, offshore wind is a reasonable short term option for Guernsey. With a view to looking to a future for the island, a medium term option of tidal energy shall now be considered. It is known that the Bailiwick of Guernsey possesses a significant and predictable tidal resource, most notably in the Big Russel. However, the tidal stream technology necessary to harness this resource is in a relatively early stage of development when compared to other renewable technologies such as wind and solar power. Therefore, the implementation of tidal stream technology would constitute a much greater risk than the implementation of other renewable technologies. As a result of this relative technological immaturity, this report considers the deployment of tidal stream technology as a more medium-term solution to Guernsey‟s energy needs. To this end, the potential resources available in the Big Russel were assessed and examined, as were the current generation of tidal stream devices to select the most suitable option for deployment in the Big Russel. Many complexities were found when assessing tidal stream devices. The sector is currently very dynamic and is always evolving. There are uncertain costs associated with the deployment of tidal stream devices and even though this report considers a time period of up to 5-15 years, it is necessary to consider currently established devices. This requires the devices to be commercially successful, providing the requirement for successful testing during the Round 1 Crown Estate developments at Pentland Firth, Scotland. In addition to this, there are many differences between the tidal stream sector and the offshore wind sector, particularly in terms of installation, maintenance and environmental impacts. No clear market leader has yet emerged in the tidal stream sector, meaning there are many different types and designs of devices. This presents a challenge when considering the installation and maintenance processes necessary for such devices, as well as the potential environmental impacts each different device will have. Nevertheless, by considering a deployment location of the Big Russel and the resources that location provides, the current status of tidal stream technologies were assessed to find the most suitable device. This then allowed for the examination of how such a device could be installed and maintained in the Big Russel without greatly impacting the environment, so that a potential roadmap to utilising this resource could be created.

OFFSHORE RENEWABLE ENERGY FOR GUERNSEY
83
3.1 Tidal Resource Assessment
The tidal range in the Channel Islands is large; up to 10 m in Guernsey on a spring tide (Siddle et.al. 2006). The Big Russel is a channel located between the islands of Herm and Sark to the East of Guernsey. The channel has very strong tidal currents and it is for this reason that it has potential as a site for the installation of tidal power turbines. Tidal power energy is still in the early stages of its development and an industry standard design for exploiting this resource has not emerged yet. Therefore, for this study the European Marine Energy Centre (EMEC) Assessment of Tidal Energy Resource document, published in 2009, was chosen. This assessment uses data obtained from two Acoustic Doppler Current Profiler (ADCP) devices located in the north of the Big Russel. The data was collected over the winter months, with site 1 collected from 14/11/2011 to 22/12/2011 and site 2 from 7/01/2012 to 7/02/2012. The ADCP‟s were located in 45 metres of water working at 600khz, resolving over 2 metre vertical intervals.
Figure 49: Map of Guernsey showing the ADCP locations. Site 1 located at 49o27‟12.80, 02
o24‟.51.90.
Site 2, located at 49o27.00, 02
o23.56.00.

OFFSHORE RENEWABLE ENERGY FOR GUERNSEY
84
The ADCP‟s constitute a static survey method in accordance with the EMEC guidelines section 6.4. For a successful tidal stream resource assessment to be carried out the APD must be calculated. For this calculation, V is the tidal flow, at 90o to the assumed orientation of the tidal device used.
(Eq. 3).
Where: ρ Water density (kg/m3) NB Number of velocity bins set in increments of 0.10 m/s i Index for velocity bin numbers Ui Central value velocity magnitude in the ith bin (m/s) ƒ(Ui) Time occurrence likelihood of a velocity in each 0.10 m/s bin (%) Vrmc Root mean velocity
This assessment is deemed to be at Stage 2a: Pre-feasibility study, defined by the EMEC Guidelines as – “The first stage of a pre-feasibility study that should consider the resource identified in the site screening in more detail”. For an accurate resource assessment to be carried out, consideration of several different processes must be considered. The flow speed of the tide, with current technology requiring flow speeds in excess of 2.5 m/s. The direction of the flow, this is critical for positioning the device at the ideal angle to the flow. The ideal angle of the flow is defined by the angle at which the turbine generates the maximum power. The ellipticity of the tide must also be considered; in the open ocean, tides are free to rotate in a circular motion. However, tides within areas such as channels, like the Big Russel - where tidal movement is constrained by bathymetry, are not free to rotate in the circular pattern which causes movement in an elliptical pattern. This is important when aligning the device as it is important to position it at the optimum angle in order to exploit the tidal movement. The final component to consider is the vertical shear. This is generated where friction is caused between water movement and the sea bed, which inhibits the flow. This means that the device will have to be located above this area of inhibited flow. There is also flow retardation from the surface waves, however, this will not have an affect the device due to its location on the seabed. 3.1.1 Static Survey- ADCP Data
The data from the static surbey is displayed in Figure 50, in accordance with EMEC guidelines section 6.4. These graphs show the Easterly and Northerly components of the tide, as measured at sites 1 and 2. Several important features which can be observed are:
1. The peak flood tide velocity, shown by the peaks of the data in figure 50. 2. The peak ebb tide velocity, shown by the troughs of the data in figure 50. 3. The Spring-Neap tidal cycle, higher tidal velocities show the spring event, and the lower
tidal velocities the neap event. It oscillates in a twice monthly cycle which can be observed.
4. The Northerly component (V) accounts for a larger portion of the tide than the Easterly.

OFFSHORE RENEWABLE ENERGY FOR GUERNSEY
85
A
B
Figure 50: The Eastward (blue) and Northward (red) components of flow velocity taken from ADCP site 1 (section A) and site 2 (section B).

OFFSHORE RENEWABLE ENERGY FOR GUERNSEY
86
3.1.2 Tidal Harmonic Analysis
A tidal harmonic analysis was carried out on the data obtained from the two ADCP sites in accordance with the EMEC guidelines section 5.2. The analysis used 29 tidal constituents however only those constituents with a signal to noise ratio of greater than 3 were included. Table 35 and Table 36 show the 4 major constituents which were calculated. Within these tables the frequency is stated which is the astronomical frequency of the tide. The semi major is the maximum speed of the tide along the major axis. The orientation represents the main angle at which the semi major flows. Finally the semi-major:semi-minor is the ratio of the two components: the semi minor being the tidal flow at 90o to the semi-major axis.
Table 35: Tidal harmonic analysis data for Site 1 showing the major tidal driving components. M2 is the principal lunar semidiurnal component, S2 the principle solar semi diurnal component, N2 the larger lunar
elliptic semidiurnal and M4 the shallow water overtides of principal lunar.
Constituent Frequency Semi-major Orientation Semi-major:semi-minor
M2 0.0805 1.745 33.4 29.576
S2 0.0833 0.402 35.6 15.962
N2 0.0789 0.314 34 7.444
M4 0.1638 0.128 61.26 -8.294
Table 36: Tidal harmonic analysis data for Site 2 showing the major tidal driving components. M2 is the principal lundar semidiurnal component, S2 the principle solar semi diusrnal component, N2 the larger
lunar elliptic semidiurnal and M4 the shallow water overtides of principal lunar.
Constituent Frequency Semi-major Orientation Semi-major:semi-minor
M2 0.0805 1.596 43.94 24.182
S2 0.0833 0.505 41.45 15.781
N2 0.0789 0.223 36.35 11.737
M4 0.1638 0.264 50.03 3.181
The data obtained from the tidal harmonic analysis was used to calculate the tidal ellipses shown in Figure 51. The semi-major was used as velocity shown in the ellipses and the orientation defines the angle the ellipse is aligned at. This is in accordance with section 7.4 of the EMEC guidelines.

OFFSHORE RENEWABLE ENERGY FOR GUERNSEY
87
a b
Figure 51: Tidal ellipses plotted from the predicted tidal harmonic analysis for the two major components, M2 and S2, from both ADCP site. Ellipse a shows data from site 1 and b from site 2.
The orientation of each tidal component shown in Table 35 and Table 36 can be used to calculate the major axis along which the tide flows. As all of the major components do not differ by more than 10o, and because the M2 component has such a large influence compared to the other three, the major tidal flow axis at site 1 is 33oN and at site 2 is 44oN. The major axis of flow is important for aligning the device at the optimum angle for maximum resource exploitation. The major tidal flow axis allows the major flow axis tidal velocities to be calculated from the ADCP data shown in Figure 51. The graphs, Figure 52, show much higher velocity values for the long axis velocity, which is aligned with the major tidal flow axis. When this is compared to the cross axis flow, which is at 90o to the major axis, it confirms that the major axis angle is correct.
a
b

OFFSHORE RENEWABLE ENERGY FOR GUERNSEY
88
Figure 52: Major tidal axis velocities from site 1(a) and 2(b), with both the long (red) and cross (blue) axis velocity components plotted.
3.1.3 Vertical Shear
To ensure that the device will not be located where the flow is inhibited by frictional effects, a threshold value is calculated to establish a height above the seabed where the device will not be affected. This threshold is where the flow is greater than 90% of the average velocity over depth; any values below the threshold indicate the depth where interference is considered too great. Figure 53 shows the threshold heights for the tidal cycles at sites 1 and 2. The influence of the friction with the seabed can be seen in the retardation of the flow in the lower waters. The results show that the device must be located 6.5m above the seabed in order to be out of the inhibited flow. The optimum depth is identified as being 30 metres from the sea surface due to its location above the vertical shear threshold.
Figure 53: Graph showing average maximum flow velocities from both ADCP sites on flood and ebb tides.
0
5
10
15
20
25
30
35
40
45
0 0.5 1 1.5 2 2.5 3
Dis
tan
ce
fro
m A
DC
P (
m)
Flow Velocity (m/s)
Site 1- Flood Tide
Site 1- Ebb Tide
Site 2- Flood Tide
Site 2- Ebb Tide
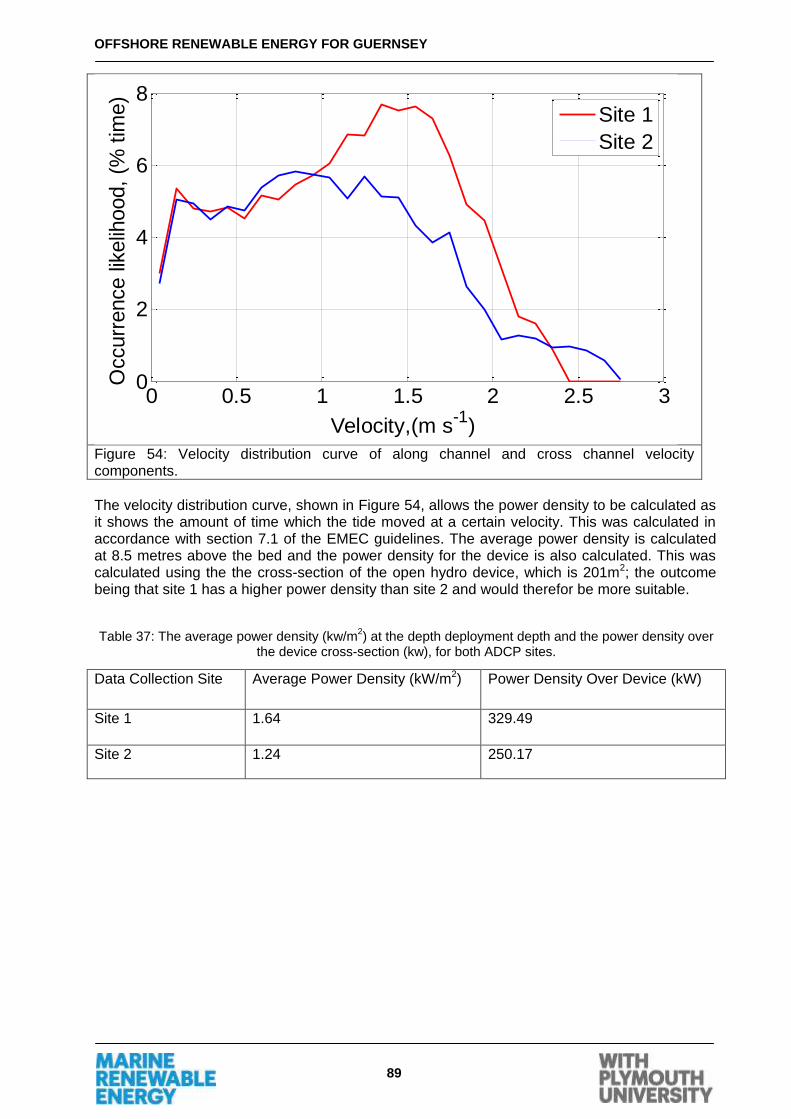
OFFSHORE RENEWABLE ENERGY FOR GUERNSEY
89
Figure 54: Velocity distribution curve of along channel and cross channel velocity components.
The velocity distribution curve, shown in Figure 54, allows the power density to be calculated as it shows the amount of time which the tide moved at a certain velocity. This was calculated in accordance with section 7.1 of the EMEC guidelines. The average power density is calculated at 8.5 metres above the bed and the power density for the device is also calculated. This was calculated using the the cross-section of the open hydro device, which is 201m2; the outcome being that site 1 has a higher power density than site 2 and would therefor be more suitable.
Table 37: The average power density (kw/m2) at the depth deployment depth and the power density over
the device cross-section (kw), for both ADCP sites.
Data Collection Site Average Power Density (kW/m2) Power Density Over Device (kW)
Site 1 1.64 329.49
Site 2 1.24 250.17
0 0.5 1 1.5 2 2.5 30
2
4
6
8O
ccurr
ence lik
elih
ood,
(% t
ime)
Velocity,(m s-1
)
Site 1
Site 2

OFFSHORE RENEWABLE ENERGY FOR GUERNSEY
90
3.2 Tidal Technology
As suggested in the previous section, there is a suitable tidal recourse in Guernsey in the form of the Big Russel. There are two potential options in extracting energy from the tide, tidal barrage and tidal stream. The tidal flow speed, range and natural landscape make the Big Russel suitable for utilising tidal stream technology. This section helps to identify the most suitable device for the given resource and location. 3.2.1
3.2.2 Technology Status
The technology used is in most cases very similar to the off shore wind energy sector however due to the significantly denser medium of water and difficulties in installing and maintaining tidal stream devices, the technology is significantly less mature than offshore wind and is arguably not commercially viable. To date there is only one known grid connected tidal stream array deployed in the world. This was installed by Verdant Power and consists of six of their 4th generation devices which have produced over 70 megawatt hours of electricity. There are currently 8 developers who have tidal stream devices, or plan to have devices installed in full or scale prototype testing in EMEC. Unlike off shore wind where the three bladed device is a fairly substantiated device design, there is no convergence to a specific method in converting tidal energy into electrical energy. However the tidal market is significantly further developed than the wave energy market. Due to the status of the market, as stated previously it is felt that the installation of a tidal stream device or a potential array is more suitable for a medium term strategic plan, once the technology is demonstrated in a significant commercial deployment. However this section aims to identify the most appropriate device in commission today, with the ambition it would still be viable for the medium term plan. 3.2.3 Concept Design Review
Firstly in order to identify an appropriate device, a review of the current design concepts was undertaken, with the aim of identifying the most applicable. EMEC distinguish the different concepts into the following categories (EMEC,2012):
Horizontal axis turbines
Vertical axis turbines
Oscilating hydrofoil
Archimedes screw
Enclosed tips/Venturi
Tidal kites Further information on the varying design concepts can be found in appendix 7. 3.2.4 Assessment
During the process of selecting the most suitable design concept for the Big Russel, each method of energy conversion was assessed against the following:
3.2.4.1 Operating depth
Can the concept design operate in the associated depth of the Big Russel? Is its power or any another feature affected by the depth which could in turn, be advantageous or degenerative to its performance?
3.2.4.2 Potential power extraction
What is the potential magnitude of output power?

OFFSHORE RENEWABLE ENERGY FOR GUERNSEY
91
3.2.4.3 Operation and maintenance
Are there any limitations or advantages in its methodology in terms of operation and maintenance? Mainteance is often very costly when assosiated with tidal stream turbines.
3.2.4.4 Installation
How difficult or feasible is installation and does its design lend to any advantages? It is difficult to install a device in fast flowing tides.
3.2.4.5 Industry maturity
How developed is the concept idea, are there a number of developers using a similar methodology? Are there any devices of the particular concept installed or in scale testing?
3.2.4.6 Survivability/durability
Is the concept idea suitable for the prescribed location; is it likely to last a 25 year design life? Will it withstand the harsh marine environment?
3.2.4.7 Shipping and navigation
Would the design have an impact on any shipping or navigation and if so, to what extent?
3.2.4.8 Environmental implications
Does the design have any substantial environmental impacts associated with it; are there any potential positive impacts?
3.2.4.9 The scoring system
Each design category was scored against a criterion using a score of zero to three; zero being extremely poor or having a significant negative impact and three being good, or having an extremely positive impact. In addition to the above scoring system, a weighting factor was applied to each criterion based on the importance of the criteria. A weighting factor of three was applied to environmental implications due to its significance, whereas operation and maintenance was given a weighting factor of one, due to the difficulty in ascertaining information and not necessarily being concept design dependent but specific device dependent. With this method there are limitations and a potential for criticism for showing bias or being arbitrary, however, decisions were based on engineering judgement and the exercise remains quantitative and not qualitative. As with all such decision-making or trade-off tools, there is an element of interpretation and discretion.
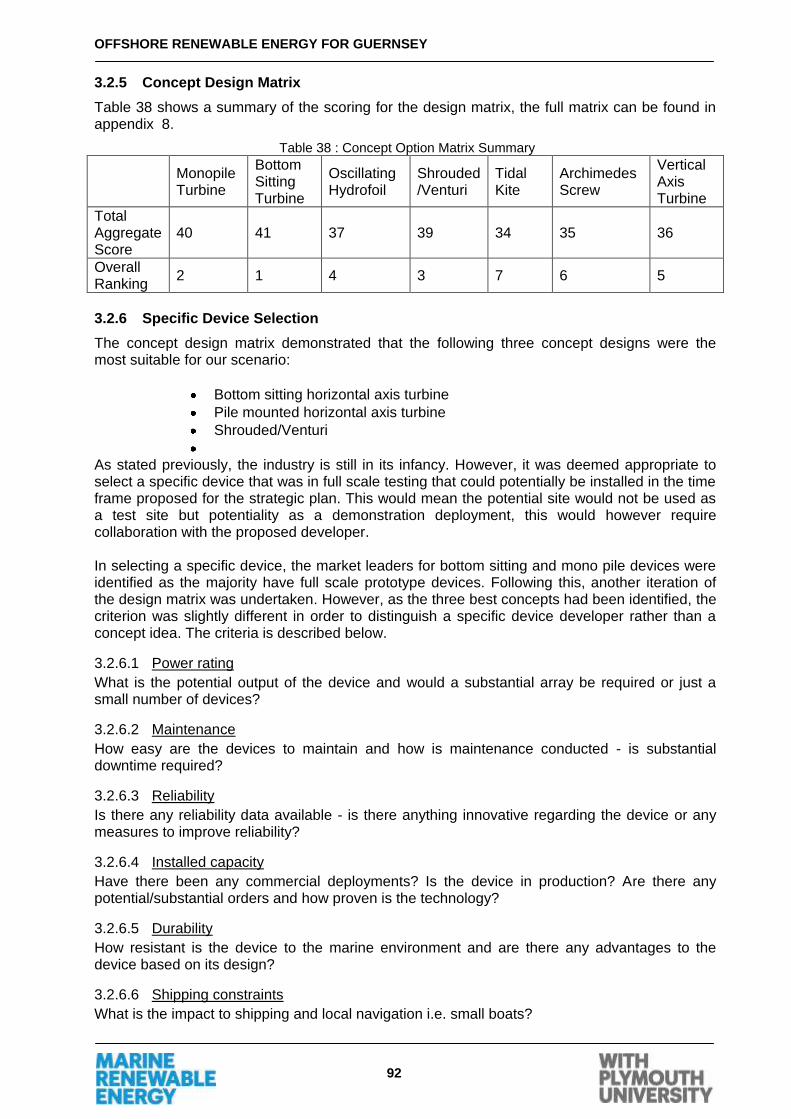
OFFSHORE RENEWABLE ENERGY FOR GUERNSEY
92
3.2.5 Concept Design Matrix
Table 38 shows a summary of the scoring for the design matrix, the full matrix can be found in appendix 8.
Table 38 : Concept Option Matrix Summary
Monopile Turbine
Bottom Sitting Turbine
Oscillating Hydrofoil
Shrouded /Venturi
Tidal Kite
Archimedes Screw
Vertical Axis Turbine
Total Aggregate Score
40 41 37 39 34 35 36
Overall Ranking
2 1 4 3 7 6 5
3.2.6 Specific Device Selection
The concept design matrix demonstrated that the following three concept designs were the most suitable for our scenario:
Bottom sitting horizontal axis turbine
Pile mounted horizontal axis turbine
Shrouded/Venturi
As stated previously, the industry is still in its infancy. However, it was deemed appropriate to select a specific device that was in full scale testing that could potentially be installed in the time frame proposed for the strategic plan. This would mean the potential site would not be used as a test site but potentiality as a demonstration deployment, this would however require collaboration with the proposed developer. In selecting a specific device, the market leaders for bottom sitting and mono pile devices were identified as the majority have full scale prototype devices. Following this, another iteration of the design matrix was undertaken. However, as the three best concepts had been identified, the criterion was slightly different in order to distinguish a specific device developer rather than a concept idea. The criteria is described below.
3.2.6.1 Power rating
What is the potential output of the device and would a substantial array be required or just a small number of devices?
3.2.6.2 Maintenance
How easy are the devices to maintain and how is maintenance conducted - is substantial downtime required?
3.2.6.3 Reliability
Is there any reliability data available - is there anything innovative regarding the device or any measures to improve reliability?
3.2.6.4 Installed capacity
Have there been any commercial deployments? Is the device in production? Are there any potential/substantial orders and how proven is the technology?
3.2.6.5 Durability
How resistant is the device to the marine environment and are there any advantages to the device based on its design?
3.2.6.6 Shipping constraints
What is the impact to shipping and local navigation i.e. small boats?

OFFSHORE RENEWABLE ENERGY FOR GUERNSEY
93
3.2.7 Full Scale Prototype Devices
The following section demonstrates the specific devices considered.
3.2.7.1 Andritz Hydro Hammerfest
Andritz Hydro Hammerfest is regarded as one of the leading technologys in the field. They have their HS1000, a 1 MW Pre-commercial turbine depolyed at EMEC. The technology has been ear marked by ScottishPower Renewables for use in the Islay and Duncansby sites (Andritz Hydro Hammerfest, 2012) Its design allows flexibility in installation methods; gravity, pile or pin. The devices have a relatively low cut in speed of 1m/s. However its required to operate in depths of 35- 100m, and this is not adequate for the Big Russel when considering spring low tide, traffic, and swell criteria.
Figure 55 : Artists Impression of Andritz Hammerfest Hydro Device (Source - Andritz Hammerfest)
3.2.7.2 Atlantis
Atlantis are an international company who currently have a 1MW device deployed at EMEC which uses an embeded generator in its design and strive to produce economicaly extractable tidal power resource. Simiarly to the Andritz Hammerfest Hydro device, there could be potential restriction in where it could be deployed in the Big Russel due to its required operating depths.

OFFSHORE RENEWABLE ENERGY FOR GUERNSEY
94
Figure 56 : Atlantis Device (Source - Atlantis)
3.2.7.3 Delta Stream
The device design leads to a relatively low profile, with three smaller turbines over one larger turbine; this allows for potential use in the Big Russel. The frame can be lifted out for maintenance onto the deck of a ship. However, this would have to be done in the limited time frame of slack water and would be difficult in the Big Russel during spring tides. There is no requirement to fix to the device to the seabed, reducing the potential environmental impacts. There is an incraeased chance of failure to due to multiple turbines meaning potentially more maintenance. Its reliance on a mooring is also an additional risk.
Figure 57 : Image of the Proposed Delta Stream Device (Source - Delta Stream)
3.2.7.4 Marine Current Turbines (MCT)
The MCT design (shown in Figure 58) has a rated capacity of 1.2MW at 2.4 m/s tidal velocity. Its design allows for easy maintenance of the running gear, by lifting the boom out of the water to gain access to the twin nacelles. Guernsey Electrics have connections with MCT as a former

OFFSHORE RENEWABLE ENERGY FOR GUERNSEY
95
minor shareholder. MCT has a grid connected device at Strangford Lough, demonstrating MCT's reliability and production readiness. The resource within the Big Russel provides a peak velocity of 2.6m/s, but this is only four times a day, and the flow is often below the device‟s cut in speed of 0.8m/s. The depth of the Big Russel is at the upper limit of MCT‟s operational window for its mono pile, at about 35m and this is only at the edge of the channel. In the centre of the channel, depths exceed this limit. The flow speeds for the channel have only been measured near to the centre, and the site specific bathymetry of the channel may provide wildly varying reductions in flow velocities in the depths required to make the deplolyment of the MCT device feasible.
Figure 58 : MCT Demonstation Device (Source - MCT)
3.2.7.5 OpenHydro
The OpenHydro device, Figure 59, povides the highest rating of all tidal devices at present at 2MW. Another positive being that due to its circumferential direct drive generator no lubricants are required. At a height of 23m, it has a relatively shallow profile compared to other horizontal axis tidal turbine devices, while still providing an equivalent swept diameter of 16m. At present OpenHydro are currently involved with multiple projects world wide inlcuding projects at Paimpol-Bréha (France), EMEC and a previous installation at the Minas Passage (Nova Scotia).

OFFSHORE RENEWABLE ENERGY FOR GUERNSEY
96
Figure 59 : OpenHydro Prototype Device (source OpenHydro)
3.2.7.6 Tidal Generation Limited (TGL)
TGL's operational depths are between 30m-80m and as such are ideal for the Big Russel. The nacelle rotates, allowing for capture of non bi-directional tidal flows. TGL have only got a 0.5MW device at present but progress is being made towards a 1MW device. TGL has no other installations other than a prototpe at EMEC. Its cut in speed is 1m/s with a rated velocity of 2.7m/s. There may be an impact on navigation within the Big Russel due to ult due to the height of the subsea structure, however this will depend on the selected site.
Figure 60 : Deployment of Tidal Generation Device (source - Tidal Generation Limited)
3.2.8 Device Options Matrix
Table 39 demonstrates the results from the device selection matrix, the full matrix can be seen in appendix 9.

OFFSHORE RENEWABLE ENERGY FOR GUERNSEY
97
Table 39: Tidal Device Option Matrix Summary
AHM Atlantis Delta Steam
MCT Open hydro
TGL
Total Aggregate Score
20 20 16 20 24 20
Overall Ranking
3 3 4 2 1 3
3.2.9 Device Selection
As can be seen from Table 39, OpenHydro was identified as the most suitable device for the Big Russel. This was largely due to the following reasons:
It is ideally suited to the flow rates at the depths in the Big Russel
Its current reputation and the number of proposed/installed devices, espacially in the region of Guernsey
Its potential 2MW output.
The device has its own dedicated installer vessel
Its potential to pose no significant impact on shipping and navigation
Its lack of lubricants and its envisaged minimal enviromental impacts
Its potential to be deployed in a multipe array setup
Its potential to be deployed as a demonstration device for OpenHydro
It should be noted that a device for the medium term strategic option has been selected based on information and date aviliable in 2012/13. Another technological assesment should be completed to confirm that this is still a viable stategic option in a years time. Due to the rapidly devloping market, the technology availiable at present may not nessarily be suitable in the medium term future for Guernsey.

OFFSHORE RENEWABLE ENERGY FOR GUERNSEY
98
3.3 Tidal Option Installation & Maintenance
3.3.1 Infrastructure and Supply Chain of Tidal Energy
The UK is currently one of the leading countries in the tidal industry with an installed demonstration site, EMEC, which has an OpenHydro device operating at it. However, the industry is still very young, highlighted by OpenHydro only being formed in 2005 and as a result, the infrastructure in place is not substantial. As the industry matures, the technology will evolve and this will have a significant, positive, knock on effect to the onshore infrastructure. The supply chain for the manufacturing, assembly, deployment, operation and maintenance and decommissioning at this stage is sufficiently lacking too and this is because of the industry immaturity. 3.3.2 Tidal Manufacturing Facilities
OpenHydro currently has its head offices in Dublin and its 2,500 m² (27,000 sq ft) manufacturing and assembly plant at the Irish Technical Centre adjacent to the Port of Greenore, County Louth (Figure 61). The facility opened in 2007, once again reiterating the immaturity of this industry. This would be the location of where any of the devices would be manufactured and shipped from to get to the selected site in the Big Russel. Greenore Port is approximately 800km from the Big Russel site and the device would require transportation by sea. However, the devices would not go direct from the Greenore Port to the site by Guernsey. Instead, they would require going from Greenore Port to the port of Cherbourg, in France beforehand. The reason for this is to do with the installation process required. This is discussed in section 3.3.4..
Figure 61 : Open Hydro Manufacture Facility 3.3.3 Tidal Port Options
French global maritime engineering group DCNShas very recently taken control of OpenHydro as the majority stakeholder, with a 59.7% holding in the company (DCNS, 2013). DCNS have reserved space from the PNA (Ports of Normandy Authority) in Cherbourg to develop tidal turbine operations; the 35 hectare expansion for tidal projects is costing the PNA 60 million euros (EU Business, 2013). They are also poised to open a new plant in Cherbourg for tidal energy (Offshore Wind a, 2012). DCNS were also involved in the construction of the specialised OpenHydrp installation barge, the “Triskell”, and have vast prior knowledge of OpenHydro operations in the PNA areas. Table 40 shows how Cherbourg is still the more favoured option.
OpenHydro Manufacture Facility - Greenore Port, County Louth
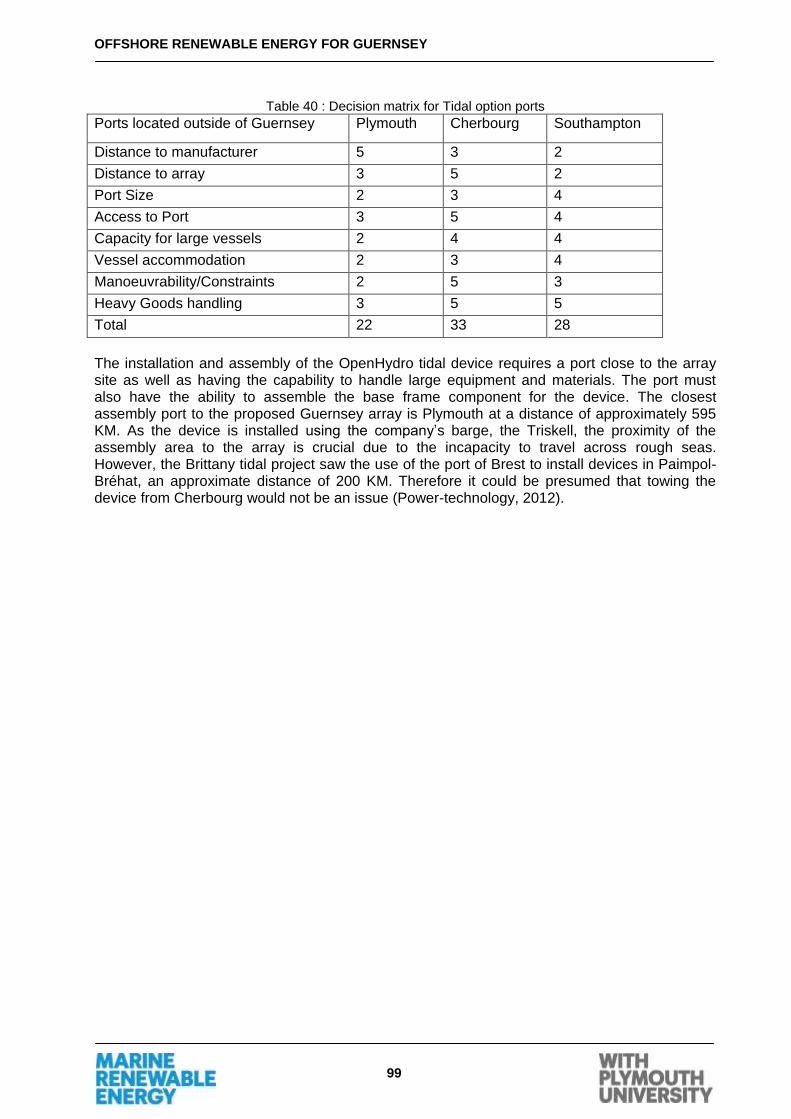
OFFSHORE RENEWABLE ENERGY FOR GUERNSEY
99
Table 40 : Decision matrix for Tidal option ports
Ports located outside of Guernsey Plymouth Cherbourg Southampton
Distance to manufacturer 5 3 2
Distance to array 3 5 2
Port Size 2 3 4
Access to Port 3 5 4
Capacity for large vessels 2 4 4
Vessel accommodation 2 3 4
Manoeuvrability/Constraints 2 5 3
Heavy Goods handling 3 5 5
Total 22 33 28
The installation and assembly of the OpenHydro tidal device requires a port close to the array site as well as having the capability to handle large equipment and materials. The port must also have the ability to assemble the base frame component for the device. The closest assembly port to the proposed Guernsey array is Plymouth at a distance of approximately 595 KM. As the device is installed using the company‟s barge, the Triskell, the proximity of the assembly area to the array is crucial due to the incapacity to travel across rough seas. However, the Brittany tidal project saw the use of the port of Brest to install devices in Paimpol-Bréhat, an approximate distance of 200 KM. Therefore it could be presumed that towing the device from Cherbourg would not be an issue (Power-technology, 2012).
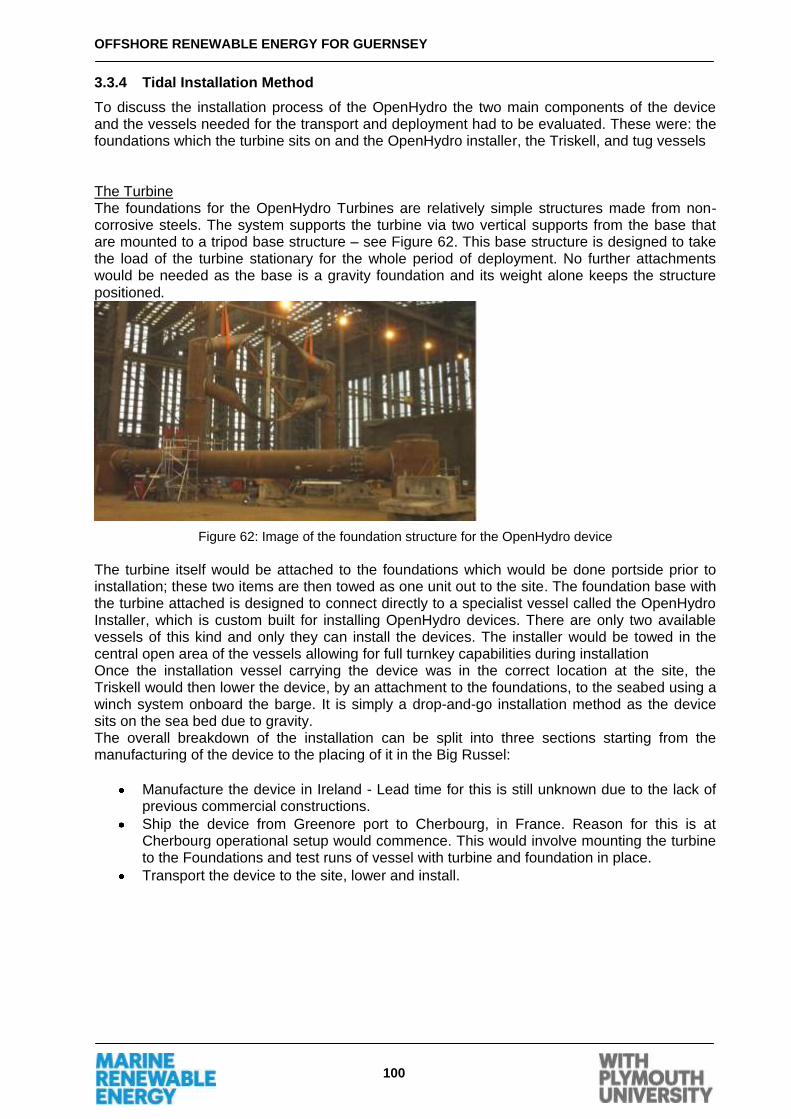
OFFSHORE RENEWABLE ENERGY FOR GUERNSEY
100
3.3.4 Tidal Installation Method
To discuss the installation process of the OpenHydro the two main components of the device and the vessels needed for the transport and deployment had to be evaluated. These were: the foundations which the turbine sits on and the OpenHydro installer, the Triskell, and tug vessels The Turbine The foundations for the OpenHydro Turbines are relatively simple structures made from non-corrosive steels. The system supports the turbine via two vertical supports from the base that are mounted to a tripod base structure – see Figure 62. This base structure is designed to take the load of the turbine stationary for the whole period of deployment. No further attachments would be needed as the base is a gravity foundation and its weight alone keeps the structure positioned.
Figure 62: Image of the foundation structure for the OpenHydro device
The turbine itself would be attached to the foundations which would be done portside prior to installation; these two items are then towed as one unit out to the site. The foundation base with the turbine attached is designed to connect directly to a specialist vessel called the OpenHydro Installer, which is custom built for installing OpenHydro devices. There are only two available vessels of this kind and only they can install the devices. The installer would be towed in the central open area of the vessels allowing for full turnkey capabilities during installation Once the installation vessel carrying the device was in the correct location at the site, the Triskell would then lower the device, by an attachment to the foundations, to the seabed using a winch system onboard the barge. It is simply a drop-and-go installation method as the device sits on the sea bed due to gravity. The overall breakdown of the installation can be split into three sections starting from the manufacturing of the device to the placing of it in the Big Russel:
Manufacture the device in Ireland - Lead time for this is still unknown due to the lack of previous commercial constructions.
Ship the device from Greenore port to Cherbourg, in France. Reason for this is at Cherbourg operational setup would commence. This would involve mounting the turbine to the Foundations and test runs of vessel with turbine and foundation in place.
Transport the device to the site, lower and install.

OFFSHORE RENEWABLE ENERGY FOR GUERNSEY
101
3.3.5 Delay factors
There are many things which may increase the installation time and cost of the device. These are:
Transport time - port of manufacture (Greenore) to port of operations (Cherbourg)
Transport time - port of operations (Cherbourg) to deployment site (Big Russel)
Construction time - needed at port of operations before deployment can begin
Deployment time at site
Rate of cable laying It should be noted that most of these could strongly be affected by the weather conditions. To avoid any delays because of the weather the installation should take place in the summer months between July and August as that is when the best weather conditions are. 3.3.6 Cable installation
A cable would be required to be installed from the site to the Guernsey shore to connect to the grid. This would require a standard cable laying vessel to carry out the task. The port of Cherbourg should be used for the loading of the cable onto the vessel as the cable can be manufactured in France. 3.3.7 Tidal Maintenance
The key issue with the maintenance of a critically damaged device is that it may require extraction and redeployment of key components or even the whole device. As the device is submerged and fixed to the base frame on the sea floor special extraction methods need to be employed. This could be carried out by modified lifting rigs on offshore crane equipment. The lifting rig would need to be able to attach to the devices unique design. The crews and operators would also need special training with such a procedure. The redeployment of the central turbine section to its housing would become difficult in the high flow speeds of the Big Russel. The vessels used for these operations would ideally have positioning technology allowing the raising and lowering to be more on target. The use of underwater crews would also be necessary to inspect the final stages of redeployment.

OFFSHORE RENEWABLE ENERGY FOR GUERNSEY
102
3.4 Associated Environmental Impacts of Tidal Devices
Many of the environmental impacts associated with the installation of an OpenHydro device are similar to those associated with the installation of the proposed wind farm. For example, there will be a new structure on the sea bed and also a cable will have to be installed to transport the energy created back to shore. The impacts created by all these, as discussed in the related sections for the wind farm, would apply to a tidal installation. The issue with the current tidal resource information available is that the specific location of the potential deployment site is impossible to select. This has limited the potential for discussion of detailed site specific information. 3.4.1 Environemental Design Positives of OpenHydro
The OpenHydro device is intentionally designed to reduce the environmental impacts it causes on the environment; this is a huge positive associated with the device. The open centre of the device is designed with the safe passage of marine life in mind; further considerations are seen with the “clean hydrodynamic lines” of the device designed to avoid entanglement of fish (OpenHydro, 2013). The slow speed of the turbine and the fact that the blade tips are encased in the device also minimise potential collisions with marine life (OpenHydro, 2013).Other positives are that no lubricating fluids are used, minimising the potential for contamination of the environment (OpenHydro, 2013). Similar to wind turbines, one of the most common worries associated with tidal turbines is collisions with nature. Marine Current Turbines, the leaders of tidal technology, have had the SeaGen device in commercial use since 2008 in Strangford Lough, Northern Ireland. The potential for collisions with the device was very high due to the presence of a grey seal colony within the Lough. A recently published report has stated that during the first 3 years of operation there have been no major impacts on local marine life, including no collisions (Royal Haskoning, 2012). This is particularly positive with regards to the potential deployment of OpenHydro devices as the SeaGen was not designed with minimal environmental impacts in mind, unlike the OpenHydro device. Another positive associated with the device design is the fact that it allows safe passage over it for certain ships. 3.4.2 Ornithology
As the only current deployed OpenHydro device is at the EMEC test site in the Pentland Firth, the exact impacts on the environment are as yet, not fully understood. However, as with wind turbines, there is a risk of collision, especially with the local bird life which includes diving species such as puffins, guillemots and razorbills (Guernsey Renewable Energy Team, 2011). Again, as with the wind farm installation, it would have to be carried out in the months least impacting to local bird. This is particularly important due to the amount of bird breeding that occurs on either side of the Big Russel (Guernsey Renewable Energy Team, 2011). Further impacts could be caused due to displacement of the species the birds feed on (Alderney Renewable Energy Commission, 2007). 3.4.3 Shipping & Navigation
As previously mentioned, the design of the device allows passage of vessels above it; this however is limited by the size of the vessel. With a rough depth of 45m in the Big Russel at potential deployment sites, 25m of the water column would be left for vessels to travel through. The issue is that certain vessels could potentially travel over the device; however, larger commercial vessels would not safely be able to. As there are no full-scale models in commercial operation, the safety zone requirements and specifications are currently unknown. This is an issue that could only be resolved by consultation of the appropriate stakeholders once a specific location for the device has been chosen.

OFFSHORE RENEWABLE ENERGY FOR GUERNSEY
103
3.4.4 Tourism
Tidal devices, especially seabed devices like the proposed OpenHydro, would have very little, if any, impact on existing tourism since they would essentially be completely out of sight and, therefore, would not be detrimental to the appearance of the marine landscape. Since OpenHydro are non-surface piercing devices, marine recreational activities, such as sailing, would also be unaffected. However, there could be implications for Cruise Ships and their anchorage sites around the archipelago. Any such existing sites would have to be taken into consideration when selecting a site in the Big Russel for the deployment of a tidal array. 3.4.5 Marine Coastal History
Large gravity tidal devices that sit on the seabed, such as OpenHydro, have the potential to directly destroy wrecks and damage ancient landscapes. According to the Guernsey Renewable Energy Team, (2011), there are significant numbers of historic sites in the Big Russel, so careful planning and deployment would be essential to mitigate any potential damage. 3.4.6 Benthic Ecology
The impacts of tidal arrays are similar to the wind device implications to benthic ecology. Introduction of a physical structure on the sea bed and cabling are the main issues causing habitat destruction/alteration. According to OpenHydro (2013), operation of these devices has minimal impacts to the benthic ecology. 3.4.7 Marine Life
As stated in the positives of the OpenHydro device, the open centre is designed for safe passage of marine life. The slow operational speed and encased blade tips minimise potential collisions with marine life. According to OpenHydro (2013), the operational noise is negligible, so there would be minimal impacts to marine life. 3.4.8 Fisheries
The major problems involved in the device interaction with the fisheries industry is that of the competition with potting. Potting is one of the most important fisheries in Guernsey (Guernsey Renewable Energy Team, 2011) and the device would directly compete with potting grounds. Stakeholder engagement will be an important step in resolving any disputes which may occur due to this multiuse of the marine environment.

OFFSHORE RENEWABLE ENERGY FOR GUERNSEY
104
3.5 Economics of Tidal Energy
Tidal stream technologies are still at a relatively early stage of development and they have the potential to become competitive with other generation forms in the future. Tidal energy generation has the advantage over wind generation of being totally predictable. In present market conditions, it is likely to be more expensive than other renewables generation until at least hundreds of megawatts capacity is installed. There is only one commercially operational 1.2MW tidal stream turbine at Strangford Lough, Northern Ireland plus a number of tidal stream energy devices have been deployed at the EMEC site in Orkney for testing. These however need to be deployed through commercial-scale construction projects to have reliable and successful results (DECC, 2011). In terms of tidal energy, the state of the technology within the industry has already been discussed; currently, the industry is immature with high levels of capital expenditure required and greater levels of risk as a result of the developing technology. Currently, the industry has the proven capacity to install single demonstration models. For scenarios similar to those found in the suggested development zones in Guernsey (generally less than 50m depth and tidal streams of around 3 m/s), a leading consultancy firm indicate that the first demonstration of a 10 MW tidal farm is predicted to be operational in 2015 and the first commercial 10MW tidal farm is predicted to be operational in 2017 (MacDonald, 2011). The tidal industry is likely to progress through three main stages in its development. The pre-commercial stage focuses on reliability and cost reduction through design and testing of prototypes under relevant conditions. Pre-commercial projects are a crucial step towards demonstration deployment but are viewed as high risk due to their uncertain success rates and considerable cost. Demonstration stage costs decline but are still in high levels at present market condition, primarily because now we have a much better understanding of device performance and actual capital and operating costs. A major challenge to be addressed is to deliver acceptable capital and operating costs in commercial stage. Many of the companies developing tidal energy technologies are relatively small, start-up businesses with limited financial resources. As a result industry evidence suggests they often struggle to secure the significant levels of up-front investment and working capital needed to move projects from demonstration to large scale commercial deployment.
Figure 63: Capital expenditure for tidal stream technologies (Ernst & Young and Black & Veatch, 2010)
11,193
4,292 3,220
0
2,000
4,000
6,000
8,000
10,000
12,000
Pre-demonstration Demonstration Commercial
£/M
Wh
CAPEX (Capital Expentidure)

OFFSHORE RENEWABLE ENERGY FOR GUERNSEY
105
Figure 64: Operational expenditure for tidal stream technologies (Ernst & Young and Black & Veatch, 2010)
Average learning rate that have been applied to costs, is 13% from first commercial deployment (pessimistic 9%, optimistic 16.9%)
The learning rate assumptions for capex components correspond to an overall learning rate for capex of around 17.1%, in long term leads to savings in the supply chain (Ernst & Young and Black & Veatch, 2010).
There is no available data on actual levels of capital expenditure associated with commercially viable tidal stream devices. It is impossible to forecast accurate indications of likely real costs of tidal projects for beyond 2017. It can been seen on Figure 63 and Figure 64 that costs are estimated to be significantly reduced: some estimates of the levelised cost of energy suggest that it will fall by net amount of 70% by 2035 (Ernst & Young and Black & Veatch, 2010). An analysis of deployment and discussions within the industry suggest that there are many challenges to the deployment of tidal energy. This will require further support for innovation, managing the risks and costs, securing the investment funding and developing supply chain infrastructure. Costs will fall as the industry develops, primarily because tidal energy is unique as a renewable energy generation method because it can provide predictable power to contribute to the security of supply; Clarke et al., (2013) suggest that this will give tidal energy an additional value in future electricity markets. Due to the high costs and risk involved in investing in the industry at this time, it is unlikely to be viable for Guernsey to invest in the technology immediately. Guernsey does have a significant tidal resource and potential locations that would be suitable for tidal stream devices. Due to the extended time scale of marine projects, it is wise to begin data collection at potential sites as recommended in this report, to ensure that when tidal devices become financially viable, the required environmental data is already in place.
470
310
150
0
100
200
300
400
500
Pre-demonstration Demonstration Commercial
£'0
00
/MW
/ye
ar
OPEX (Operational Expentidure)

OFFSHORE RENEWABLE ENERGY FOR GUERNSEY
106
4 LONG TERM STRATEGIC CONSIDERATIONS Due to the substancialy undeveloped industry, wave energy hasn‟t been considered viable for the implementation in the short to medium term. However it should be considered for the longer term strategic plan, an indepth assesment of its appplicability to Guernsey should be underrtaken as a separate study. 4.1.1 Energy Storage
Considering renewable energy as the sole provider of energy, providing 100% of the energy required by a community, then the energy infrastructure will have to contain an energy storage system. Should an energy mix be required, an energy storage solution would help maximise the potential of renewable energy available. The intermittent nature and daily resource cycles of renewable energy demand a solution for smoothing the irregular power input to provide a conditioned, consistent output during regular power consumption and high output during peak times. As development of the renewable energy sector has progressed over the last 20 years, the understanding and development of ways of storing energy has progressed to a point where there are a few leading concepts. 4.1.2 Storage Concepts
4.1.2.1 Batteries
Technology in this area has progressed steadily as the cost reduction of batteries and the cost increase of electricity has progressed. The first notable device was the 40MW system built in Fairbanks, Alaska, in conjunction with the Swiss company ABB, to provide energy security to an electrically isolated 'energy island', a region in the USA which has no grid connection. The Fairbanks battery consists of 13,760 individual NiCad cells, which covers 2000m2. The storage method shown in Fairbanks was designed to be able to power the town while diesel generators came online, but the first battery of a similar scale to be developed purely to stabilise renewable energy output was built in China in 2012. It has a storage capacity of 36MWh, and is designed as a test bed for future developments of battery storage. At $500 million, it is expensive, but the investment into such a facility will lead to reductions in cost and increased efficiencies as well as demonstrating that this type of energy storage is feasible.
4.1.2.2 Hydrogen storage
Hydrogen storage has the potential to make all other forms of energy storage irrelevant due to its high conversion efficiency and energy density in storage. The other added advantage for renewable energy is that you could do away with the cost of electrical grid connectivity, which, for all marine renewable energy developments is a large percentage of the final cost. With hydrogen storage, the marine renewable devices would be hydrogen harvesters; where local vessels would collect the hydrogen on a regular basis to bring back to a industrial sized fuel cell which would then generate the electricity. The economic viability of device hydrogen harvesting over having grid connected devices, where hydrogen would be generated centrally, could be looked at in the future. Either method would however allow for maximum resource extraction, avoiding the times when storms and high winds mean that some turbines have to be turned off as the demand is not as high as the supply. When large wind events occur, all the energy generated by the resource could be exploited, allowing more exportation of energy or security of reserves to better cope with resource fluctuations. The generation of hydrogen would also have the advantage of being able to replace the imported petrol and diesel used by residents of the island to power their vehicles. A further positive being that the technology for fuel cell vehicles is already at an advanced stage. With all the advantages of hydrogen as a means of storage evident, the reason that it is not widely used today is down to the difficulty at present of storage under pressure. This is due to the brittle fatigue that occurs because of the hydrogen permeating through storage materials,

OFFSHORE RENEWABLE ENERGY FOR GUERNSEY
107
making failures and leaks more likely. The storage problem is waiting for the technology to develop, with the possibilities of solid state storage the future for hydrogen.
4.1.2.3 Compressed air energy storage (CAES)
Compressed air energy systems have be around since the 1870's, with cities all over Europe using compressed air as a way of supplying energy to homes and industry; this was then replaced by more efficient electrical energy. The first industrial scale CAES system was developed in Germany in 1978; where air was compressed in an underground cavern when there was low demand and released with higher demand. Most industrial scale CAES systems use geographic structures to store the air so as not to have the compression ratio too high, which causes thermal inefficiencies, as compressing air generates heat. The largest system to date is the 300MW Pacific Gas and Electric CAES, penned for completion in 2016. Geographical constraints may limit this technology at present for Guernsey. However, with the consideration that conventional fibre-reinforced bottles have comparable energy densities as lead acid batteries, CAES could become viable for the future with new technologies. One such technology has been developed by the University of Nottingham, in collaboration with E.ON, to have seabed anchored air storage bags, to store compressed air, which at present are starting at 1-4MW in capacity. This technology at present provides a good fit with offshore wind, with a scale which would suit small scale farms.
4.1.2.4 Smart meters and smart grids
The UK has a framework for installation of smart meters throughout the country between 2014 and 2019. The roll out of over 50 million smart electricity and gas meters provide near real time feedback which will aid the consumer with regards to energy awareness but also to the suppliers as they can watch the trends and patterns of energy usage. In turn, they will be able to provide more reliable and efficient energy for homes and businesses. With the advent of the revolution in energy monitoring comes the much larger concept of a smart grid.
In a smart grid, the live feedback information given from the smart meters and other live feedback loops are able to self regulate the most efficient supply of energy. This combined with open automated demand response (OpenADR) allows for centralised control of utilities such as: high demand washing machines, dishwashers and non urgent industrial processes - turning them off during high demand and on during low demand. This sort of resource efficiency would allow for maximum usage of renewable technologies but also for a levelling of the daily demand cycles that are demonstrated in all developed countries. One development in Bracknell, UK, demonstrated a decrease in peak demand by 45% and development of these smart grid solutions are also beginning in China and the USA (Lundin, 2012).
4.1.2.5 Integrated Electric Car/Bus Storage
Modern electric vehicles have battery capacities between 20 – 50 kWh each. UK consumption patterns state that yearly use of electricity by a typical household is 3,300 kWh; which means a figure for an average household of 9kWh per day. This means that in an electric car such as the Tesla Roadster (53kWh) there is just under 6 days worth of storage potential, which, within a fully integrated and smart grid system could provide the storage capacity that would make renewable energy viable. Electric buses, with their higher storage capacity and the ability to be more easily integrated into public utility programs than private vehicles, may provide a more viable solution. 4.1.3 Energy Storage Summary
At the Solarpraxis Energy Storage Summit held in Dusseldorf, Germany in 2012, the prime focus was on what to do with the surplus renewable energy that Germany would be generating if its 2030 projections came to fruition and how to cope with the days when they where not producing any power at all - spells of up to 7 days. The two technologies they considered were

OFFSHORE RENEWABLE ENERGY FOR GUERNSEY
108
gravity storage, using Norway's vast hydro pumped storage, and hydrogen storage. A study carried out by SINTEF Energy Research Group demonstrated using real-time data of Germany's resources and the current hydro pumped storage facilities in Norway, that the integrity of Germany's electrical infrastructure could be kept intact. Hydrogen storage is less mature, less efficient and more expensive than gravity storage but there are various institutions across Europe which are pursuing technological advances. This support will hopefully reduce costs and improve the efficiencies. Another advantage of this technology is that it would not rely on cross border political cooperation as is not dependant on topographic resources. Guernsey does have some potential for gravity storage systems at the St Saviour Reservoir but there is an obvious concern to the integrity of Guernseys fresh water supply. Jersey might have possibilities for gravity storage in one of its numerous reservoirs. The possibility of shared energy storage facilities between Guernsey and Jersey would allow a reduction in cost.

OFFSHORE RENEWABLE ENERGY FOR GUERNSEY
109
5 CONCLUSIONS & RECOMMENDATIONS This report assesses the potential for a short and medium term solution for Guernsey considering the current state of the industry. The following conclusions have been drawn based on the available data and information. In the short term, it is clear that the only viable option for marine renewable energy in Guernsey is offshore wind; this is due to the maturity of the technology and affordability of the technology. It ihas been shown that the wind resource experienced off the Guernsey shore is excellent and capable of providing 100GWh per year through the installation of four 6MW turbines, creating a 24 MW wind farm. With respect to funding, this project is not only financially viable but also a logical strategic choice given the requirement for security of supply. When this is combined with a backdrop of increasing fuel price volatility, reducing reliance on oil-fired fuel generation methods is an essential step for Guernsey to take. Offshore wind is a proven technology and provided that appropriate funding is in place, the project is feasible in the near future. Based on the current information available, offshore wind turbines will have minimal negative environmental impacts post installation. It has been identified that tidal energy is potentially a promising option for Guernsey, predominantly due to the excellent resource that exists in the Big Russel. However, tidal energy technology is behind offshore wind in terms of development so it cannot be considered immediately. If technology matures sufficiently, this could become a viable option however, in terms of the economic viability of tidal energy, at present the technology appears disproportionately expensive. It would be necessary to carry out a full resource assessment to industry standards (EMEC) to identify optimal locations within the Big Russel. It is recommended that the industry should be monitored in terms of technology development, the situation regarding environmental impacts and how things develop with respect to finance in order to see how the industry changes with respect to making tidal energy a more viable option.
OFFSHORE RENEWABLE ENERGY FOR GUERNSEY
110
6 REFERENCES 4COFFSHORE. (2012). Home. Available: http://www.4coffshore.com. Last accessed 20/11/2012. ABB Power Technologies. Channel Islands Electricity Grid. Available: http://www05.abb.com/global/scot/scot245.nsf/veritydisplay/e787fe9fe44174a3c1256e360040f3cb/$file/project%20channel%20islands%2090%20kv%20xlpe%20subm-land-.pdf. Last accessed 4th January 2013 Acher, J. (2012, August 14th). US energy Green Pensionfunds . Retrieved Novmber 30th, 2012, from Reuters.com: http://www.reuters.com/article/2012/08/14/us-energy-green-pensionfunds-idUSBRE87D0KF20120814 Sarkar, A., Behera, D. (2012). Wind Turbine Blade Efficiency and Power Calculation with Electrical Analogy. International Journal of Scientific and Research Publications. 2 (2). Alderney Renewable Energy Commission. (2007). Strategic Tidal Stream Assessment For Alderney. Andritz Hydro Hammerfest (2012). Sound of Islay Tidal Power Project. Available at -http://www.hammerfeststrom.com/products/tidal-turbines/sound-of-islay-tidal-power-project/. Last accessed – 29/10/12 AWS Scientific, Inc. (1997). Wind Resource Assessment Handbook: Fundamentals for Conducting a Successful Monitoring Program., p. 20 -35. Agency, E. E. (2009, June 8th). Eurpoe's onshore and offshore wind energy. Retrieved Decemeber 21st, 2012, from www.eea.europe.eu: http://www.eea.europa.eu/publications/europes-onshore-and-offshore-wind-energy-potential Airport, G. (2008, Novmber). Airport Times. Retrieved November 30th, 2012, from www.Guersey-Airport.gov.gg: http://www.guernsey-airport.gov.gg/Times%201%20-%20November%2008.pdf A-LORC. (2011, Jannery 1st). LORC. Retrieved Janneruy 3rd, 2013, from LORC: http://www.lorc.dk/offshore-wind-farms-map/alpha-ventus ARRA. (2011). Energy Storage Demonstration. Available:
http://www.sandia.gov/ess/docs/ARRA_StorDemos_4-22-11.pdf. Last accessed 13/1/2013. B-LORC. (2011). Beatrice Demonstration OffShore Wind Datasheet. Retrieved Novmber 30th, 2012, from www.lorc.dk: http://www.lorc.dk/offshore-wind-farms-map/beatrice-demonstratio Brower. M. C., (2012). Wind Resource Assessment: A Practical Guide to Developing a Wind Project. New Jersey: John Wiley & Sons Inc.. p. 15-57. Cabinet-Office. (2008, Jannury 1st). Co-operative Uk. Retrieved Jannury 10th, 2013, from /www.uk.coop: http://www.uk.coop/sites/default/files/starting-a-co-operative_0_0.pdf Clarke, J. A., Grant, A. D., Johnstone, C. M., & Pratt, D. (2013, Jan). A techno-economic analysis of tidal energy technology. Renewable Energy, 49, 101-106. The Crown Estate. (2011). A Guide to an Offshore Wind Farm. London: The Crown Estate.
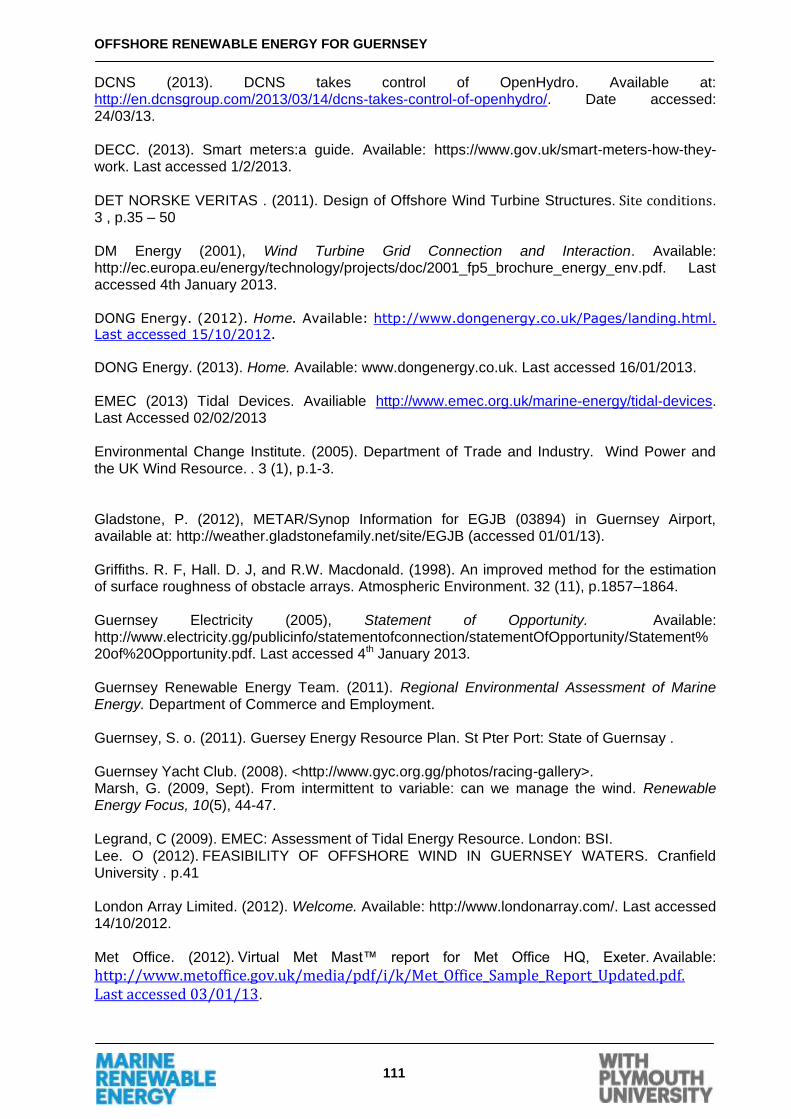
OFFSHORE RENEWABLE ENERGY FOR GUERNSEY
111
DCNS (2013). DCNS takes control of OpenHydro. Available at: http://en.dcnsgroup.com/2013/03/14/dcns-takes-control-of-openhydro/. Date accessed: 24/03/13. DECC. (2013). Smart meters:a guide. Available: https://www.gov.uk/smart-meters-how-they-work. Last accessed 1/2/2013. DET NORSKE VERITAS . (2011). Design of Offshore Wind Turbine Structures. Site conditions. 3 , p.35 – 50 DM Energy (2001), Wind Turbine Grid Connection and Interaction. Available: http://ec.europa.eu/energy/technology/projects/doc/2001_fp5_brochure_energy_env.pdf. Last accessed 4th January 2013. DONG Energy. (2012). Home. Available: http://www.dongenergy.co.uk/Pages/landing.html. Last accessed 15/10/2012.
DONG Energy. (2013). Home. Available: www.dongenergy.co.uk. Last accessed 16/01/2013. EMEC (2013) Tidal Devices. Availiable http://www.emec.org.uk/marine-energy/tidal-devices. Last Accessed 02/02/2013 Environmental Change Institute. (2005). Department of Trade and Industry. Wind Power and the UK Wind Resource. . 3 (1), p.1-3. Gladstone, P. (2012), METAR/Synop Information for EGJB (03894) in Guernsey Airport, available at: http://weather.gladstonefamily.net/site/EGJB (accessed 01/01/13). Griffiths. R. F, Hall. D. J, and R.W. Macdonald. (1998). An improved method for the estimation of surface roughness of obstacle arrays. Atmospheric Environment. 32 (11), p.1857–1864. Guernsey Electricity (2005), Statement of Opportunity. Available: http://www.electricity.gg/publicinfo/statementofconnection/statementOfOpportunity/Statement%20of%20Opportunity.pdf. Last accessed 4th January 2013. Guernsey Renewable Energy Team. (2011). Regional Environmental Assessment of Marine Energy. Department of Commerce and Employment. Guernsey, S. o. (2011). Guersey Energy Resource Plan. St Pter Port: State of Guernsay . Guernsey Yacht Club. (2008). <http://www.gyc.org.gg/photos/racing-gallery>. Marsh, G. (2009, Sept). From intermittent to variable: can we manage the wind. Renewable Energy Focus, 10(5), 44-47. Legrand, C (2009). EMEC: Assessment of Tidal Energy Resource. London: BSI. Lee. O (2012). FEASIBILITY OF OFFSHORE WIND IN GUERNSEY WATERS. Cranfield University . p.41 London Array Limited. (2012). Welcome. Available: http://www.londonarray.com/. Last accessed 14/10/2012. Met Office. (2012). Virtual Met Mast™ report for Met Office HQ, Exeter. Available:
http://www.metoffice.gov.uk/media/pdf/i/k/Met_Office_Sample_Report_Updated.pdf. Last accessed 03/01/13.

OFFSHORE RENEWABLE ENERGY FOR GUERNSEY
112
Mott MacDonald. (2011). Cost of low-carbon generation technologies. Committee on Climate Change
Nasa. (2012). The current and future consequences of global change. Available:
http://climate.nasa.gov/effects . Last accessed 10/01/2013. ISN ETH Zurich. (2012). Oil and Gass by the Numbers. Available: http://www.isn.ethz.ch/isn/Digital-Library/Articles/Special-Feature/Detail/?lng=en&id=153467&contextid774=153467&contextid775=153463&tabid=1453346050. Last accessed 12/01/2013. OffshoreWIND. (2012). UK: GL Garrad Hassan to Provide Celtic Array Met Mast. Available: http://www.offshorewind.biz/2012/11/22/uk-gl-garrad-hassan-to-provide-celtic-array-met-mast/. Last accessed 01/01/13. Oxford Economics. (2012). Review of Guernsey‟s Economic Profile and Assessment of Future Opportunities. Ofgem. (2011). Factsheet 96. Available: http://www.ofgem.gov.uk/Media/FactSheets/Documents1/domestic%20energy%20consump%20fig%20FS.pdf. Last accessed 21/1/2013.
Poidevin, F. L. (2012, Decemeber 28th). Guersey and Renewable Energy: The other side of the coin. Retrieved Jannury 10th, 2013, from www.guernseyfinance.com: http://www.guernseyfinance.com/media/321450/guernsey_and_renewable_energy.pdf Popsci. (2012). China builds world’s largest battery. Available: http://www.popsci.com/science/article/2012-01/china-builds-worlds-largest-battery-36-megawatt-hour-behemoth. Last accessed 19/1/2013. PV magazine. (2012). Norway’s green battery vs. hydrogen storage. Available: http://www.pv-magazine.com/news/details/beitrag/norways-green-battery-vs-hydrogen-storage_100006122/#axzz2HCHNROqc. Last accessed 21/1/2013. REpower Systems. (2012). Home. Available: http://www.repower.de. Last accessed 18/10/2012. RET. (2011). feasiblity Study into Offshore Wind Energy. St Peter Port: State of Guernsey: Commerce and Employment. RWE. (No Date). Taffely Wind Farm: a repowering project. Available: http://www.rwe.com/web/cms/en/592616/rwe-innogy/sites/wind-onshore/united-kingdom/in-development/site-summary/. Last accessed 29/10/2012. Sangur, M. (2010). Optimum Wind Turbine Spacing. Available: http://www.brighthub.com/environment/renewable-energy/articles/97151.aspx. Last accessed 3/11/2012. Siddle, D.R. Warrington, E.M. and S.D. Gunashekar. (2006). TRANSHORIZON PROPAGATION OVER THE SEA: OBSERVATIONS AND. Proc. „EuCAP 2006‟,. 1 (1), 1-5. SIEMENS Energy. (2012). Home. Available: http://www.energy.siemens.com/entry/energy/hq/en/. Last accessed 01/12/2012. Siemens (2012), Siemens 6.0MW Offshore Wind Turbine. Available: http://www.energy.siemens.com/hq/pool/hq/power-generation/renewables/wind-power/6_MW_Brochure_Jan.2012.pdf. Last accessed 13th November 2012.

OFFSHORE RENEWABLE ENERGY FOR GUERNSEY
113
States of Guernsey. (2011). Sea Fisheries Section Statistical Report. Department of Commerce and Empolyment. States-of-Guernsy. (2012). Guernsey-Electricty. Retrieved Jannury 10th, 2013, from www.gov.gg: http://www.gov.gg/article/3368/Guernsey-Electricity States of Guernsey (2011), Guernsey Energy Resource Plan. Available: http://www.gov.gg/CHttpHandler.ashx?id=5575&p=0. Last accessed 4th January 2013. The Crown Estate. (2012). Home. Available: http://www.thecrownestate.co.uk. Last accessed 22/12/2012. The Engineer. (2011). Compressed air energy storage has bags of potential. Available: http://www.theengineer.co.uk/in-depth/the-big-story/compressed-air-energy-storage-has-bags-of-potential/1008374.article. Last accessed 20/1/2013. The Telegraph. (2003). Worlds biggest battery switched on in Alaska. Available: http://www.telegraph.co.uk/technology/3312118/Worlds-biggest-battery-switched-on-in- Alaska.html#. Last accessed 10/1/2013. This is Guernsey (2012), Guernsey Electricity price up by 9% next month. Available: http://www.thisisguernsey.com/news/2012/09/14/electricity-price-up-by-9-next-month/. Last accessed 4th January 2013 Vestas. (2012). Home. Available: http://www.vestas.com/. Last accessed 15/11/2012. WindPower Programm. (2012). Home. Available: http://www.wind-power-program.com/. Last accessed 16/11/2012.

OFFSHORE RENEWABLE ENERGY FOR GUERNSEY
114
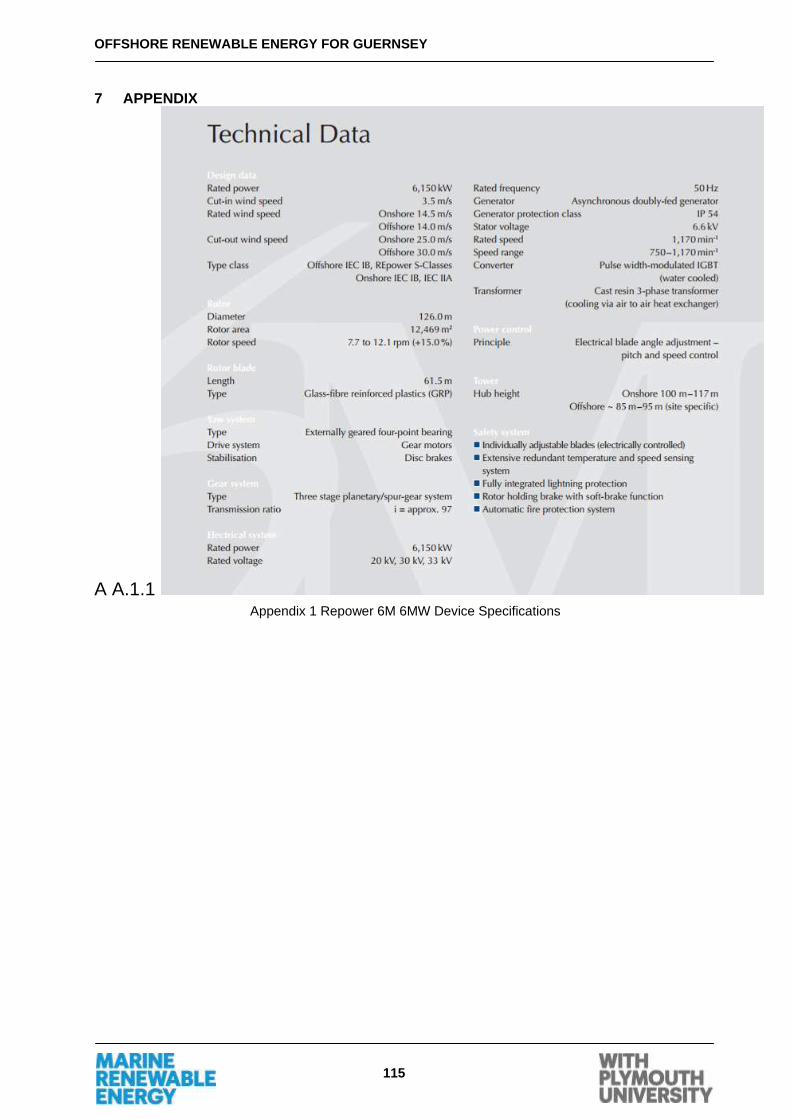
OFFSHORE RENEWABLE ENERGY FOR GUERNSEY
115
7 APPENDIX
A A.1.1 Appendix 1 Repower 6M 6MW Device Specifications
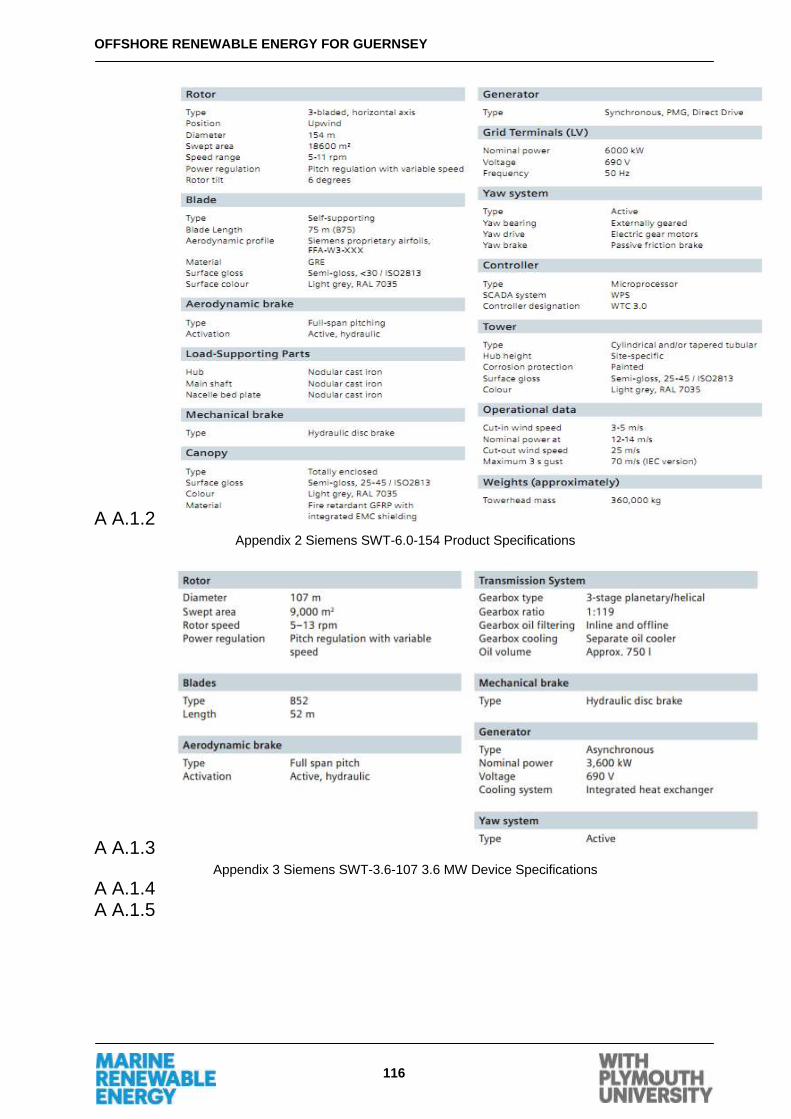
OFFSHORE RENEWABLE ENERGY FOR GUERNSEY
116
A A.1.2 Appendix 2 Siemens SWT-6.0-154 Product Specifications
A A.1.3 Appendix 3 Siemens SWT-3.6-107 3.6 MW Device Specifications
A A.1.4 A A.1.5

OFFSHORE RENEWABLE ENERGY FOR GUERNSEY
117
A A.1.6 Appendix 4 Vestas V164-8.0 8MW Device Specifications
A A.1.7 A A.1.8

OFFSHORE RENEWABLE ENERGY FOR GUERNSEY
118
A A.1.9 Appendix 5 Wind Turbine Array for 4 x SWT 6MW Devices
A A.1.10

OFFSHORE RENEWABLE ENERGY FOR GUERNSEY
119
Appendix 6 Wind Technology Theory
7.1.1 Theory behind wind generated power
The underlying knowledge of power extraction/ conversion of a wind excited turbine are as follows: Force = dynamic pressure x cross sectional area (sweep area)
Energy (work done) =Force x Distance
Power (Watts) = Energy/ Time
7.1.1.1 Betz Limit Calculation
The Albert Betz Law calculates the maximum power extraction efficiency of a horizontal axis turbine, which leads to an upper conversion percentage of no greater than 59.3% of resource available. Using a given wind speed with kinetic energy, the energy is converted into mechanical energy by turning a rotor with a given sweeps area. Assuming that air is an ideal fluid and the turbine blade are acting as an actuator disk, power in a fluid stream can be calculated as:
Figure 65 Flow Though a Disk
Input power = power of the wind passing through cross sectional area
Output power = rate of loss of kinetic energy by the air (extraction by the blades as is illustrated in Figure 65)
Maximum efficiency = output power/ input power
7.1.2 Appendix 7 Concept Design Review
7.1.2.1 Horizontal Axis Turbines
Horizontal axis turbines are a very similar to the common day wind turbine design. The tidal flow causes the blades to rotate; this movement can then be used to generate electricity, as
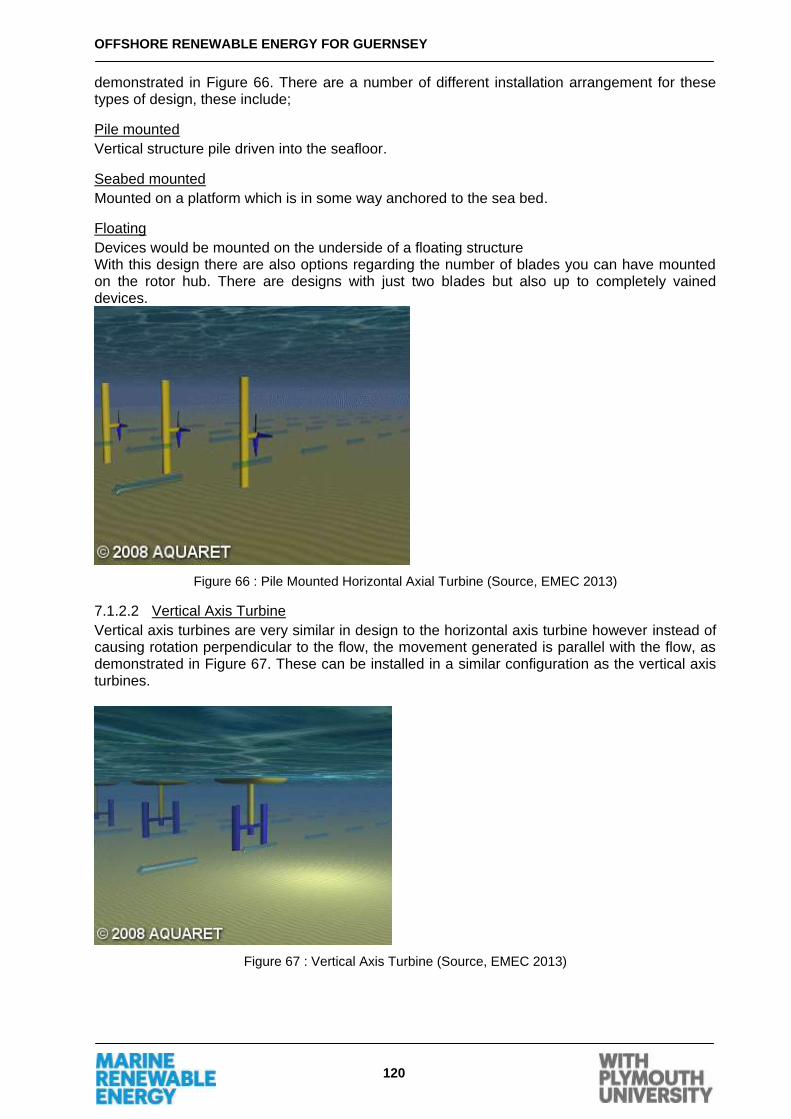
OFFSHORE RENEWABLE ENERGY FOR GUERNSEY
120
demonstrated in Figure 66. There are a number of different installation arrangement for these types of design, these include;
Pile mounted
Vertical structure pile driven into the seafloor.
Seabed mounted
Mounted on a platform which is in some way anchored to the sea bed.
Floating
Devices would be mounted on the underside of a floating structure With this design there are also options regarding the number of blades you can have mounted on the rotor hub. There are designs with just two blades but also up to completely vained devices.
Figure 66 : Pile Mounted Horizontal Axial Turbine (Source, EMEC 2013)
7.1.2.2 Vertical Axis Turbine
Vertical axis turbines are very similar in design to the horizontal axis turbine however instead of causing rotation perpendicular to the flow, the movement generated is parallel with the flow, as demonstrated in Figure 67. These can be installed in a similar configuration as the vertical axis turbines.
Figure 67 : Vertical Axis Turbine (Source, EMEC 2013)

OFFSHORE RENEWABLE ENERGY FOR GUERNSEY
121
7.1.2.3 Oscillating Hydrofoil
The Oscillating Hydrofoil principally uses a hydrofoil to create lift from the tidal flow in a reciprocating manner; this reciprocating action is then used to drive a hydraulic pump to convert the motion into electricity. Figure 68 demonstrates an Oscillating Hydrofoil in its extended position.
Figure 68 : Oscillating Hydrafoil (Source, EMEC 2013)
7.1.2.4 Archimedes Screw
The Archimedes Screw uses the tidal flow to turn a helical shaped device; this movement is used to generate electricity. Figure 69 illustrates a simplistic Archimedes Screw Device.
Figure 69 : Archimedes Screw (Source, EMEC 2013)
7.1.2.5 Enclosed Tips/ Venturi
The devices are usually submerged in the tidal flow, where a funnel shape devices is used to increase the velocity of water (Venturi Effect) which is used to turn a turbine. Figure 70 shows an example of a venturi device.

OFFSHORE RENEWABLE ENERGY FOR GUERNSEY
122
Figure 70 : Enclosed Tip/Venturi (Source, EMEC 2013)
7.1.2.6 Tidal Kites
In a similar fashion as a leisure kite is flown in the wind, a tidal kite use the tidal flow to induce a figure of eight movement in the tide, this increases the velocity of water seen by a turbine mounted in the kite, which is useful in lower velocity tides. Figure 71 shows a surface tethered kite device.
Figure 71 : Tidal Kite (Source, EMEC 2013)
Appendix 8 – Concept Design Matrix Appendix 9 – Design Design Matrix