o&g emissions inventory project: greater san … · o&g emissions inventory project:...
TRANSCRIPT

12 SEPTEMBER 2017
O&G EMISSIONS INVENTORY PROJECT: GREATER SAN JUAN AND PERMIAN BASIN
John Grant, Rajashi Parikh,Amnon Bar-IlanRamboll Environ
1
Tom Moore, Mary UhlWESTAR & WRAP
U.S. Bureau of Land Management

12 SEPTEMBER 2017
• Project overview
• Basin maps: O&G well-site and midstream facility locations
• Inventory inputs
• GHGRP subpart W
• Draft base year (2014) Greater San Juan inventory
• Draft future year (2028) emission inventory methodology
OUTLINE
2

12 SEPTEMBER 2017
EMISSION INVENTORY OVERVIEW
3
• Objective: Develop O&G emission inventories• Base year 2014 and future year 2028• O&G Basins
• Greater San Juan Basin in southern Colorado and northern New Mexico • Permian Basin (portion of the basin in New Mexico only)
• Emission Sources: • nonpoint (O&G well-sites) • point (midstream gas gathering and gas processing)
• Pollutants : NOx, VOC, CO, SOx, PM, GHGs• Mineral ownership: Private/state fee, tribal, and federal

12 SEPTEMBER 2017 4
GREATER SAN JUAN BASIN: 2014 WELL LOCATIONS BY TYPE

12 SEPTEMBER 2017
GREATER SAN JUAN BASIN: 2014 WELL LOCATIONS BY MINERAL OWNERSHIP
5

12 SEPTEMBER 2017 6
GREATER SAN JUAN BASIN: 2014 MIDSTREAM FACILITIES BY SURFACE OWNERSHIP
12 SEPTEMBER 2017
INVENTORY INPUTS
7
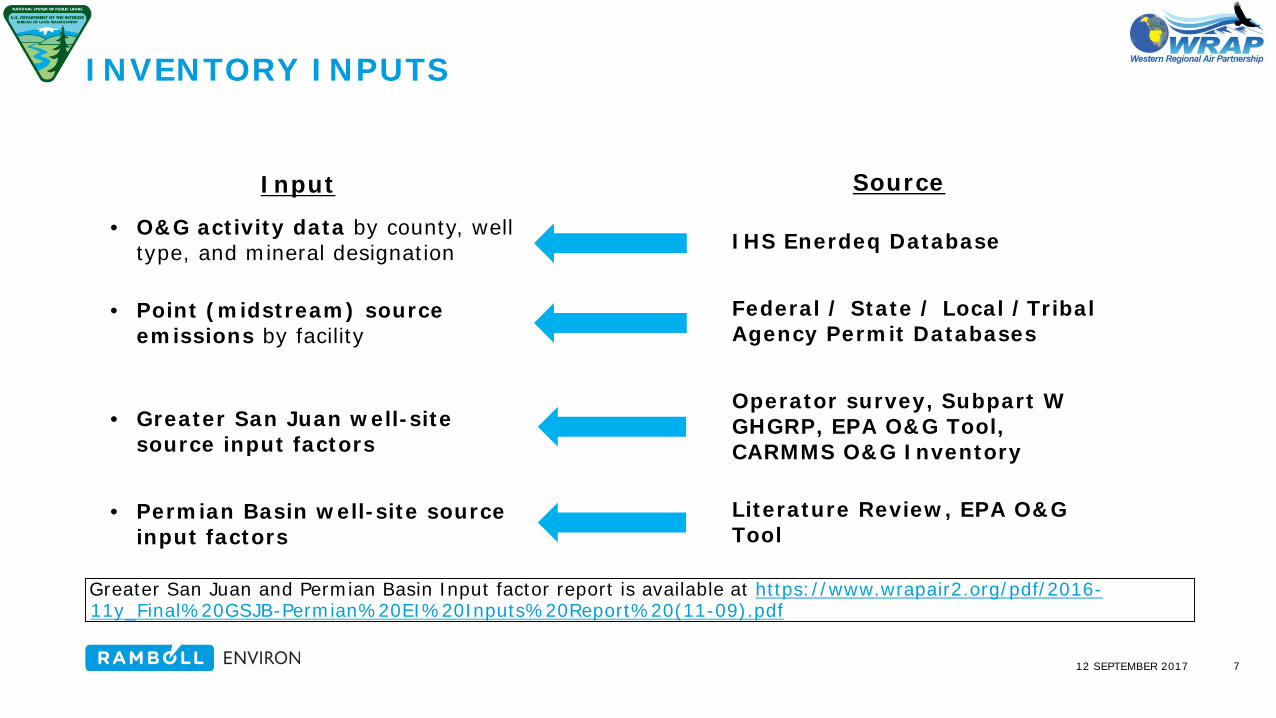
Input
• O&G activity data by county, well type, and mineral designation
• Point (midstream) source emissions by facility
• Greater San Juan well-site source input factors
• Permian Basin well-site source input factors
Source
IHS Enerdeq Database
Federal / State / Local /Tribal Agency Permit Databases
Operator survey, Subpart W GHGRP, EPA O&G Tool, CARMMS O&G Inventory
Literature Review, EPA O&G Tool
Greater San Juan and Permian Basin Input factor report is available at https://www.wrapair2.org/pdf/2016-11y_Final%20GSJB-Permian%20EI%20Inputs%20Report%20(11-09).pdf

12 SEPTEMBER 2017
INVENTORY INPUTS:GHGRP SUBPART W
• Segment applicable to well-site inputs development: Onshore petroleum and natural gas production
• Reporting requirement: Owners or operators of facilities that contain petroleum and natural gas systems and emit 25,000 metric tons or more of GHGs per year
• Typical Input Data Available from Subpart W reporting: population, emission factors for some sources and partial control information
• Subpart W data used to develop Greater San Juan Basin input factors
• Operator provided Subpart W submissions as survey inputs for applicable source categories
• Compiled data from publicly released data for companies that did not respond to survey
• Facility Level Information on GreenHouse Gases Tool (FLIGHT) (https://ghgdata.epa.gov/ghgp/main.do)
• Envirofacts (https://www.epa.gov/enviro/greenhouse-gas-customized-search)
8
12 SEPTEMBER 2017
INVENTORY INPUTS: GHGRP SUBPART W
9
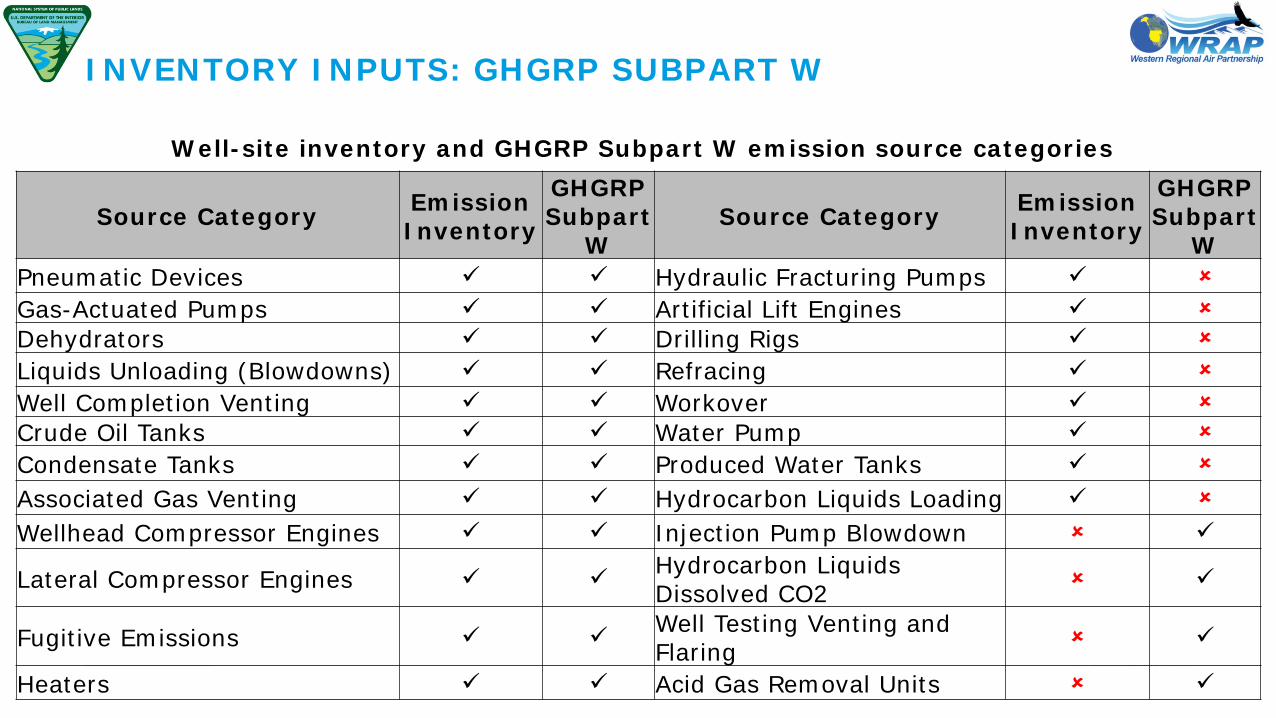
Well-site inventory and GHGRP Subpart W emission source categories
Source Category Emission Inventory
GHGRP Subpart
WSource Category Emission
Inventory
GHGRP Subpart
WPneumatic Devices Hydraulic Fracturing Pumps
Gas-Actuated Pumps Artificial Lift Engines Dehydrators Drilling Rigs
Liquids Unloading (Blowdowns) Refracing
Well Completion Venting Workover Crude Oil Tanks Water Pump
Condensate Tanks Produced Water Tanks
Associated Gas Venting Hydrocarbon Liquids Loading
Wellhead Compressor Engines Injection Pump Blowdown
Lateral Compressor Engines Hydrocarbon Liquids Dissolved CO2
Fugitive Emissions Well Testing Venting and Flaring
Heaters Acid Gas Removal Units

12 SEPTEMBER 2017
2014 EMISSIONS (DRAFT):GREATER SAN JUAN BASIN
10

12 SEPTEMBER 2017
2014 EMISSIONS (DRAFT):GREATER SAN JUAN BASIN
11
2014 Greater San Juan Basin emissions by mineral ownership:Mineral
OwnershipEmissions (tons/year)
NOx VOC CO SOx PM CO2 (e)1
Tribal 14,049 12,471 13,029 65 359 4,718,641Private/State 17,095 17,121 20,326 188 473 5,627,585Federal 28,845 60,472 52,189 66 876 11,508,499Total 59,989 90,064 85,544 319 1,708 21,854,726
• GHG emissions were not estimated for point source facilities for which process level emissions were unavailable
• Super-emitters were not included in emission inventory estimates

12 SEPTEMBER 2017
FUTURE YEAR INVENTORY DEVELOPMENT:OVERVIEW
• 2028 future year for both Greater San Juan and Permian Basins
• Forecasts will be developed by well type and source category at the basin or sub-basin level
• Forecast will account for:
• O&G activity change from base year 2014 to future year 2028
• On-the-books regulatory controls effects on emissions in 2028
12

12 SEPTEMBER 2017
FUTURE YEAR INVENTORY DEVELOPMENT:CONTROLS
Regulations for which Control Scalars
WILL be developed
Regulations for which Control ScalarsWILL NOT be developed
Federal RegulationsNSPS OOOO – O&G Phase I NESHAP Subpart HH (dehydrators)NSPS OOOOa – O&G Phase II Tribal MNSRNSPS JJJJ – Spark-ignited engines Subpart KKKK (turbines)
Farmington RMP Conditions of Approval Standards for Gas Compressors
Point Source Process Heater/Boiler MACT, NSPS
Federal Tier Standards for off-road diesel enginesBLM Methane Rule
State RegulationsColorado Regulation 7 None
13

12 SEPTEMBER 2017
FUTURE YEAR INVENTORY DEVELOPMENT:ACTIVITY FORECASTS (GREATER SAN JUAN BASIN)
• O&G activity growth will be based on forecasts from the US Bureau of Land Management (BLM) study, Colorado Air Resource Management Modeling Study 2.0 (CARMMS)1
• O&G activity forecasts available from CARMMS by subarea:
• Mancos Shale
• Southern Ute Indian Tribe (SUIT) Shale Supplemental Environmental Impact Study (SEIS)
• Tres Rios Field Office (TRFO)
• Farmington Field Office (FFO)
14
1Not yet published

12 SEPTEMBER 2017
FUTURE YEAR INVENTORY DEVELOPMENT:ACTIVITY FORECASTS (GREATER SAN JUAN BASIN)
15
Area1 YearSpud Count
Active Well
Count
Gas Product
ion (BCF/y
r)
Oil Production (Mbbl/yr)
Low Scenario
Mancos Shale
2015 0 0 0 02023 173 1,166 245 21,1142025 173 1,513 283 23,950
SUIT (SEIS)
2015 0 0 0 02023 20 104 49 942025 48 200 102 211
TRFO2015 68 3,498 339 1352023 33 3,831 260 662025 33 3,897 247 59
High Scenario
Mancos Shale
2015 0 0 0 02023 347 2,333 489 42,2282025 347 3,026 566 47,901
SUIT(SEIS)
2015 0 0 0 02023 40 208 99 1872025 96 400 204 423
TRFO2015 68 3,498 339 1352023 82 4,224 323 792025 82 4,389 322 72
CARMMS O&G activity forecasts for 2015, 2023, and 2025:
1 O&G activity in the Farmington Field Office outside of the Mancos Shale conservatively assumed unchanged from base year

12 SEPTEMBER 2017
END
16
Report & other project materials available at: http://www.wrapair2.org/SanJuanPermian.aspx

12 SEPTEMBER 2017
DRAFT FUTURE YEAR ACTIVITY FORECASTS:CARMMS SUB-AREAS
17
Mancos Shale (not shown) intersects the TRFO and FFO areas
Colorado Field Office (FO) Planning Areas
Source:CARMMS report, not yet published

12 SEPTEMBER 2017
DRAFT FUTURE YEAR ACTIVITY FORECASTS: EIA O&G SUPPLY MODULE REGIONS
18EIA Oil and Gas Supply Module Regions

12 SEPTEMBER 2017
DRAFT FUTURE YEAR ACTIVITY FORECASTS: EIA SHALE REGIONS
19
Permian Basin oil plays
(note: Permian Basin forecasts will be developed for New Mexico only, Texas is not part of this study) https://www.eia.gov/todayinenergy/detail.php?id=17031

12 SEPTEMBER 2017
PERMIAN BASIN: 2014 WELL LOCATIONS BY TYPE
20

12 SEPTEMBER 2017
PERMIAN BASIN: 2014 WELL LOCATIONS BY MINERAL OWNERSHIP
21

12 SEPTEMBER 2017
PERMIAN BASIN: 2014 MIDSTREAM FACILITIES BY SURFACE OWNERSHIP
22

12 SEPTEMBER 2017
2014 EMISSIONS (DRAFT):PERMIAN BASIN
23

12 SEPTEMBER 2017
2014 EMISSIONS (DRAFT):GREATER SAN JUAN BASIN
24
2014 Greater San Juan Basin emissions by mineral ownership:
• GHG emissions were not estimated for point source facilities for which process level emissions were unavailable
• Super-emitters were not included in emission inventory estimates
Mineral Ownership
NOx [tons/year]
VOC [tons/year]
CO [tons/year]
SOx[tons/year]
PM [tons/year]
CO2 (e)1
[tons/year]Private/State 19,198 61,422 15,016 8,863 346 9,076,317Federal 11,153 60,222 10,803 3,530 191 6,606,435Total 30,351 121,644 25,819 12,393 537 15,682,752

12 SEPTEMBER 2017
FUTURE YEAR INVENTORY DEVELOPMENT:ACTIVITY FORECASTS (PERMIAN BASIN)
Region / Shale Play
Oil Production (million barrels per
day)
Gas Production (trillion cubic feet
per year)2014 2023 2028 2014 2023 2028
Southwest Region-wideSouthwest 1.74 2.68 2.69 3.56 2.89 3.15
Shale Plays in the Permian Basin (New Mexico)Avalon/Bone Springs 0.19 0.44 0.34 not availableWolfcamp 0.2 0.68 0.73
25
2017 AEO O&G production estimates for 2014 and forecasts to 2023 and 2028
• O&G activity growth will be based on US Energy Information Association (EIA) Annual Energy Outlook (AEO) forecasts