ohe consulting report cra review 020118 final - efpia.eu · 5hylhz ri &5$ uhsruw 2+(...
TRANSCRIPT

Review of CRA report: OHE Consulting 02/01/18
Review of CRA’s Report “Assessing the
economic impacts of changing exemption provisions during patent and SPC
protection in Europe”
Consulting Report for EFPIA
2nd January 2018
Jorge Mestre-Ferrandiz, Mikel Berdud and Adrian Towse
Review of CRA report: OHE Consulting 02/01/18
i
Review of CRA’s Report “Assessing the economic impacts of changing exemption provisions during
patent and SPC protection in Europe”
Mestre-Ferrandiz, J.a, Berdud, M.b and Towse, A.b
aVisiting Fellow, OHE bOHE
Submitted by: OHE Consulting Ltd (a registered company number 09853113) Southside, 7th Floor 105 Victoria Street London SW1E 6QT United Kingdom
For further information please contact Adrian Towse Director Tel: +44 (0)207 747 1407 Or: +44 (0)780 1142 472 [email protected]
Review of CRA report: OHE Consulting 02/01/18
i
About OHE Consulting Reports
Many of the studies OHE Consulting performs are proprietary and the results are not released publicly. Studies of interest to a wide audience, however, may be made available, in whole or in part, with the client’s permission. They may be published by OHE alone, jointly with the client, or externally in scholarly publications. Publication is at the client’s discretion. Studies published by OHE as OHE Consulting Reports are subject to internal quality assurance and undergo a rapid review by a member of the OHE Editorial Committee.
Funding, Acknowledgements and Disclaimer
This study was commissioned and funded by EFPIA. This report represents the views of the authors, and does represent the views of either EFPIA or OHE Consulting. The authors and OHE Consulting do not accept any duty of care or liability of any kind to any party, or any responsibility for damages if any suffered by any party as a result of decisions made or not made or actions taken or not taken based on this report.
Review of CRA report: OHE Consulting 02/01/18
ii
Table of Contents
Executive Summary ............................................................................................... 4
1. Context, Objectives and Approach ................................................................. 20
1.1. Context ................................................................................................. 20
1.2. Objective of this Report ........................................................................... 20
1.3. Our approach ......................................................................................... 20
1.4. The structure of the Report ...................................................................... 21
2. High level issue of global competitiveness ...................................................... 22
3. Summary of CRA’s six scenarios ................................................................... 29
3.1. Scenarios modelled ................................................................................. 29
3.2. Elements of economic impact for each scenario .......................................... 31
4. Scenario 4 ................................................................................................. 33
4.1. Potential effect on European generic manufacturing .................................... 36
4.1.1. Key Issue 1: Identify molecules whose SPC expiry term in Europe occurred later than other third countries. ....................................................................... 37
4.1.1.1. Adjustments to the CRA numbers ................................................. 40
4.1.2. Key Issue 2: Estimated market size that would be available to all generics after losing protection in third country .............................................................. 40
4.1.2.1. Adjustments to the CRA numbers ................................................. 48
4.1.3. Key Issue 3: Share that European generics producers could achieve if they entered during the first year of protection expiry ............................................... 48
4.1.3.1. Challenge 1: Proxy used for market share ...................................... 48
4.1.3.2. Challenge 2: Use of ratios, rather than market shares, to calculate potential sales ............................................................................................ 53
4.1.3.3. Challenge 3: No substitution effect with European innovators ........... 53
4.1.3.4. Challenge 4: Defining the Counterfactual ....................................... 54
4.1.3.5. Adjustments to the CRA numbers ................................................. 55
4.1.4. Key Issue 4: First mover advantages ................................................... 56
4.1.4.1. Adjustments to the CRA numbers ................................................. 57
4.2. Potential effect on European biosimilar manufacturing ................................. 58
4.2.1. Key issue 1 for biosimilars: Sample of biologicals used in the analysis ..... 59
4.2.2. Key issue 2 for biosimilars: Estimated market size that would be available to all biosimilars after losing protection in third country ...................................... 59
4.2.3. Key issue 3 for biosimilars: Share that European biosimilars producers could achieve if they entered during the first year of protection expiry.......................... 60
4.2.4. Key Issue 4 for biosimilars: First mover advantages .............................. 60
4.3. Potential effect on European innovative pharmaceutical industry ................... 61
Review of CRA report: OHE Consulting 02/01/18
iii
4.3.1. Key Issue 5: Estimated market size available to all innovative pharmaceuticals during SPC protection in Europe .............................................. 62
4.3.1.1. Adjustments to the CRA numbers ................................................. 63
4.3.2. Key Issue 6: Share that European innovative companies could achieve and decline in sales .............................................................................................. 63
4.3.2.1. Lost sales to EU innovators .......................................................... 66
4.3.2.2. Adjustments to the CRA numbers ................................................. 66
4.3.3. Key Issue 7: Reduced remaining sales as a result of increased competition .. ...................................................................................................... 66
4.3.3.1. Adjustments to the CRA numbers ................................................. 66
4.4. Assessment of wider impact ..................................................................... 67
4.4.1. Key Issue 8: Increased employment ................................................... 68
4.4.1.1. Adjustments to the CRA numbers ................................................. 69
4.4.2. Key Issue 9: Savings to EU third payers .............................................. 69
4.4.2.1. Adjustments to the CRA numbers ................................................. 71
4.5. Revised estimates ................................................................................... 72
5. Scenario 6 ................................................................................................. 78
5.1. Potential effect on European generic manufacturing .................................... 79
5.1.1. Key Issue 1: Lack of counterfactual ..................................................... 80
5.1.2. Key Issue 2: Drivers of location of manufacturing facilities for first generic entrants ...................................................................................................... 81
5.2. Assessment of potential effects on generic and biosimilar entry in Europe ...... 84
5.2.1. Key Issue 3: Timing of generic entry after protection expiry ................... 85
5.3. Assessment of wider impact of a stockpiling exemption ............................... 85
5.3.1. Key Issue 4: all stockpiling exemption is translated to earlier access to generics ...................................................................................................... 87
5.3.2. Key Issue 5: estimation of savings for the health system does not take into account generic competition ............................................................................ 87
6. Scenarios 1-3 and Scenario 5 ....................................................................... 88
7. Final remarks ............................................................................................. 89
References ......................................................................................................... 90
Appendix 1 Information on the assumed impacts, for each scenario .......................... 92
Appendix 2 Summary of data used by CRA ............................................................. 98
Appendix 3 European generics manufacturers’ market shares ................................. 100
Appendix 4 Data for revised estimates ................................................................. 101
Review of CRA report: OHE Consulting 02/01/18
4
EXECUTIVE SUMMARY
Context and Summary Points
In October 2017 the Commission published the CRA report “assessing the economic impacts of changing exemption provisions during patent and SPC protection in Europe”. (De Coninck et al., 2016 – referred to as “the CRA report” or “CRA” throughout our report) Among other findings, the CRA report concludes that an SPC export and stockpiling exemptions would have significant positive impact on EU manufacturing activity, jobs and trade.
EFPIA is concerned that this report and in particular its assessment of SPC export and stockpiling exemptions, may not provide an appropriate and balanced analysis of the short and long term impact of such exemption provisions. In particular EFPIA wants to ensure the analysis is fit for policy decisions that would support competitiveness for Europe on the global R&D stage, affecting jobs and trade and future patient access to innovative medicines. EFPIA therefore commissioned an in-depth review of the 218-page CRA report from OHE Consulting. This report sets out our findings.
The CRA Report has an underlying assumption that the EU is as globally competitive in generics and biosimilars as it is in innovative products. There is no evidence to support this. The correct industrial strategy for the EU may well be to focus on the development, manufacture and export of innovative products, rather than on lower value generics where EU global competitiveness appears to be weaker.
The CRA report makes estimates of effect using a number of assumptions, data and calculations that we do not find to be correct or which are not explained. Until these anomalies are addressed, our view is that the CRA analysis is not a fit basis for an impact assessment to guide policy.
High Level Global Competitiveness Issues and Implications for EU Trade Policy on IP
The CRA report does not provide a structural analysis of the pharmaceutical industry in Europe for either the branded or generic/biosimilar industries. The CRA Report assumes additional final generic product sales will translate proportionately into additional activity and employment in Europe. This gives rise to two issues:
1. Understanding the exact short term impact on activity within Europe; 2. Putting any change in activity in the context of the medium and long term
competitive position of Europe’s innovative, and generic / biosimilar industries.
In relation to the first issue, it is important to understand how much of the manufacturing activities of larger European generic companies are outsourced abroad (e.g. to India or Russia) or - when within Europe – are labelling and packaging activities. It is important to distinguish between APIs and final generics. CRA discuss these separately but the distinction is lost in subsequent estimation. We do not know the value of European generic exports to the eight countries CRA review. CRA estimate the value
Review of CRA report: OHE Consulting 02/01/18
5
by assuming the European generic industry is as competitive as the innovative based industry.
This takes us straight to the second issue. The European R&D-based companies with HQs in Europe represent more than half of the top 20 companies – which is a higher share than for generic companies. This suggests that European innovative companies are more important globally than their European generics counterparts. They are certainly more important to economic activity and employment in the EU than the generics industry. The situation in the US is even more stark. The US is the most competitive global location for the R&D-based industry. By contrast, only one of the top 20 global generics companies has an HQ in the US.
The Commission needs, in our view, to think about the implications of changing its position on IP in this context. It will be sending a signal to its international trading partners that IP is less important than previously. This may have implications for Free Trade Agreements the EU has already signed (which may not allow manufacturing export waivers or stockpiling) and would certainly have implications for the ability of the Commission to negotiate IP arrangements with new trading partners that provided for additional IP protection to partially compensate for actual patent life lost in the lengthy development, testing and approval process needed for medicines.
A summary of the CRA analysis of Scenario 4 (i.e. SPC export waiver)
We concentrated on Scenario 4, which was also the main focus of CRA’s analysis. There are nine stages to CRA’s analysis and we set out our comments and adjustment on each of the nine stages.
Key Issue 1: Estimating the number of molecules for which there is an earlier IP expiry in eight markets than in Europe
Except for Russia and Turkey, the main source of CRA data was confidential data from European Generics Associaton (EGA), now Medicines for Europe, and one generic company. However, CRA does not provide more evidence as to how much information was provided by EGA and the company respectively. Descriptive data on the sample is limited. We cannot comment on the veracity of the data, but it is of concern that the CRA analysis cannot be replicated.
Australia, Japan, Russia and US are deemed by CRA as “third countries with patent extension terms” – and hence would, at least in theory, have similar protection periods as in Europe. Yet the number of US molecules in the CRA sample is the third largest out of the eight (62%). Given the possibilities of patent extensions in the US, we are unclear why the numbers are that high. The Logendra et al. (2017) analyses shows that there are very few instances where the European SPC / patent expiry is later than protection expiry in other markets. On most occasions the expiry date in Europe is at the same time, or earlier than in the US. Only in 2/25 molecules is there a significant opportunity, as deemed by Logendra et al. (2017), i.e. three or more countries with first SPC expiry in a non-EU country.
Review of CRA report: OHE Consulting 02/01/18
6
Finally, CRA state that its sample of 117 molecules represents 32% of all molecules expiring in the EU during this period. CRA then goes on to argue that their estimated additional generic sales could be up to three times higher. We assume that CRA tried to identify the best-selling products, in which case any suggestion of a proportionate multiplier is misleading.
Although we have concerns about the CRA analysis on Key Issue 1, we do not have enough information to make an appropriate adjustment to the CRA numbers for this element of the study.
However, we outline here what analysis we think is needed to address this issue. The essential step would be to undertake a comprehensive review of the products to lose protection in Europe over the next 15-20 years, and compare expiry dates worldwide, to have the ability to know which products we are referring to. This review needs to be based on an independent source.
Any change in the data can have very important implications. For illustrative purposes, CRA finds 62% of its sample of molecules have earlier expiry dates for the US than in Europe. Logendra et al. (2017) report that only one in 25 molecules the US has an earlier expiration date, which represents 4%. If we apply this adjustment to CRA forecasts for 2025 for the total market (for generics and innovators), its €33bn figure would become €2bn.
Key Issue 2: Estimating the value of the total generic market for these molecules.
Generic market share
CRA explains the methodology to estimate the share of all generics for all countries in Footnote 258 (page 112). Only the Russia and Turkey splits come directly from IMS data. We have not found in the CRA report the actual percentages used for each of the other six countries in their calculations. To allocate exports as between generics and innovators, CRA must have the generic/branded split from IMS for all countries. We do not understand why CRA has not used one consistent source throughout. It is also not clear how forecasts for pharmaceutical sales are derived up to 2030. Such forecasts are important in driving the results as the reference results in the report are 2025 and 2030 figures. Neither the dynamics of sales evolution over time nor how the starting point has been estimated (2016 sales figures in Tables 20-23) are explained. In particular, it is unclear how CRA models the evolution of generic shares at product level in any one country. We are not told whether each molecule is placed on an “erosion” curve, following patent expiry, where the generic drug will gain market at the expense of the originator. Table 26 does show erosion curves for biosimilars, but a similar table is not shown for generics.
This gives rise to a particular problem. Computing the market shares, generics’ account for c70% in these third countries (on average) by value over the forecast period; the remaining 30% by value is for innovative medicines. However, evidence suggests this is too high for generics and the reverse (30:70) is closer to the real position. Footnote 259 states that generics’ share ranges between 16% and 32%. These shares are less than half of the 70% implied by the CRA analysis in Tables 20 and 31. Logendra et al. (2017) presents the evolution of generics and non-generics trends, in value and volume terms,
Review of CRA report: OHE Consulting 02/01/18
7
for three medicines (atorvastatin, esomeprazole and rosuvastatin), in the eight third countries. If we sum up across the three molecules and eight countries, generics make up 36% of the market by 2015, in value terms. This is half what CRA estimates between 2016 and 2030. Additional data from IQVIA supports our finding that CRA’s forecasts of market shares for generics for the period 2016-2030 are too high. Across the eight countries, brands retain 80% share in value terms six months after protection expiry (loss of exclusivity or LoE). This share is c60% three years post LoE. These shares are much higher than the 30% modelled by CRA.
We make an adjustment to the market share estimates to take account of this overestimate. We revise the shares of the total market for brands and generics. Throughout the forecast period, we assume that the share of generics across all countries is 36%, and thus the share for branded is 64%, post-patent expiry.
Originator price response
The modelling assumes no originators response in terms of prices after entry i.e. originators will not react by decreasing prices, fostering further price competition. The second adjustment we make is to model originators’ price response (to the same volume loss) by a further decrease of 20% in the total value of the generics market. This 20% comes from the evidence provided by CRA used to estimate payer savings - this price decrease takes place in Europe, but we assume that price competition will also take place in the third countries. We use a mid-point of the price decreases observed in Europe.
Discounting from List Price
We need to take into account that IMS data used by CRA is at list prices, so it would not capture the discounts/rebates that might be taking place. While CRA acknowledge this fact, it does not estimate the impact these might have on the absolute values. We adjust to account for “net” prices. We are uncertain here, as we are unsure how much discounting currently takes place in the eight countries. We assume a further 20% reduction in the value of total sales – and we assume it applies equally to both generics and branded.
Key Issue 3: Estimating the share of the total generic market for these molecules that would be met by European-based production
To estimate the market share of EU generic companies, CRA combines data on (i) EEA exports to these third countries and (ii) IMS data on sales of brands and generics in these countries. However, the trade data does not distinguish between branded and generics, and the IMS sales data does not distinguish as between origin of manufacturing. Thus CRA assumes that (i) Europe is as competitive in generics as in innovative products in these markets and (ii) the ratios in each sector of total market share supplied by European production is the same. IMS data is by location of generic HQ not of production, so we think it wise to assume that it is an upper bound as

Review of CRA report: OHE Consulting 02/01/18
8
European generic companies will supply some of these markets from non-European plants.
It is important to note that the resulting market shares used by CRA are higher than those reported elsewhere, for example in Logendra et al., 2017. As Table ES1 shows generic market shares in third countries for EU companies for 4 out of 5 case studies in Logendra et al., 2017 are significantly lower than 20%.
Table ES1 European generics market share in third countries Country CRA IMS
Brazil 21% 21%
Japan 24% 5%
Canada 23% 15%
Turkey 23% 15%
Average 23% 14%
Sources: CRA (2016) and Logendra et al. (2017)
Logendra et al. (2017) only has information for the four countries in Table ES1. On this basis CRA market share is overstated by nine percentage points. However, for the average across the eight countries, we have used the same percentages as CRA for the other four countries in order to make a conservative adjustment. The difference between the averages is four percentage points. To implement this change in the model, we reduce the European generics share from 2016 to 2030 by four percentage points; so, in the first instance from 23% to 19%. This adjustment has no effect on branded companies (thus, we are implicitly assuming additional sales go to domestic companies).
We raise in our report other concerns about the market share calculations for which we do not have enough information to make appropriate adjustments:
1. One concern we have about the appropriateness of the methodology used to estimate potential sales is that when they give unrealistic (or indeed impossible) results, the authors do not address the problem – they just use an alternative approach, like setting shares equal to other countries’;
2. If EU generics manufacturers’ main competitors were the EU innovators, the market potential for EU generics manufacturers, in competing with the domestic generics manufacturers, would be considerably lower. It may be that patients want a European guarantee of product quality and will take this from a cheaper European generic rather than a European originator product, if the former is available.
Key Issue 4: Adding an additional market share boost for “first-mover advantage”
CRA add additional sales that European generics producers could achieve under the SPC export waiver to third countries, for two years following the SPC expiry in Europe due to the first mover advantage of earlier generic entry, compared to export sales that could be achieved by European generics producers if they entered the third market in the year of protection expiry in Europe.

Review of CRA report: OHE Consulting 02/01/18
9
CRA undertakes two pieces of analyses to support the existence of first mover advantages in the eight third countries: a literature review and modelling shares of later entrants versus the first entrant – although CRA only has this data for EU5, Russia and Turkey (and for non-biologicals), and thus uses EU5 evidence for the other six countries. In terms of the literature, CRA uses three key papers to support the existence of first mover advantages in the generics sector (Hollis, 2002; Shajarizadeh et al., 2015; and Yu and Gupta, 2008). This literature indicates that any advantage depends on the specifics of the country’s incentive and reimbursement structure. The first two papers are about Canada. It seems there is no incentive for pharmacies in Canada to seek lower prices for their generics, or for new generic entrants to compete on price. Given there are supplier switching costs, the absence of any price benefits for the pharmacy means there is little switching of supplier. The third paper, on the US, finds no first mover advantages in the hospital market.
The literature indicates that the existence of first mover advantages are likely to be very country specific, and thus more analysis is required before we can conclude there would be first mover advantages in markets other than Canada. Projections based on EU5 markets are unlikely to be relevant to other markets.
As a result, the evidence provided by CRA cannot be applied universally across all third countries. This issue merits further country-specific analysis to ascertain the extent to which these advantages exist. Until that analysis is done we remove the additional first mover advantage sales for European-based generics manufacturers.
Potential effect on European biosimilar manufacturing
The methodology for biosimilars is similar as for generics, albeit CRA has more limited data on biologicals and biosimilars. The biosimilar market is certainly most developed in Europe relative to other parts of the world, including the US. This could imply that the European biosimilar industry could be well placed to gain important shares in the third countries. But it is also true that we expect other countries, including the US, to developing their biosimilars market over the next years, which could encourage non-European companies to invest in manufacturing facilities, increasing competition. A number of non-European companies already have biosimilars in the European market.
CRA uses the same step wise approach for biosimilars. It identifies a sample of biological molecules whose SPC term expires in Europe later compared to at least one of the eight third countries studied (Russia, Turkey, US, Canada, China, Brazil, Australia and Japan). However, instead of 117 molecules for generics, CRA only find a total of 17, which is further reduced for the analysis. This is a very low number of molecules on which to base market projections. CRA estimates the share of biosimilars (irrespectively of origin), using evidence from EU5 countries as proxies, with two scenarios. In the Fast Penetration Scenario, it is assumed that biosimilars in third countries (in total, irrespective of where they are manufactured) would achieve the average penetration achieved by biosimilars of filgrastim in the EU5. In the Slow Penetration Scenario, it is assumed that biosimilars in third countries would achieve the average penetration of somatropin and epoetin (weighed by sales in the EU5 countries). There is a dramatic sixfold difference in terms of additional sales estimated for European produced biosimilars as between the fast scenario and the slow one (€2.9bn vs €0.5bn).

Review of CRA report: OHE Consulting 02/01/18
10
We have not made adjustments to the biosimilars (and branded biologicals), as we have been able to in some cases for non-biological generics (and innovators). This is due to the lack of data. We note however that the CRA analysis is at “list” prices. Most biosimilars are dispensed and used in hospitals, and hence there will be heavy discounting. We also note that CRA finds lack of evidence of any first mover effect for biosimilars. Given that switching costs are likely to be higher for biosimilars than generics, this supports our view that, in contrast to CRA’s view, the presence of price competition reduces or eliminates any first mover advantage that may arise from the size of switching costs.
Key Issue 5: Estimating the value of the total post IP market for these molecules for the innovators
CRA looks at the impact on the European innovative pharmaceutical industry, and specifically the lost sales as a result of new generic/biosimilar entry (from European companies) during period following protection expiry in third countries – distinguishing between biologics and non-biologics. For non-biologic brands, the report assumes two drivers for these lost sales, namely the extent to which:
1. SPC export waiver increases generic competition in these markets. 2. These EU innovator companies manufacture inside the EU.
We agree with these two drivers: however, we believe that two others are as important, which are not mentioned:
3. Existing share of the EU innovator companies before patent expiry in the third country, and
4. Their reaction (in terms of price) to generic entry. As mentioned already, CRA assumes there is no price reaction from innovators (see Key Issue 2 – Originators response).
There is no data on Europe manufactured branded medicine export sales (non-biological) into third countries, so CRA relies (as before) on trade statistics on non-biological pharmaceutical imports into each of the eight third countries from EEA. The authors assume the share of branded to generics in imports from the EEA is the same as the share of branded to generics sales in the domestic pharmaceutical sales market, based on IMS Midas data.
As noted in Key Issue 2, market shares of branded products (overall) have been underestimated by CRA. This implies that the first adjustment to the branded market size is to assume their market share is 64%.
In addition, we should note that the adjustments above regarding originators’ price response and ‘list to net’ also apply to innovators sales.
Review of CRA report: OHE Consulting 02/01/18
11
Key Issue 6: Estimating the decline in market share that would be suffered by European-production based innovators
We use the analysis in Logendra et al. (2017) to analyse market shares for some innovators post generic entry in some third countries (section 4.1.2). For branded molecules, the key results are:
- Atorvastatin in Brazil, where the volume of the original brand remained relatively flat. The originator API and tablets are made in the EU.
- Esomeprazole in Turkey. The volume of the original brand continued to rise following the entry of generics.
- In both cases innovator value fell and generic entry increased overall volumes.
Logendra et al. (2017) argue that original brands retain some brand equity in a number of non-European countries several years after generic entry. They also show the importance of generics produced locally, as shown above. They suggest that in some markets, “generics manufactured in Europe are more likely to compete for market share with the original brands (capitalising on the notion of European brand value), than with low-priced domestically manufactured generic products, with which it would be much harder to compete” (page 4). In other words, there is a quality issue for patients. European companies are trusted. Thus the availability of a European generic eliminates the need to buy the European brand. If this is correct, then the estimated loss sales for originators by CRA will be underestimated.
We do not make any adjustment for the EU innovators market share due to lack of data. For EU innovators market shares, Logendra et al. (2017) provides direct evidence of market shares without the need to use proxies. We are unsure why CRA was not able to obtain this data. The extent to which EU generic companies cannibalise EU innovator sales rather than those of local generic producers is an important factor meriting analysis and adjustment for an EU impact assessment.
Key Issue 7: Absence of an estimate of additional lost sales suffered by European-production based innovators as a result of more intense price competition
We have seen before that originators can decrease their price after generic entry, leading to more intense competition. This means that the value of the market decreases. This means, that for the remaining branded sales, the existing volumes will be sold at a lower price, hence reducing the value of its sales. CRA has not considered this issue. We think it is an important effect to model. For this reason, we estimate by how much the remaining sales will be reduced, should prices decrease by 20% as a result of increased competition and originator’s response. This 20% comes from the savings analysis from CRA.

Review of CRA report: OHE Consulting 02/01/18
12
Key Issue 8: Translating increased generic and biosimilar sales, net of the loss of innovator market share, into an estimate of additional employment in the EU.
The methodology used to estimate increased employment as a result of the waiver is the same for biologics and non-biologics. We have a number of issues about their method and data used. In terms of employment, however, we only adjust for the lower net sales figures. We do not make any further adjustments to take account of our concerns. However, we feel further work is required to address the following questions:
What is the correct methodology to link additional sales with additional employment? Low productivity activities result in the most jobs, but not the highest EU value-added.
What is the best data to use? There are very different numbers around.
Generics and innovators provide very different value added per employee. How should this be taken into account?
Key Issue 9: Estimating savings to EU third party payers
In terms of speedier entry leading to savings, on page 150, the CRA report states that “the EU average delay for generics is 8.2 months”, and this delay is critical to estimate the savings. There are a number of issues with how CRA has estimated this delay, and how it is used in the report.
Most importantly, the CRA report states that the resulting savings for third party payers are “illustrative as they assume that the entire delay in generic and a large part of the delay in biosimilar entry is the result of preparing for large scale production” (page 152).
The report cites a number of variables affecting delays, which might be more important than having, or not, the export waiver. CRA does not attempt to explore the relative importance of each factor. We acknowledge this might be difficult, but further analysis based on the literature review could have been done, rather than attributing all of the reduced delays to the export waiver. The results, however illustrative, are misleading.
We do not adjust the CRA numbers as a result of these concerns as we do not have data on which to do this. Before knowing with better precision the potential savings for European payers as a result of the export waiver, it would be necessary to undertake further analysis on the following questions:
Can the export waiver actually reduce delays in entry? Are other factors more important in causing delays?
If the waiver can reduce delays, what would be the additional impact to the existing competitive forces? Here, the evidence discussed in Scenario 6 is relevant, where we argue that additional generic entrants beyond a certain number have limited impact on price competition. The marginal impact of a further entry decreases with the number of entrants i.e. the reduction in price is lower for later entrants.

Review of CRA report: OHE Consulting 02/01/18
13
Overall Impact
Table ES2 shows the results for each of the adjustments we make, relating the back to each of the nine key issues. We distinguish between generics, brands, and net effect.
For generics, we find that after the five adjustments we make, CRA have overestimated additional EU generics sales by a factor of six, falling from €7.6bn to just under €1.3bn (83% reduction). This is before making a number of adjustments we think are appropriate but which CRA do not provide enough data to undertake.
For innovator products, when we take into account both adjustments (revised shares and lower remaining sales), estimated lost sales for EU based innovative companies increases by more than three times, from the original €139m, to €573m. Again, there are a number of adjustments we think are appropriate but which CRA do not provide enough data to undertake.
If we combine additional generics sales with lost branded sales, the net sales could have been overestimated by 10 times, from the original €7.4bn to under €700m. This is before making additional adjustments we think are appropriate but which CRA do not provide enough data for us to undertake.

Review of CRA report: OHE Consulting 02/01/18
14
Table ES2a: Summary of challenges, the impact and our suggested adjustments (if any) for the modelling, FOR GENERICS
Key Issue Weaknesses Impact Adjustment? Revised estimate: additional G sales (cumulative)
1 Sample of molecules Source of data Little information – esp. biologicals Overestimates market potential
Overestimates No adjustment possible given data
NA
2 Market size/share for all generics
Inconsistent use of references / IMS data Unclear methodology for forecasts Too high market shares for generics (overall) –
additional evidence provided
Overestimates Revised shares G: from 70% to 36%
49%
CRA assumes no price response from originator. Although they show price decreases in “savings” analysis. Inconsistent
Overestimates Originators' response: 20% 67%
IMS data at “list” – not realistic. Need “net”
expenditure (rebates and discounts) Overestimates List to net: 20% 59%
3 Market share for EU generics 1st mover advantages
Flawed proxy to estimate EU share – additional evidence provided
No substitution effect with EU innovative (assumed in Sc 5)
Unclear counterfactual
Overestimates Revised shares: from 23% to 19% No further adjustment possible given data
71%
4 First mover advantages Unclear modelling: are these sales additive or substitute?
Literature which supports existence of 1st mover country specific (US/Canada). Might apply to these countries
Requires country-specific analysis
Overestimates Eliminated 83%
Review of CRA report: OHE Consulting 02/01/18
15
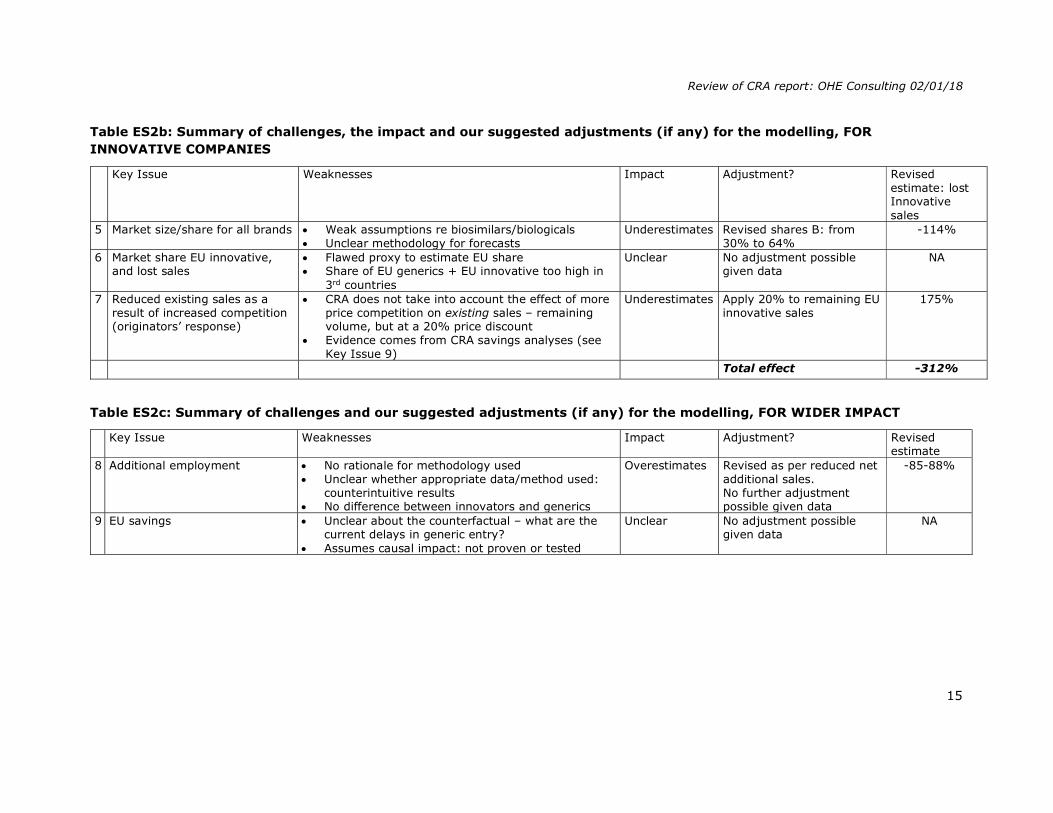
Table ES2b: Summary of challenges, the impact and our suggested adjustments (if any) for the modelling, FOR INNOVATIVE COMPANIES
Key Issue Weaknesses Impact Adjustment? Revised estimate: lost Innovative sales
5 Market size/share for all brands Weak assumptions re biosimilars/biologicals Unclear methodology for forecasts
Underestimates Revised shares B: from 30% to 64%
-114%
6 Market share EU innovative, and lost sales
Flawed proxy to estimate EU share Share of EU generics + EU innovative too high in
3rd countries
Unclear No adjustment possible given data
NA
7 Reduced existing sales as a result of increased competition (originators’ response)
CRA does not take into account the effect of more price competition on existing sales – remaining volume, but at a 20% price discount
Evidence comes from CRA savings analyses (see Key Issue 9)
Underestimates Apply 20% to remaining EU innovative sales
175%
Total effect -312%
Table ES2c: Summary of challenges and our suggested adjustments (if any) for the modelling, FOR WIDER IMPACT
Key Issue Weaknesses Impact Adjustment? Revised
estimate 8 Additional employment No rationale for methodology used
Unclear whether appropriate data/method used: counterintuitive results
No difference between innovators and generics
Overestimates Revised as per reduced net additional sales. No further adjustment possible given data
-85-88%
9 EU savings Unclear about the counterfactual – what are the current delays in generic entry?
Assumes causal impact: not proven or tested
Unclear No adjustment possible given data
NA
Review of CRA report: OHE Consulting 02/01/18
16
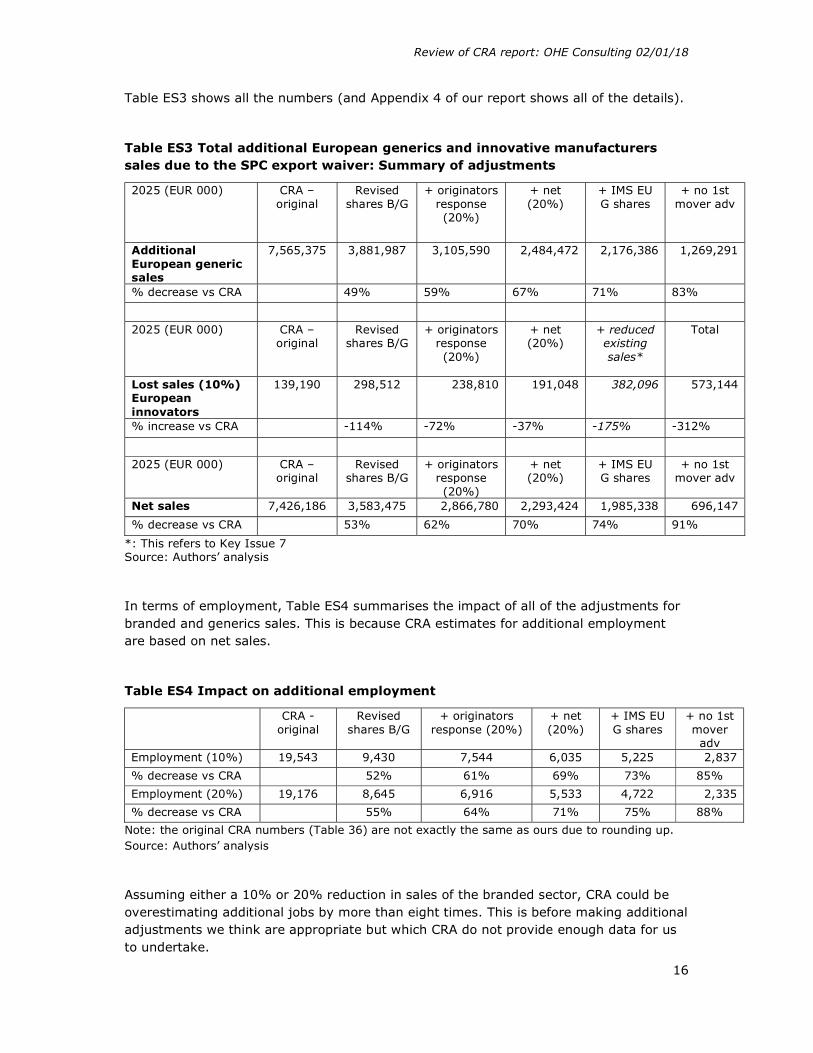
Table ES3 shows all the numbers (and Appendix 4 of our report shows all of the details).
Table ES3 Total additional European generics and innovative manufacturers sales due to the SPC export waiver: Summary of adjustments
2025 (EUR 000) CRA – original
Revised shares B/G
+ originators response (20%)
+ net (20%)
+ IMS EU G shares
+ no 1st mover adv
Additional European generic sales
7,565,375 3,881,987 3,105,590 2,484,472 2,176,386 1,269,291
% decrease vs CRA
49% 59% 67% 71% 83%
2025 (EUR 000) CRA – original
Revised shares B/G
+ originators response (20%)
+ net (20%)
+ reduced existing sales*
Total
Lost sales (10%) European innovators
139,190 298,512 238,810 191,048 382,096 573,144
% increase vs CRA
-114% -72% -37% -175% -312%
2025 (EUR 000) CRA – original
Revised shares B/G
+ originators response (20%)
+ net (20%)
+ IMS EU G shares
+ no 1st mover adv
Net sales 7,426,186 3,583,475 2,866,780 2,293,424 1,985,338 696,147
% decrease vs CRA
53% 62% 70% 74% 91%
*: This refers to Key Issue 7 Source: Authors’ analysis
In terms of employment, Table ES4 summarises the impact of all of the adjustments for branded and generics sales. This is because CRA estimates for additional employment are based on net sales.
Table ES4 Impact on additional employment
CRA - original
Revised shares B/G
+ originators response (20%)
+ net (20%)
+ IMS EU G shares
+ no 1st mover adv
Employment (10%) 19,543 9,430 7,544 6,035 5,225 2,837
% decrease vs CRA
52% 61% 69% 73% 85%
Employment (20%) 19,176 8,645 6,916 5,533 4,722 2,335
% decrease vs CRA
55% 64% 71% 75% 88%
Note: the original CRA numbers (Table 36) are not exactly the same as ours due to rounding up. Source: Authors’ analysis
Assuming either a 10% or 20% reduction in sales of the branded sector, CRA could be overestimating additional jobs by more than eight times. This is before making additional adjustments we think are appropriate but which CRA do not provide enough data for us to undertake.
Review of CRA report: OHE Consulting 02/01/18
17
We have noted above some of the overall competitive and IP issues. The medium and long term consequences for the European R&D-based industry of the EU adopting a different approach to IP in order to promote local (European) generics manufacture is unclear. It is not inconceivable that the impact of this on innovative product sales, and therefore on R&D, could have adverse employment consequences that exceed the, now small, employment gains in the generic sector.
Until some of the anomalies and gaps we have set out are addressed, the CRA analysis is arguably not fit as a basis for an impact assessment to guide policy.
Scenario 6 (Stockpiling)
Currently, stockpiling is not allowed in the EU. CRA’s implicit assumption is that under this situation, domestic producers could face a delay between 3-6 months or longer once the protection expires (in its country) in order to set up large scale manufacturing and prepare stocks for the supply of the market where the protection has expired.
CRA argues that a 6-month stockpiling permission would therefore be translated into earlier entry and additional sales. This is not necessarily correct given that:
Other factors produce delays in European countries, delays which can be longer than six months, making the six-month stockpile redundant. Factors affecting timing of generic entry include:
o Expected profits of entry;
o Delays associated to obtaining a MA;
o Setting up a large scale production;
o Pricing and reimbursement negotiations;
o Loyalty of physicians and patients to reference (innovative) products;
o Demand- and supply-side incentive policies.
Large European generic producers have manufacturing sites located in strategic third country markets and hence entry into the European market is not and would not be affected by a 6-month stockpiling permission. It is plausible to assume then that small companies are locally focused and the impact of the stockpiling exemption on them would not produce a significant difference to their sales elsewhere.
Wider benefits estimated from stockpiling take the form of an impact on price from greater generic competition. Yet there already is competitive entry on day one and evidence suggests that the first three or four entrants are key to driving down price.
As stockpiling is not allowed in any country protected by SPCs, there is no possible counterfactual, so CRA use indirect evidence. There are no EU countries covered by SPCs where stockpiling is currently allowed.
The main link between CRA’s analyses and all conclusions/impacts discussed in the Scenario 6 rest on the following statement “These results are generally consistent with the view that a stockpiling exemption may reduce delays in entry following protection expiry, particularly for domestic generic producers in protected markets” (page 172). However, results of the analyses presented in Table 44 and 45 are strongly caveated as

Review of CRA report: OHE Consulting 02/01/18
18
indirect evidence can only suggest (not prove) that generic producers could benefit from a 6-month stockpiling exemption if other factors delaying the generic entry listed above (e.g. price and reimbursement negotiations, setting up a large scale production, etc.) would not have an impact. For instance, in a country where price and reimbursement negotiations last more than six months in average (which is plausible to assume), the stockpiling exemption would not produce any impact to generic producers sited in protected markets.
We also note that Germany does not fit with CRA’s logic. Germany leads manufacturing of first generic entries across the EEA, by a fair amount versus all other countries (23%), while the next five countries shares are between 18% and 11%. CRA, however, only comments by passing this fact, stating that “the high frequency of observations for Germany is not clear, as it is a country where the SPC would have applied”. This result shows that there are other (more) important factors than the presence or absence of SPC protection driving manufacturing location. Three out of top 20 global generic sellers (including the second, Sandoz-Novartis) are German based. Given their global manufacturing and selling scope, they will have manufacturing sites (or CMOs) located in strategic markets all over the world. A six-month stockpiling permission would have, if any, a minimal impact.
The impact on savings for European payers is therefore likely to be substantially overstated. Literature sets out a decreasing relationship between the number of additional competitors and the price. The first three or four entrants have a big impact on price. Subsequent entrants have a much lower effect. Grabowski (2007), for example, examined generic competition using a sample of 40 products and showed that: (i) the price of a medicine declines as a function of the number of competitors, and; (ii) the magnitude of price decrease declines with the number of entrants.
Scenarios 1-3 and 5 (Bolar exemption and manufacturing exemption for sales in SPC expired EU countries
We have spent less time analysing Scenarios 1-3 and 5. This is in part because we find the counterfactuals used by CRA implausible. In particular for Scenarios 1-3, we think it unlikely that Europe will adopt a “narrow” interpretation of Bolar with the introduction of a Unified Patent Court, and, in respect of Scenario 5 we note the conclusions of Kyle (2017) that continued significant “within EU” SPC differences are likely to disappear.
Review of CRA report: OHE Consulting 02/01/18
19
Final remarks
The CRA Report substantially overstates the Scenario 4 numbers – by a factor of ten. This is before making additional adjustments we think are appropriate but which CRA do not provide enough data for us to undertake. The Scenario 6 benefits are also overstated. The implications of the EU adopting a different IP approach in international negotiations is not considered. It is not inconceivable that the impact of this on innovative product sales, and therefore on R&D, could have adverse employment consequences that exceed employment gains in the generic sector.
The CRA report makes estimates of effect using a number of assumptions, data and calculations that we do not find to be correct or which are not explained. Until these anomalies are addressed, our view is that the CRA analysis is not a fit basis for an impact assessment to guide policy.
The CRA Report has an underlying assumption that the EU is as globally competitive in generics and biosimilars as it is in innovative products. There is no evidence to support this. The correct industrial strategy for the EU may well be to focus on the development, manufacture and export of innovative products, rather than on lower value generics where EU global competitiveness appears to be weaker.

Review of CRA report: OHE Consulting 02/01/18
20
1. CONTEXT, OBJECTIVES AND APPROACH
1.1. Context
On 12 October 2017 the European Commission launched a public consultation on SPCs and patent research exemptions. Two of the options on which the Commission wished to consult were “the introduction of an SPC manufacturing waiver for export” and “stockpiling” prior to SPC expiry within the EU.
As part of this public consultation the Commission released the 218-page CRA report on the assessment of the economic impacts of changing exemption provisions during patent and SPC protection in Europe (De Coninck et al., 2016 – referred to as “the CRA report” or “CRA” throughout our report). Among other findings, the report concludes that an SPC manufacturing exemption for the purposes of export and stockpiling would have significant positive impact on EU manufacturing activity, jobs and trade.
We understand that the Commission does not exclude progressing the proposal for what is often termed as an ‘SPC manufacturing waiver’ under the current Commission, by implication using the CRA Report as part basis for an Impact Assessment.
1.2. Objective of this Report
EFPIA commissioned an in-depth review of the 218-page CRA report from OHE Consulting. The purpose of this review is to give an objective assessment of the CRA report methodology and findings in assessing the economic impact of changing exemption provisions during patent/SPC protection i.e. covering both the scope of the Bolar exemption and the proposal for an SPC manufacturing waiver.
1.3. Our approach
It is not possible within the time available, or within our remit, to undertake a new impact assessment. We have therefore:
read the CRA Report carefully in order to understand the arguments, data sources, methods and assumptions used;
undertaken a very selective literature review, namely: the reports on the “Public consultation on supplementary protection certificates (SPCs) and patent research exemptions” in the Commission’s website, a report commissioned by EFPIA from QuintilesIMS (now IQVIA1) which we refer to as Logendra et al. (2017), and the Pugatch Report commissioned by AbbVie, two papers on the same topic published in the Journal of Generic Medicines, a report published by ECIPE (Bauer, 2017), a few on life sciences clusters, and our previous work on the generics/biosimilars industry. We have also done some internet searches on specific generic/biosimilar companies, reviewed the Medicines for Europe website, identifying a document with a comparison of expiry dates, and briefly explored trade issues relating to Intellectual Property;
read the key references used by CRA on the different aspects of generic competition, as well as on first mover advantages;
1 We refer to this company as IMS or IQVIA indistinctively throughout the report.

Review of CRA report: OHE Consulting 02/01/18
21
obtained some additional data from IQVIA (via EFPIA and PhRMA) on the generic and branded markets in the eight countries reviewed by CRA (and some more specific EU countries).
We have used the results to:
set out in this report the key assumptions CRA makes in its analysis and the issues raised;
outline alternative, and in our view more plausible, assumptions to give a revised assessment of the gains and losses.
In view of the importance of Scenario 4, we have concentrated our efforts on this scenario. We also comment in some depth on Scenario 6. However, as we argue, the economic implications of these analyses, on plausible assumptions, are likely to be much more limited, if at all.
Our analysis of Scenarios 1-3 and Scenario 5 is limited, as they are less relevant to the focus of this review. Moreover, the scenarios looking at leveraging differences between SPC terms in the EU mostly stem from EU progressive enlargement and will disappear in the near-future, so we think they are not relevant and thus do not require policy actions.
1.4. The structure of the Report
The structure of the report is as follows:
We first provide some high-level comments on the competitiveness issue. We summarise CRA’s six scenarios, and a tabular summary of the elements of
economic impact (positive and negative) for each scenario. We then provide a detailed analysis of each scenario. We start from order of
“importance”, in terms of estimated impacts. This means that the order is: Scenario 4; followed by Scenario 6; and then Scenarios 1-3 and Scenario 5.
For each scenario, we provide also a discussion/comparison of CRA’s analysis with other relevant literature we have identified.
Section 7 provides our final remarks, and recommendations.
We set out in the appendices the following:
Appendix 1 contains more information on the assumed impacts, for each scenario.
Appendix 2 summarises the data used by CRA for the analyses. Appendix 3 provides more evidence on European generics manufacturers market
shares in the third countries. Appendix 4 shows all the details of our revised estimates.

Review of CRA report: OHE Consulting 02/01/18
22
2. HIGH LEVEL ISSUE OF GLOBAL COMPETITIVENESS
Before we address CRA’s analyses in detail, we make some high level comments on the underlying issue of the global competitiveness of the European pharmaceutical sector.
While Sections 2 and 3 of the CRA Report provide some useful background about the industry and patent system, the CRA report does not provide a structural analysis of the pharmaceutical industry in Europe, for either the innovative or generic/biosimilar industries. CRA assumes proportionate causal links between the scenarios and additional sales for the European generic/biosimilar industry less lost sales for the innovative one. This assumes that additional sales by EU-based generics companies means EU-produced products. This might not be the case, as EU-based generics companies have manufacturing facilities outside Europe. Behind this are underlying CRA assumptions about the competitiveness of European generic / biosimilar and innovative companies and of Europe as a production location.
This gives rise to two issues:
1. understanding the exact short term impact on activity within Europe; 2. putting any change in activity in the context of the medium and long term
competitive position of Europe’s innovative, and generic / biosimilar industries.
Before we pick these two issues in turn, it is also important to emphasise that CRA uses some confidential data sources, and that there are inconsistencies in the data and sources used for the different elements analysed by the authors. As a result, the analysis cannot be replicated.
Also, we feel there is a lack of clarity on what percentage of products are in play (i.e. where an SPC is valid in the EU but there is no protection in key export markets). This is key, as it determines the potential impact.
Short term impact on activity within Europe
In terms of understanding the exact short term impact on activity within Europe, evidence about the following parameters would have been useful:
Location of (European) generic/biosimilar companies – including manufacturing and R&D facilities (and not just headquarters). While Figure 9 on page 107 is useful (Map of European countries with generic medicines R&D and manufacturing facilities), no more detail is provided;
Activities performed in Europe by generic/biosimilar manufacturers: are they manufacturing pharmaceutical ingredients and finished medicines, or just packaging and labelling?
Location and size of European companies are relevant and a key determinant of the potential impact of the different exemptions modelled in Scenarios 4 and 6. Understanding whether companies have multiple manufacturing sites established globally, including in the EU and other strategic third countries would help to estimate the potential impact of such changes.
Such structural analysis may help to address, for instance, how much of the value generated by generics within Europe is due to companies owned, or manufacturing done, by innovative companies; and how much of the manufacturing activities of larger

Review of CRA report: OHE Consulting 02/01/18
23
European generic companies are outsourced abroad (e.g. to India or Russia) or - when within Europe – are labelling and packaging activities. It is important to distinguish between APIs and final generics. The CRA Report indicates, for example, that Italian and Spanish API manufacturers are far more successful (in terms of market share) at exporting APIs to the US than European headquartered generic companies are at exporting final generic products. However, whilst CRA make an initial important distinction as between API and generic product manufacture, the CRA Report assumes additional final generic product sales will translate proportionately into additional activity and employment in Europe.
More specific information about size, location and R&D investments patterns characterising generic and biosimilar producers would help us better understand to what extent the exemptions may generate the wider benefits (employment, R&D, savings to third party payers).
Global Generic Producers
We have done a quick search on the importance of European generic producers in the top-20 global generic producers by sales. Table 1 includes the top 20 global generics companies (based on 2014 revenue).
Six of these 20 companies have headquarters in Europe; six in India, and two in Canada. Only one generics company has an HQ in the US. Yet the US is the most competitive global location for the R&D-based industry.
The data in Table 1 is consistent with Table 44 in the CRA report. Germany is the main generic producer of generics in Europe. As the CRA report shows (Table 44, p. 169) generic products/molecules manufactured in Germany rank first in terms of first generic entry across the European Economic Area.
Three of these generic manufacturers also develop and manufacture innovative medicines: Sandoz (Germany), an affiliated company of Novartis; Sanofi (France) and Stada (Germany). Apart from these innovative/generic manufacturers, the other three European generic producers in the top-20 have manufacturing sites located within some of the eight third countries analysed by CRA.
Within Europe, Kyle (2014) shows top sellers of unbranded products in Europe. We replicate her Table 5 here. It should be noted that Kyle’s Table 5 (and Table 4) does not show share of sales, but rather “number of product launches (of a unique chemical combination) per observed in the 2016 set of EU member states, not on revenues or market shares”, as “Revenue and market share data is considerably more expensive to obtain” (page 7).

Review of CRA report: OHE Consulting 02/01/18
24
Table 1. Location and global market share of the top-20 global generic manufacturers
Rank Company name Country
Sales (US$)
Global market share
Brand company owned
Other data of interest
1 Teva Israel $9.1bn 12.2% 2 Sandoz Germany $8.5bn 11.7% Novartis Production plants: 4 in Germany
(down from 6*); 3 in the US, (down from 4), 1 in Russia, 1 in China, 3 in Turkey, 1 in Brazil.)
3 Allergan Ireland $6.6bn 8.9% 4 Mylan NA $6.5bn 8.8% 5 Sun
Pharmaceutical India $4.5bn 6%
6 Aspen Pharmacare's
South Africa
$3bn 4.1%
7 Hospira US $2.6bn 3.6% 8 Sanofi France 3.2% Manufacturing 6 drugs in Dubai.
Also manufacturer of innovative medicines
9 Fresenius Germany $2.3bn 3.1% Manufacturing plants in India, Australia and US
10 Lupin India $2bn 2.7% 11 Dr. Reddy's Labs India $1.8bn 2.4% 12 Apotex Canada $1.7bn 2.3% 13 Stada Germany $1.6bn 2.2% 40% of manufacturing are
innovative products and 60% generics. Manufacturing mainly in Russia, Serbia and Vietnam
14 Aurobindo India $1.6bn 2.1% 15 Cipla India $1.4bn 1.9% 16 Krka Group Slovenia $1.3bn 1.8% Manufacturing in Slovenia,
Poland and Russia 17 Valeant Canada $1.2bn 1.6% 18 Zydus Cadila India $1.2bn 1.6% 19 Par
Pharmaceutical NA $1.2bn 1.6%
20 Nichi-Iko Pharmaceutical
Japan $1.2bn 1.6%
*: we do not know if for example production at the remaining sites increased or if production was moved to a non-EU country. Source: Fierce Pharma. Data based on global sales of 2014. https://www.fiercepharma.com/special-report/top-20-generics-companies-by-2014-revenue; Francis (2016) Total global market share covered by the top-20 amounted to around 83% European HQ companies are in bold.

Review of CRA report: OHE Consulting 02/01/18
25
Table 2 Top sellers of generic products in Europe
Source: Kyle (2017)
As expected, the companies listed in Table 1 (global sales) represent the top selling generic companies in Europe (Table 2). With this simple analysis, which should be treated as incomplete, it seems that the big European headquartered generics companies are doing relatively well globally, and are certainly important players in Europe.
In terms of what drives European (and indeed non-European) generic companies’ manufacturing locations, the CRA report does note several times that a number of factors will be important. The literature identified by CRA does not mention “legal protection” as a driver/barrier. This is consistent with our assessment that companies’ investment decisions about the location of manufacturing facilities will be driven primarily by the size of the market and by production costs.
Based on the information we have reviewed, we make three further remarks:
(i) First, European global generics companies have manufacturing sites all over the world, including Europe. Even if, as argued, the scenarios lead to additional sales by European generics companies, it is not clear they will be manufactured in Europe.
(ii) Second, some of the biggest European generics companies are embedded in R&D based companies. This can help integrate manufacturing facilities2. We pick this up later when we talk about biologicals (see footnote 12), where companies seem to share facilities for reference products and biosimilars.
(iii) Third, and related to the second point, manufacturing processes are much more complex and costs are higher for biosimilars versus generics. Thus, the economics are different and different factors will drive location decisions.
2 See for instance, Sandoz CEO presentation looking for integration towards one manufacturing organisation within Novartis (Francis, 2016).

Review of CRA report: OHE Consulting 02/01/18
26
It is beyond the scope of this report to provide a detailed analysis of the European generics industry; however, this quick and high-level analysis challenges some of the inferences and potential impacts the CRA report presents. Moreover, it shows the necessity of performing a structural analysis of the industry before the estimation exercise to better understand and interpret results. We note further CRA do not discuss the impact on SMEs. We are sceptical that they would be able to exploit an export waiver, or a stockpiling exemption outside their local market.
Global R&D-based industry
In relation to the EU based innovative pharmaceutical industry, Kyle (2017) provides two relevant tables, which we replicate here.
Table 3 shows that eight European innovative companies are in the top 20 by global sales. We assume sales for Novartis (as number 3) includes their Sandoz generics sales meaning, from the reference for Table 1, that Sandoz represents 16% of Novartis $58 billion in revenue in 20143.
Table 3 Pharmaceutical firms ranked by 2015 global sales*
* We assume sales and R&D include non-pharma activities.
Source: Kyle (2017)
3 To double check the numbers, we have compared the information on sales for Novartis/Sandoz in the fiercepharma.com article with Table 1 from Kyle (2017): in the former, sales are quoted to be $58 billion in revenue in 2014; in the latter, sales are $46.2 billion (2015). It is beyond the scope of our report to explore the reasons of these differences.

Review of CRA report: OHE Consulting 02/01/18
27
Table 4 replicates Table 4 from Kyle (2017).
Table 4 Top sellers of innovative products in Europe
Source: Kyle (2017)
The European R&D-based companies with HQs in Europe represent more than half of the top 20 companies – which is a higher share than for generic companies. This suggests that European innovative companies are more important globally than their European generics counterparts. We should note, of course, that not all innovative products will be manufactured in Europe.
Medium and long term competitive position of Europe’s innovative, and generic / biosimilar industries
The need for a structural analysis is reinforced when longer term effects are considered. Is Europe likely to be globally competitive in generics and biosimilars in the medium and long term? If the answer is no, then export exemptions (Scenario 4) and stockpiling (Scenario 6) will not have the effect CRA suggest, even after adjusting for our estimates of their overstatement. Indeed European payers will not buy European produced generics and biosimilars if lower priced products are available from outside of the EU. In such circumstances, it is better for European patients, tax payers and social insurance premium payers if these products are imported.
It could be argued – as CRA suggest – that the effects of the Scenario 4 and 6 changes on the innovative industry are so small that encouraging European generics and
Review of CRA report: OHE Consulting 02/01/18
28
biosimilars – even if it is ultimately pointless – has no implications for Europe’s position on two fronts. First, as a base for R&D and manufacturing for the innovative industry. and second, for the amount of R&D that takes place and ultimately the number and type of innovative medicines that are available to European patients. We argue below that there are effects on R&D and innovation. Given the higher value added of the R&D-based industry, and that the data presented above shows that Europe has a stronger global position in the global R&D-based industry than in the global generics and biosimilars industry, it would make sense for European policy to prioritise the R&D-based sector. Again we note that the US is globally competitive in R&D but not in generic or biosimilar manufacture.
Biosimilars are much more complex to make than generics and clinical studies are required, such that Europe is more likely to have a global edge in biosimilars than in generics. It might be the case that the EU’s policy of creating a licensing pathway for biosimilars, long before the US, has encouraged European-based biosimilar companies. However, it is also true that non-European biosimilar companies (including some from Korea) are increasingly becoming important. Moreover, European payer procurement activity indicates that discounts on biosimilars are getting larger over time and that biosimilar markets might evolve similarly to small molecule generic markets. Prices will reflect manufacturing costs, and production location will be driven by cost. We have argued before that whilst direct price intervention for biosimilars and reference products is counterproductive by assuming a degree of interchangeability not initially likely to be reflected in clinicians’ willingness to switch products, the collection of real-world evidence will increase clinician confidence and support more aggressive use of tendering (Mestre-Ferrandiz et al., 2016). This is now happening in the EU.
Implications for EU Trade Policy on IP and the strategic consequences for the R&D-based industry
If the EU were to argue for export waivers this would weaken the global IP system in favour of promoting local production (Bauer, 2017). Our understanding is that DG Trade has consistently argued against measures that erode IP protection in order promote or accelerate domestic production. The short and long term impact of promoting such a measure should be analysed carefully within the context of EU trade policy. For example, we understand that some EU Free Trade Agreements (FTAs), such as the EU-Korea FTA, do not include a “manufacturing waiver” (EU-Korea FTA, article 10.35.2). The Commission needs to look into the consistency of any policy change with existing FTAs.
In short, a “manufacturing waiver” intends to increase incentives for EU-based manufacturers to remain in the EU. This sits uneasily with DG Trade’s objective to fight this type of business localisation. In effect, if a “manufacturer waiver” were to be adopted, then that arguably means the EU is taking a protectionist (“EU-first”) stance against other trading partners that do not have a “manufacturing waiver” in place.

Review of CRA report: OHE Consulting 02/01/18
29
3. SUMMARY OF CRA’S SIX SCENARIOS
In this section we describe the six scenarios modelled, followed by a summary of the elements of impact included in each scenario, distinguishing between the suggested benefits and drawbacks. Appendix 1 contains more information on the assumed impacts, for each scenario. Appendix 2 summarises the data used by CRA for the analyses.
3.1. Scenarios modelled
Scenarios 1 -3 relate to extending the scope of Bolar exemption to cover (i) all medicines, (ii) marketing authorisations in any country, and (iii) allowing supply of APIs within the EU. Figures 1 -3 illustrate the implications of each of the three changes.
Figure 1: Scenario 1: relates to comparative clinical trials
Source: Authors’ analysis, from CRA (2016)
Figure 2: Scenario 2: relates to comparative trials and bioequivalence/similarity tests
Source: Authors’ analysis, from CRA (2016)
Figure 3: Scenario 3: relates to API manufacturers
Source: Authors’ analysis, from CRA (2016)
Scenarios 4 – 6 focus on exemptions to SPCs, for the manufacture of SPC protected medicines in protected (domestic) markets for purposes of selling/exporting to other EU/third countries where the corresponding patent or SPC has expired, and for stockpiling.
Country ANarrow Bolar: can use a patent protected product only for purposes of abridged authorisation procedureThus, a company wishing to do a comparative trial cannot use the comparator in clinical trial in A (until protection has expired in A)
Scenario 1: Extending scope of Bolar exemption to cover all medicines
Country AWide Bolar: can use a patent protected product for comparator trial in A
Country ANarrow Bolar: cannot use a patent protected product in trial/tests done in A to obtain marketing authorisations outside EEA. Applies to both innovators and biosimilars/ generics (comparative trials and bioequivalence/similarity)
Scenario 2: Extending scope of Bolar exemption to cover marketing authorisations in any country
Country AWide Bolar: can use a patent protected product in A to obtain marketing authorisations outside EEA (branded and generics)
Country ANarrow Bolar: European API suppliers cannot manufacture and supply APIs to generic firms conducting tests/trials in A until protection has expired
Scenario 3: Extending scope of Bolar exemption to allow supply of APIs within the EU
Country AWide Bolar: European API suppliers can manufacture and supply APIs to generic firms conducting tests/trials in A
Review of CRA report: OHE Consulting 02/01/18
30
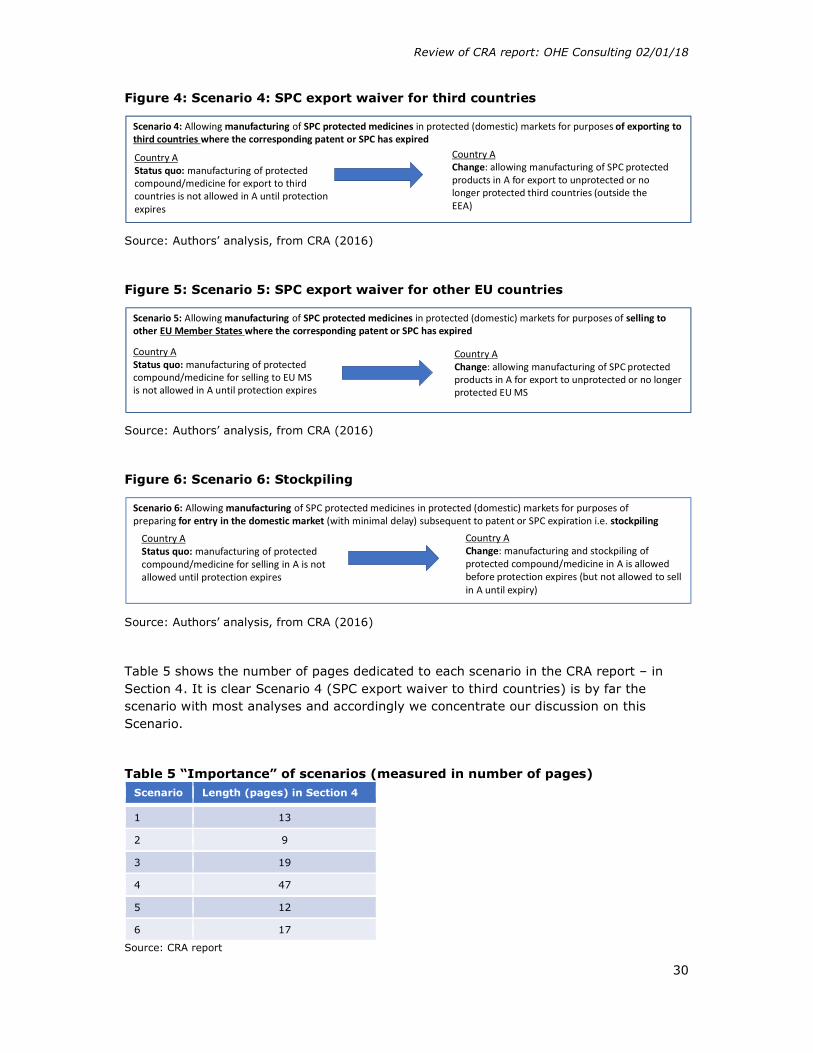
Figure 4: Scenario 4: SPC export waiver for third countries
Source: Authors’ analysis, from CRA (2016)
Figure 5: Scenario 5: SPC export waiver for other EU countries
Source: Authors’ analysis, from CRA (2016)
Figure 6: Scenario 6: Stockpiling
Source: Authors’ analysis, from CRA (2016)
Table 5 shows the number of pages dedicated to each scenario in the CRA report – in Section 4. It is clear Scenario 4 (SPC export waiver to third countries) is by far the scenario with most analyses and accordingly we concentrate our discussion on this Scenario.
Table 5 “Importance” of scenarios (measured in number of pages) Scenario Length (pages) in Section 4
1 13
2 9
3 19
4 47
5 12
6 17
Source: CRA report
Country AStatus quo: manufacturing of protected compound/medicine for export to third countries is not allowed in A until protection expires
Scenario 4: Allowing manufacturing of SPC protected medicines in protected (domestic) markets for purposes of exporting to third countries where the corresponding patent or SPC has expired
Country AChange: allowing manufacturing of SPC protected products in A for export to unprotected or no longer protected third countries (outside the EEA)
Country AStatus quo: manufacturing of protected compound/medicine for selling to EU MS is not allowed in A until protection expires
Scenario 5: Allowing manufacturing of SPC protected medicines in protected (domestic) markets for purposes of selling to other EU Member States where the corresponding patent or SPC has expired
Country AChange: allowing manufacturing of SPC protected products in A for export to unprotected or no longer protected EU MS
Country AStatus quo: manufacturing of protected compound/medicine for selling in A is not allowed until protection expires
Scenario 6: Allowing manufacturing of SPC protected medicines in protected (domestic) markets for purposes of preparing for entry in the domestic market (with minimal delay) subsequent to patent or SPC expiration i.e. stockpiling
Country AChange: manufacturing and stockpiling of protected compound/medicine in A is allowed before protection expires (but not allowed to sell in A until expiry)

Review of CRA report: OHE Consulting 02/01/18
31
3.2. Elements of economic impact for each scenario
Each scenario follows the same structure when looking at the economic impacts:
- Analysis of positive effects for allegedly disadvantaged companies - Analysis of negative effects - Wider impact, in terms of incentives to innovate, attracting activity to Europe,
reduced delays and savings to third party payers.
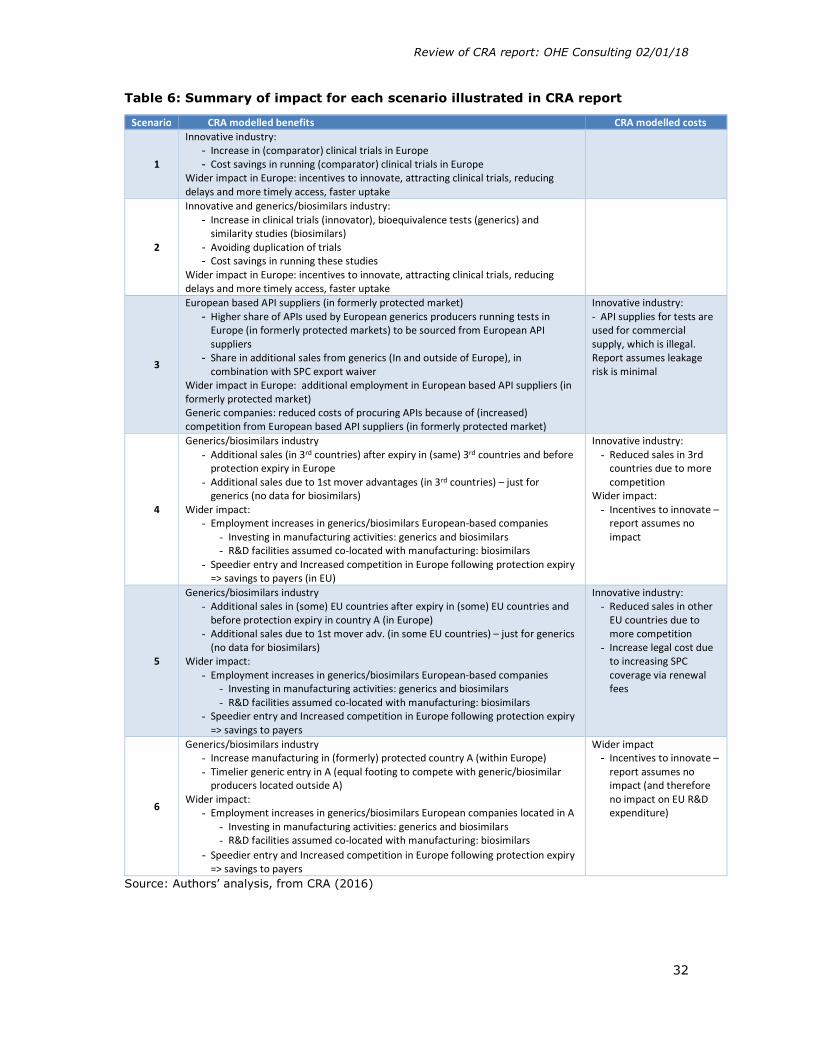
Table 6 summarises the summary of impacts by scenario, distinguishing between the suggested benefits and drawbacks.
Review of CRA report: OHE Consulting 02/01/18
32
Table 6: Summary of impact for each scenario illustrated in CRA report
Scenario CRA modelled benefits CRA modelled costs
1
Innovative industry: - Increase in (comparator) clinical trials in Europe - Cost savings in running (comparator) clinical trials in Europe
Wider impact in Europe: incentives to innovate, attracting clinical trials, reducing delays and more timely access, faster uptake
2
Innovative and generics/biosimilars industry: - Increase in clinical trials (innovator), bioequivalence tests (generics) and
similarity studies (biosimilars) - Avoiding duplication of trials - Cost savings in running these studies
Wider impact in Europe: incentives to innovate, attracting clinical trials, reducing delays and more timely access, faster uptake
3
European based API suppliers (in formerly protected market) - Higher share of APIs used by European generics producers running tests in
Europe (in formerly protected markets) to be sourced from European API suppliers
- Share in additional sales from generics (In and outside of Europe), in combination with SPC export waiver
Wider impact in Europe: additional employment in European based API suppliers (in formerly protected market) Generic companies: reduced costs of procuring APIs because of (increased) competition from European based API suppliers (in formerly protected market)
Innovative industry: - API supplies for tests are used for commercial supply, which is illegal. Report assumes leakage risk is minimal
4
Generics/biosimilars industry - Additional sales (in 3rd countries) after expiry in (same) 3rd countries and before
protection expiry in Europe - Additional sales due to 1st mover advantages (in 3rd countries) – just for
generics (no data for biosimilars) Wider impact:
- Employment increases in generics/biosimilars European-based companies - Investing in manufacturing activities: generics and biosimilars - R&D facilities assumed co-located with manufacturing: biosimilars
- Speedier entry and Increased competition in Europe following protection expiry => savings to payers (in EU)
Innovative industry: - Reduced sales in 3rd
countries due to more competition
Wider impact: - Incentives to innovate –
report assumes no impact
5
Generics/biosimilars industry - Additional sales in (some) EU countries after expiry in (some) EU countries and
before protection expiry in country A (in Europe) - Additional sales due to 1st mover adv. (in some EU countries) – just for generics
(no data for biosimilars) Wider impact:
- Employment increases in generics/biosimilars European-based companies - Investing in manufacturing activities: generics and biosimilars - R&D facilities assumed co-located with manufacturing: biosimilars
- Speedier entry and Increased competition in Europe following protection expiry => savings to payers
Innovative industry: - Reduced sales in other
EU countries due to more competition
- Increase legal cost due to increasing SPC coverage via renewal fees
6
Generics/biosimilars industry - Increase manufacturing in (formerly) protected country A (within Europe) - Timelier generic entry in A (equal footing to compete with generic/biosimilar
producers located outside A) Wider impact:
- Employment increases in generics/biosimilars European companies located in A - Investing in manufacturing activities: generics and biosimilars - R&D facilities assumed co-located with manufacturing: biosimilars
- Speedier entry and Increased competition in Europe following protection expiry => savings to payers
Wider impact - Incentives to innovate –
report assumes no impact (and therefore no impact on EU R&D expenditure)
Source: Authors’ analysis, from CRA (2016)

Review of CRA report: OHE Consulting 02/01/18
33
4. SCENARIO 4
Before going into the analysis, Table 7 shows the data used specifically for Scenario 4, and for what purpose.
Table 7: Data for Scenario 4
Note: the number in first column refers to datasets in Table A.2a (Appendix 2). Source: Authors’ analysis, from CRA (2016)
With the proposed change, generic/biosimilar companies can now manufacture during the SPC term in the EU country where the reference product is still SPC protected, and can export to third countries as soon as protection expires in another third country.
Figure 7 shows a diagrammatic representation of our understanding of the methodology used in Scenario 4, showing all the links. For the purposes of Figure 7, we only show the model for non-biologicals. The main difference between biologicals and non-biologicals is that evidence is very scarce (number of molecules in sample = 17), and first mover advantages are not modelled, as we explain in Section 4.2.

Review of CRA report: OHE Consulting 02/01/18
34
Figure 7 Scenario 4: CRA approach: non-biologicals
Source: Authors’ analysis, from CRA (2016)
Identify molecules whose SPC expiry
term in Europe occurred later
than other third countries over next 15 years
(117)
Estimated market size that
would be available to allgenerics after
losing protection in third country
Share that European generics
producers could achieve if they entered during the first year of
protection expiry
Additional first mover
advantages for European generics
producers
Estimated market size
available to all innovative
pharmaceuticals during SPC
protection in Europe
Share that European innovative
companies could achieve and
decline in sales
“Wider impact”
Savings to third payers
Increased employment(NET sales)
Incentives to innovate
Total additional EU generics salesKey Issue 1 (Sc 4.1.1)
Key Issue 2 (Sc 4.1.2)
Key Issue 3 (Sc 4.1.3)
Key Issue 4 (Sc 4.1.4)
Key Issue 5 (Sc 4.3.1)
Key Issue 6 (Sc 4.3.2)
Key Issue 9 (Sc 4.4.2)
Key Issue 8 (Sc 4.4.1)
Reduced remaining sales for European
innovators as a result of
increased competition
Key Issue 7 (Sc 4.3.3)

Review of CRA report: OHE Consulting 02/01/18
35
In Figure 7 we also include the relevant sections below that focus on each of the “boxes”. It is important to note that we have modelled an additional impact on the EU based innovative industry that CRA does not consider – Key Issue 7 in Figure 7. We later discuss it.
This section is structured as follows:
We discuss for generics (Section 4.1) and then biosimilars (Section 4.2) in turn: o Key Issue 1: The number of molecules for which there is an earlier IP
expiry in the eight markets than in Europe o Key Issue 2: How the value of the total generic market for these
molecules is estimated o Key Issue 3: How the estimate of the share that would be met by
European-based production is derived o Key Issue 4: How an additional market share boost is estimated for “first-
mover advantage” We then discuss for the originators based in Europe (Section 4.3):
o Key Issue 5: How the value of the total post IP expiry market for these molecules for the innovators is estimated
o Key Issue 6: How the estimate of the decline in market share that would be suffered by European-based innovators is derived
o Key Issue 7: Additional lost sales as a result of more intense price competition (which was not addressed by CRA).
We then discuss the "wider impacts” modelled by CRA (Section 4.4), also highlighting the key issues. These are:
o Key Issue 8: How the increased generic and biosimilar sales, net of the loss of innovator market share, is translated into an estimate of additional employment in the EU
o Key Issue 9: How the savings to EU third party payers is estimated
For each key issue, we summarise at the end how we adjust the CRA modelling (if applicable), and its impact. We finish this section with some summary tables of all adjustments and calculations (with all the detail in Appendix 4).
The approach used by CRA to estimate the potential benefits from an export waiver seems appropriate. However, investigating in detail the methodology and assumptions behind each of the boxes in Figure 7 reveals some (mostly unavoidable) weaknesses in the study, mainly due to limited evidence, although not always, some of which are flagged by CRA. However, CRA, in our view, does not, in most cases, attempt to explore the impact of these weaknesses and uncertainties in its modelling.
We believe CRA’s analyses of market sizes and market shares evolution are based on a partial equilibrium approach. Assumptions and modelling on the sales forecasts and the potential benefits for new EU generic competitors in third countries' markets is done ceteris paribus. As argued below, more competition can mean lower prices (through price response by the reference product, for instance). The sales forecast would need to be adjusted by these effects and expected benefits for new entrants also adjusted downward. However, this impact, based on a general equilibrium approach, is not even mentioned in the report.
Review of CRA report: OHE Consulting 02/01/18
36
4.1. Potential effect on European generic manufacturing
As shown in Figure 7, CRA assumes that as a result of the change, there would be additional export sales for generics located in EU countries, via two channels:
1. Sales achieved in other countries after IP expiry in third country and before EU country IP expiry;
2. Additional sales due to first mover advantage in generic entry.
In essence, companies in European countries could start manufacturing the generic product before protection expiry (in Europe), and launch the product in the non-protected third countries at the same time as other companies. Hence, CRA argues, they could compete at no disadvantage resulting from later expiration dates with other innovative/generic companies, and moreover, generics could additionally benefit from first mover advantages.
In particular, and for step 1. above, for each molecule and third country in sample, CRA estimate sales lost by European generics manufacturing during SPC term as:
i. Estimated market size that would be available to all generics after losing protection in third country;
ii. Apply to resulting figures share that European generics producers could achieve if they entered during the first year of protection expiry (under SPC export waiver);
iii. However, as there is no reliable data on share of European generic/biosimilars achieved in third countries, a proxy is used: ratio of imports of generics/biosimilar pharmaceuticals in that country from EEA (trade statistics) divided by pharmaceutical sales in that country (IMS).
The key result is that the total additional sales for European generics, taking into account the lost sales during the SPC protection period and the additional sales due to the first mover advantage of earlier entry, are estimated to reach €7.6 billion by 2025 and €8.7 billion by 2030. It should be noted that by 2025, sales due to the first mover advantage (€3.2bn) represent 42% of total additional sales, increasing to 44% by 2030. Hence, first mover advantages are critical in CRA’s analyses.
The additional sales are presented according to several criteria, such as:
- Destination country [Tables 21/22 in CRA report]. The report separates the eight countries CRA examine into two types: four countries with ‘Patent extension terms’ (Australia, Japan, Russia, US), with additional sales of €5.3bn in 2025; and four countries with ‘no extension terms’ (Brazil, Canada, China, Turkey), which have additional sales of €2.2bn in 2025. The fact that countries that have SPC-like protection generate more sales than countries without this protection reflects the greater importance than IP of (i) market size (the US is in the first group) and of (ii) the ability of European companies to penetrate those markets (China is in the second group and has a large market but European market share is close to zero, as discussed below).
- An alternative estimate involving capping European generics’ market share in emerging countries (Brazil, Russia, China, Turkey) at 10%, which reduces the CRA estimate of additional sales in these four countries from €4.4bn to €3.8bn by 2025 (i.e. by €600m) (Table 23 in CRA report).
We now discuss in turn the issues around the key steps/assumptions.

Review of CRA report: OHE Consulting 02/01/18
37
4.1.1. Key Issue 1: Identify molecules whose SPC expiry term in Europe occurred later than other third countries.
These come from two sources:
IMS Midas: European SPC expiries over next 15 years (2016 – 2030) occurring at least 1 year later as compared to Russia and Turkey;
EGA (now called Medicines for Europe, MFE)/confidential data from a generic producer: earlier SPC expiries in US, Canada, China, Brazil, Australia and Japan, relative to Europe, over next 15 years.
It should be noted that we identified a document posted in MFE’s website with a comparison of expiry dates of protection worldwide (Medicines for Europe, undated). We assume CRA had access to this document, or a similar version – although it is not cited. Feedback to EFPIA from its members indicate that this document has “cherrypicked” countries/molecules, and overestimates market potential for generics. We cannot comment on the veracity of the data, but it is of concern that the CRA analysis cannot be replicated.
The CRA analysis focussed on eight countries accounting for 60% of European pharmaceutical exports (excluding intra-EA trade in 2014). Note that these export statistics cannot be separated as between R&D-based innovative sales and generic and biosimilar sales. We do not know what proportion of EU-manufactured generic and biosimilar exports these eight countries account for.
Table 19 in the CRA report provides some statistics for the non-biological molecules used in the analysis. From a total of 117, the actual number of molecules examined is reduced further, as a later SPC expiry date in Europe is required. Table 19 in the CRA report also shows the average number of years of delay. Once the molecules have been identified as relevant, CRA then sources 2014 sales value data for each of the export countries. We have five comments about the sample.
1. First, except for Russia and Turkey, the main source was confidential data from EGA and one generic company. However, CRA does not provide more evidence as to how much information was provided by EGA and the company respectively – see our comment above regarding the MFE document. Selecting the sample is a critical first step, as it determines the potential market that could be available for European companies should the export waiver be introduced. The share of molecules in the sample is negligible for Australia (just 2 out of the 117 molecules included in CRA’s sample have later expiry than in Europe) and very low for Turkey (33 molecules, representing 28% of the 117) – which means that no additional sales will be generated here.
2. Second, the CRA report does not report some basic descriptive statistics about the sample. We are conscious that some information may be commercially sensitive and/or cannot be provided given the contract between CRA and IMS, such as expiration times and sales of individual molecules (in 2014). However, some information such as the list of molecules included in their sample, their share of sales in 2014 per country, and some sense of when protection will expire is required to understand better the implications of CRA’s analyses. For example, the lack of disaggregated data at country level (or product level), does not allow

Review of CRA report: OHE Consulting 02/01/18
38
us to ascertain the relative importance of each country4. We expect the US would be the largest market, possibly followed by China, but we do not know. We do not know whether some of the molecules in the sample already have generic sales in the third countries by 2014. An important implication of the lack of descriptive data is that the CRA analysis cannot be replicated.
3. Third, and as stated in Table 21, Australia, Japan, Russia and US are deemed by CRA as “third countries with patent extension terms” – and hence would, at last in theory, have similar protection periods as in Europe. This could be the reason why the actual number of molecules in the sample is so low in Japan (44 out of the 117) and Australia (2), as a necessary condition to include the molecule in the sample is a later EU SPC expiry. For the US, the number of molecules in the sample is the third largest out of the eight (62%) - given the possibilities of patent extensions in the US, we are unclear why the numbers are that high. Without knowing the products referred to, it is not possible for us to check. It should be noted that the smallest average period of delay (except for Australia) shown in the CRA analysis is for the US. Thus, the potential for differences with Europe should be higher in the other four countries with no patent extension terms.
4. Fourth, CRA argues (page 115 and footnote 263) that “…results are based on a sample of molecules and countries, and does not reflect the full potential impact if all export countries and molecules were considered”. Footnote 263 states that “Based on IMS Midas data the protection of 370 non-biological molecules expires in the EU during the period 2016-2030, therefore our sample of 117 molecules represents 32% of all molecules expiring in the EU during this period”. CRA then goes on to argue that their estimated additional generic sales (the €7.6bn) represents 6% of the total EEA exports to these eight third countries (a figure of €40bn in 2014 for both innovative and generics), and thus the impact on export sales could be up to 18% (3 times 6%). These extrapolations are made without any further analysis, and should be treated with great caution. How much bigger the impact could be will depend on the characteristics of the remaining 250 (or so) molecules not included in the CRA analysis – for instance, whether there is indeed a later EU SPC expiry, and 2014 sales. We also assume that CRA tried to identify some of the more best-selling products, in which case any suggestion of a proportionate multiplier is misleading.
5. Fifth, the Logendra et al. (2017) analyses of some recent best-selling innovative products shows that there are very few instances where the European SPC / patent expiry is later than protection expiry in other markets). This is important, as it would suggest that the impact of an export waiver would be low. Their product selection was made using the top 25 original innovative products based on ranking by size of sales in 2015 (in US$)5, limited by traditional products that are no longer protected in some countries. We believe these refer to non-
4 We only know the shares shown in Tables 21 and 22 for the two “groups” of countries. 5 It’s a smaller sample, but focuses on the top selling drugs, which in principle would suffer most generic competition – for instance the CRA report shows generic entry is more important for bigger markets.

Review of CRA report: OHE Consulting 02/01/18
39
biologicals used in primary care. They focus on six non-EU countries – Brazil, China, Japan, Russia, Turkey and the US - and the results are shown in Figure 8.
Figure 8 Number of months between first SPC expiry in non-Europe group compared with Europe group (circles represent individual countries)
Source: Logendra et al. (2017)
The chart above highlights that the highest concentration of circles are within the negative scale, which represents an earlier first SPC expiry in Europe compared to non-Europe countries. They found that of the 87 entries, 10 were at same time, 53 (61%) occurred later in the third country, and only 24 occurred earlier in the third country. Indeed, 14/25 molecules have first SPC expiry in a non-EU country, and only in 2/25 molecules (marked with a red rectangle) is there a significant opportunity, as deemed by the authors, i.e. three or more countries with first SPC expiry in a non-EU country. We expect the US will be a critical market, given its size, and indeed one of the two significant opportunities include the US. But interestingly, in most occasions the expiry date in Europe is at the same time, or earlier than in the US. Thus, an export waiver would have minimal effect.
The opportunities identified by Logendra et al. (2017) are of a lower value than those assumed/identified by CRA. We are unsure about the reasons for the differences, but exploring such differences is outside our remit. CRA and Logendra et al. (2017) share the same database for Russia and Turkey, but not for the other six countries. It is true that Logendra et al. (2017) only focus on 25 molecules, but these are the ones with highest sales.
Review of CRA report: OHE Consulting 02/01/18
40
4.1.1.1. Adjustments to the CRA numbers
We do not adjust the CRA numbers as a result of the concerns we raise on Key Issue 1. However, we outline here what analysis we think is needed to address this issue. The essential step would be to undertake a comprehensive review of the products to lose protection in Europe over the next 15-20 years, and compare expiry dates worldwide, to have the ability to know which products we are referring to. This review could build on the Medicines for Europe document (Medicines for Europe, undated), but it needs to be an independent source. We understand that for biosimilars, there is even less information than for non-biologicals.
This adjustment, however, can be very important. For illustrative purposes, CRA uses 72 molecules for the US (with earlier expiry than in Europe), out of 117 (Table 19), representing 62%. But as shown in Figure 8, Logendra et al. (2017) reports that only one in 25 molecules the US has an earlier expiration date, which represents 4%. Thus, the potential effect for the US could have been overestimated by nearly 16 times. If we apply this overestimation to CRA forecasts for 2025 for the total market (generics and innovators), their €33bn figure would be €2bn. However, because the raw data is not available, we do not have a basis for adjusting the CRA numbers for Key Issue 1.
4.1.2. Key Issue 2: Estimated market size that would be available to all generics after losing protection in third country
Footnote 258 (page 112) explains the methodology to estimate the share of all generics for all countries. Only the Russia and Turkey splits come directly from IMS data. When IMS data is not available, these shares come from the literature, including reports by IMS. However, we have not found in the report the actual percentages used for each country by CRA in its calculations for Table 20 and Table 31. In Footnote 259, when CRA explain how the European generics share is calculated (which we come onto in Key Issue 3 below), the authors say: “we assumed that the ratio of imported generics/biosimilars to originator products was the same as the ratio of generic pharmaceutical sales to originator sales in the importing country (calculated on the basis of IMS data).” They can only do this if they have the generic/innovative split from IMS for all countries. We do not understand why CRA has not used one source throughout. This is inconsistent.
One of the most important tables in the CRA report is Table 20. Among other things, it shows CRA’s forecasts for the market size available to all generics after losing protection in the third country. Overall, we believe that:
(i) not enough clarity has been provided for the reader to fully understand the modelling exercise. This comment applies to all steps, not just the first step of estimating market potential.
(ii) the estimated potential market for all generics has been significantly overestimated by CRA.
Before we expand on (ii) and comment on the results, we have three comments about the lack of clarity in the analysis:
1. First, it is not clear in the methods how forecasts for pharmaceutical sales are derived up to 2030. Such forecasts are important in driving the results as the reference results in the report are 2025 and 2030 figures. Neither the dynamics of sales evolution over time nor how the starting point has been estimated (2016

Review of CRA report: OHE Consulting 02/01/18
41
sales figures in tables 20-23) are explained. We assume the analysis is done at country level, and then aggregated. However, this is important, as CRA only reports aggregated data (or for the two types of countries -Tables 21 and 22), so their analyses cannot be replicated.
2. Second, it is unclear how CRA models the evolution of generic shares at product level in any one country. We are not told whether each molecule is placed on an “erosion” curve, following patent expiry, where the generic drug will gain market at the expense of the originator. For instance, Table 26 does show these erosion curves for biosimilars, but a similar table is not shown for generics. It is no clear to us whether CRA uses the same market share for all generics for each year after patent expiry (in each country), rather than an “erosion” curve, which would make more sense, as uptake of generics increases over time. For instance, the first two years growth rates for total additional generic sales are very large (55% for 2017, 40% for 2018), and then growth rates decrease gradually year on year. There is a lack of explanation of these results.
3. Third, it is unclear what the ordering of the columns in Table 20 should be: for instance, which column should come first, column (2) or column (3)? Our understanding is that column 3 is estimated (% of generic market in third countries), and then column 2 is the result of multiplying column 1 and (what is now) column 3.
Turning to point (ii), we think the modelling gives rise to inconsistent estimates of markets shares as between innovative products and generics (for non-biologicals) in the third countries for the forecast period. We have compared the estimated generic sales during the period between protection expiry in the third country and SPC protection period in Europe (column [1], Table 20), with the market size available to innovative producers during the period between protection expiry in the third country and SPC protection period in Europe (column [1], Table 31)6. The sum of both provides, we understand, the total market (irrespectively of where they have been manufactured)7. For example, this figure is €33.4bn in 2025 and €37.5bn in 2030. Computing the market shares, generics’ account for c70% in these third countries (on average) over the forecast period; the remaining 30% is for innovative (sales in 2025 are €23.5bn and €10.0bn for generics and innovators respectively). However, we think this is too high for generics for two reasons.
1. First, footnote 259 states the split between generics and innovative in each of the eight markets (as this ratio is then apportioned to European based generics manufacturers from trade data). Generics’ share ranges between 16% and 32%. These shares are no way close to the 70% implied by the CRA analysis in tables 20 and 31.
2. Second, Logendra et al. (2017) presents the evolution of generics and non-generics trends, in value and volume terms, for three medicines (atorvastatin, esomeprazole and rosuvastatin), in the third countries, and results therein support the view that CRA estimated shares for generics are too high (which would overestimate additional EU generics sales in third countries). Molecules
6 We discuss later the impact on branded sales. 7 See column “Total” in Appendix 4 (CRA (1/2))
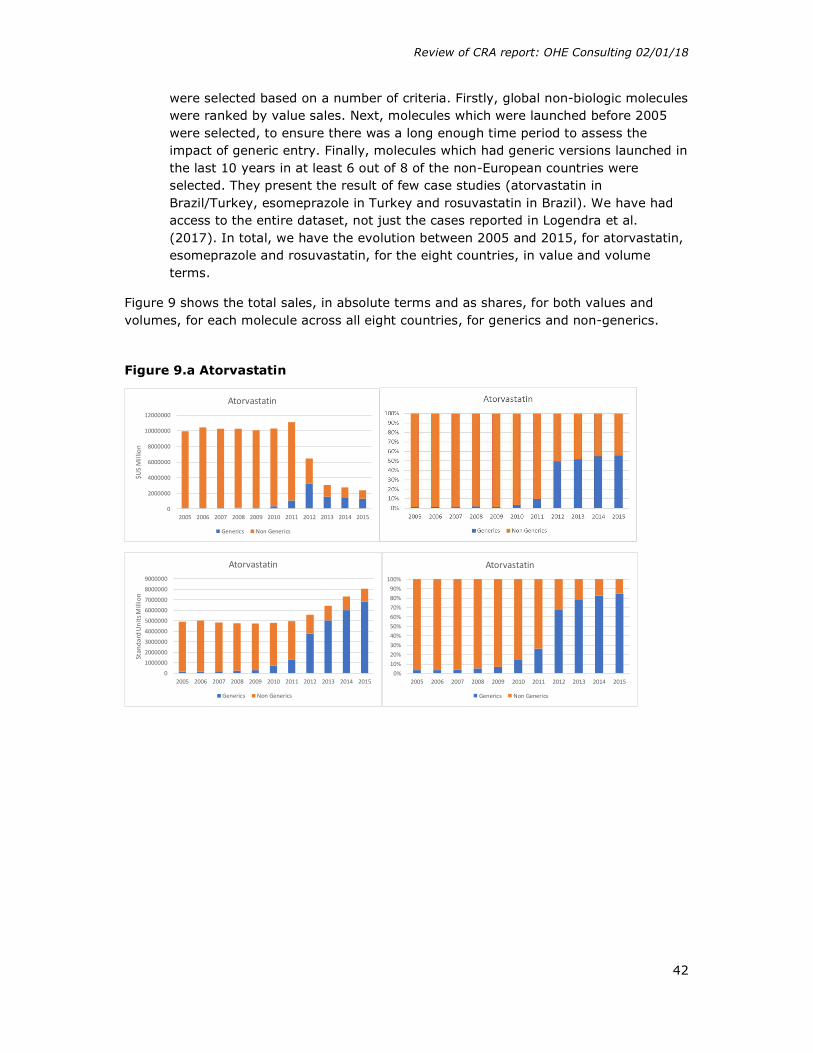
Review of CRA report: OHE Consulting 02/01/18
42
were selected based on a number of criteria. Firstly, global non-biologic molecules were ranked by value sales. Next, molecules which were launched before 2005 were selected, to ensure there was a long enough time period to assess the impact of generic entry. Finally, molecules which had generic versions launched in the last 10 years in at least 6 out of 8 of the non-European countries were selected. They present the result of few case studies (atorvastatin in Brazil/Turkey, esomeprazole in Turkey and rosuvastatin in Brazil). We have had access to the entire dataset, not just the cases reported in Logendra et al. (2017). In total, we have the evolution between 2005 and 2015, for atorvastatin, esomeprazole and rosuvastatin, for the eight countries, in value and volume terms.
Figure 9 shows the total sales, in absolute terms and as shares, for both values and volumes, for each molecule across all eight countries, for generics and non-generics.
Figure 9.a Atorvastatin
0
2000000
4000000
6000000
8000000
10000000
12000000
2005 2006 2007 2008 2009 2010 2011 2012 2013 2014 2015
$US
Mill
ion
Atorvastatin
Generics Non Generics
0
1000000
2000000
3000000
4000000
5000000
6000000
7000000
8000000
9000000
2005 2006 2007 2008 2009 2010 2011 2012 2013 2014 2015
Stan
dard
Uni
ts M
illio
n
Atorvastatin
Generics Non Generics
0%10%20%30%40%50%60%70%80%90%
100%
2005 2006 2007 2008 2009 2010 2011 2012 2013 2014 2015
Atorvastatin
Generics Non Generics

Review of CRA report: OHE Consulting 02/01/18
43
Figure 9.b Esomeprazole
Figure 9.c Rosuvastatin
Source: Authors analysis from IQVIA
If we sum up across all three molecules and eight countries, generics make up 36% of the market by 2015, in value terms. This is half what CRA estimates between 2016 and 2030. We are conscious this is a very limited sample, but given the sales of the innovative version of atorvastatin globally prior to patent expiry (it used to be one of the highest selling drugs when on-patent), the case of atorvastatin could be deemed as the upper bound of impact of generic entry in terms of market shares by value.
0
1000000
2000000
3000000
4000000
5000000
6000000
7000000
8000000
2005 2006 2007 2008 2009 2010 2011 2012 2013 2014 2015
$US
Mill
ion
Esomeprazole
Generics Non Generics
0%10%20%30%40%50%60%70%80%90%
100%
2005 2006 2007 2008 2009 2010 2011 2012 2013 2014 2015
Esomeprazole
Generics Non Generics
0
500000
1000000
1500000
2000000
2500000
2005 2006 2007 2008 2009 2010 2011 2012 2013 2014 2015
Stan
dard
Uni
ts M
illio
n
Esomeprazole
Generics Non Generics
0%10%20%30%40%50%60%70%80%90%
100%
2005 2006 2007 2008 2009 2010 2011 2012 2013 2014 2015
Esomeprazole
Generics Non Generics
0
200000
400000
600000
800000
1000000
1200000
1400000
1600000
2005 2006 2007 2008 2009 2010 2011 2012 2013 2014 2015
$US
Mill
ion
Rosuvastatin
Generics Non Generics
0%10%20%30%40%50%60%70%80%90%
100%
2005 2006 2007 2008 2009 2010 2011 2012 2013 2014 2015
Rosuvastatin
Generics Non Generics
0
500000
1000000
1500000
2000000
2500000
2005 2006 2007 2008 2009 2010 2011 2012 2013 2014 2015
Stan
dard
Uni
ts M
illio
n
Rosuvastatin
Generics Non Generics

Review of CRA report: OHE Consulting 02/01/18
44
Figures 9a – 9c raise six issues:
1. First, generic penetration differs across the three molecules. Atorvastatin sees most generic penetration, driven, we think, by the size of the market pre-patent expiry. We know the size of the market pre-patent expiry is a critical driver of generic entry. By 2015, sales for atorvastatin (for both brands and generics) is still four times bigger than for the other two molecules (roughly similar).
2. Second, as expected, generics shares in volumes are higher than in sales, as generics are cheaper than the originator.
3. Third, in some countries, no generics were launched. This was the case for esomeprazole in Japan, and rosuvastatin in Japan and the US.
4. Fourth, generics enter at different times. Table 8 shows the year when IQVIA record positive generic sales in each country.
Table 8 Date of generic entry
Australia Brazil Canada China Japan Russia Turkey US Atorvastatin 2012 2010 2010 2005 2011 2005 2005 2011 Esomeprazole 2014 2012 2011 2014 NA 2013 2013 2014 Rosuvastatin 2013 2010 2012 2009 NA 2010 2009 NA
Source: IQVIA (personal communication)
Notes: NA = generic not launched. For cells with ‘2005’ as the year of generic entry, positive generic sales were reported in 2005, which is the last year we have data, so we do not know exact year of generic entry.
There is no discernible pattern across countries, in terms of a country being systematically an early/late generic entry country. The only trend identified is the two types of countries for atorvastatin: either early (in 2005, China, Russia and Turkey) or late entry (2010-2011 Australia, Brazil, Canada, Japan and the US). China, Russia and Turkey are deemed by CRA as countries “without patent extension terms” (Table 22), and that might be a reason for the earlier entry. However, Brazil is likewise designated, and shows a later generic entry for atorvastatin. Interestingly, the US, which is the biggest market of all (except for rosuvastatin as no generic was launched), is always a late generic entry country. The implication of this is that the potential effect of an export waiver is minimised the shorter is the gap between US protection expiry and EU SPC expiry.
5. Fifth, it takes time for the generics’ market share to plateau. As highlighted by the CRA report few times, many drivers affect generic entry and uptake. It is beyond the scope of our analysis to explore the differences between molecules/countries. Again, we are not sure whether CRA is using the same generics’ share over time, or if CRA assume generic share increases over time.
6. Sixth, the effect of generic entry can be to reduce the total size of the market in value terms. This is due to the decrease in price being higher than the potential increase in volume. The decrease in price can also be driven by a price response
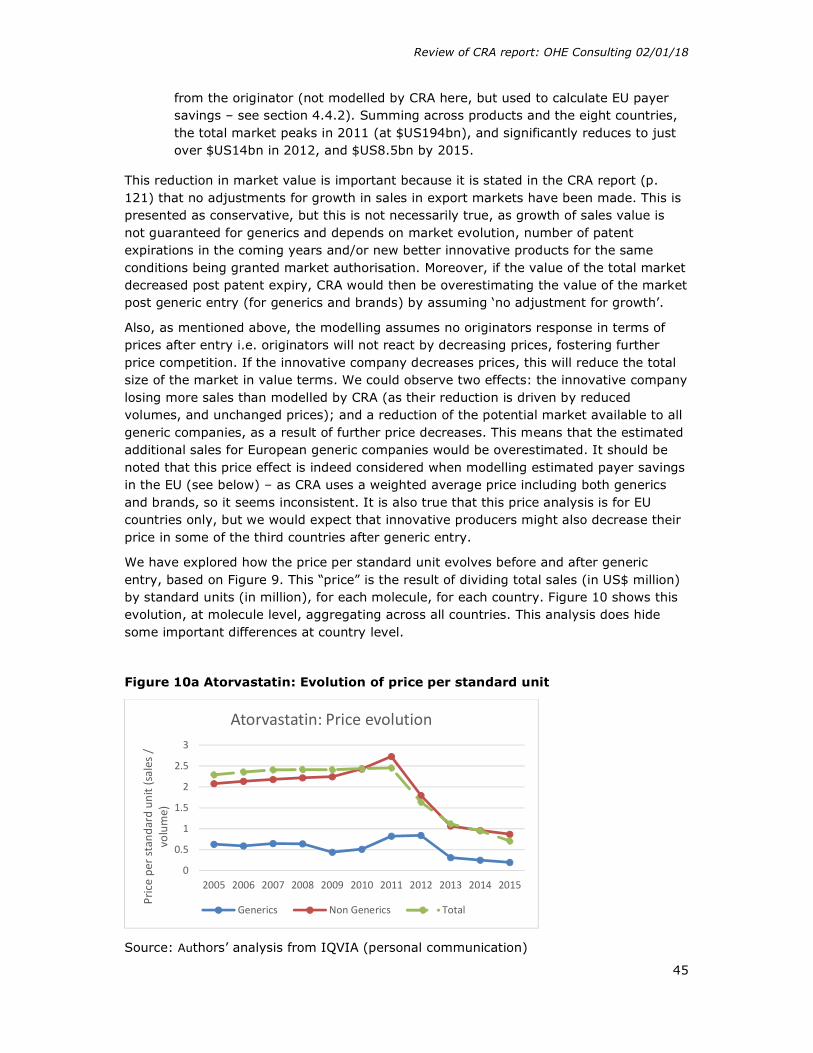
Review of CRA report: OHE Consulting 02/01/18
45
from the originator (not modelled by CRA here, but used to calculate EU payer savings – see section 4.4.2). Summing across products and the eight countries, the total market peaks in 2011 (at $US194bn), and significantly reduces to just over $US14bn in 2012, and $US8.5bn by 2015.
This reduction in market value is important because it is stated in the CRA report (p. 121) that no adjustments for growth in sales in export markets have been made. This is presented as conservative, but this is not necessarily true, as growth of sales value is not guaranteed for generics and depends on market evolution, number of patent expirations in the coming years and/or new better innovative products for the same conditions being granted market authorisation. Moreover, if the value of the total market decreased post patent expiry, CRA would then be overestimating the value of the market post generic entry (for generics and brands) by assuming ‘no adjustment for growth’.
Also, as mentioned above, the modelling assumes no originators response in terms of prices after entry i.e. originators will not react by decreasing prices, fostering further price competition. If the innovative company decreases prices, this will reduce the total size of the market in value terms. We could observe two effects: the innovative company losing more sales than modelled by CRA (as their reduction is driven by reduced volumes, and unchanged prices); and a reduction of the potential market available to all generic companies, as a result of further price decreases. This means that the estimated additional sales for European generic companies would be overestimated. It should be noted that this price effect is indeed considered when modelling estimated payer savings in the EU (see below) – as CRA uses a weighted average price including both generics and brands, so it seems inconsistent. It is also true that this price analysis is for EU countries only, but we would expect that innovative producers might also decrease their price in some of the third countries after generic entry.
We have explored how the price per standard unit evolves before and after generic entry, based on Figure 9. This “price” is the result of dividing total sales (in US$ million) by standard units (in million), for each molecule, for each country. Figure 10 shows this evolution, at molecule level, aggregating across all countries. This analysis does hide some important differences at country level.
Figure 10a Atorvastatin: Evolution of price per standard unit
Source: Authors’ analysis from IQVIA (personal communication)
0
0.5
1
1.5
2
2.5
3
2005 2006 2007 2008 2009 2010 2011 2012 2013 2014 2015
Pric
e pe
r sta
ndar
d un
it (s
ales
/
volu
me)
Atorvastatin: Price evolution
Generics Non Generics Total
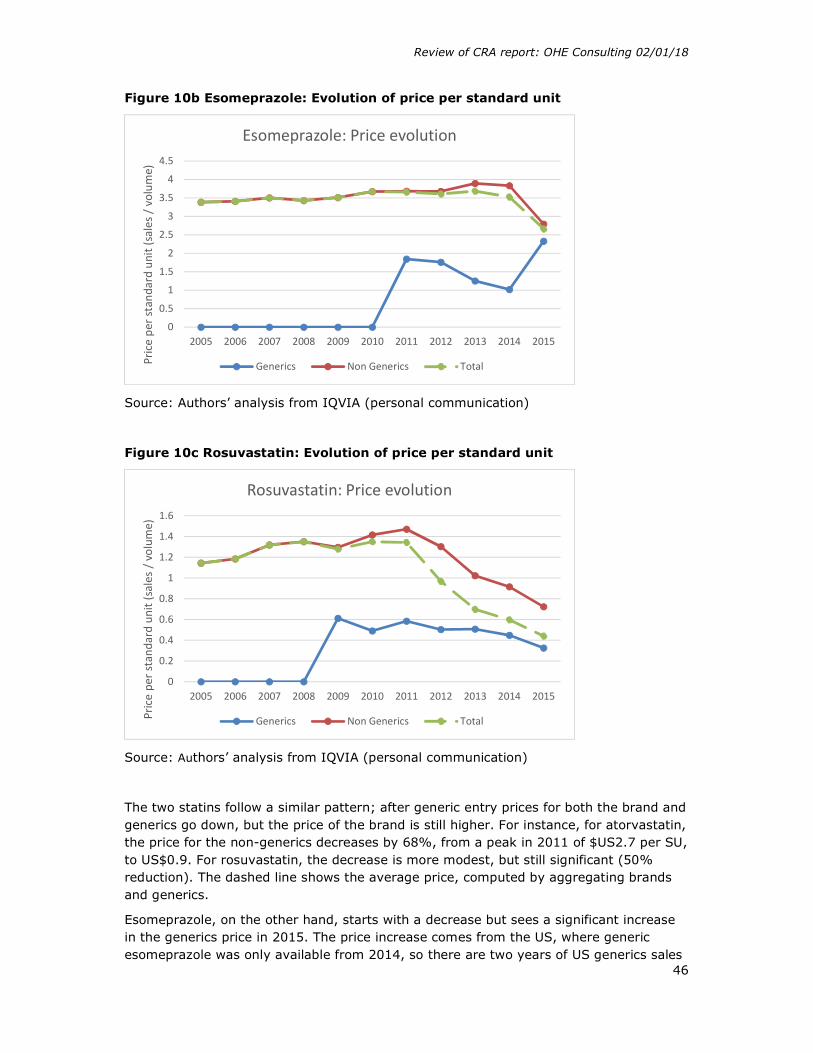
Review of CRA report: OHE Consulting 02/01/18
46
Figure 10b Esomeprazole: Evolution of price per standard unit
Source: Authors’ analysis from IQVIA (personal communication)
Figure 10c Rosuvastatin: Evolution of price per standard unit
Source: Authors’ analysis from IQVIA (personal communication)
The two statins follow a similar pattern; after generic entry prices for both the brand and generics go down, but the price of the brand is still higher. For instance, for atorvastatin, the price for the non-generics decreases by 68%, from a peak in 2011 of $US2.7 per SU, to US$0.9. For rosuvastatin, the decrease is more modest, but still significant (50% reduction). The dashed line shows the average price, computed by aggregating brands and generics.
Esomeprazole, on the other hand, starts with a decrease but sees a significant increase in the generics price in 2015. The price increase comes from the US, where generic esomeprazole was only available from 2014, so there are two years of US generics sales
0
0.5
1
1.5
2
2.5
3
3.5
4
4.5
2005 2006 2007 2008 2009 2010 2011 2012 2013 2014 2015
Pric
e pe
r sta
ndar
d un
it (s
ales
/ v
olum
e)Esomeprazole: Price evolution
Generics Non Generics Total
0
0.2
0.4
0.6
0.8
1
1.2
1.4
1.6
2005 2006 2007 2008 2009 2010 2011 2012 2013 2014 2015
Pric
e pe
r sta
ndar
d un
it (s
ales
/ v
olum
e)
Rosuvastatin: Price evolution
Generics Non Generics Total
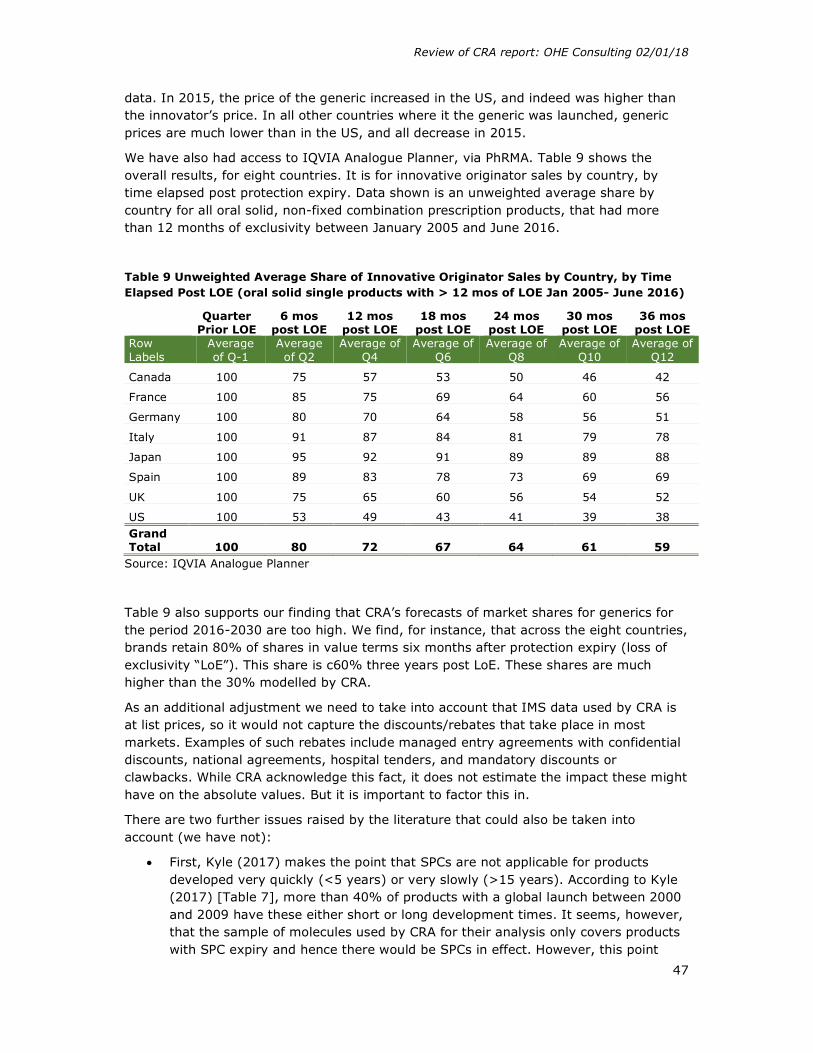
Review of CRA report: OHE Consulting 02/01/18
47
data. In 2015, the price of the generic increased in the US, and indeed was higher than the innovator’s price. In all other countries where it the generic was launched, generic prices are much lower than in the US, and all decrease in 2015.
We have also had access to IQVIA Analogue Planner, via PhRMA. Table 9 shows the overall results, for eight countries. It is for innovative originator sales by country, by time elapsed post protection expiry. Data shown is an unweighted average share by country for all oral solid, non-fixed combination prescription products, that had more than 12 months of exclusivity between January 2005 and June 2016.
Table 9 Unweighted Average Share of Innovative Originator Sales by Country, by Time Elapsed Post LOE (oral solid single products with > 12 mos of LOE Jan 2005- June 2016)
Quarter
Prior LOE 6 mos
post LOE 12 mos
post LOE 18 mos
post LOE 24 mos
post LOE 30 mos
post LOE 36 mos
post LOE Row Labels
Average of Q-1
Average of Q2
Average of Q4
Average of Q6
Average of Q8
Average of Q10
Average of Q12
Canada 100 75 57 53 50 46 42
France 100 85 75 69 64 60 56
Germany 100 80 70 64 58 56 51
Italy 100 91 87 84 81 79 78
Japan 100 95 92 91 89 89 88
Spain 100 89 83 78 73 69 69
UK 100 75 65 60 56 54 52
US 100 53 49 43 41 39 38 Grand Total 100 80 72 67 64 61 59
Source: IQVIA Analogue Planner
Table 9 also supports our finding that CRA’s forecasts of market shares for generics for the period 2016-2030 are too high. We find, for instance, that across the eight countries, brands retain 80% of shares in value terms six months after protection expiry (loss of exclusivity “LoE”). This share is c60% three years post LoE. These shares are much higher than the 30% modelled by CRA.
As an additional adjustment we need to take into account that IMS data used by CRA is at list prices, so it would not capture the discounts/rebates that take place in most markets. Examples of such rebates include managed entry agreements with confidential discounts, national agreements, hospital tenders, and mandatory discounts or clawbacks. While CRA acknowledge this fact, it does not estimate the impact these might have on the absolute values. But it is important to factor this in.
There are two further issues raised by the literature that could also be taken into account (we have not):
First, Kyle (2017) makes the point that SPCs are not applicable for products developed very quickly (<5 years) or very slowly (>15 years). According to Kyle (2017) [Table 7], more than 40% of products with a global launch between 2000 and 2009 have these either short or long development times. It seems, however, that the sample of molecules used by CRA for their analysis only covers products with SPC expiry and hence there would be SPCs in effect. However, this point

Review of CRA report: OHE Consulting 02/01/18
48
could mitigate CRA’s assumption that the effect would be three times what they estimate.
Second, on page 16, Kyle (2017) states that “The two classes that seem to benefit most from SPCs, in terms of the years of additional protection provided, are class S (Sensory Organs) and class H (Systemic Hormonal Preparations).” The implications for the CRA analysis is whether this means that SPC exemptions will primarily benefit generic manufacturers in these two therapy classes, rather than across the board?
4.1.2.1. Adjustments to the CRA numbers
We make three adjustments to the CRA numbers:
1. We revise the shares of brands and generics of the total market. Throughout the forecast period, we assume that the share of generics across all countries is 36%, and thus the share for innovative is 64%, post-patent expiry. CRA’s original estimate is of around 70% during the forecast period. The effect of this change is to reduce the estimated additional European generics sales in 2025 by half, from the original €7.6bn to €3.9bn.
2. The second adjustment is we model originators’ price response (to the same volume loss) by a further decrease of 20% of the total value of the generics market. This 20% comes from the evidence provided by CRA used to estimate payer savings - this price decrease takes place in Europe, but that we assume that price competition will also take place in the third countries. However, we use a mid-point of the price decreases observed in Europe. The effect is to reduce sales from €3.9bn to €3.1bn. We should note here that this also has an impact on existing sales for EU innovative companies – which is not considered by CRA. We pick this point up later.
3. Third, we adjust to account for “net” prices. We are uncertain here, as we are unsure how much discounting currently takes place in the eight countries. We assume a further 20% reduction in the value of total sales – as we assume it applies under equally to both generics and innovative. The effect is to reduce additional European generic sales from €3.1bn to €2.5bn.
4.1.3. Key Issue 3: Share that European generics producers could achieve if they entered during the first year of protection expiry
We have identified four challenges with CRA’s modelling to estimate the potential share European generics producers could achieve in third countries.
4.1.3.1. Challenge 1: Proxy used for market share
The first challenge is about the proxy used for market share. The key data limitation that has led CRA to rely on a proxy is that it says no data was available on European based generics manufacturers market shares in these third countries. To estimate the share of EU generic companies (third step), CRA combines data on trade on pharmaceuticals from the EEA into these third countries and sales of brands and generics in these countries.

Review of CRA report: OHE Consulting 02/01/18
49
However, the trade data does not distinguish between innovative and generics, and the sales data does not distinguish as between origin of manufacturing.
How they combine these two data sources to estimate this market share, a critical assumption, is included in a footnote 259 (page 113) rather than set out in the body of the report. This footnote is an attempt to explain in detail the methodology and assumptions. These shares are critical, as they determine the share of the market “new” European entrants could achieve with European based production in these third countries. The underpinning assumption is that the share of exports of European based generics into third countries is the same as the ratio of generic pharmaceutical sales to originator sales in the importing country (based on IMS data).
Box 1 shows an illustration of the impact of the assumptions on European generics’ manufacturers shares in third countries. It shows that, potentially, the CRA method using the proxy can systematically overestimate EU generics share in third countries.
Box 1: An illustration of the impact of the assumptions on European generics’ manufacturers shares in third countries.
Source: Authors’ analysis
We have one key concern about assuming these ratios are the same. The IMS data ratio of generic pharmaceutical sales to originator sales includes generic sales from all companies. Logendra et al. (2017) has evidence on the share of European generic companies, and it would have been useful for CRA to try to get hold of this data. On page 133 CRA states that “However, based on our research and discussions with the industry there are no reliable public data that could be used as alternative proxies”. Note
Share
Brands Generics Total sales Country X
0,6 0,4
200 120 80
Exports from EEA
0,6 0,4
100 60 40
Share EU in counry X
=40/80=50%
If EU share = 10%
=8/80
Brands Generics
So revised export from EEA
92 8 (=10%)
Illustration
1. From IMS data: identify brands/generics market shares in country X e.g. 60/40%
a) If total sales = 200, 80 (40%) to go G 2. Apply 60/40 split to exports from EEA
a) If total exports = 100, 40 (40%) go to EU G 3. This implies EU G has 50% of total G market (i.e.
sell 40 out of the 80) 4. This estimate of 50% market share is too high if
EU G share of exports is lower than 40%
Revision:
1. Assume EU G share of exports = 10% => EU G sales = 8 (=10% of 80)
2. Export sales: as EU G sell 8, EU B sell remaining 92 (=100-8)
3. EU market share is 8 out 80 (i.e. 10% not 50%)
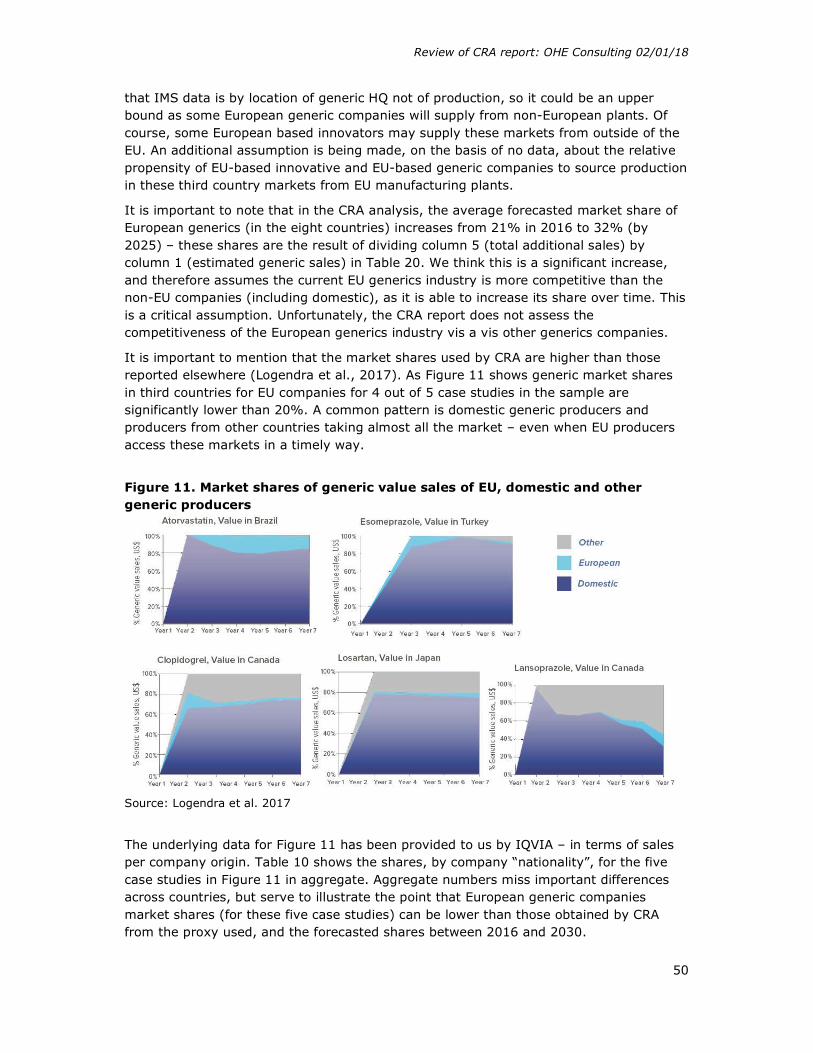
Review of CRA report: OHE Consulting 02/01/18
50
that IMS data is by location of generic HQ not of production, so it could be an upper bound as some European generic companies will supply from non-European plants. Of course, some European based innovators may supply these markets from outside of the EU. An additional assumption is being made, on the basis of no data, about the relative propensity of EU-based innovative and EU-based generic companies to source production in these third country markets from EU manufacturing plants.
It is important to note that in the CRA analysis, the average forecasted market share of European generics (in the eight countries) increases from 21% in 2016 to 32% (by 2025) – these shares are the result of dividing column 5 (total additional sales) by column 1 (estimated generic sales) in Table 20. We think this is a significant increase, and therefore assumes the current EU generics industry is more competitive than the non-EU companies (including domestic), as it is able to increase its share over time. This is a critical assumption. Unfortunately, the CRA report does not assess the competitiveness of the European generics industry vis a vis other generics companies.
It is important to mention that the market shares used by CRA are higher than those reported elsewhere (Logendra et al., 2017). As Figure 11 shows generic market shares in third countries for EU companies for 4 out of 5 case studies in the sample are significantly lower than 20%. A common pattern is domestic generic producers and producers from other countries taking almost all the market – even when EU producers access these markets in a timely way.
Figure 11. Market shares of generic value sales of EU, domestic and other generic producers
Source: Logendra et al. 2017
The underlying data for Figure 11 has been provided to us by IQVIA – in terms of sales per company origin. Table 10 shows the shares, by company “nationality”, for the five case studies in Figure 11 in aggregate. Aggregate numbers miss important differences across countries, but serve to illustrate the point that European generic companies market shares (for these five case studies) can be lower than those obtained by CRA from the proxy used, and the forecasted shares between 2016 and 2030.
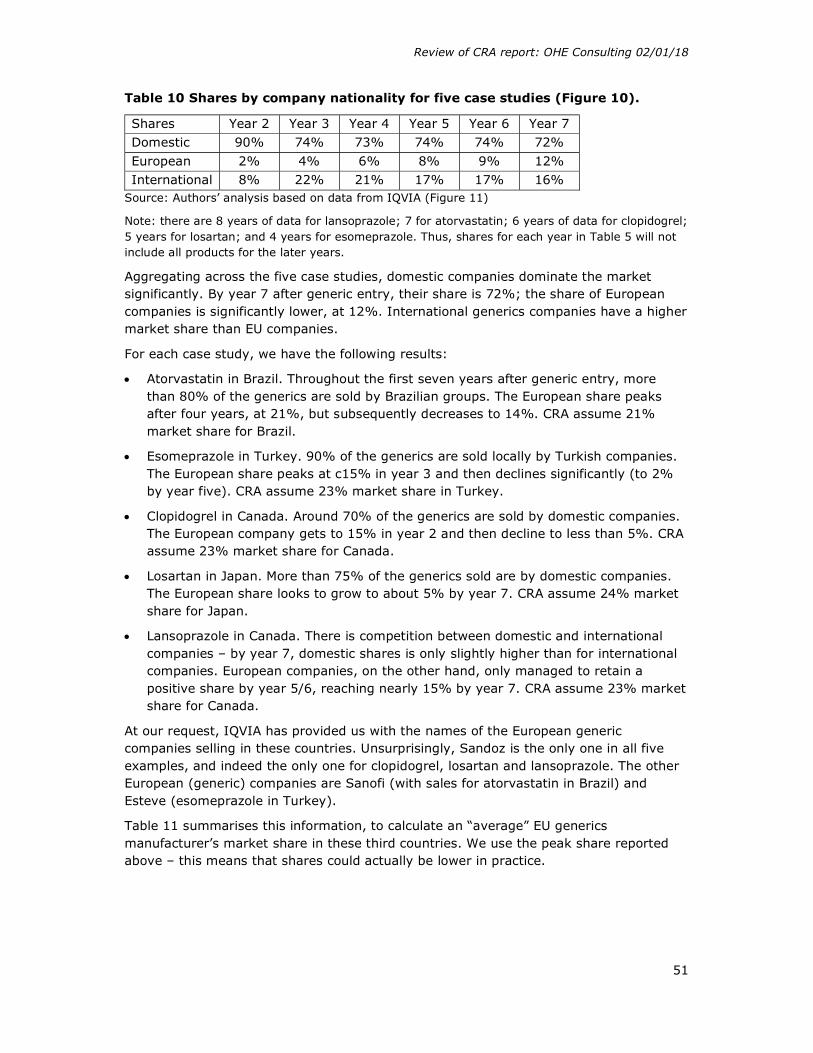
Review of CRA report: OHE Consulting 02/01/18
51
Table 10 Shares by company nationality for five case studies (Figure 10).
Shares Year 2 Year 3 Year 4 Year 5 Year 6 Year 7 Domestic 90% 74% 73% 74% 74% 72% European 2% 4% 6% 8% 9% 12% International 8% 22% 21% 17% 17% 16%
Source: Authors’ analysis based on data from IQVIA (Figure 11)
Note: there are 8 years of data for lansoprazole; 7 for atorvastatin; 6 years of data for clopidogrel; 5 years for losartan; and 4 years for esomeprazole. Thus, shares for each year in Table 5 will not include all products for the later years.
Aggregating across the five case studies, domestic companies dominate the market significantly. By year 7 after generic entry, their share is 72%; the share of European companies is significantly lower, at 12%. International generics companies have a higher market share than EU companies.
For each case study, we have the following results:
Atorvastatin in Brazil. Throughout the first seven years after generic entry, more than 80% of the generics are sold by Brazilian groups. The European share peaks after four years, at 21%, but subsequently decreases to 14%. CRA assume 21% market share for Brazil.
Esomeprazole in Turkey. 90% of the generics are sold locally by Turkish companies. The European share peaks at c15% in year 3 and then declines significantly (to 2% by year five). CRA assume 23% market share in Turkey.
Clopidogrel in Canada. Around 70% of the generics are sold by domestic companies. The European company gets to 15% in year 2 and then decline to less than 5%. CRA assume 23% market share for Canada.
Losartan in Japan. More than 75% of the generics sold are by domestic companies. The European share looks to grow to about 5% by year 7. CRA assume 24% market share for Japan.
Lansoprazole in Canada. There is competition between domestic and international companies – by year 7, domestic shares is only slightly higher than for international companies. European companies, on the other hand, only managed to retain a positive share by year 5/6, reaching nearly 15% by year 7. CRA assume 23% market share for Canada.
At our request, IQVIA has provided us with the names of the European generic companies selling in these countries. Unsurprisingly, Sandoz is the only one in all five examples, and indeed the only one for clopidogrel, losartan and lansoprazole. The other European (generic) companies are Sanofi (with sales for atorvastatin in Brazil) and Esteve (esomeprazole in Turkey).
Table 11 summarises this information, to calculate an “average” EU generics manufacturer’s market share in these third countries. We use the peak share reported above – this means that shares could actually be lower in practice.
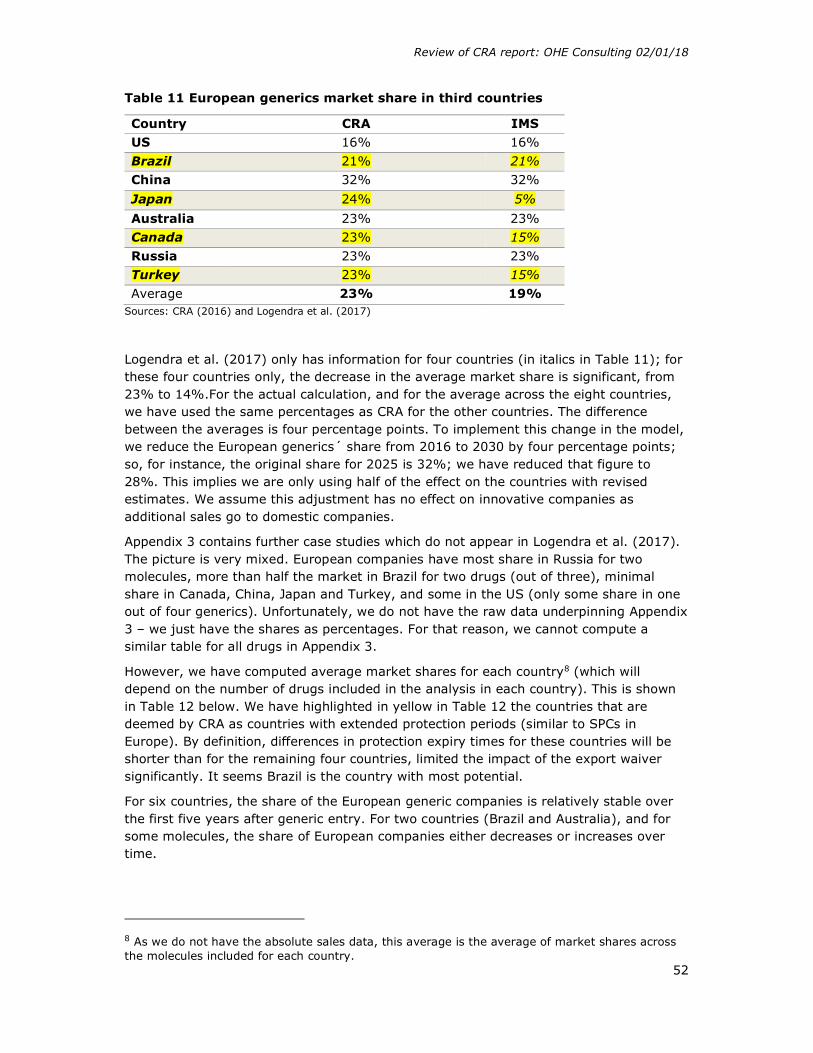
Review of CRA report: OHE Consulting 02/01/18
52
Table 11 European generics market share in third countries
Country CRA IMS US 16% 16% Brazil 21% 21% China 32% 32%
Japan 24% 5%
Australia 23% 23% Canada 23% 15% Russia 23% 23% Turkey 23% 15% Average 23% 19%
Sources: CRA (2016) and Logendra et al. (2017)
Logendra et al. (2017) only has information for four countries (in italics in Table 11); for these four countries only, the decrease in the average market share is significant, from 23% to 14%.For the actual calculation, and for the average across the eight countries, we have used the same percentages as CRA for the other countries. The difference between the averages is four percentage points. To implement this change in the model, we reduce the European generics´ share from 2016 to 2030 by four percentage points; so, for instance, the original share for 2025 is 32%; we have reduced that figure to 28%. This implies we are only using half of the effect on the countries with revised estimates. We assume this adjustment has no effect on innovative companies as additional sales go to domestic companies.
Appendix 3 contains further case studies which do not appear in Logendra et al. (2017). The picture is very mixed. European companies have most share in Russia for two molecules, more than half the market in Brazil for two drugs (out of three), minimal share in Canada, China, Japan and Turkey, and some in the US (only some share in one out of four generics). Unfortunately, we do not have the raw data underpinning Appendix 3 – we just have the shares as percentages. For that reason, we cannot compute a similar table for all drugs in Appendix 3.
However, we have computed average market shares for each country8 (which will depend on the number of drugs included in the analysis in each country). This is shown in Table 12 below. We have highlighted in yellow in Table 12 the countries that are deemed by CRA as countries with extended protection periods (similar to SPCs in Europe). By definition, differences in protection expiry times for these countries will be shorter than for the remaining four countries, limited the impact of the export waiver significantly. It seems Brazil is the country with most potential.
For six countries, the share of the European generic companies is relatively stable over the first five years after generic entry. For two countries (Brazil and Australia), and for some molecules, the share of European companies either decreases or increases over time.
8 As we do not have the absolute sales data, this average is the average of market shares across the molecules included for each country.

Review of CRA report: OHE Consulting 02/01/18
53
Table 12 Average market shares, by country, and company ‘nationality’ Average across all years of data available Domestic European Other
US 38% 9% 53%
Turkey 92% 5% 3%
Russia 1% 99% 0%
Japan 86% 4% 10%
China 100% 0% 0%
Canada 75% 3% 22%
Brazil 39% 58% 4%
Australia 0% 18% 82%
Source: Authors’ analysis from IQVIA (see Appendix 3 for details)
It should be noted that it is beyond the scope of our work to explore in detail market shares drivers for specific countries/molecules shown in Appendix 3. The purpose of this analysis is just to compare CRA assumptions with IQVIA data for some specific molecules.
CRA shares for European generics producers are higher than the ones found in Logendra et al. (2017). We feel it would be important to understand what drives these different shares.
4.1.3.2. Challenge 2: Use of ratios, rather than market shares, to calculate potential sales
Our second concern relates to the use of ratios, rather than market shares, to calculate potential sales. This would overestimate the potential sales, as the ratio can indeed be greater than one if sales of generics represent more than innovative sales. It is worth mentioning that the footnote explicitly acknowledges that for some countries (i.e. Australia, Canada, Russia and Turkey) this approach produces unreasonable generic market shares (over 50%, and for Brazil, the share is higher than 100%), raising concerns about the proxy used. This problem of too high shares is addressed by assuming the average generic export shares of the remaining countries of the sample (i.e. US, Brazil, China, Japan). Although the authors justify this approach as being conservative, it can still imply a wrong methodology, and raises concerns about the appropriateness of CRA’s methodology.
4.1.3.3. Challenge 3: No substitution effect with European innovators
Third, CRA analysis assumes no substitution effect with European innovators (i.e. substitution from “existing” innovator companies to “new” generic ones). We acknowledge this might be very difficult to model, but we think it still needs to be considered. This is done, however, for Scenario 5 (what is called the “diversion” effect).
On this point, the analysis from Logendra et al. (2017) highlights an important issue, in terms of who are the real competitors for these new European generic entrants. This is important because it impacts on the potential available market size. Logendra et al. (2017) argue that “Analysis shows that today, in some instances originator products are able to retain sales in countries outside of Europe after patent expiry, while the generic market is dominated by domestically produced products. Generics manufactured in

Review of CRA report: OHE Consulting 02/01/18
54
Europe are more likely to compete for market share with the original brands (capitalizing on the notion of European brand value), rather than with cheaper, domestically manufactured generic products. These factors indicate that an SPC Manufacturing Exemption could result in substituting the export value of originator products for lower value generics, potentially decreasing the export value for Europe”. We pick up impact on innovators later. This is important, because the CRA report argues that with the entry of these new generics manufactured in Europe, “Given the high levels of generic competition in these markets, such a measure is likely to affect primarily the mix of generic entrants (with a higher representation of EU generics)”. So, the key issue is with whom do these new European generic manufacturers compete with in these third countries? Is it the domestic generics, or the European existing brands, or both? If new generics substitute for innovative which might be also manufactured in Europe, then there will be a redistribution effect, so we need to ascertain the net effect.
4.1.3.4. Challenge 4: Defining the Counterfactual
Fourth, we are unsure how CRA takes into account the counterfactual i.e. what would happen if there was no export waiver. European companies could not sell products manufactured in Europe in these third countries during that time period of different protection expiry dates, so there would not be any early additional sales. However, it could be the case that entering the third country with a delay would lead to some sales - we know various factors drive generic entry, including previous experience and company size, as shown in the stockpiling analysis. It is the difference between these two numbers that needs to be assessed to estimate impact of the waiver. For instance, Sussell et al. (2017), who does a detailed critique of Vicente and Simoes (2014)9, do take into account the counterfactual, which reduces the additional sales gained as a result of the waiver.
Kyle (2017) argues that “patent protection and SPCs are important only if the originator expects generic competition to occur quickly in the absence of these barriers” (page 24). We think this comment highlights the importance of the counterfactual in CRA analysis. For instance, if the originator does not expect fast generic entry with the exemption, introducing the exemption will have little impact. The fact that a patent has expired does not lead to immediate generic entry in the absence of European producers.
Based on these four challenges, we feel CRA has overestimated the potential market available for European based generics manufacturers in these third countries, as a result of the SPC export waiver. Moreover, it is unclear why the current share of EU companies in third country markets is a good indicator of the share the entrants would get from earlier access. The analysis by CRA shows the importance of domestic generic producers in these countries (for a variety of reasons), so the potential market available for European producers (existing and “new”) might be limited. This is argued by Logendra et al. (2017), and moreover, it is not clear whether the new generic entrants will be able to compete with the local generic companies (greater potential market) or the existing innovative products (lower market potential).
We also have a final comment on the interpretation of the impact of additional sales relative to the current situation. In page 115, CRA states that “Based on figures in Table
9 The authors carry out a similar exercise but focusing on Latin American countries. It is interesting to note CRA does not cite this paper.

Review of CRA report: OHE Consulting 02/01/18
55
19, the average delay (weighted by number of molecules by export country) in our sample of molecules/countries was 3.2 years. Therefore the €7.6 billion in additional sales represent annual sales of €2.3 billion”. The €2.3bn figure comes from dividing the €7.6bn by 3.2, but we are unsure if that is the right way to interpret the figures, as the €7.6bn figure is for 10 years (2016 – 2025). CRA then states that the €2.3bn figure represents a 6% increase in total export sales (given that total EEA exports of non-biological molecules to the third countries considered amounted to €40 billion in 20149). Again, we are unsure whether this is the right way to interpret the figures.
4.1.3.5. Adjustments to the CRA numbers
We used markets shares of European generics manufacturers from the five case studies in Logendra et al. (2017) and compared with the CRA results. As shown in Table 11, the difference between the averages is four percentage points. To implement this change in the model, we reduce the European generics share from 2016 to 2030 by four percentage points; so, for instance, the original share for 2025 is 32%; we have reduced that figure to 28%. This reduces additional generic sales from €2.5bn to €2.2bn.
This adjustment has no effect on innovative companies (thus, we are implicitly assuming additional sales go to domestic companies).
In regards to the other three challenges, we are unsure about the impact of using market shares, rather than ratios, on the numbers (challenge 2), as we have not seen the detailed numbers. One concern we have about the appropriateness of the methodology used to estimate potential sales is that even though they give unrealistic (or indeed impossible) results, the authors do not address the problem – they just use an alternative approach, like setting shares equal to other countries’, without any justification.
Challenge 3 raises an important point that could limit the potential market size for EU generics manufacturers. If their main competitors were the EU innovators, and albeit these still retaining some market share, as we will see later, the market potential for EU generics manufacturers would be considerably lower, relative to competing with the domestic generics manufacturers. Domestic companies are the leaders in their respective markets (see figure 11). CRA assumes EU generics take a share of the total generics market, rather than a share of the EU innovators share. Taking the second approach (share of EU innovators) would decrease the additional sales for EU generics manufacturers.
Moreover, we could assume a replacement effect between (additional) EU generics sales and (reduced) EU innovators sales. It is true that CRA models a 10% and 20% loss for EU innovators; however, if there was a nearly 100% substitution effect, then all additional EU generics sales would be at the expense of the EU based innovative companies. The net effect could be even be negative, if as we argue later (see section 4.4.1), the value added of innovators’ products is higher than for generics.
To address challenge 4, there would be a need to model the evolution of the market without the export waiver (i.e. status quo situation). EU generic manufacturers could still gain some market share, even entering with a delay (assuming, of course, that the export waiver actually reduces the delay in entry of European generics manufacturers). The difference between the additional sales estimated by CRA (Table 20) and the sales
Review of CRA report: OHE Consulting 02/01/18
56
from the “status quo” situation would then be the impact of the export waiver. We are unsure about this gap, again assuming there is one.
4.1.4. Key Issue 4: First mover advantages
The next element is estimated additional sales that European generics producers could achieve under the SPC export waiver to third countries, for two years following the SPC expiry in Europe due to the first mover advantage of earlier generic entry, compared to export sales that could be achieved by European generics producers if they entered the third market in the year of protection expiry in Europe.
CRA undertakes two pieces of analyses to support the existence of first mover advantages in the eight third countries: a literature review and modelling shares of later entrants versus the first entrant – although CRA only has this data for EU5, Russia and Turkey (and for non-biologicals), and thus uses EU5 evidence for the other six countries.
In terms of the literature, CRA uses three key papers to support the existence of first mover advantages in the generics sector (Hollis, 2002; Shajarizadeh et al., 2015; and Yu and Gupta, 2008). This literature is certainly very relevant, but it is based on country specific analyses. The characteristics that give rise to the transaction costs in Canada are peculiar to Canada, given their reimbursement system. Indeed, it seems there is no incentive for pharmacies in Canada to seek lower prices for their generics, and we are unclear why that might be so. In the US, there is actually no first mover advantages in the hospital market, so the researchers also argue that the transaction costs for switching generics lies at pharmacy level. More importantly for the CRA analyses, is whether the sources of such first mover advantages are relevant for the eight countries? Of course, Canada and the US are included in CRA’s sample, but data is not provided at country level. We feel the literature actually supports the fact that the existence of first mover advantages are country specific, and thus more analysis needs doing before we can conclude there would be fist mover advantages in the first place.
It is also important to highlight that Shajarizadeh et al. (2015) show that first entrants have a boost of roughly 25% in their expected market share some six years after entry – they look at Canada and just retail pharmacy sales i.e. the hospital sector is not analysed. This is significantly lower than CRA’s assumptions (by 2018, 35%). Also, they find larger firms tend to be the ones that enter early.
These three key papers also discuss some reasons for the first mover advantages, although they discard most of them as being relevant for the country under study.
In terms of the modelling, CRA models additional gains, measured as sales, for European generics manufacturers as a result of speedier entry – the so called first mover advantages. In order to do so, they look at the ratio of market shares of later entrants relative to the first entrant. They have data for EU5, Turkey and Russia. For instance, CRA finds that after 12 months of generic entry (at 1 year after first generic) i.e. two years in total, the late entrant has 11% of the share of the first entrant; and 20% by two years (what CRA calls ‘market share disadvantage’. For Russia and Turkey, the market share disadvantage is lower i.e. the later entrant gets a higher market share.
We have looked at the share of these first mover advantage sales of total additional EU generics sales, as they are significant. These sales are negligible in 2016, represent 20% of total additional EU generics sales in 2017, increasing to 35% in 2018, up to 42% by 2025. It is not clear to us how exactly these first over advantages have been modelled
Review of CRA report: OHE Consulting 02/01/18
57
because no detailed data is provided. Our understanding is they are modelled as a multiplier to the estimated additional sales. We assume that what CRA has done has been to add further sales using the relative market share of the later entrant versus the first entrant i.e. the market share disadvantage. For instance, if we assume the first entrant has 50% of the market, a late entrant’s share would be 11% of that 50% i.e. 6%. The 11% comes from Table 18. We assume that for each molecule, CRA would then add an extra 44% of sales to the “additional” sales (difference between the 50% and 6%). This extra 44% would apply only to the period 12 months after entry of later entrant, for one year. For 24 months after entry of later entrant, the market disadvantage in EU5 is 20% (from Table 18). Using the same hypothetical example as before, if the fist entrant had 50% of the market, the later entrant would thus have 20% of that i.e. 10% of the market. Thus, for the second 24 months, CRA would add an additional 40% (difference between the 50% and the 10%) to the “additional” shares, for one year. It is important to reinforce that this is our interpretation.
We are unsure, however, on the source of these “additional” sales from first mover advantages. Are these sales in addition to the total sales, or are “cannibalised” from either domestic or other companies? If we refer back to the hypothetical example of Box 1, we are unsure whether the first mover advantages are in addition to the total of ‘80’ for all generics, or within the 80. This is important, as we believe the “first mover advantages” would be within 80 and this cannibalised from other companies. However, it seems CRA is assuming first mover advantages are additional – which would be inconsistent.
Moreover, we do question whether the European companies could really generate such first mover advantage, given the tough competition from domestic companies, especially in some countries/molecules (see Figure 11). It might be the case for some of the molecules, but it is not clear to us whether it would apply generally across the entire market. Again, it goes back to our point about how competitive is the European generics industry vis a vis domestic/non-European generic companies.
Related to the actual numbers used, CRA caveats this analysis as they have to use EU5 evidence for six countries, due to lack of data. Given the importance of first mover advantages, CRA could have done some sensitivity analysis – for instance, using the evidence of Russia and Turkey.
4.1.4.1. Adjustments to the CRA numbers
As a result of our discussion above, we feel the existence of first mover advantages do not apply here, or at least, the evidence provided by CRA cannot be applied universally across all third countries. Indeed, the literature suggests these advantages are country-specific and it might not be appropriate to apply universally. This issue merits further country-specific analysis to ascertain the extent to which these advantages exist, and their magnitude. Thus, if we eliminate altogether the existence of first mover advantages additional sales for European based generics manufacturers is further reduced to €1.3bn, from €2.2bn (see section 4.1.3.5).
Taking into consideration all these five adjustments, it seems that CRA has overestimated additional sales for European generics by a factor of six, the original CRA estimate being €7.6bn. In addition there are several factors that we think should be adjusted for, but for which not enough data is given to enable us to do so.

Review of CRA report: OHE Consulting 02/01/18
58
4.2. Potential effect on European biosimilar manufacturing
The methodology for biosimilars is similar as for generics (see Figure 7b), with some nuances, as CRA has more limited data on biologicals and biosimilars.
Before going into the details, the biosimilar market is certainly most developed in Europe relative to other parts of the world, including the US. This could imply that the European biosimilar industry could be well placed to gain important shares in the third countries. But it is also true that we expect other countries, including the US, developing their biosimilar market over the next years, so that could encourage other non-European companies setting up manufacturing facilities, increasing competition. Already a number of non-European companies have biosimilars in the European market.
CRA also uses a step wise approach for biosimilars. First, they identify a sample of biological molecules, whose SPC term expires in Europe later compared to at least one of the eight third countries studied (Russia, Turkey, US, Canada, China, Brazil, Australia and Japan) – giving a total of 17, which is further reduced for the analysis. This is certainly a very low number of molecules, and we are not told the list of molecules.
Second, they estimate the share of biosimilars (irrespectively of origin) of the total biological market post patent expiry. For this purpose, and again due to no data, CRA needs to use evidence from EU5 countries as proxies, with two scenarios. In the Fast penetration scenario, it is assumed that biosimilars in third countries (in total, irrespective of where they are manufactured) would achieve the average penetration achieved by biosimilars of filgrastim in the EU5. In the Slow penetration, it is assumed that biosimilars in third countries would achieve the average penetration of somatropin and epoetin (weighed by sales in the EU5 countries).
In the third step, to estimate share of EU biosimilar companies, the same trade statistics as with generics are used. However, CRA needs to adjust manually some shares because of unreasonable results – which again raises some doubts on the appropriateness of the methodology. For Brazil, their methodology gives a share of more than 100% for biosimilars. For China, Russia and Turkey, IMS does not provide data on biosimilars, so CRA assumes the share in these four countries to be equal to the lowest (which is the US with 25%).
Due to limited data, the analysis focuses on additional export sales from EU based biosimilar companies (i.e. additional sales from first mover advantage is excluded). The report also assumes that even under SPC waiver, entry of any biosimilar would occur one year following SPC expiry in third country.
In terms of results, a critical assumption driving the results is the use of the fast or low penetration scenario. For the former, by 2025, CRA estimates the potential market for biosimilars would be €10.4bn – which is much lower than the €23.5bn estimated for generics; with the latter, this figure is just below €3bn. This has important implications for additional EU biosimilar sales: there is a dramatic difference between the fast scenario and the low one (€2.9bn vs €0.5bn). This analysis shows the importance of the assumptions used by CRA in driving the results.
We now highlight they key issues in CRA’s modelling/assumptions for each of the steps. We have not done further adjustments to the biosimilars (and innovative biologicals), as
Review of CRA report: OHE Consulting 02/01/18
59
we have done for non-biological generics (and innovators). This is due to the lack of data.
4.2.1. Key issue 1 for biosimilars: Sample of biologicals used in the analysis
Table 25 in the CRA report provides information on the sample used for the analysis. The numbers are very low indeed – from a starting point of 17 molecules, the maximum number of molecules with later SPC expiry is Europe is nine for the US, going down to five for Brazil and Turkey. Australia is not even included in the analysis as CRA did not identify any molecules with earlier expiry in Australia.
This is a very small sample, coupled with the fact of very little information about biosimilar use in third countries (which is also due to a lack of a clear biosimilar approval pathway in some countries, including the US), so we would recommend that the biological analysis should be taken with caution. This caution is even more important given the increasing number of biologicals in the market and in the pipeline, and that big-selling biologicals will be losing protection over the next years. We could expect then to see more biosimilars coming into the new market. However, there is considerably uncertainty in terms of what could be the potential impact of an export waiver for the European based biosimilar (and indeed biological) industry. As with the generics industry, we feel an analysis of the characteristics of this industry would have provided useful information to understand better the different links modelled by CRA.
4.2.2. Key issue 2 for biosimilars: Estimated market size that would be available to all biosimilars after losing protection in third country
Given the data limitations, and as explained above, CRA uses two scenarios to model share of all biosimilars in third countries, which are based on the EU5 experience. CRA focuses on the “fast penetration” scenario (given impact under slow scenario is very small), but do not provide a rationale as to which of the two scenarios, if any, could be most relevant. We feel that given the current market dynamics for biosimilars (e.g. lack of regulatory pathway), the slow penetration might have been more realistic. If this is the case, the resulting market potential for all biosimilars is certainly reduced (as shown in Table 27). Also, the literature could have been useful to try to fill the gaps on these shares.
Also, as with generics, the CRA report does not detail the exact market shares obtained by all biosimilars in each of the third countries. This means the CRA analysis cannot be replicated.
Finally, and similarly to generics, the CRA analysis is done at “list” prices. However, many biosimilars are dispensed and used in hospitals, and hence there is heavy discounting – this discounting may be even higher than discounting for generic medicines in primary care10.
10 Without going into the details, the market dynamics between primary care (medicines dispensed by pharmacists) and secondary care (medicines used in hospitals) are very different, and we understand (confidential) discounting is very common for hospital medicines across Europe – via tendering, for instance.

Review of CRA report: OHE Consulting 02/01/18
60
4.2.3. Key issue 3 for biosimilars: Share that European biosimilars producers could achieve if they entered during the first year of protection expiry
For the European share, and from footnote 259, page 113 (when discussing European market shares), we understand the same trade and IMS data is used to calculate the European market shares for biosimilar manufacturers – with the exception of China, Russia and Turkey where no sales data on biosimilars was available (and for Brazil the estimated share was higher than 100%). This means that our previous comments regarding the potential flawed methodology on EU based generics producers apply here too.
Also, we are not clear what actual market shares has been used for each country for European biosimilar companies. We understand the EU share will be 25% for US, Brazil China Russia and Tukey (see above). For Japan and Canada, we assume CRA uses the same share as for generics (23%). Australia is not included, as mentioned above.
The decision of where to locate a biosimilar manufacturing plant is more challenging than a non-biological one – leading to potentially more concentration. This could imply there will be fewer biosimilar plants, so the decision as to where to locate is even more important. On the one hand, the export waiver could have a bigger impact than expected if firms relocate to Europe because of the waiver; on the other, if companies do not need to build another plant in Europe, having the waiver will have very little, if any, effect.
We have identified some literature11 regarding factors affecting location of manufacturing/R&D biotech technologies – which we comment below for the innovative biological industry. However, it should be noted here that biosimilar manufacturing facilities could be deemed as similar to originators in terms of complexity, so the drivers that apply to originators may also apply for biosimilar companies.
Based on EMA biosimilar approvals, we are aware that European companies with HQ in Europe have a prominent role in developing and manufacturing biosimilars, including Sandoz. Hospira and Teva are also big players. Korean companies also have approved biosimilars being sold in Europe. And increasingly companies like Amgen, traditionally focusing on innovative products, are also involved in developing biosimilars. However, the critical issue for the mid/long term future is whether the new wave of biosimilars will be manufactured in Europe or outside – irrespectively where the company’s HQs are located.
4.2.4. Key Issue 4 for biosimilars: First mover advantages
CRA notes the lack of evidence of any first mover effect for biosimilars, so do not include this effect for biosimilars. Given that switching costs are likely to be higher for biosimilars than for generics, this supports our view that, in contrast to CRA’s view, the presence of price competition reduces or eliminates any first mover advantage that may arise from the size of switching costs.
11 It was beyond the scope of our analysis to undertake a detailed literature review.
Review of CRA report: OHE Consulting 02/01/18
61
4.3. Potential effect on European innovative pharmaceutical industry
CRA looks at the impact on the European innovative pharmaceutical industry, and specifically the lost sales as a result of new generic/biosimilar entry (from European companies) during period following protection expiry in third countries – distinguishing between biologicals and non-biologicals. For non-biologic brands, the report assumes two drivers for these lost sales:
1. Extent to which these EU companies manufacture from outside EU 2. Extent to which SPC export waiver increases generic competition in these markets
It should be noted that driver 1 also applies to EU generic companies, and the extent to which these companies manufacture from within or outside EU.
We agree with these two drivers: however, we believe that two others are as important, which are not mentioned: existing share of the EU companies before patent expiry in the third country, and their reaction (in terms of price) to generic entry. As mentioned already, CRA assumes there is no price reaction from innovators (which might not be the case, as illustrated already in Figure 10)
In summary, the methodology is similar as before, and is done in stages. First CRA estimates total market available for the originator after patent expiry, and then estimate the EU share of that. Due to data limitations, they take a different approach for the second step calculating the EU share for non-biologicals and biologicals innovative industry.
We understand that for non-biological pharmaceutical imports, the share of the originator would be given by the remaining share left by all generics (as calculated above).
There is no data on Europe manufactured innovative medicine export sales (non-biological) into third countries, so CRA relies (as before) on trade statistics on non-biological pharmaceutical imports into each of the eight third countries from EEA. They assume the share of innovative to generics in imports from the EEA is the same as the share of innovative to generics sales in the domestic pharmaceutical sales market, based on IMS Midas data. Then, they divide the resulting figure by the value of non-biological innovative sales in the export markets, based on IMS Midas data to determine the share that European innovative medicines could achieve in innovative sales in the export markets. As per footnote 287 (page 134), the EU shares are as follows: Australia (43%), Brazil (13%), Canada (21%), China (13%), Japan (11%), Russia (62%), Turkey (37%) and USA (8%).
For biologicals, to estimate the share of European reference products in third countries, CRA uses information from EMA on name and location of the manufacturer of the active biological substance (EMA). As shown in footnote 291, the average share of sales of innovative biologicals are: Brazil: 34%, Canada: 36%, China: 37%, Japan: 41%, Russia: 92%, US: 36%, Turkey: 100% (only 1 product).
Table 13 compares the resulting shares used by CRA, across generics and brands, and for biologicals and non-biologicals.

Review of CRA report: OHE Consulting 02/01/18
62
Table 13 Comparison of EU companies shares, generics/innovative, non-biologicals/biologicals
Country / Share
EU generics
EU innovative
Total share
EU
EU biosimilars
EU innovative
Total share
EU
(non- biologicals) (biologicals)
US 16% 8% 24% 25% 36% 61% Brazil 21% 13% 34% 25% 34% 59% China 32% 13% 45% 25% 37% 62% Japan 24% 11% 35% 24% 41% 65% Australia 23% 43% 66% NA 43% 43% Canada 24% 21% 45% 24% 36% 60% Russia 23% 62% 85% 25% 92% 117% Turkey 23% 37% 60% 25% 100% 125%
Source: CRA
Focusing on the columns showing total share EU, we can see that the shares can be very significant for non-biologicals, and can even be higher than 100% for two countries for biologicals, which cannot be correct.
CRA then assumes lost sales for the innovative producers post patent expiry. They make different assumptions for non-biologicals vs biologicals. For non-biologicals, CRA uses a 10% and 20% sales reduction as the impact of the export waiver. For biologicals CRA assumes a 10%/20% reduction in originators export sales in developed/emerging countries (Case 1) and an analogous 20/40% reduction in Case 2.
They key results are estimated losses between €139m and €278m by 2025 for non-biological brands (Table 31), and a reduction of export sales by the European originator biologicals of €868 million by 2025 in case 1 and €1.7 billion in case 2 (Table 34).
CRA estimate the market size available to molecules in their sample by assuming no effect on originator prices post generic entry but a reduction in sales volumes of innovative pharmaceuticals that corresponds to the average levels of generic penetration observed in these markets post protection expiry in the export markets. Again, we believe that the effect of more intense price competition will depress the overall value of the market, which will reduce the value of the sales for the originator. This is our key issue 7, which we pick up later, noting here that CRA does not address this issue.
As before, we have identified a number of issues worth highlighting regarding the assumptions and modelling on the two key elements of this part (market size available to all innovative; share for European companies and decline in sales). We take these in turn, distinguishing between biologicals and non-biologicals where relevant.
4.3.1. Key Issue 5: Estimated market size available to all innovative pharmaceuticals during SPC protection in Europe
As noted in Key Issue 2, market shares of innovative products (overall) could have been underestimated by CRA. This implies that the first adjustment to the innovative market size is to assume their market share is 64%.

Review of CRA report: OHE Consulting 02/01/18
63
CRA argues that the much lower estimates for innovative producers going forward is due to higher generic penetration in these countries, but do not provide references justifying these results. As before, we are not told by CRA the exact shares of innovative pharmaceuticals in these countries (which of course should be 1 minus the generics share).
As with generics/biosimilars, our general comment for both biologicals and non-biologicals on the estimated market size available to originators is the lack of clarity on the methodology and assumptions used to generate the forecasts in Table 31 and Table 33 (as with Table 20 for generics). The analysis cannot be replicated, as no country specific information (in terms of potential sales, for instance) is provided.
For biologicals, CRA uses the assumptions used before for biosimilar entry (fast and slow penetration scenarios, based on EU5 experience), to estimate what is retained by the originators. So, our previous comments on that assumption apply here.
4.3.1.1. Adjustments to the CRA numbers
We have increased the market share for innovators post protection expiry – from 27% to 64%. The effect of this change is to increase the estimated innovators sales (irrespective of origin) in 2025 from the original €10.0bn to €21.4bn.
In addition, we should note that the adjustments above regarding originators’ response and ‘list to net’ also apply to innovators sales. The effect of both adjustments is to reduce sales in 2025 from the €21.4bn (see previous paragraph) to €13.7bn.
4.3.2. Key Issue 6: Share that European innovative companies could achieve and decline in sales
We also distinguish between non-biologicals and biologicals, as there are differences in the methodology.
Innovative non-biologicals
For innovative non-biologicals, and as with generic companies, CRA needs to combine the two different databases: trade statistics and sales, as described above. This time, they use the innovative/generics ratio in terms of sales in the third country to estimate the innovative pharmaceutical exports coming from Europe. Again, the innovative sales might be manufactured outside Europe, so CRA methodology would probably overestimate (or underestimate) the sales European innovative companies might achieve.
Results produce high variability of shares (8% (USA) – 62% (Russia)). Moreover, when you sum these shares with those estimated for European generics (see Table 13), they come up with very high shares. This might be unrealistic, as we know share of domestic players is significant.
CRA estimated shares for EU (non-biological) innovative for countries in the sample (footnote 287) are: Australia (43%), Brazil (13%), Canada (21%), China (13%) Japan (11%), Russia (62%), Turkey (37%) and the USA (8%). Recall the shares for EU generics for countries in the sample (footnote 259) used by CRA were: Australia (23%),

Review of CRA report: OHE Consulting 02/01/18
64
Brazil (21%), Canada (24%), China (32%), Japan (24%), Russia (23%), Turkey (23%) and the USA (16%). This is also shown on Table 13 above.
We have also compared the additional European generics manufacturers sales as a result of the export waiver (including first mover advantages) with lost sales by the EU innovative pharmaceutical – to sense check the numbers. With the 10% reduction in sales for innovative, the estimated total additional generic sales are between 30 and 57 times12 (increasing over time) higher than the estimated lost innovative sales (16 times with the 20% reduction). We think this is not feasible, as indeed, the additional generic sales would be replacing innovative sales. It reinforces some of the methodological weaknesses of the modelling and assumptions.
It is also interesting to note that CRA argues that “It is reasonable to expect that since generic competition is already intense in less regulated emerging markets but also in developed markets such as the US, EU based originator companies would, even in the absence of an SPC export waiver, face competition from non-European generics producers” (page 135). However, CRA does not make a similar argument for European generic companies when entering such markets – but this reasoning would also apply to them i.e. it seems that this strong generic competition only applies to European innovative producers, and not European generics.
For non-biologicals, we can use the analysis in Logendra et al. (2017) to analyse market shares for some innovators post generic entry in some third countries (section 4.1.2). For innovative molecules, the key results are:
- Atorvastatin in Brazil, where the volume of the original brand remained relatively flat. The originator API and tablets are made in the EU.
- Esomeprazole in Turkey. The volume of the original brand continued to rise following the entry of generics.
- In both cases innovator value fell and generic entry increased overall volumes
Logendra et al. (2017) argue that original brands retain some brand equity in a number of non-European countries several years after generic entry. They also show the importance of generics produced locally, as shown above. They suggest that in some markets, “generics manufactured in Europe are more likely to compete for market share with the original brands (capitalising on the notion of European brand value), than with low-priced domestically manufactured generic products, with which it would be much harder to compete” (page 4).
Logendra et al. (2017) conclude that if both the originator (often manufactured in Europe) and European generics are competing for market share outside the EU, a potential consequence could be fewer original brand exports from Europe to non-European countries, as these are replaced with European generics. This could therefore cause employment losses to innovators in Europe, and also a reduction in trade value level caused by the shift to exporting cheaper generics instead of original brands. If this is correct, then the estimated loss sales for originators by CRA will be underestimated – and indeed, overall, no positive effects could be achieved.
12 For instance, in 2025, total additional European generics sales amount to €7.6bn; under the 10% decrease, European branded companies lose €139m; the 7.6bn figure is more than 54 times bigger.

Review of CRA report: OHE Consulting 02/01/18
65
Pugatch Consilium (2017) take a different angle, and carry out a six-step analysis to estimating potential losses to European-based and global research-based pharmaceutical industry from an SPC export exemption. This is based on a ‘helicopter view’, based on high level figures and assumptions. We have some reservations about the analysis carried out in step 4 in particular, as we are unclear how the delay in six months leads to the 50% reduction in sales.
Innovative biologicals
For biologicals, we have a main comment regarding CRA’s estimate of the share of European reference products in third countries (based on manufacturing location): we understand it assumes there is a direct relation between location (in EU) and sales (in third countries). For example, if a company has two locations, one in Europe and one outside Europe, shares in the third country would be evenly shared across the EU/non-EU location. We see this assumption as restrictive, as it implies that having an EU location automatically ensures products sold there are manufactured in Europe. This methodology might be the reason for the high shares for European originator companies for some countries – between 34% and 100% (for Turkey for 1 product).
To sense check the numbers, we have compared estimated market shares for the biological markets, for biosimilars and reference products, for the 2016-2025 period (combing tables 27 and 31) (data not shown). The market shares for the latter are around 30%; and thus 70% for the originators. We think these shares are realistic (relative to our point above regarding the 70% share for generics). We have also compared the additional EU based biosimilar companies’ sales with lost sales for EU innovators (under both cases). The results here look plausible, as additional sales for biosimilars are just slightly above originator’s losses.
It is beyond the scope of our work to explore in detail the drivers underpinning where to locate biological manufacturing plants, noting that CRA does state that many drivers affect this decision. However, it seems that the existence, or otherwise, of an SPC/SPC exemption does not factor prominently, if at all. For example, Amgen (who manufacturers both original biologicals and biosimilars) states that “When making manufacturing choices, we base every decision on our guiding principle to deliver meticulous quality…transforming complex therapeutic proteins from the laboratory into the large-scale production of safe and effective biologic medicines requires highly specialized knowledge and experience with processes, scientific standards, and quality systems”13 . These comments apply to both reference and biosimilar products. Likewise with Sandoz and Novartis, where Sandoz expects to benefit from increased scale in moving towards one manufacturing organisation with Novartis (Francis, 2016). Whether there are SPCs or export waivers is not mentioned as a factor.
More generally, Shimasaki (2014) lists the five essential elements14 of biotech and Humphrey (2014) shows the complex nature of global competition in the life sciences industry. As there is limited evidence on the use and impact of export waivers, it is
13 Source: http://www.amgenbiosimilars.com/amgen-and-biosimilars/manufacturing-excellence/ 14 These are: abundance of high quality, adequately funded academic research; Ready resource of seasoned and experienced biotechnology entrepreneurs; Ready access to sources of at-risk, early and development-stage capital willing to fund start-up concepts; Adequate supply of technically skilled workforce experienced in the biotechnology industry; Availability of dedicated wet-laboratory and specialized facilities at affordable rates.
Review of CRA report: OHE Consulting 02/01/18
66
perhaps not surprising that export waivers are not found in the different lists of elements determining manufacturing location. However, the robustness of a country’s IP system is one of the factors entering into consideration when deciding where to invest / set up new manufacturing plants.
4.3.2.1. Lost sales to EU innovators
CRA uses the same methodology to estimate lost sales to the EU innovators (Cases 1 and 2 respectively) for biologicals and non-biologicals. An alternative approach to estimate lost sales by the innovative sector off patent could be using a share of those additional sales generated by European generics companies, rather than the arbitrary percentages used by CRA. This issue was discussed in Section 4.1.3.3, where we argued that a substitution effect could occur, and thus the additional EU generics sales might come at the detriment of EU innovators. If this is the case, the figures used by CRA would certainly underestimate these losses.
4.3.2.2. Adjustments to the CRA numbers
We do not make any adjustment for the EU innovators market share. Further detailed analysis is required to get a better reflection of two key parameters: market shares of EU innovators in these third countries and their manufacturing source/origin.
For EU innovators market shares, Logendra et al. (2017) provides direct evidence of market shares without the need to use proxies. We are unsure why CRA was not able to obtain this data.
Second, it would be required to ascertain how often are European-based manufacturing locations used as the source of the products sold in the third countries.
However, it should be noted that the 10%/20% estimated lost sales will change in absolute terms as the total sales of EU innovators change. For instance, with the revised market share for all innovators, the lost sales to EU companies increase to €299m (from the original €139m).
4.3.3. Key Issue 7: Reduced remaining sales as a result of increased competition
We have seen before that originators can actually decrease their price too after generic entry, leading to more intense competition. This means that the value of the market decreases (as CRA illustrates with the payer savings analyses). This means, that for the remaining innovative sales, the existing volumes will be sold a lower price, hence reducing the value of its sales. CRA has not raised this issue. We think it is an important effect to model. For this reason, we estimate by how much the remaining sales will be reduced, should prices decrease by 20% as a result of increased competition and originator’s response.
4.3.3.1. Adjustments to the CRA numbers
This additional estimate of lost sales for innovators is estimated to be €382m, after all the necessary adjustments are made to innovators sales.

Review of CRA report: OHE Consulting 02/01/18
67
Taking into account all adjustments to the EU innovators, and our additional estimated losses, we estimate that CRA’s original estimate of €319m lost sales increase to €573m by 2025 – being this figure a lower bound, as other adjustments could come into play, as argued above, especially the substitution effect which could lead to no net effect, or, in theory even negative.
4.4. Assessment of wider impact
The CRA reports looks at three “wider” variables: incentives to innovate, employment and speed of generic/biosimilar entry.
For the first one, CRA argues that the change is unlikely to negatively affect incentives to innovate in Europe as it does not reduce the period of patent or patent term extension either in Europe or outside Europe. It is true that introducing an export waiver does not reduce protection period, but we have seen that such waiver will reduce innovative sales for European companies (although we are unsure as to how much). If these reductions are considerable (something that CRA argues will not be the case), that will necessarily have an impact on jobs and R&D investment by these companies, analogously to the increased jobs/R&D for European generics as a result of the increased sales.
Second, CRA argues that the change is likely to result in increased employment in the European pharmaceutical industry as a result of increased sales by European generic and biosimilar producers. And furthermore, could attract further R&D facilities, as they locate near to manufacturing facilities.
The employment analysis is based on “net”15 sales for both non-biologicals and biologicals. It combines (2013) data on production and number of employees for the EU pharmaceutical industry (Eurostat), but does not distinguish between brands/generics, and between biologicals/non-biologicals. The first step is to estimate average production per employee, which is calculated by dividing production (€210,523 million) by the number of employees (554,400), resulting in an average production per employee of €380,000. This average productivity is a critical parameter driving additional employment figures (together of course with the additional sales). In terms of additional jobs, CRA estimates an additional 20,000-25,000 jobs (across non-biologic/biologic industry (innovative/generics/biosimilars)).
Third, it is argued that the change could additionally result in speedier entry of European generics and biosimilars following protection expiry in the EU markets, generating savings to third party payers in Europe.. For this impact, CRA also distinguishes between biologicals and non-biologicals. For illustrative purposes CRA estimate expenditures if generic entry for these molecules occurred in the EEA immediately following protection expiry as a result of the SPC export waiver compared to expenditures if generic entry occurred: i) in the third quarter following protection expiry (CRA states that the EU average delay for generics is 8.2 months); ii) in the second quarter following protection expiry, assuming delays will reduce in the future, without an SPC export waiver. CRA estimates the savings on pharmaceutical expenditures for the sample of molecules to be between €1.6 billion to €3.1 billion over a three year period, or a 4% to 8% saving
15 We should note that “net” here refers to taking into account both additional sales for EU generics and lost sales from EU innovators.
Review of CRA report: OHE Consulting 02/01/18
68
relative to expenditures with generic entry in the 2nd or 3rd quarter following protection expiry.
For biosimilars, CRA estimate expenditures if biosimilar entry for these molecules in the EEA occurred 6 months following SPC protection expiry with an SPC export waiver compared to 1 year without an SPC export: savings amount to €0.6 billion or a 2% saving.
We have identified a number of issues concerning two key assumptions here: methodology to estimate additional jobs and payer savings.
4.4.1. Key Issue 8: Increased employment
The methodology used to estimate increased employment as a result of the waiver is the same for biologicals and non-biologicals. We have a number of issues.
First, CRA assumes a direct link between additional sales and additional employment, noting that CRA does comment that this relationship depends on the workers’ productivity. We are unsure whether CRA’s method to estimate additional number of jobs (from additional sales) is the standard used in the literature, or whether other methods have been used. It would have been good for CRA to provide some rationale as to their method, and implications for the results they obtain.
Second, we are unclear whether the figures (production and employment) used to calculate “average production per employee” are actually the most appropriate. In terms of “production”, (which we assume refers to “turnover” in the relevant Eurostat table), such figure might include other economic agents in the distribution chain, and thus the full number might overstate the “true” production/turnover for pharmaceutical companies; however, we are unsure by how much.
In terms of employment, Medicines for Europe (former EGA) states that the sector employs 160,000 people (and this figure is used by CRA); EFPIA, on the other hand, 740,000 (for 2015)16, making a total of 900,000, which is significantly higher than the 554,000 provided by the Eurostat database. Using the same production figure (Eurostat), and with this new total employment figure, the resulting average production per employee decreases to €234,000 (from €380,000).
If we then use this lower average worker production, and given the methodology used by CRA, the additional sales estimated would actually lead to more additional jobs, because the workers are “less” productive and thus you need more workers to generate that same revenue. This does not make sense, and seems counterintuitive. This means that the lower the worker productivity, the more jobs that will be “created” under the export waiver, keeping additional sales constant.
Third, the same Eurostat database (NACE R2) reports on what seems a more potentially relevant parameter: “Apparent labour productivity”, which is defined as value added at factor costs divided by the number of persons employed. The number for “Manufacturing of basic pharmaceutical products and pharmaceutical preparations” for 2015 was €150,000 per head – which is much lower than the €380,000 estimated by CRA. As
16 Source: https://www.efpia.eu/publications/data-center/the-pharma-industry-in-figures-employment/employment-in-the-pharmaceutical-industry-by-year/. There is no figure for 2013, but for 2010 it is 670,088.
Review of CRA report: OHE Consulting 02/01/18
69
stated above, given the methodology used by CRA, a lower productivity per worker relative to their estimate of €380,000 would “inflate” the additional number of jobs, for reasons not related to the export waiver. This shows that this analysis should be taken with caution.
Fourth, doing the analysis at aggregate industry level might be very misleading when looking at specific job impacts for brands/generics/biosimilars. Indeed, we would challenge whether this assumption is correct. It could be argued that innovators use higher qualified personnel than more process-oriented generic producers. The estimation of new jobs does not consider this technology effect.
We also have a comment about the following statement (page 145): “To put these figures in perspective, according to the EGA the EU generic and biosimilar industry directly employs 160,000 people, therefore an additional 20,000-25,000 jobs represent a 13-16% increase in employment”. It should be noted the additional 20-25,000 extra jobs is the cumulative effect until 2025, but the 160,000 workers is for a point in time. Thus, we feel the 13-16% increase should have been caveated, as the reader is felt with the impression that in any one year there could be a 13-16% increase in number of jobs, which is certainly not the case.
Indeed, if we look at annual employment figures (tables 36 and 37), we see a big percentage increase for 2017 and 2018 (56% and 40% respectively17) for non-biologicals, and then single digit growth rates thereafter. For biologicals, annual increases are much lower.
Additionally, if the value of the market and the gross value added (GVA) produced by innovators decrease by the price effect, then the productivity will be lower and the number of jobs lost higher. It would be important to ascertain the net effect.
4.4.1.1. Adjustments to the CRA numbers
In terms of employment, we adjust for the lower net sales figures. Additional jobs created by 2025 would decrease from 19,543 to 2,837, an 85% decrease (assuming 10% losses for innovators).
We do not make any further adjustments to take account of Key Issue 8. However, we feel further work is required to address the following questions:
What is the correct methodology to link additional sales with additional employment? Low productivity activities result in the most jobs, but not the highest EU value-added.
What is the best data to use? There are very different numbers around.
Generics and innovators provide very different value added per employee. How should this be taken into account?
4.4.2. Key Issue 9: Savings to EU third payers
As mentioned above, the only difference between non-biologicals and biologicals is the assumption used in terms of impact of export waiver: immediate entry following
17 These percentage increases are driven by growth rates in additional generic sales.
Review of CRA report: OHE Consulting 02/01/18
70
protection expiry as a result of the SPC export waiver versus entry in second or third quarter for generics, and entry after six months following SPC protection expiry with an SPC export waiver compared to one year without an SPC export waiver for biosimilars.
In terms of the third “wide” effect (speedier entry in EU markets leading to savings) the report highlights that the resulting savings for EU third party payers are “illustrative as they assume that the entire delay in generic and a large part of the delay in biosimilar entry is the result of preparing for large scale production” (page 152). The report cites a number of variables affecting delays, which might be more important than having, or not, the export waiver. CRA does not attempt to explore the relative importance of each factor. We acknowledge this might be difficult, but further analysis based on the literature review could have been done, rather than attributing all the reduced delays to the export waiver.
Indeed, it should be noted that the report identifies as one impact of an export waiver reducing delays in generic entry in EU markets i.e. there is a causal relationship between the waiver and reduced delays. However, what is less clear from the analysis is the exact attribution of the export waiver to these reductions – we would question whether the export waiver can really decrease that much these delays, on its own? i.e. the assumed causality is not tested or proven.
Overall, we think that the analyses done by CRA of key determinants of generic entry drivers justifies mitigating their findings on savings to EU third party payers, to take into account these other factors/determinants. For instance, a waiver may not lead to entry/speedier entry for every molecule / every country, as other factors might mitigate generic entry anyway (such as lower expected profitability). This will obviously reduce the estimated (positive) impact of the waiver.
We also have some detailed comments about the methodology used by CRA. In page 150, the CRA report states that “the EU average delay for generics is 8.2 months”, and this delay is critical to estimate the savings. There are a number of issues with how CRA has estimated this delay, and how it is used in the report.
First, the 8.2 months comes from the information in Appendix D – which is actually used for Scenario 5, not Scenario 4, but noting it is relevant for both. We feel using a number without referencing its source is not good research practice. Only when you read Scenario 5 you know where the number comes from.
Second, in terms of the analysis underpinning this figure, the details have not been included in Appendix D; again, it is just included as a footnote there (footnote 349, page 198).
Moreover, we feel this 8.2 months delay is actually not consistent with other references provided by CRA in other parts of the report. Two such cases are:
Citing a 2009 EGA report, in Scenario 6, CRA reports average delays faced by generics producers due to P&R negotiations at a country level. We are not given the average delay across all countries, but the numbers therein seem to be much lower than the 8.2 months (page 172/173) – noting that for some European Eastern countries the delays are between 200 days (which is still less than 8.2 months) and one year.
In Section 4.7.4, also for Scenario 6, CRA provides evidence for molecules experiencing generic entry following protection expiry (Tables 46/47). It shows that while there is variation across Member States, “most Member States

Review of CRA report: OHE Consulting 02/01/18
71
experience generic entry during the first quarter since protection expiry, in more than half of the molecules that lost exclusivity during this period” (page 174). CRA does not try to reconcile this analysis with the 8.2 months.
Referring back to Figures 16 and 17, it might be misleading how savings are calculated, as indeed there could be generic entry very close after patent expiry – and not 8.2 months, as shown in Figure 16. That means the flat line at price index (= 1) for two or three quarters may not be not a true representation. Instead, savings could have been modelled by greater price competition, as a result of more generic entry i.e. steeper decline for the price index curve, but starting at quarter 0 rather than 2 or 3. This is in fact how savings are modelled in Scenario 6 (figure 19).
Also, the CRA report does not provide the detail as to how the savings have been estimated, and thus the analysis cannot be replicated to explore the impact of our suggested approach to model the impact on savings.
Finally, and as mentioned above, the IMS data used is at “list” prices, and rightly so the CRA report argues that “It should also be noted that the generic and biosimilar price decay is based on IMS Midas data and does not reflect rebates and other discounts offered by pharmaceutical companies to e.g. hospitals, which can be significant” (page 152). This means that the potential savings estimated by CRA will be much higher than the ‘real’ savings, as payers would already be benefitting from such rebates (but are not taken into account). The report does not attempt to quantify how big such rebates are, and implications for estimated savings.
Finally, it should be noted that payers’ savings (in Europe) come as a result of a decrease in the weighted average price post generic entry, including prices of brands and generics. CRA find that average prices (weighted average across generics and innovative) decline by 15% in the second quarter following entry and by 23% in the 4th
quarter following entry. Prices continue to fall thereafter at a declining pace. And by the end of the three years following generic entry, market prices on average across the EEA countries in CRA´s sample are almost 40% lower. This means that prices of innovative products decrease, even though in the estimation of total available sales for generics, CRA assumes constant prices of the innovative products (as raised before). This is inconsistent.
4.4.2.1. Adjustments to the CRA numbers
We do not adjust the CRA numbers as a result of the concerns we raise on Key Issue 9. Before knowing with better precision the potential savings for European payers as a result of the export waiver, it would be necessary to undertake further analysis on the following questions:
Can the export waiver actually reduce delays in entry? Are other factors more important in causing delays?
If the waiver can reduce delays, what would be the additional impact to the existing competitive forces? Here, the evidence discussed in Scenario 6 is relevant, where we argue that additional generic entrants beyond a certain number have limited impact on price competition. The marginal impact of a further entry decreases with the number of entrants i.e. the reduction in price is lower for later entrants.

Review of CRA report: OHE Consulting 02/01/18
72
4.5. Revised estimates
In this section, we summarise our revised estimates when we change some of the original inputs/assumptions, based on the evidence presented in previous sections.
We have only done adjustments to non-biologicals. We distinguish between generics, brands, net effects and wider effects. We make five adjustments to generics, three adjustments to EU innovative, estimate a new additional loss to innovators, and one adjustment to wider impact. These adjustments follow the key issues raised above. Given their nature, it makes sense to add them in steps, as explained below. The table with all detailed results are in Appendix 4.
Our first adjustment to the model is to revise the shares of brands and generics of the total market. Throughout the forecast period, we assume that the share of generics across all countries is 36%, and thus the share for innovative is 64%, post-patent expiry. The effect of this change is to reduce the estimated additional European generics sales in 2025 by half, from the original €7.6bn to €3.9bn. This is before making a number of additional adjustments we think are appropriate but which CRA do not provide enough data to undertake.
For innovative companies, including EU companies, and given their higher market potential, the lost sales are higher, €299m vs €139m: they suffer a 114% increase.
The net sales thus decrease from the original €7.4bn to €3.6bn. Table 14 shows the results.
Table 14 Revised impact with revised market shares in third countries
2025 (EUR 000) CRA - original Revised shares B/G
Additional European generic sales 7,565,375 3,881,987 Lost sales European innovative 139,190 298,512 Net effect 7,426,186 3,583,475
Source: Authors’ analysis
The original net estimate of €7.4bn is more than double the revised estimate.
The second adjustment is to model originators’ price response (to the same volume loss) by a further decrease of 20% of the total value of the generics market. This 20% comes from the evidence provided by CRA used to estimate payer savings - this price decrease takes place in Europe, but that we assume that price competition will also take place in the third countries. However, we use a mid-point of the price decreases observed in Europe. The effect is to reduce additional European generics sales from €3.9bn to €3.1bn. The effect is a further reduction of additional generic sales of 10 percentage points. For innovators, it reduces lost sales from €298m to €239m.
The third adjustment is to account for “net” prices. We are uncertain here, as we are unsure how much discounting currently takes place in the eight countries. We assume a further 20% reduction in the value of total sales – as we assume it applies under equally to both generics and innovative. The effect is to reduce additional European generic sales

Review of CRA report: OHE Consulting 02/01/18
73
from €3.1bn to €2.5bn. For EU innovators, it reduces lost sales to €191m, from the €239m above.
Thus, under the three adjustments, total European generics sales decrease to €2.5bn, while lost sales for innovators increase to €191m.
Following these three adjustments to overall market sizes, we then used markets shares of European generics manufacturers from the five case studies in Logendra et al. (2017), as reflected in Table 11. This reduces additional generic sales from €2.5bn to €2.2bn, and has no effect on innovators. The effect is another reduction of four percentage points (to 71%). Again, there are a number of further adjustments we think are appropriate but which CRA do not provide enough data to undertake.
The fifth and final adjustment for generics is to eliminate altogether the existence of first mover advantages. In order to estimate these, we took total generics sales for EU generics manufacturers, and used the original shares estimated by CRA of the first mover advantage, to estimate the relevant sales. We then subtracted total sales by these sales, to get the new generic sales (without first over advantage). Additional sales for European based generics manufacturers is further reduced to €1.3bn, from €2.2bn. There is no effect on innovators.
Table 15 shows the results for all these adjustments, relating the back to the key issues. We distinguish between generics, brands, and net effect. Table 15b also shows additional sales lost by innovators as a result of increased competition (Issue 7). These results exclude a number of adjustments we think are appropriate but which CRA do not provide enough data for us to undertake.
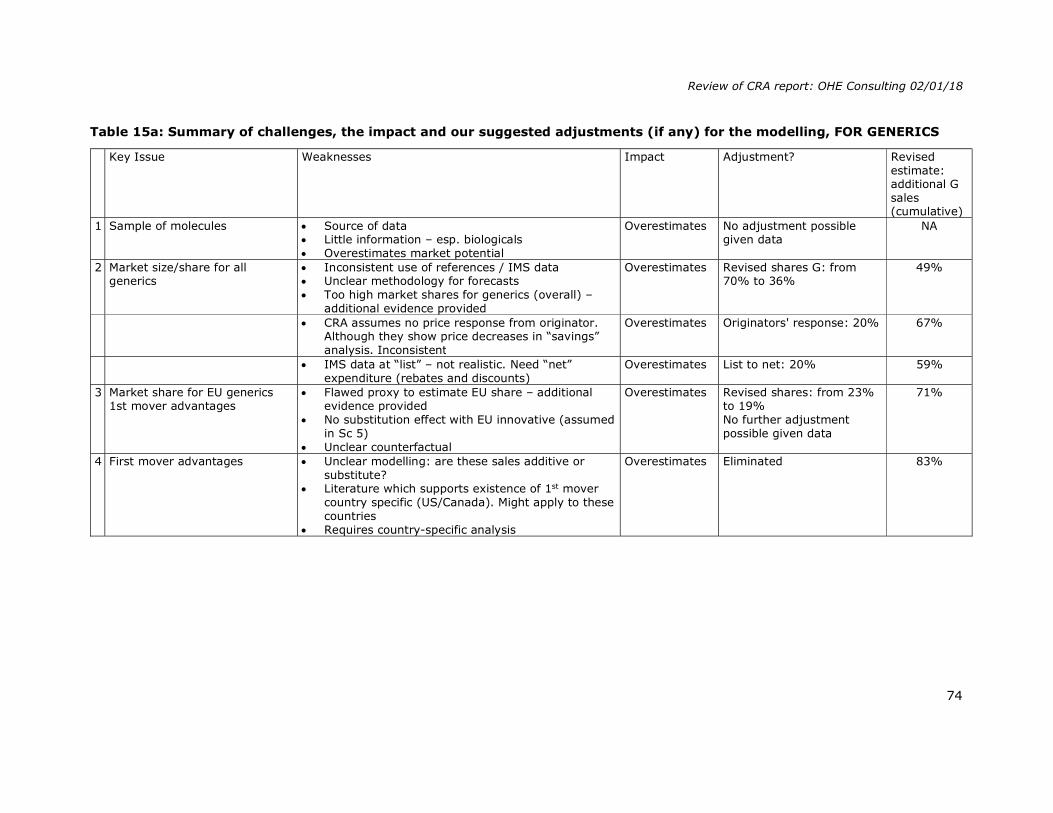
Review of CRA report: OHE Consulting 02/01/18
74
Table 15a: Summary of challenges, the impact and our suggested adjustments (if any) for the modelling, FOR GENERICS
Key Issue Weaknesses Impact Adjustment? Revised estimate: additional G sales (cumulative)
1 Sample of molecules Source of data Little information – esp. biologicals Overestimates market potential
Overestimates No adjustment possible given data
NA
2 Market size/share for all generics
Inconsistent use of references / IMS data Unclear methodology for forecasts Too high market shares for generics (overall) –
additional evidence provided
Overestimates Revised shares G: from 70% to 36%
49%
CRA assumes no price response from originator. Although they show price decreases in “savings” analysis. Inconsistent
Overestimates Originators' response: 20% 67%
IMS data at “list” – not realistic. Need “net”
expenditure (rebates and discounts) Overestimates List to net: 20% 59%
3 Market share for EU generics 1st mover advantages
Flawed proxy to estimate EU share – additional evidence provided
No substitution effect with EU innovative (assumed in Sc 5)
Unclear counterfactual
Overestimates Revised shares: from 23% to 19% No further adjustment possible given data
71%
4 First mover advantages Unclear modelling: are these sales additive or substitute?
Literature which supports existence of 1st mover country specific (US/Canada). Might apply to these countries
Requires country-specific analysis
Overestimates Eliminated 83%
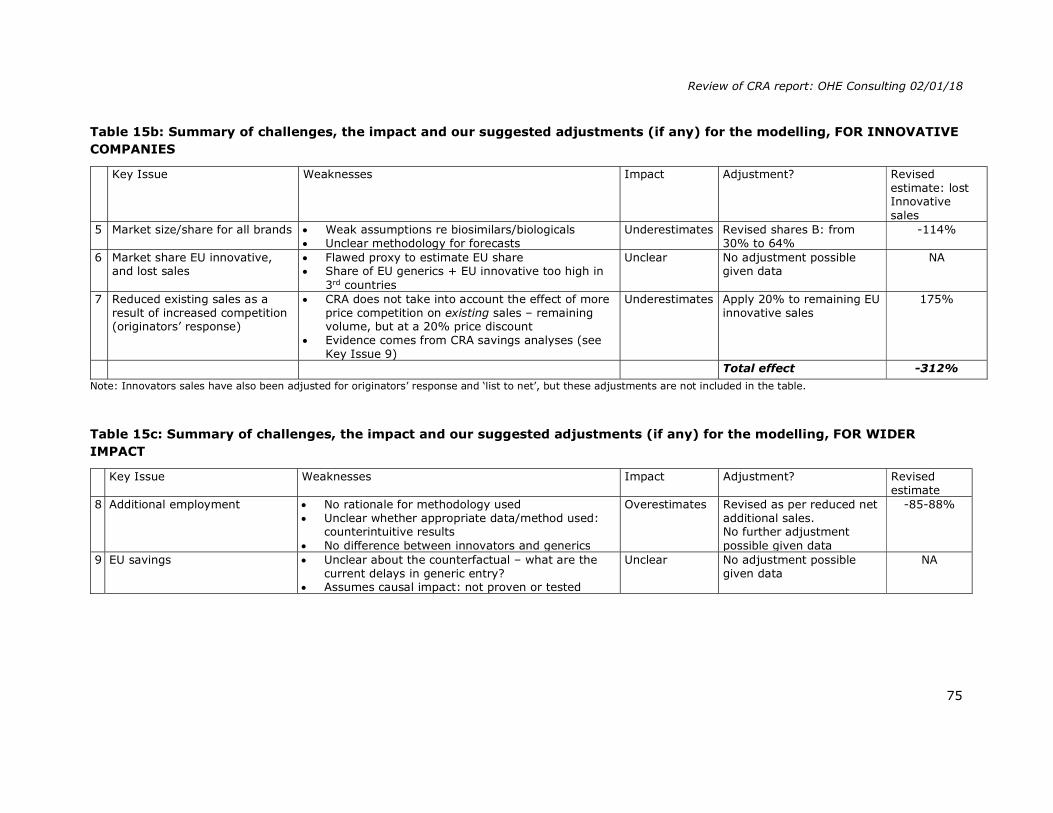
Review of CRA report: OHE Consulting 02/01/18
75
Table 15b: Summary of challenges, the impact and our suggested adjustments (if any) for the modelling, FOR INNOVATIVE COMPANIES
Key Issue Weaknesses Impact Adjustment? Revised estimate: lost Innovative sales
5 Market size/share for all brands Weak assumptions re biosimilars/biologicals Unclear methodology for forecasts
Underestimates Revised shares B: from 30% to 64%
-114%
6 Market share EU innovative, and lost sales
Flawed proxy to estimate EU share Share of EU generics + EU innovative too high in
3rd countries
Unclear No adjustment possible given data
NA
7 Reduced existing sales as a result of increased competition (originators’ response)
CRA does not take into account the effect of more price competition on existing sales – remaining volume, but at a 20% price discount
Evidence comes from CRA savings analyses (see Key Issue 9)
Underestimates Apply 20% to remaining EU innovative sales
175%
Total effect -312%
Note: Innovators sales have also been adjusted for originators’ response and ‘list to net’, but these adjustments are not included in the table.
Table 15c: Summary of challenges, the impact and our suggested adjustments (if any) for the modelling, FOR WIDER IMPACT
Key Issue Weaknesses Impact Adjustment? Revised
estimate 8 Additional employment No rationale for methodology used
Unclear whether appropriate data/method used: counterintuitive results
No difference between innovators and generics
Overestimates Revised as per reduced net additional sales. No further adjustment possible given data
-85-88%
9 EU savings Unclear about the counterfactual – what are the current delays in generic entry?
Assumes causal impact: not proven or tested
Unclear No adjustment possible given data
NA
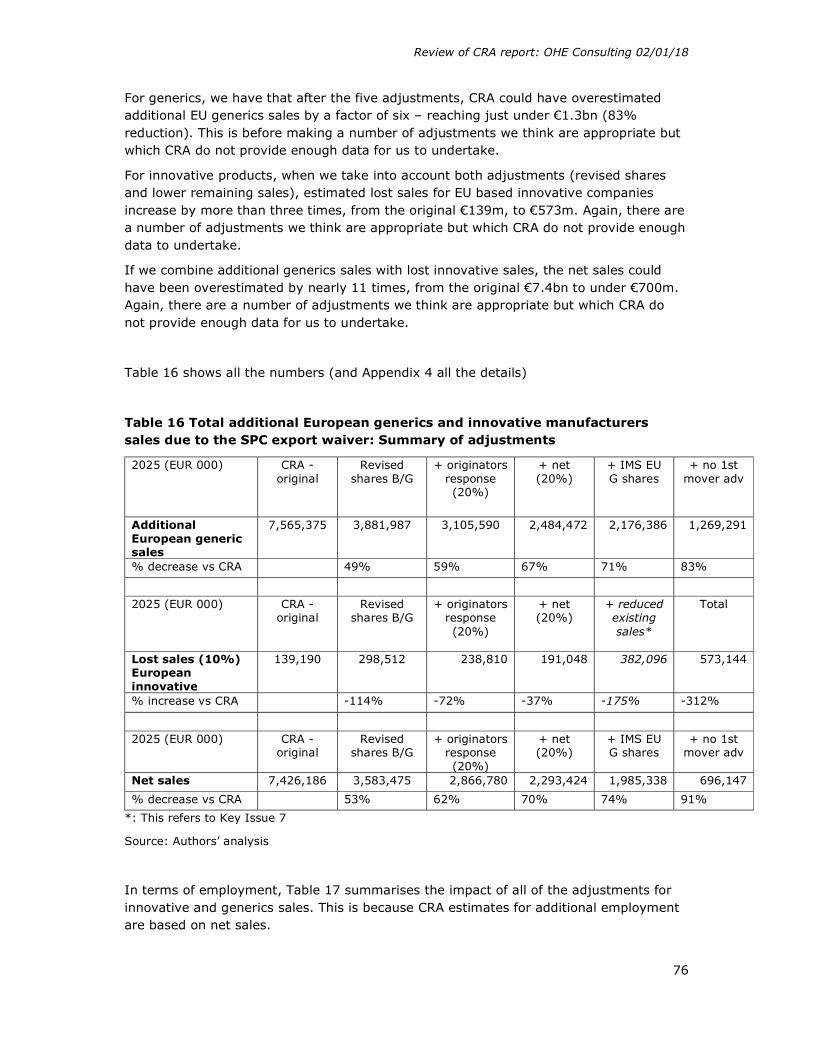
Review of CRA report: OHE Consulting 02/01/18
76
For generics, we have that after the five adjustments, CRA could have overestimated additional EU generics sales by a factor of six – reaching just under €1.3bn (83% reduction). This is before making a number of adjustments we think are appropriate but which CRA do not provide enough data for us to undertake.
For innovative products, when we take into account both adjustments (revised shares and lower remaining sales), estimated lost sales for EU based innovative companies increase by more than three times, from the original €139m, to €573m. Again, there are a number of adjustments we think are appropriate but which CRA do not provide enough data to undertake.
If we combine additional generics sales with lost innovative sales, the net sales could have been overestimated by nearly 11 times, from the original €7.4bn to under €700m. Again, there are a number of adjustments we think are appropriate but which CRA do not provide enough data for us to undertake.
Table 16 shows all the numbers (and Appendix 4 all the details)
Table 16 Total additional European generics and innovative manufacturers sales due to the SPC export waiver: Summary of adjustments
2025 (EUR 000) CRA - original
Revised shares B/G
+ originators response (20%)
+ net (20%)
+ IMS EU G shares
+ no 1st mover adv
Additional European generic sales
7,565,375 3,881,987 3,105,590 2,484,472 2,176,386 1,269,291
% decrease vs CRA
49% 59% 67% 71% 83%
2025 (EUR 000) CRA - original
Revised shares B/G
+ originators response (20%)
+ net (20%)
+ reduced existing sales*
Total
Lost sales (10%) European innovative
139,190 298,512 238,810 191,048 382,096 573,144
% increase vs CRA
-114% -72% -37% -175% -312%
2025 (EUR 000) CRA - original
Revised shares B/G
+ originators response (20%)
+ net (20%)
+ IMS EU G shares
+ no 1st mover adv
Net sales 7,426,186 3,583,475 2,866,780 2,293,424 1,985,338 696,147
% decrease vs CRA
53% 62% 70% 74% 91%
*: This refers to Key Issue 7
Source: Authors’ analysis
In terms of employment, Table 17 summarises the impact of all of the adjustments for innovative and generics sales. This is because CRA estimates for additional employment are based on net sales.

Review of CRA report: OHE Consulting 02/01/18
77
Table 17 Impact on additional employment
CRA - original
Revised shares B/G
+ originators response (20%)
+ net (20%)
+ IMS EU G shares
+ no 1st mover adv
Employment (10%) 19,543 9,430 7,544 6,035 5,225 2,837
% decrease vs CRA
52% 61% 69% 73% 85%
Employment (20%) 19,176 8,645 6,916 5,533 4,722 2,335
% decrease vs CRA
55% 64% 71% 75% 88%
Note: the original CRA numbers (table 36) are not exactly the same as ours due to rounding up.
Source: Authors’ analysis
Assuming either a 10% or 20% reduction in sales of the innovative sector, CRA could be overestimating additional jobs by more than eight times.
It should be noted that we have not adjusted all the parameters/assumptions in CRA’s modelling, mainly due to limited data available, or time/budget restrictions. Further work is required to fill those information gaps. We believe it will reduce further the positive effects, and increase the negative ones, leading to no effect, or, if most of the additional market share came from EU-based innovative companies, to a negative effect overall.
We have noted above some of the overall competitive and IP issues. The medium and long term consequences for the European R&D-based industry of the EU adopting a different approach to IP in order to promote local (European) generics manufacture is unclear. It is not inconceivable that the impact of this on innovative product sales, and therefore on R&D, could have adverse employment consequences that exceed the, now small, employment gains in the generic sector.
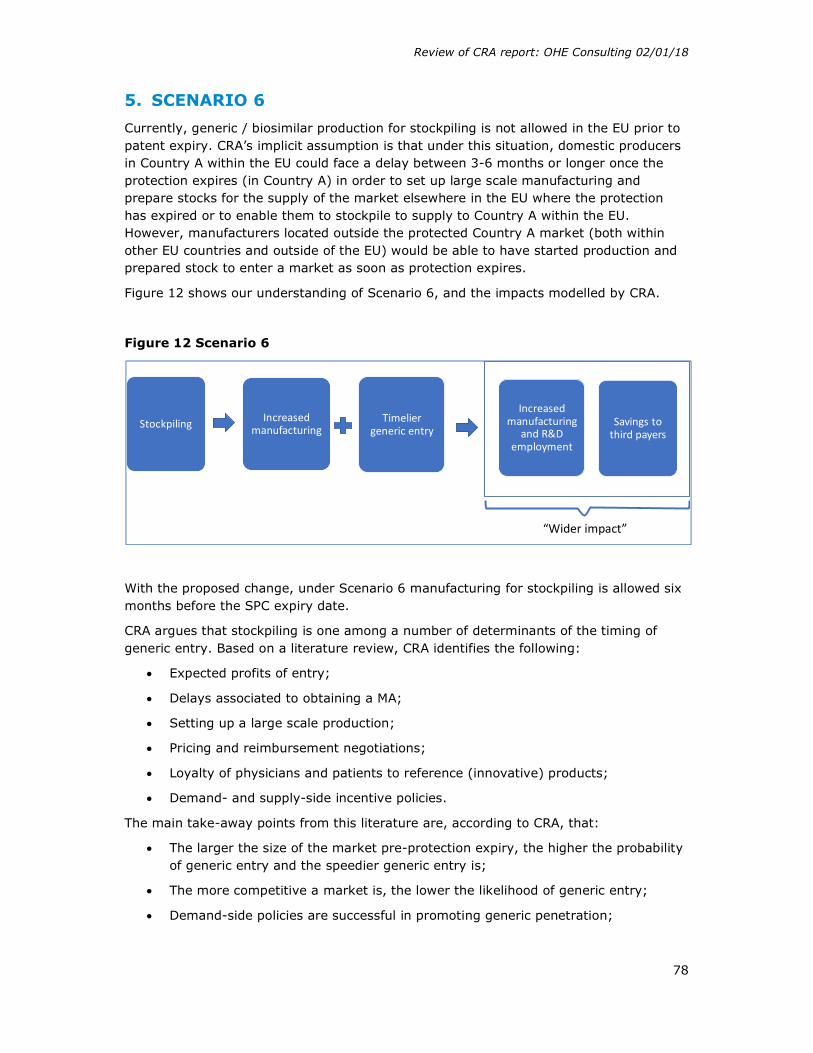
Review of CRA report: OHE Consulting 02/01/18
78
5. SCENARIO 6
Currently, generic / biosimilar production for stockpiling is not allowed in the EU prior to patent expiry. CRA’s implicit assumption is that under this situation, domestic producers in Country A within the EU could face a delay between 3-6 months or longer once the protection expires (in Country A) in order to set up large scale manufacturing and prepare stocks for the supply of the market elsewhere in the EU where the protection has expired or to enable them to stockpile to supply to Country A within the EU. However, manufacturers located outside the protected Country A market (both within other EU countries and outside of the EU) would be able to have started production and prepared stock to enter a market as soon as protection expires.
Figure 12 shows our understanding of Scenario 6, and the impacts modelled by CRA.
Figure 12 Scenario 6
With the proposed change, under Scenario 6 manufacturing for stockpiling is allowed six months before the SPC expiry date.
CRA argues that stockpiling is one among a number of determinants of the timing of generic entry. Based on a literature review, CRA identifies the following:
Expected profits of entry;
Delays associated to obtaining a MA;
Setting up a large scale production;
Pricing and reimbursement negotiations;
Loyalty of physicians and patients to reference (innovative) products;
Demand- and supply-side incentive policies.
The main take-away points from this literature are, according to CRA, that:
The larger the size of the market pre-protection expiry, the higher the probability of generic entry and the speedier generic entry is;
The more competitive a market is, the lower the likelihood of generic entry;
Demand-side policies are successful in promoting generic penetration;
Stockpiling Increased manufacturing
Timelier generic entry
Increased manufacturing
and R&D employment
Savings to third payers
“Wider impact”

Review of CRA report: OHE Consulting 02/01/18
79
Supply-side policies may actually hamper generic entry and penetration (leading to lower price reduction)
We should note that the three authors of this OHE Consulting report have published on this topic, and we agree with the key take away points highlighted by CRA. Additional drivers could include firm size and previous experience with manufacturing generics/biosimilars.
Bearing this complex picture of the drivers of generic entry per se and of the speed of generic entry, the impact of allowing stockpiling may be low.
This scenario looks at three effects:
1. On generic and biosimilar manufacturing in Europe 2. On generic and biosimilar entry in Europe 3. Wider impact of a stockpiling exemption
We take each effect in turn.
5.1. Potential effect on European generic manufacturing
CRA’s testing hypothesis for this scenario is that a stockpiling exemption is likely to benefit the European generic and biosimilar pharmaceutical industry by allowing domestic producers to enter quickly in markets where the SPC term of the reference product has expired, putting them on an equal footing to compete in these markets with generic and biosimilar producers located in markets without SPC protection.
As stockpiling is not allowed in any EU member state protected by SPCs, there is no counterfactual for which evidence is available, so CRA use indirect evidence. The first analysis CRA carries out is to examine the location of generics manufacturers. The authors hypothesize that a significantly larger share of first generic entrants into EU markets where protection has expired will be provided by manufacturers located into non-SPC protected EU countries.
CRA examined data obtained from the EMA and national medicine agencies on the manufacturing location of finished products for a sample of first generic entrants following protection expiry during the period 2008Q1 to 2014Q3 (noting that there was no data for biosimilars). This is shown in Table 44 of CRA’s report.
The key result is that European countries that have the highest frequency of first entrants for the sample of molecules considered, are unlikely to have had SPC protection due to (i) their later accession into the EU in 2004 (e,g, Slovenia, Poland, Malta, Hungary, Czech Republic, Slovakia) and (ii) their differing transitional arrangements. Countries like Spain, Portugal and Greece were able to file an SPC only since 1998 and given that the sample of the study covers molecules with patent expiry dates within 2008-2014 (patented between 1988-1994) “it is very likely that a large number of these molecules would not be SPC protected in the countries that joined the EU later, such as Eastern European countries or Spain, Greece and Portugal”.
There is, however, a very important exception: Germany is by far the country of manufacture for more finished products (nearly a quarter), and CRA expect SPCs would apply in Germany. It is worth quoting CRA on this.

Review of CRA report: OHE Consulting 02/01/18
80
“The high frequency of observations for Germany is not clear, as it is a country where the SPC would have applied on most of the molecules examined. The high frequency could be explained by the presence of manufacturing facilities in that country by a number of large generic players that are active in entering first upon protection expiry.” (page 168).
It would seem to us that:
(i) the high frequency of German observations is clear. It confirms the results of CRA’s literature review that IP expiry is likely to be only one of many factors driving plant location and contradicts CRA’s hypothesis that date of IP expiry drives the location of first generic entry post protection expiry.
(ii) the explanation offered by CRA in the second sentence quoted above for this uncomfortable finding is circular. Clearly the large generic manufacturers in Germany are active in “entering first upon protection expiry”. This is CRA’s finding, not an explanation of it. The explanation could be that CRA’s hypothesis may not be correct.
CRA then looks at the average difference in protection expiry between the country of manufacture and the country of sale, based on IMS data. Table 45 “presents for each country of manufacture, the number of observations for which the protection expiry in that country was earlier than the date of protection in the country of sale. CRA finds that in many cases protection expiry in the country of manufacture is a year or so earlier than the protection expiry in the country of sale. CRA ignores results were the protection expiry date in the manufacturing country is later than in the country of sale, without informing about the size, frequency and magnitude of such observations.
Based on the analysis from Tables 44 and 45, CRA argues “that manufacturers located in countries where the protection has expired earlier or did not exist in the first place have an advantage in entering first upon protection expiry compared to e.g. domestic producers” (page 171). And that “These results are generally consistent with the view that a stockpiling exemption may reduce delays in entry following protection expiry, particularly for domestic generic producers in protected markets” (page 172). As we have noted, CRA’s findings that the largest supplier of first entrant products is Germany which has late protection expiry, contradict CRA’s “view”.
We have some further comments about the CRA analysis.
5.1.1. Key Issue 1: Lack of counterfactual
A first general concern about CRA’s analyses and conclusions on the stockpiling exemption comes from the absence of a counterfactual. There are no EU countries covered by SPCs where the stockpiling is allowed. Only by comparing such non-existent countries with countries with SPCs not allowed to stockpile can the exact impact of a stockpiling exemption be estimated in a controlled way. The main link between CRA’s analyses and all conclusions/impacts discussed in the Scenario 6 rest on the following statement “These results are generally consistent with the view that a stockpiling exemption may reduce delays in entry following protection expiry, particularly for domestic generic producers in protected markets” (page 172). However, results of the analyses presented in Tables 44 and 45 are strongly caveated indirect evidence, that can only suggest at best (not prove) that generic producers could benefit from a 6-month stockpiling exemption if other factors listed above delaying generic entry (e.g. price and reimbursement negotiations, setting up a large scale production, etc.) do not have a
Review of CRA report: OHE Consulting 02/01/18
81
significant impact. For example, for a country where price and reimbursement negotiations last more than six months, a stockpiling exemption would not produce any benefit to generic producers sited in protected markets.
5.1.2. Key Issue 2: Drivers of location of manufacturing facilities for first generic entrants
Additionally to this main general comment on the lack of counterfactual, we have considered the analyses and data presented in Tables 44 and 45 subject to several weaknesses and issues. That means that the evidence presented has also quality issues in addition to the main issue concerning the general approach that has been discussed here.
Our first set of comments refer to Table 44. As mentioned above, Germany leads manufacturing of first generic entries across the EEA, by a fair amount versus all other countries (23%), while the next five countries shares are between 18% and 11%. As we have noted, CRA only comments by passing this fact, stating that “the high frequency of observations for Germany is not clear, as it is a country where the SPC would have applied”. This result shows that there are other (more) important factors than no SPC protection driving manufacturing location. Further explanation to the argument of CRA on Germany’s performance would consist in structure of German’s generic manufacturing industry. Three out of top 20 global generic sellers (including the second, Sandoz-Novartis) are German based18. Given their global manufacturing and selling scope, they must have manufacturing sites (or CMOs) located in strategic markets all over the world. A six-month stockpiling permission would have, if any, a minimal impact. Furthermore, German generic producers in the global top 20 represented 17% of the global generic market.19 Global top 20 sellers overall including German companies represented 83.4%. This pushes down the potential effect of any stockpiling permission on speed of entry even more.
Table 44 also shows that Slovenia, Poland, Malta, Hungary, Spain, Greece and Portugal represent large shares of first generic entrants. CRA assumes that these countries have less protection given their later entry in the EU. Based on such an assumption, CRA concludes that frequency of first generic entrants manufactured in “non-protected markets” is higher, supporting the hypothesis that a stockpiling exemption will produce a benefit to the rest – generic manufacturers located in SPC protected countries. There are several points which potentially invalidate this conclusion:
As argued by Kyle (2017), the use of SPCs has increased. Molecules covered are increasing (86%) and covered more countries (18). In the medium-term SPC protection will be the norm rather than the exception in all EU countries (including Slovenia, Poland, Malta, Hungary, Spain, Greece and Portugal), especially for important drugs. Thus, if companies had expected that having an SPC protection in the near future would have been a barrier to timely generic entry, exiting these countries after EU entry would have been the rational response. Such a reaction
18 Information available at FiercePharma webpage https://www.fiercepharma.com/special-report/top-20-generics-companies-by-2014-revenue. Data of market shares are based on global sales generic values provided by EvaluatePharma (2017). 19 Information available at FiercePharma webpage: https://www.fiercepharma.com/special-report/top-20-generics-companies-by-2014-revenue.

Review of CRA report: OHE Consulting 02/01/18
82
does not seem to be the case (it is not even mentioned by CRA) and therefore this might highlight that SPC protection is not a (key) factor driving manufacturing location decisions as others like size and expected profitability of the market of location or production costs;
Given that 2004 was the year of adherence to the EU of countries like Malta, Slovenia, Poland and Hungary, or the inability to grant SPCs until 1998 of Spain, Greece and Portugal, CRA consider they would be relatively “unprotected” only for the molecules in their sample of study (molecules whose protection expired during the period 2008Q1 to 2014Q3). CRA argument is that molecules in their sample were patented during the period 1988 to 1994 and likely authorised before the adhesion year 2004 or earlier. As long as the time for applying for an SPC is the first 6 months after MA (Delcourt, 2009) then CRA assumes that “a large number of these molecules would not be SPC protected in countries joined Europe later, such Eastern European countries or Spain, Greece and Portugal” (page 168). This is not necessarily true firstly because the time of development of a medicine has increased in the last decades to 12-14 years (Shumacher et al., 2016, Mestre-Ferrandiz et al., 2012) and therefore such “unprotected” molecules would likely authorised when cited countries were able to grant SPCs. Secondly, and additionally to the first point, for countries like Malta, Hungary, Poland and Slovenia whose adhesion date to the EU was 1 May 2004, there is a transitory disposition to apply for an SPC for products authorised since 2000 (Delcourt, 2009), which increases their likelihood of belonging to the CRA sample. Such transitory disposition, joint with longer development times, are then strong challenges to the CRA argument and given how important is this argument for results and conclusions true evidence demonstrating its veracity is missed in the report. CRA should have provided reliable data demonstrating how many molecules coming manufactured in these countries are not SPC protected because their late adhesion to the EU.
Second, as and stated in the Note for Table 44, there is double counting. Summing up all observations in the second column, the total is 1,425 – which is 70% higher than the 832 observations reported (one observation is at the level of country of sale/international corporation/molecule). CRA should have provided more detail about Table 44, such as the average number of locations per observation, whether this distribution is skewed, and so forth. Footnote 315 states CRA give more weight for a manufacturing location of finished products sold in more Member States – but they do not provide information on average number of member states a molecule is sold in, and on how this weighting is used in the analysis. Double counting indicates that the manufacturing process of a given molecule is likely to be a multistage process across the borders. Greater description of the data could allow the reader to assess to the implications of multistage cross-border manufacturing processes.
Third, it would have been useful to ascertain the actual market shares of these first generic entrants, as well as the shares of the second or third entrant, which might also be important, especially if they can enter quickly. In Scenario 4, CRA undertakes an analysis showing first mover advantages (Table 18) in EU5, Russia and Turkey but that analyses are not linked back to Table 44.
Finally, it is not clear what is the sample used for Table 44. We are told it is a “sample of first generic entrants”, but the criteria to select the “sample” is not mentioned i.e. does CRA uses all first generic entrants, or a sample? This is crucial and relates to other
Review of CRA report: OHE Consulting 02/01/18
83
weaknesses of the analysis reported above – whether the generic molecules manufactured in Member States that join the EU late are not protected for instance. A list of the molecules used for the analysis of the Table 44 is missing (perhaps for inclusion in an appendix). This would give to the interested reader the possibility to test some of the assumptions of the analysis.
CRA does not assess the entirety of the analyses summarised in Table 45, or analyse in detail the implications of the results. For instance, CRA only considers molecules manufactured in countries where the protection expiry date is earlier than in countries of sale. They “ignore” what they call “idiosyncratic” cases (Footnote 319) and those countries where there is no time difference. We feel more information should have been provided, especially for those countries with a large number of observations, on variability around the “average” difference, and how the number of observations for key countries relate between tables. Having a measure of how much delay they face to reach the market of sale after SPC expiration would be for instance a key information to assess the potential impact of the stockpiling exemption but CRA omits to show.
Also in Table 45, CRA states that results are not comparable with Table 44, given the definition of “observation” – the difference being whether the ‘product’ is included or not (Footnote 318, p. 170). We do not agree with this and consider that it would have been useful for CRA to assess both tables jointly; for example, for the first generic entrants (in Table 44), what the difference was in time between first market entry and protection expiry in country of manufacture (such as column 3 in Table 45). Additionally, in Table 45 the manufacturing country is shown but there is no information about the country of sale of the studied molecules. This would help to understand why Germany (SPC protected) is the country with the largest number of molecules whose protection expiration is earlier than in the countries of sale. This raises a twofold question to understand the impact of the SPC and stockpiling exemptions: do originators apply to SPCs for all molecules? To which third countries generic manufacturers located in the EU are exporting?
As a final comment, CRA recognise that they cannot precisely estimate the delays due to the inability to stockpile of generic producers because “For example, the beneficial effect of a 6 month stockpiling exemption are unlikely to materialise in countries or products where there are substantial regulatory delays in launching a product, e.g. prolonged pricing and reimbursement negotiations” (p. 172). Then the authors assert that “To the extent that delays have declined from the figures reported in that study, which is likely given the time that has passed since then, it is possible that stockpiling would have a positive effect in more European countries. (p. 173)”. This assertion is not evidence based. Given the importance of the CRA report as part of an impact assessment of a potential regulatory change, we would have expected CRA to explore further if delays have indeed been declining. These (pricing and reimbursement) delays are a key factor determining when generics can enter in any one market. But there are other important factors too like delays in submission and MA review, barriers to therapeutic substitution, or to setting up large scale of production. CRA don’t even mention some of these in the discussion of the validity of results although they are mentioned at the start of the Scenario 6 analysis.
CRA comment on the importance of demand side measures to attract manufacturing of generics to serve the domestic market – indeed, it highlights that a wide range of factors affect delays in entry. As with the other scenarios, CRA does not attempt to disentangle the effects from other factors that may reduce delays.

Review of CRA report: OHE Consulting 02/01/18
84
CRA has not proven that differences in patent/SPC protection are a major driver of where to locate manufacturing facilities. Other factors will play a more prominent role. The analysis does not prove that the stockpiling exemption would produce earlier timely access. Were earlier additional generic entry to occur, the evidence in the literature of the impact of additional generic entry on price is that it is non-linear. There is no indication that CRA model such a relationship. All conclusions presented rest on strongly caveated assumptions, or weak ‘indirect’ evidence.
5.2. Assessment of potential effects on generic and biosimilar entry in Europe
CRA’s testing hypothesis here is that a stockpiling exemption is likely to result in timelier generic entry following protection expiry, particularly for smaller sized European generic producers that may have limited ability to manufacture in other locations.
There are no EU countries where stockpiling during the patent extension term is currently allowed, so there is no counterfactual/benchmark. So CRA does a comparison of the penetration speed across EU Member States and make inferences. It does so by looking at the following data, for generics:
(i) share of molecules experiencing entry,
(ii) share of sales experiencing entry,
iii) average speed of entry by size of market (based on pre-protection expiry sales), and
(iv) average speed of entry since protection expiry by size of generic player (whether we observe larger generic companies entering markets faster following protection expiry compared to smaller generic companies).
The CRA report finds that most Member States experience generic entry during the first quarter since protection expiry in more than half of the molecules that lost exclusivity during this period. Second, almost all Member States experience entry in more than 70% of the molecules by the first year. Third, that there could be scope for a reduction in the delay in generic entry, particularly in smaller markets by sales. And fourth, and controlled by market size (pre-protection sales), molecules with higher sales experience earlier generic entry.
In terms of median entry in number of months since protection expiry in each market (Table 48), CRA finds that entry is very speedy in larger markets (first two months or earlier), but that entry is less speedy in the bottom quartile of market size (3 to 17 months from ROM to AUT).
In terms of company size, larger companies enter a market more quickly upon protection expiry compared to smaller companies, because it is argued that larger companies have a network of manufacturing sites. However, they also find that in some countries, smaller companies enter faster than large ones, because of presence of national manufacturers that are quicker in entering their domestic market.
CRA’s main conclusions are (i) stockpiling exemption may reduce observed delays in generic entry, particularly in smaller markets as measured by pre-protection sales; (ii) there may be more timely entry for smaller generic producers, levelling the playing field within the generic sector.

Review of CRA report: OHE Consulting 02/01/18
85
5.2.1. Key Issue 3: Timing of generic entry after protection expiry
We have a number of comments. First, causality has not been demonstrated between delays and the impossibility of stockpiling. Indeed, it seems from the CRA analysis that potential size of the market might be more directly related to delays, where bigger countries face lower delays.
Second, it is important to understand better how smaller companies could be affected by stockpiling – is this indeed stopping them manufacture, or is their low capacity to serve larger sized markets the cause of their delay to entry and compete? Small companies may be focused to supply domestic markets as their competitive position becomes less strong when trying to compete globally in third countries located elsewhere. That should be assessed empirically before making inferences of the stockpiling exemption impact on small European generic companies. Furthermore, a detailed analysis of the economic structure of the European generic industry is required. As we have mentioned before a large share of the generic global market share served by the European generic manufacturers is supplied by big companies. Data of top 20 global generic companies by sales in 2014 show that 30.9% of the global sales is supplied by only six European generic manufacturers20 (52.5% is sold by other non-European big global generic producers). It is plausible to assume then that small companies are locally focused and the impact of the stockpiling exemption on them would not produce a significant difference to their sales elsewhere.
Third, as stated in Footnote 322, CRA did not count as ‘entry events’ generic entry by the company that also owned the protected product (innovative branded generics). As shown above, the importance of combined innovator/generic company (like Novartis/Sandoz) is very significant, and thus we feel that not including this “entry” is potentially misleading. We are not told how many such events have been excluded. We are unsure of the rationale for this decision, and we would have liked to see the impact of including these generics in the analysis.
Fourth, and in terms of the average speed of entry by generics by size of market/generic player (Table 48/49), CRA report the median rather than the average “as averages were affected by a number of outliers” – these are the only two tables in the report that use median rather than means. While we do not intend to discuss whether averages or medians should be used to summarise evidence, we feel that in all other analyses there will be outliers too, but these are not discussed. If CRA refers to outliers, at least averages should be reported to see how results change versus the median.
5.3. Assessment of wider impact of a stockpiling exemption
CRA looks also in this scenario for wider impacts – similarly to Scenario 4. The first one refers to incentives to innovate, whereby CRA argue this change would have no effect on incentives to innovation as it does not change the patent and SPC protection terms. It is also argued that levelling the playing field between European generic producers and third countries generic producers should not impact on the value sales of protected medicines.
20 Information available at: https://www.fiercepharma.com/special-report/top-20-generics-companies-by-2014-revenue
Review of CRA report: OHE Consulting 02/01/18
86
We believe this might not be the case, and innovators could lose important sales as a result of increased competition.
With regards to the impact on investment on generic and biosimilar manufacturing in Europe, and as it has been pointed out previously in the report, the success of the generic manufacturers to compete in markets losing protection depend on several factors. Investment decisions will depend on the same several factors too and effect of stockpiling exemption seems to have the potential to have only a marginal impact. Large companies currently have manufacturing sites located in target markets, so do not suffer from the stockpiling restriction. Small companies are more domestic based suppliers and, even though they might potentially benefit from the stockpiling exemption within their country, their investment decisions are unlikely to be affected by its existence.
CRA also explore the effect a stockpiling exemption might have in reducing pharmaceutical expenditures by reducing delays in entry – which will depend on the impact these new entrants have on the market dynamics. On the one hand, more entry might generate a “price war”, with a downward spiral in prices. This means that in absolute terms, the size of the potential market shrinks, for all players, including European generics and innovators. On the other hand, if prices are not affected, or only slightly, then additional savings will not accrue to the payer.
The literature suggests that as more competitors enter the market, there is more price competition, but that this relation is not linear. That means, on the one hand, additional value for the first entrant due to the higher price it is allowed to charge as the only generic competitor, and lower prices for later entrants. The literature agrees on the marginally decreasing relationship between the number of competitors and the price. Lu and Comanor (1998) showed that increasing the number of therapeutic substitutes in a market from one to two leads on average to a 38% decline in the price, while the third reduces the price by an additional 19% - i.e. half the impact on price of the first entrant. The same marginal decreasing price effect of an additional competitor entrant into a pharmaceutical market was found by Reiffen and Ward, who showed – with the sample they used – that for the first generic entrant, the ratio between the generic and the innovative pre-expiry price was 88%, which decreased further to 67% with subsequent entry to 11 competitors, but remained stable (no further price falls) with subsequent entrants. Wiggins and Maness (2004) show a similar price-number of entrants trend for anti-infectives. Grabowski (2007) examined generic competition using a sample of 40 products and showed that: (i) the price of a medicine declines as a function of the number of competitors, and; (ii) the magnitude of price decrease declines with the number of entrants. Finally, Kanavos (2014) illustrates the marginal decreasing decline of prices due to generic competition. For some countries studied, Italy, Portugal, Greece and the Netherlands for instance, the number of generic competitors doubled in the second year after patent expiration, but the price decline did not. In general the price effect is relatively small in the second year post-patent expiry.
Finally, there are differences in how CRA estimates savings (for EU payers) in Scenario 4 and Scenario 6, as mentioned above. We feel that both analyses should have been reconciled, explaining the differences in the modelling exercises used.
Review of CRA report: OHE Consulting 02/01/18
87
5.3.1. Key Issue 4: all stockpiling exemption is translated to earlier access to generics
CRA assumes that “the molecules experiencing protection expiry during our sample period (2008Q1 to 2014Q3) and which experienced generic entry with a delay, generic entry would have occurred 6 months faster” (p. 181). Even though they discuss the role played in delays of a large set of alternative factors, they use the whole 6 month period of the stockpiling for the calculation of savings.
5.3.2. Key Issue 5: estimation of savings for the health system does not take into account generic competition
CRA estimate that the value of 6 months of earlier entry for generics is €1.1billion over a three-year period but this is under the assumption that new generics allowed timely entry into the market do not compete with established generics manufactured in unprotected markets. CRA do not explicitly mention that it is adjusting the estimate by the market share war between EU generic manufacturers and manufacturers from the rest of the world.
Second, the estimated savings, assuming that they are realised completely by the system because the EU generics arrived earlier and steal market share of innovative (European at some proportion), must be the mirror image of the innovative manufacturers’ loses (at least in part). However, the report states that innovative industry would not be damaged by the stockpiling exemption. This is a logical inconsistency that should be addressed and/or explained.

Review of CRA report: OHE Consulting 02/01/18
88
6. SCENARIOS 1-3 AND SCENARIO 5
Scenarios 1-3 on the Bolar Exemption
Scenarios 1.-3. focus on the impact on clinical trials and similarity trials using active comparators and on the production of APIs for bioequivalence studies - specifically: extending scope of Bolar exemption from “narrow” to “wide” to cover all medicines (Scenario 1); marketing authorisations in any country (Scenario 2); and allowing supply of APIs within the EU (Scenario 3).
We find the counterfactuals used by CRA implausible. Currently, only three out of 28 EU member states have a narrow definition of the Bolar exemption. It is not clear that these three countries (Sweden, Netherlands and Belgium) host competitive producers of generics or biosimilars which might be at a disadvantage. Moreover, the evidence shown in the report suggests that “narrow” exemption countries21, on a population adjusted basis, currently have more trials than the “wide” exemption countries. We also think it unlikely that Europe will adopt a “narrow” interpretation of Bolar with the introduction of a Unified Patent Court.
Scenario 5
The SPC export exemption Scenarios 4-6 involve allowing manufacturing of SPC protected medicines in protected (domestic) markets for purposes of selling in markets where SPCs have expired (outside EU (scenario 4) or within (scenario 5)) or of stockpiling (for that country (scenario 6)) in advance of patent or SPC expiration. Scenario 5 presupposes significant heterogeneity across the EU in terms of SPC expiry. However, it is likely that currently differences arise primarily from the legacy of CEE states accession (as they had limited IP). We would thus expect that these differences are likely to be minimal currently, and that they will diminish over time. In the limit, Scenario 5 will no longer be relevant. The benefits estimated by CRA are almost certainly overestimated given the likely convergence of SPC expiry dates across Europe.
Given that substantive differences between SPC expiry dates within Europe are disappearing, it is hard to see how the approach of the UPC will have material economic implications of the sort CRA seek to estimate.
21 Note: UK/Ireland only changed their scope to “wide” definition of Bolar exemption in 2016, so these two countries would have been categorised as “narrow” for the historic analysis of clinical trials shown in Figures 4 – 7.

Review of CRA report: OHE Consulting 02/01/18
89
7. FINAL REMARKS
The CRA Report substantially overstates the Scenario 4 numbers – by a factor of ten. This is before making additional adjustments we think are appropriate but which CRA do not provide enough data for us to undertake. The Scenario 6 benefits are also overstated. The implications of the EU adopting a different IP approach in international negotiations is not considered. It is not inconceivable that the impact of this on innovative product sales, and therefore on R&D, could have adverse employment consequences that exceed employment gains in the generic sector.
The CRA report makes estimates of effect using a number of assumptions, data and calculations that we do not find to be correct or which are not explained. Until these anomalies are addressed, our view is that the CRA analysis is not a fit basis for an impact assessment to guide policy.
The CRA Report has an underlying assumption that the EU is as globally competitive in generics and biosimilars as it is in innovative products. There is no evidence to support this. The correct industrial strategy for the EU may well be to focus on the development, manufacture and export of innovative products, rather than on lower value generics where EU global competitiveness appears to be weaker.
Review of CRA report: OHE Consulting 02/01/18
90
REFERENCES
Bauer, M., 2017. Unintended and Unattended Consequences: The Opportunity Costs of Reducing Exclusivity Rights. European Centre for International Political Economy, Policy Brief No. 4.
De Coninck, R. et al., 2016. Assessing the economic impacts of changing exemption provisions during patent and SPC protection in Europe, CRA Report for Directorate-General for Internal Market, Industry, Entrepreneurship and SME. Available at: https://publications.europa.eu/en/publication-detail/-/publication/6e4ce9f8-aa41-11e7-837e-01aa75ed71a1/language-en
Delcourt, D., 2009. Public health and the preservation of economic competitiveness: the European supplementary protection certificate for medicinal products. Journal of Intellectual Property Law & Practice, 4(6), 439-444.
EvaluatePharma, 2017. World Preview 2017, Outlook to 2022. Evaluate Ltd. Available at: http://www.evaluategroup.com/public/reports/EvaluatePharma-World-Preview-2015.aspx
Francis, R., 2016. Meet Novartis Management, Investor presentation. May 24-25. Global Head and CEO, Sandoz.
Hollis, Aidan (2002), “The Importance of being First: Evidence from Canadian Generic Pharmaceuticals,” Health Economics, 11 (8), 723 – 34.Humphrey, R., 2014. Life Sciences Cluster Report, Jones Lang LaSalle Resarch
Kyle, M., 2017. Economic Analysis of Supplementary Protection Certificates in Europe. Available at: file:///C:/Users/atowse/Downloads/Final-report-Kyle%20(2).pdf
Logendra, R. et al., 2017. Assessing the impact of proposals for a Supplementary Protection Certificate (SPC) Manufacturing Exemption in the EU, QuintilesIMS, 2017
Lu, Z. J., and Comanor, W. S., 1998. Strategic pricing of new pharmaceuticals. The Review of Economics and Statistics, 80(1), 108-118.
Medicines for Europe, undated. SPC Manufacturing Waiver. Note. Medicines for Europe.
Mejer, M., 2017. 25 years of SPC protection for medicinal products in Europe: Insights and challenges. Available at: file:///C:/Users/atowse/Downloads/SPC%20EU%200210%2017%20final%20Malwina%20Mejer%20(1).pdf
Mestre-Ferrandiz, J., Sussex, J., Towse, A., & Office of Health Economics (London, England). (2012). The R and D Cost of a New Medicine (p. 1). London: Office of Health Economics.
Mestre-Ferrandiz, J., Towse, A. and Berdud, M. 2016. Biosimilars: How Can Payers Get Long-Term Savings? Pharmacoeconomics, 34, pp. 609 - 616
Pugatch Consilium, 2017. Unintended Consequences, How introducing a manufacturing and export exemption to supplementary protection certificates would weaken global standards of IP protection and result in direct losses to Europe’s research-based biopharmaceutical industry, Pugatch Consilium. Available at: http://www.pugatch-consilium.com/reports/Unintended_Consequences_October_%202017.pdf
Review of CRA report: OHE Consulting 02/01/18
91
Schuhmacher, A., Gassmann, O., & Hinder, M. (2016). A review of the pharmaceutical R&D Efficiency: costs, timelines, and probabilities. Value Creation in the Pharmaceutical Industry: The Critical Path to Innovation, 60-79.
Shajarizadeh, Grootendorst & Hollis (2015) Newton’s First Law as Applied to Pharmacies: Why Entry Order Matters for Generics, International Journal of the Economics of Business, 22:2, 201-217.
Shimasaki, C., 2014. “Biotechnology Entrepreneurship. Starting, Managing, and Leading Biotech Companies”. Academic Press, Elsevier. The Boulevard, Langford Lane, Kidlington, Oxford, OX5 1GB, UK
Sussell, J. A. et al., 2017. “Reconsidering the economic impact of the EU manufacturing and export provisions”, Journal of Generic Medicines, Vol. 13, Issue 2, pp. 73–89.
Vicente, V. and Simoes, S., 2014. “Manufacturing and export provisions: Impact on the competitiveness of European pharmaceutical manufacturers and on the creation of jobs in Europe”, Journal of Generic Medicines, Vol. 11, Issue 1–2, pp.35–47.
Yu and Gupta, (2008), Pioneering Advantage in Generic Drug Competition. International Journal of Pharmaceutical and Healthcare Marketing 01/2014; 8(2).

Review of CRA report: OHE Consulting 02/01/18
92
APPENDIX 1 INFORMATION ON THE ASSUMED IMPACTS, FOR EACH SCENARIO
For Scenario 1, we understand the issue to be that under a narrow definition of the Bolar exemption, companies can use a patent protected product only for purposes of abridged authorisation procedure. Thus, a company wishing to do a comparative trial cannot use the (protected) comparator in clinical trial in the country with narrow definition (until protection has expired in that country). Figure A1.1 shows our understanding of the elements generating economic benefit for this scenario.
Figure A1.1: Extending the scope of Bolar exemption to cover all medicines
Source: authors’ analysis, from CRA (2016)
As shown in Figure A1.1, CRA assumes that by changing to “wide” definition, there would be an increase in comparator clinical trials in those countries, and that these would be cheaper to run. Additional, wider impacts as a result of more trials in Europe are also explored, such as faster uptake of medicines.
For Scenario 2, we understand the issue to be that in countries with a narrow Bolar scope, it is not clear whether the use of patent protected compounds to obtain marketing authorisations in a country outside the EEA is covered by the exemption. Figure A1.2 illustrates the elements of economic impact modelled in this scenario by CRA.
Country A (in Europe): Narrow Bolar
Innovative firms: no comparative trial
Generics: legal uncertainty
Wide Bolar
Companies in other countries (EU + non-EU) can
run trials
Change to wide Bolar
Country A:
- Increase in (comparator) clinical trials in Europe
- Cost savings of running (comparator) clinical trials in Europe
- Wider impact – incentives to innovate, attracting clinical trials, reducing delays and
more timely access, faster uptake
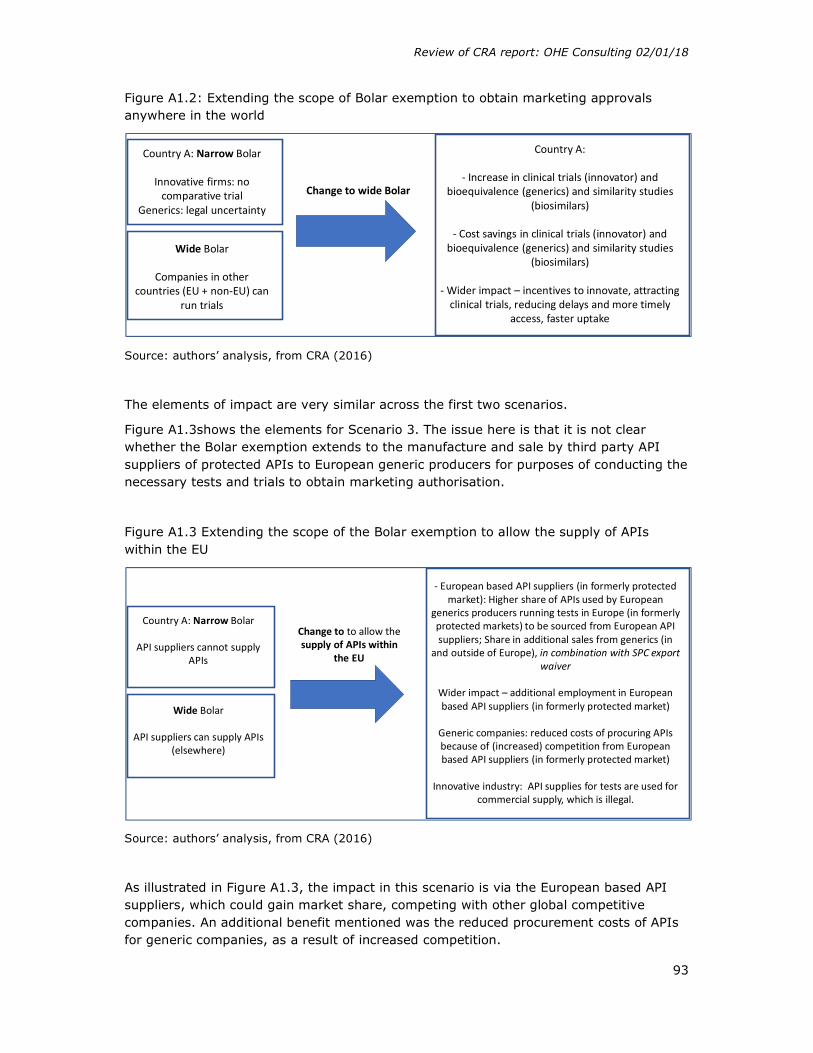
Review of CRA report: OHE Consulting 02/01/18
93
Figure A1.2: Extending the scope of Bolar exemption to obtain marketing approvals anywhere in the world
Source: authors’ analysis, from CRA (2016)
The elements of impact are very similar across the first two scenarios.
Figure A1.3shows the elements for Scenario 3. The issue here is that it is not clear whether the Bolar exemption extends to the manufacture and sale by third party API suppliers of protected APIs to European generic producers for purposes of conducting the necessary tests and trials to obtain marketing authorisation.
Figure A1.3 Extending the scope of the Bolar exemption to allow the supply of APIs within the EU
Source: authors’ analysis, from CRA (2016)
As illustrated in Figure A1.3, the impact in this scenario is via the European based API suppliers, which could gain market share, competing with other global competitive companies. An additional benefit mentioned was the reduced procurement costs of APIs for generic companies, as a result of increased competition.
Country A: Narrow Bolar
Innovative firms: no comparative trial
Generics: legal uncertainty
Wide Bolar
Companies in other countries (EU + non-EU) can
run trials
Change to wide Bolar
Country A:
- Increase in clinical trials (innovator) and bioequivalence (generics) and similarity studies
(biosimilars)
- Cost savings in clinical trials (innovator) and bioequivalence (generics) and similarity studies
(biosimilars)
- Wider impact – incentives to innovate, attracting clinical trials, reducing delays and more timely
access, faster uptake
Country A: Narrow Bolar
API suppliers cannot supply APIs
Wide Bolar
API suppliers can supply APIs (elsewhere)
Change to to allow the supply of APIs within
the EU
- European based API suppliers (in formerly protected market): Higher share of APIs used by European
generics producers running tests in Europe (in formerly protected markets) to be sourced from European API suppliers; Share in additional sales from generics (in
and outside of Europe), in combination with SPC export waiver
Wider impact – additional employment in European based API suppliers (in formerly protected market)
Generic companies: reduced costs of procuring APIs because of (increased) competition from European based API suppliers (in formerly protected market)
Innovative industry: API supplies for tests are used for commercial supply, which is illegal.

Review of CRA report: OHE Consulting 02/01/18
94
The graphical representation of impacts for Scenarios 4 and 6 are illustrated with two figures each, to show the “status quo” and “the new situation.
Figure A1.4a shows the status quo under Scenario 4, and Figure A14b the impact with the change.
Figure A1.4a: Allowing manufacturing of SPC protected medicines in protected (domestic) markets for purposes of exporting to third countries where the corresponding patent or SPC has expired: Current situation
Figure A1.4b: Allowing manufacturing of SPC protected medicines in protected (domestic) markets for purposes of exporting to third countries where the corresponding patent or SPC has expired: new situation
Source: authors’ analysis, from CRA (2016)
Figure A1.4a illustrates the issue: generic/biosimilar companies in country A (in Europe) cannot manufacture a generic product in that country until protection expires in that
Third countries – not protected. Generics/biosimilars can be launched
Delays in entry (lower shares)
Shares of non-EU companies (incl. domestic).
They can manufacture before (than country A) and sale after
protection expiry in third country
EU
Country A:SPC protected
No manufacturing until protection
expiresNote: early entrants
gain 1st mover advantage
Shares of EU-based originator
companies –competing with
generics/biosimilars
Third countries – not protected. Generics/biosimilars can be launched
Delays in entry (lower shares)- Additional Sales after expiry in 3rd
country and before patent expiry in A - Additional sales due to 1st mover adv.
Shares of non-EU companies (incl. domestic).
They can manufacture before (than country A) and sale after
protection expiry in third country
EU
Country A:SPC protected
No manufacturing until protection expires
Manufacturing allowed
Note: early entrants gain 1st mover
advantage
Shares of EU-based originator companies –
competing with generics/biosimilarsReduced sales in 3rd
countries due to more competition
Wider impact:- Employment/R&D- Increased competition => savings to payers (in EU)
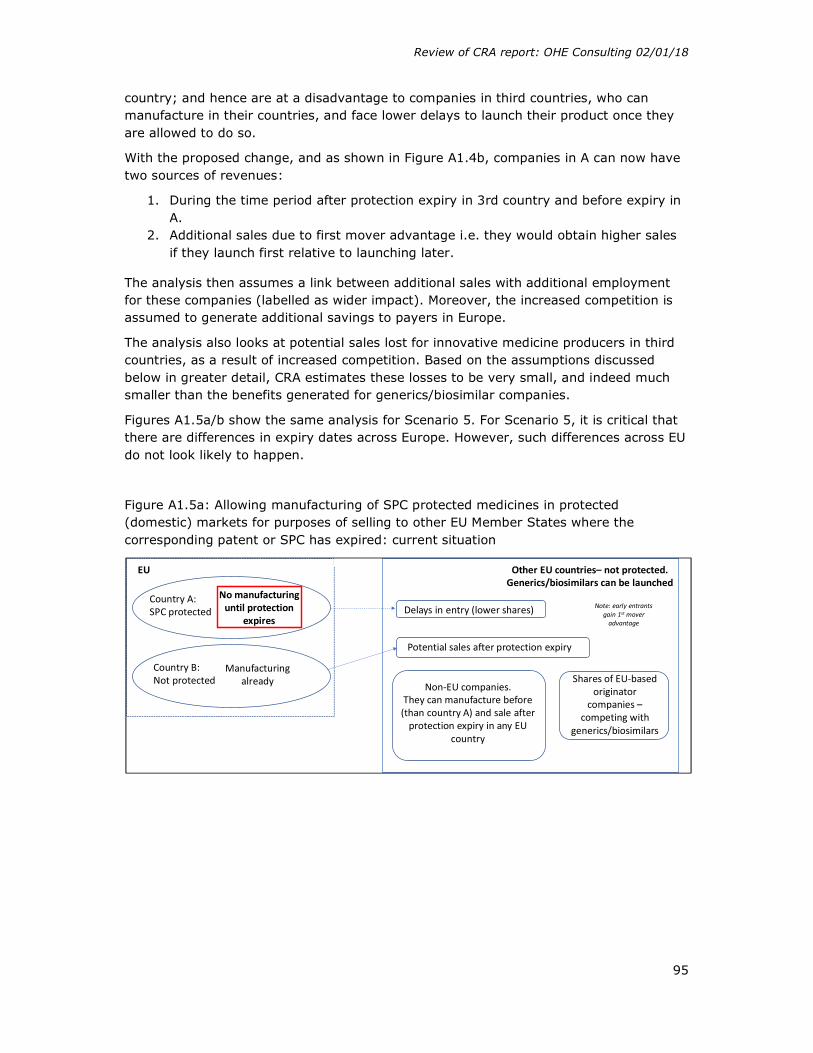
Review of CRA report: OHE Consulting 02/01/18
95
country; and hence are at a disadvantage to companies in third countries, who can manufacture in their countries, and face lower delays to launch their product once they are allowed to do so.
With the proposed change, and as shown in Figure A1.4b, companies in A can now have two sources of revenues:
1. During the time period after protection expiry in 3rd country and before expiry in A.
2. Additional sales due to first mover advantage i.e. they would obtain higher sales if they launch first relative to launching later.
The analysis then assumes a link between additional sales with additional employment for these companies (labelled as wider impact). Moreover, the increased competition is assumed to generate additional savings to payers in Europe.
The analysis also looks at potential sales lost for innovative medicine producers in third countries, as a result of increased competition. Based on the assumptions discussed below in greater detail, CRA estimates these losses to be very small, and indeed much smaller than the benefits generated for generics/biosimilar companies.
Figures A1.5a/b show the same analysis for Scenario 5. For Scenario 5, it is critical that there are differences in expiry dates across Europe. However, such differences across EU do not look likely to happen.
Figure A1.5a: Allowing manufacturing of SPC protected medicines in protected (domestic) markets for purposes of selling to other EU Member States where the corresponding patent or SPC has expired: current situation
Other EU countries– not protected. Generics/biosimilars can be launched
Potential sales after protection expiry
Delays in entry (lower shares)
Non-EU companies.They can manufacture before (than country A) and sale after
protection expiry in any EU country
EU
Country B: Not protected
Country A:SPC protected
No manufacturing until protection
expires
Manufacturing already
Note: early entrants gain 1st mover
advantage
Shares of EU-based originator
companies –competing with
generics/biosimilars
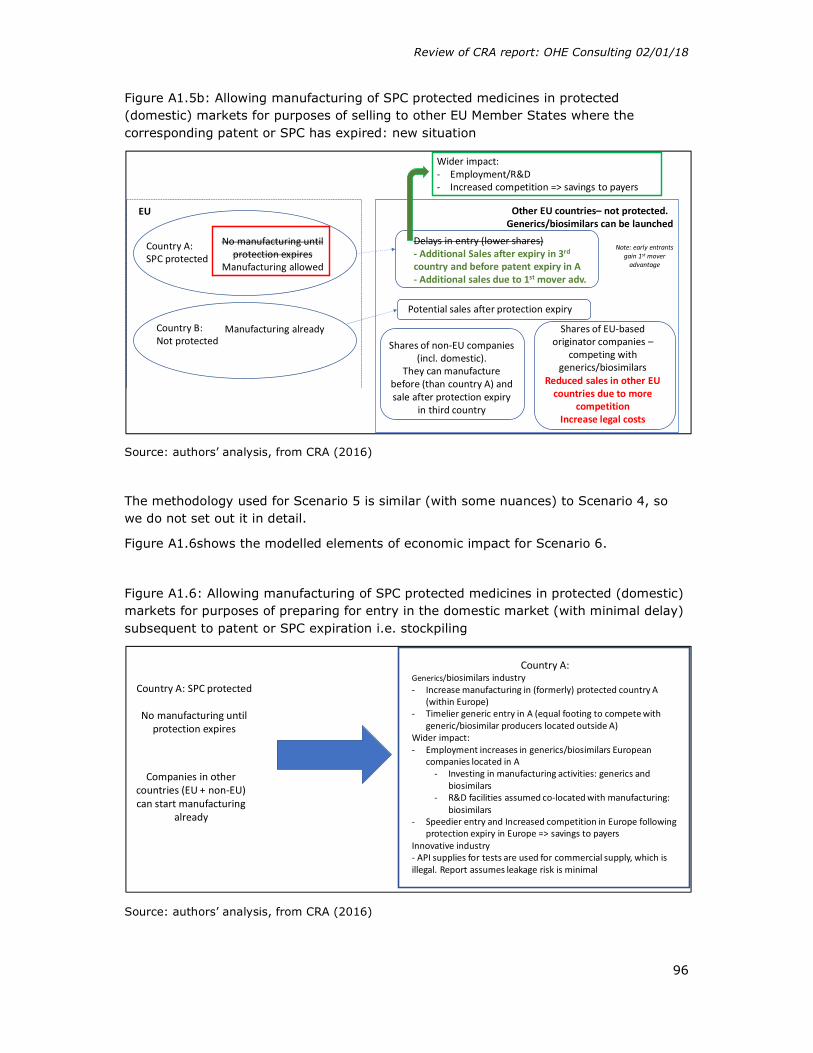
Review of CRA report: OHE Consulting 02/01/18
96
Figure A1.5b: Allowing manufacturing of SPC protected medicines in protected (domestic) markets for purposes of selling to other EU Member States where the corresponding patent or SPC has expired: new situation
Source: authors’ analysis, from CRA (2016)
The methodology used for Scenario 5 is similar (with some nuances) to Scenario 4, so we do not set out it in detail.
Figure A1.6shows the modelled elements of economic impact for Scenario 6.
Figure A1.6: Allowing manufacturing of SPC protected medicines in protected (domestic) markets for purposes of preparing for entry in the domestic market (with minimal delay) subsequent to patent or SPC expiration i.e. stockpiling
Source: authors’ analysis, from CRA (2016)
Other EU countries– not protected. Generics/biosimilars can be launched
Potential sales after protection expiry
Delays in entry (lower shares)- Additional Sales after expiry in 3rd
country and before patent expiry in A - Additional sales due to 1st mover adv.
Shares of non-EU companies (incl. domestic).
They can manufacture before (than country A) and sale after protection expiry
in third country
EU
Country B: Not protected
Country A:SPC protected
No manufacturing until protection expires
Manufacturing allowed
Manufacturing already
Note: early entrants gain 1st mover
advantage
Shares of EU-based originator companies –
competing with generics/biosimilars
Reduced sales in other EU countries due to more
competitionIncrease legal costs
Wider impact:- Employment/R&D- Increased competition => savings to payers
Country A: SPC protected
No manufacturing until protection expires
Companies in other countries (EU + non-EU) can start manufacturing
already
Country A: Generics/biosimilars industry- Increase manufacturing in (formerly) protected country A
(within Europe)- Timelier generic entry in A (equal footing to compete with
generic/biosimilar producers located outside A)Wider impact: - Employment increases in generics/biosimilars European
companies located in A- Investing in manufacturing activities: generics and
biosimilars- R&D facilities assumed co-located with manufacturing:
biosimilars- Speedier entry and Increased competition in Europe following
protection expiry in Europe => savings to payersInnovative industry- API supplies for tests are used for commercial supply, which is illegal. Report assumes leakage risk is minimal

Review of CRA report: OHE Consulting 02/01/18
97
The critical benefit assumed by CRA from this scenario is the increased manufacturing opportunities within Europe, for stockpiling. This would lead, according to CRA, to timelier generic entry, generating savings to third party payers (classified as “wider” impact).

Review of CRA report: OHE Consulting 02/01/18
98
APPENDIX 2 SUMMARY OF DATA USED BY CRA
Tables A2a and A2b summarise the data used by CRA for their analyses.
Table A2a: Summary of data
Source Variable Countries Time period
1 IMS Midas All pharmaceuticals. Sales value and volume (at the manufacturer level in values and volumes)
Num. of EEA + Switzerland, Russia and Turkey
2008Q1 –2014Q3
2 IMS Health Total pharmaceutical sales Australia, Brazil, Canada, China, Japan and the USA
2013-2014
3 EMA and national medicine agencies
Manufacturing location of the API and the finished product for a sample of generic entrants following protection expiry during the period
EEA 2008Q1 - 2014Q3
4 2015 Global API report
- production and sale of APIs by region and by therapeutic class
- cost index for API producing countries
-productivity of production by major API country
Global 2015
5 Comtrade Imports of EEA pharmaceuticals into:
Australia, Brazil, Canada, China, Japan, Russia, Turkey and the US.
6 EMA Clinical trials EU May 2004 – 2015
7 Eurostat Production and number of employees in the EU pharmaceutical industry (NACE R2 – Manufacturing of basic pharmaceutical products and pharmaceutical preparations)
EU28 2013

Review of CRA report: OHE Consulting 02/01/18
99
Table A2b: Summary of data: additional information
Source Additional information
IMS Midas Package level, country, panel (1ry/2ry), generic/brand, biological/non-biological, date of patent expiration, data of protection expiry
IMS Health in local currency at the manufacturer level and in Standard Units), broken down into biologic/non-biologic molecules and within biologic into biosimilar/ biocomparable, innovative, generic and other, and within non-biologic, into generic/innovative/ other
EMA and national medicine agencies
1. From top 50% bestselling molecules based on 2013 EEA sales value, plus more in top 10% of each EEA country (46 to 35), identified first generic entrant
2. Survey EMA + national medicine agencies (API and manufacturing locations for 834 observations in total)
Comtrade Comtrade data in combination with the IMS Health data to estimate the share that European innovative, generic and biosimilar achieve in pharmaceutical sales in third countries
EMA The data provided included information on the date of the clinical trial registry, title of the trial, type of trial (controlled, and if so whether a medicinal product was used as a comparator, randomised, single blind, open etc), phase of the trial (phase I, phase II etc), name of the product used and INN, sponsor code, inclusion/exclusion criteria, countries where the trial was run.
Source: CRA (2016)

Review of CRA report: OHE Consulting 02/01/18
100
APPENDIX 3 EUROPEAN GENERICS MANUFACTURERS’ MARKET SHARES
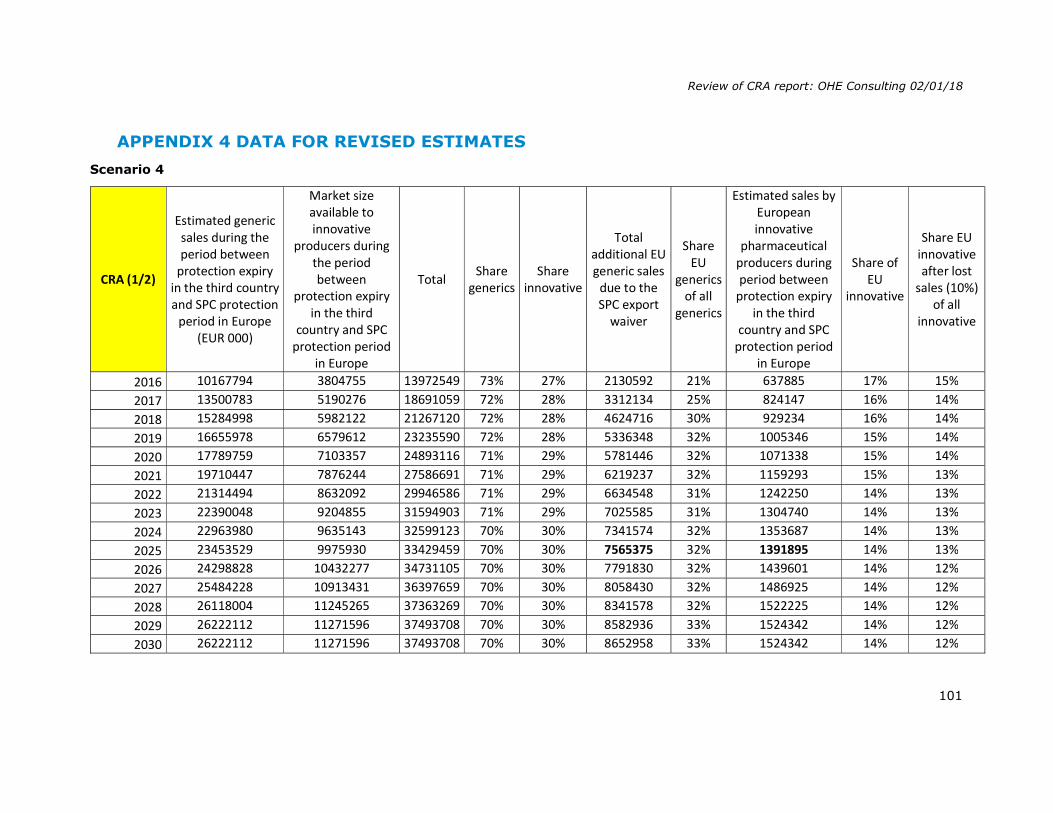
Review of CRA report: OHE Consulting 02/01/18
101
APPENDIX 4 DATA FOR REVISED ESTIMATES
Scenario 4
CRA (1/2)
Estimated generic sales during the period between
protection expiry in the third country and SPC protection
period in Europe (EUR 000)
Market size available to innovative
producers during the period between
protection expiry in the third
country and SPC protection period
in Europe
Total Share
generics Share
innovative
Total additional EU generic sales
due to the SPC export
waiver
Share EU
generics of all
generics
Estimated sales by European innovative
pharmaceutical producers during period between
protection expiry in the third
country and SPC protection period
in Europe
Share of EU
innovative
Share EU innovative after lost
sales (10%) of all
innovative
2016 10167794 3804755 13972549 73% 27% 2130592 21% 637885 17% 15% 2017 13500783 5190276 18691059 72% 28% 3312134 25% 824147 16% 14% 2018 15284998 5982122 21267120 72% 28% 4624716 30% 929234 16% 14% 2019 16655978 6579612 23235590 72% 28% 5336348 32% 1005346 15% 14% 2020 17789759 7103357 24893116 71% 29% 5781446 32% 1071338 15% 14% 2021 19710447 7876244 27586691 71% 29% 6219237 32% 1159293 15% 13% 2022 21314494 8632092 29946586 71% 29% 6634548 31% 1242250 14% 13% 2023 22390048 9204855 31594903 71% 29% 7025585 31% 1304740 14% 13% 2024 22963980 9635143 32599123 70% 30% 7341574 32% 1353687 14% 13% 2025 23453529 9975930 33429459 70% 30% 7565375 32% 1391895 14% 13% 2026 24298828 10432277 34731105 70% 30% 7791830 32% 1439601 14% 12% 2027 25484228 10913431 36397659 70% 30% 8058430 32% 1486925 14% 12% 2028 26118004 11245265 37363269 70% 30% 8341578 32% 1522225 14% 12% 2029 26222112 11271596 37493708 70% 30% 8582936 33% 1524342 14% 12% 2030 26222112 11271596 37493708 70% 30% 8652958 33% 1524342 14% 12%

Review of CRA report: OHE Consulting 02/01/18
102
CRA (2/2)
Share
European companies (B
and G)
Reduction in sales
assuming 10% decline
in sales of EU based
innovative medicines
Reduction in sales assuming 20%
decline in sales of EU based innovative
medicines
Difference additional generics
and brands with 10% decline
Difference additional
generics and brands with 20%
decline
Ratio (10%)
Ratio (20%)
Net effect (10%)
Net effect (20%)
2016 15% 63789 127577 2066804 2003015 33,40 16,70 2066804 2003015
2017 14% 82415 164829 3229719 3147305 40,19 20,09 3229719 3147305 2018 14% 92923 185847 4531793 4438869 49,77 24,88 4531793 4438869 2019 14% 100535 201069 5235813 5135279 53,08 26,54 5235813 5135279 2020 14% 107134 214268 5674312 5567178 53,96 26,98 5674312 5567178 2021 13% 115929 231859 6103308 5987378 53,65 26,82 6103308 5987378 2022 13% 124225 248450 6510323 6386098 53,41 26,70 6510323 6386098 2023 13% 130474 260948 6895111 6764637 53,85 26,92 6895111 6764637 2024 13% 135369 270737 7206205 7070837 54,23 27,12 7206205 7070837 2025 13% 139190 278379 7426186 7286996 54,35 27,18 7426186 7286996 2026 12% 143960 287920 7647870 7503910 54,12 27,06 7647870 7503910 2027 12% 148693 297385 7909738 7761045 54,20 27,10 7909738 7761045 2028 12% 152223 304445 8189356 8037133 54,80 27,40 8189356 8037133 2029 12% 152434 304868 8430502 8278068 56,31 28,15 8430502 8278068 2030 12% 152434 304868 8500524 8348090 56,77 28,38 8500524 8348090
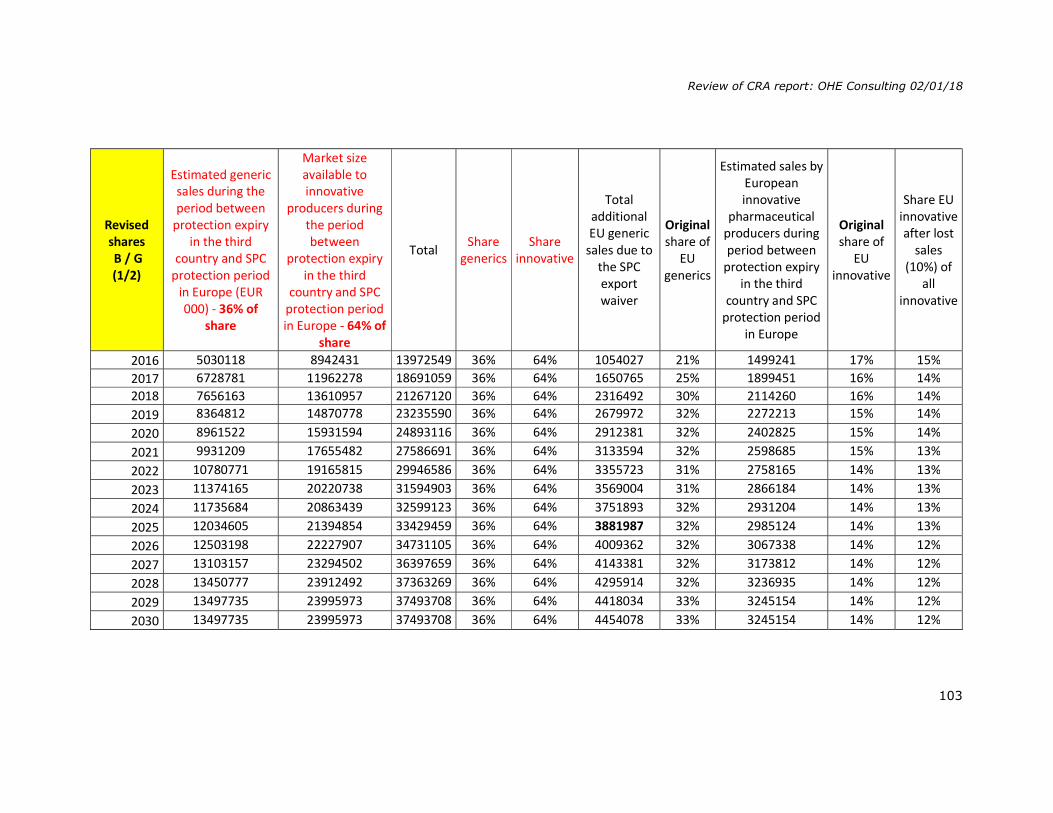
Review of CRA report: OHE Consulting 02/01/18
103
Revised shares B / G (1/2)
Estimated generic sales during the period between
protection expiry in the third
country and SPC protection period
in Europe (EUR 000) - 36% of
share
Market size available to innovative
producers during the period between
protection expiry in the third
country and SPC protection period in Europe - 64% of
share
Total Share
generics Share
innovative
Total additional EU generic
sales due to the SPC export waiver
Original share of
EU generics
Estimated sales by European innovative
pharmaceutical producers during period between
protection expiry in the third
country and SPC protection period
in Europe
Original share of
EU innovative
Share EU innovative after lost
sales (10%) of
all innovative
2016 5030118 8942431 13972549 36% 64% 1054027 21% 1499241 17% 15% 2017 6728781 11962278 18691059 36% 64% 1650765 25% 1899451 16% 14% 2018 7656163 13610957 21267120 36% 64% 2316492 30% 2114260 16% 14% 2019 8364812 14870778 23235590 36% 64% 2679972 32% 2272213 15% 14% 2020 8961522 15931594 24893116 36% 64% 2912381 32% 2402825 15% 14% 2021 9931209 17655482 27586691 36% 64% 3133594 32% 2598685 15% 13% 2022 10780771 19165815 29946586 36% 64% 3355723 31% 2758165 14% 13% 2023 11374165 20220738 31594903 36% 64% 3569004 31% 2866184 14% 13% 2024 11735684 20863439 32599123 36% 64% 3751893 32% 2931204 14% 13% 2025 12034605 21394854 33429459 36% 64% 3881987 32% 2985124 14% 13% 2026 12503198 22227907 34731105 36% 64% 4009362 32% 3067338 14% 12% 2027 13103157 23294502 36397659 36% 64% 4143381 32% 3173812 14% 12% 2028 13450777 23912492 37363269 36% 64% 4295914 32% 3236935 14% 12% 2029 13497735 23995973 37493708 36% 64% 4418034 33% 3245154 14% 12% 2030 13497735 23995973 37493708 36% 64% 4454078 33% 3245154 14% 12%
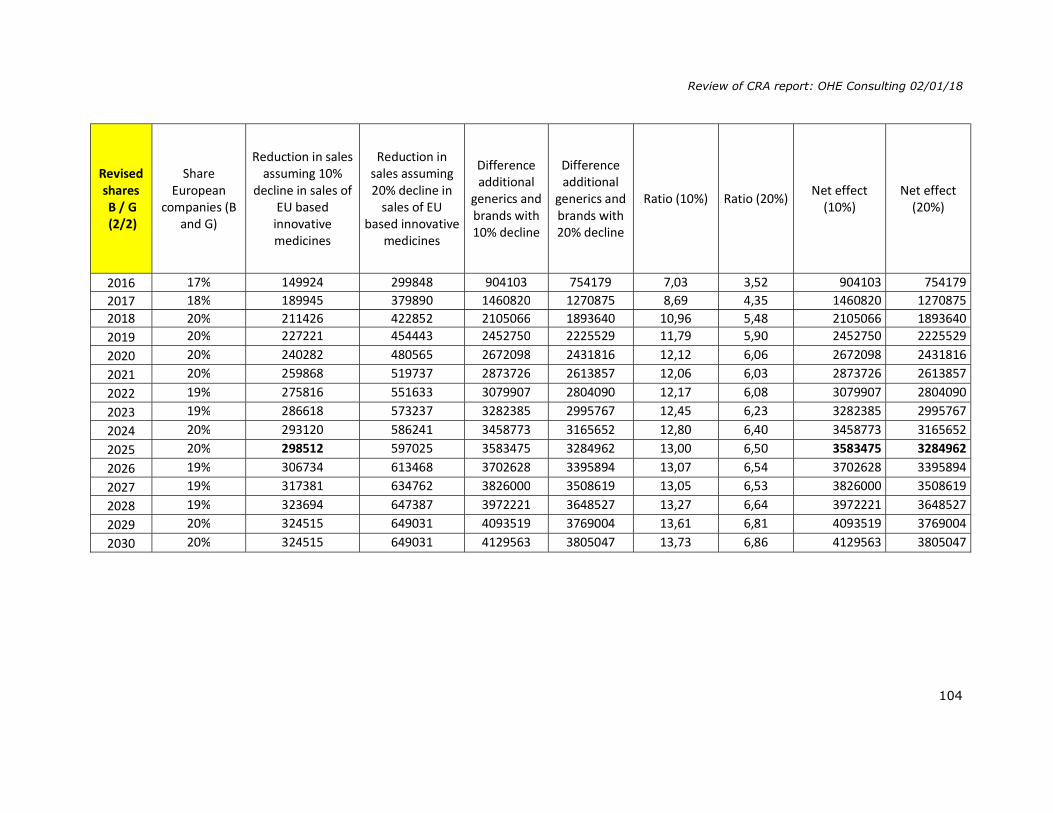
Review of CRA report: OHE Consulting 02/01/18
104
Revised shares B / G (2/2)
Share European
companies (B and G)
Reduction in sales assuming 10%
decline in sales of EU based
innovative medicines
Reduction in sales assuming 20% decline in
sales of EU based innovative
medicines
Difference additional
generics and brands with 10% decline
Difference additional
generics and brands with 20% decline
Ratio (10%) Ratio (20%) Net effect (10%)
Net effect (20%)
2016 17% 149924 299848 904103 754179 7,03 3,52 904103 754179 2017 18% 189945 379890 1460820 1270875 8,69 4,35 1460820 1270875 2018 20% 211426 422852 2105066 1893640 10,96 5,48 2105066 1893640 2019 20% 227221 454443 2452750 2225529 11,79 5,90 2452750 2225529 2020 20% 240282 480565 2672098 2431816 12,12 6,06 2672098 2431816 2021 20% 259868 519737 2873726 2613857 12,06 6,03 2873726 2613857 2022 19% 275816 551633 3079907 2804090 12,17 6,08 3079907 2804090 2023 19% 286618 573237 3282385 2995767 12,45 6,23 3282385 2995767 2024 20% 293120 586241 3458773 3165652 12,80 6,40 3458773 3165652 2025 20% 298512 597025 3583475 3284962 13,00 6,50 3583475 3284962 2026 19% 306734 613468 3702628 3395894 13,07 6,54 3702628 3395894 2027 19% 317381 634762 3826000 3508619 13,05 6,53 3826000 3508619 2028 19% 323694 647387 3972221 3648527 13,27 6,64 3972221 3648527 2029 20% 324515 649031 4093519 3769004 13,61 6,81 4093519 3769004 2030 20% 324515 649031 4129563 3805047 13,73 6,86 4129563 3805047

Review of CRA report: OHE Consulting 02/01/18
105
Revised shares +
originators response
(1/2)
Estimated generic sales during the period between
protection expiry in the third
country and SPC protection period
in Europe (EUR 000) - 36% of
shares + 80% of value
Market size available to innovative
producers during the period between
protection expiry in the third
country and SPC protection period in Europe - 64% of
shares + 80% of value
Total Share generics
Share innovative
Total additional EU generic
sales due to the SPC export waiver
Original share of
EU generics
Estimated sales by European innovative
pharmaceutical producers during period between
protection expiry in the third
country and SPC protection period
in Europe
Original share of
EU innovative
Share EU innovative after lost
sales (10%) of
all innovative
2016 4024094 7153945 11178039,2 36% 64% 843222 21% 1199392 17% 15% 2017 5383025 9569822 14952847,2 36% 64% 1320612 25% 1519561 16% 14% 2018 6124931 10888765 17013696 36% 64% 1853194 30% 1691408 16% 14% 2019 6691850 11896622 18588472 36% 64% 2143977 32% 1817770 15% 14% 2020 7169217 12745275 19914492,8 36% 64% 2329905 32% 1922260 15% 14% 2021 7944967 14124386 22069352,8 36% 64% 2506875 32% 2078948 15% 13% 2022 8624617 15332652 23957268,8 36% 64% 2684579 31% 2206532 14% 13% 2023 9099332 16176590 25275922,4 36% 64% 2855203 31% 2292947 14% 13% 2024 9388547 16690751 26079298,4 36% 64% 3001514 32% 2344963 14% 13% 2025 9627684 17115883 26743567,2 36% 64% 3105590 32% 2388099 14% 13% 2026 10002558 17782326 27784884 36% 64% 3207489 32% 2453870 14% 12% 2027 10482526 18635601 29118127,2 36% 64% 3314705 32% 2539050 14% 12% 2028 10760621 19129994 29890615,2 36% 64% 3436731 32% 2589548 14% 12% 2029 10798188 19196778 29994966,4 36% 64% 3534428 33% 2596124 14% 12% 2030 10798188 19196778 29994966,4 36% 64% 3563262 33% 2596124 14% 12%
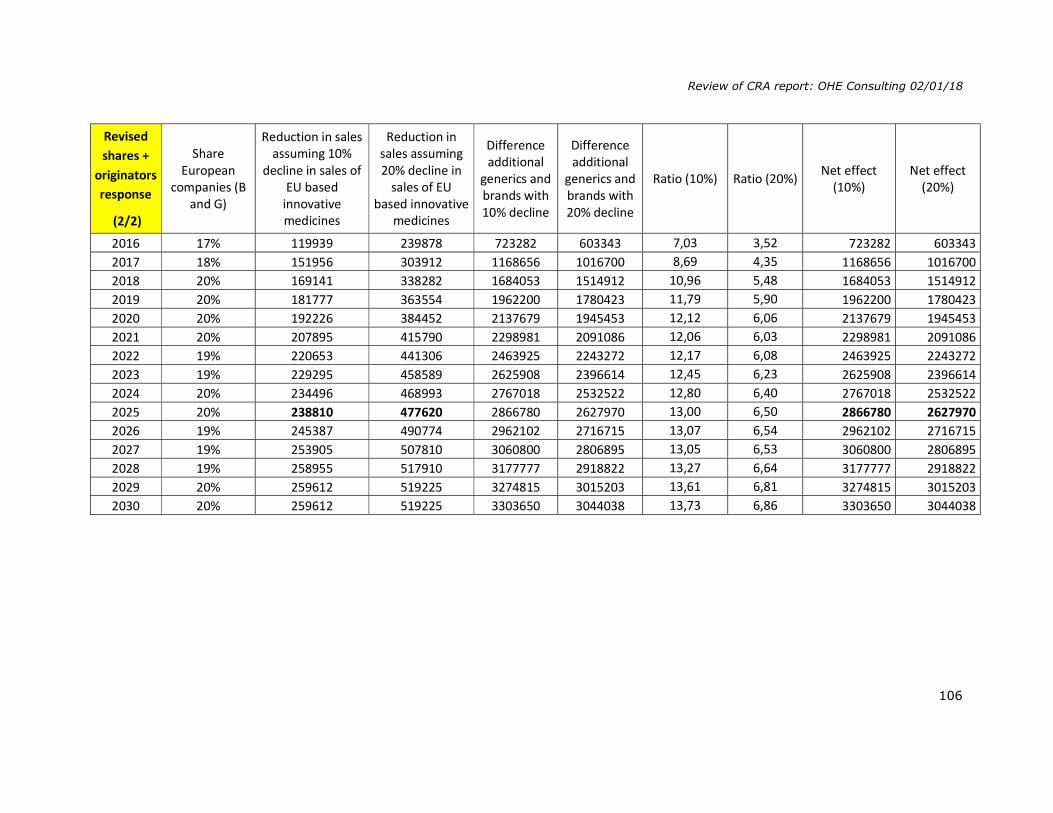
Review of CRA report: OHE Consulting 02/01/18
106
Revised shares +
originators response
(2/2)
Share European
companies (B and G)
Reduction in sales assuming 10%
decline in sales of EU based
innovative medicines
Reduction in sales assuming 20% decline in
sales of EU based innovative
medicines
Difference additional
generics and brands with 10% decline
Difference additional
generics and brands with 20% decline
Ratio (10%) Ratio (20%) Net effect (10%)
Net effect (20%)
2016 17% 119939 239878 723282 603343 7,03 3,52 723282 603343 2017 18% 151956 303912 1168656 1016700 8,69 4,35 1168656 1016700 2018 20% 169141 338282 1684053 1514912 10,96 5,48 1684053 1514912 2019 20% 181777 363554 1962200 1780423 11,79 5,90 1962200 1780423 2020 20% 192226 384452 2137679 1945453 12,12 6,06 2137679 1945453 2021 20% 207895 415790 2298981 2091086 12,06 6,03 2298981 2091086 2022 19% 220653 441306 2463925 2243272 12,17 6,08 2463925 2243272 2023 19% 229295 458589 2625908 2396614 12,45 6,23 2625908 2396614 2024 20% 234496 468993 2767018 2532522 12,80 6,40 2767018 2532522 2025 20% 238810 477620 2866780 2627970 13,00 6,50 2866780 2627970 2026 19% 245387 490774 2962102 2716715 13,07 6,54 2962102 2716715 2027 19% 253905 507810 3060800 2806895 13,05 6,53 3060800 2806895 2028 19% 258955 517910 3177777 2918822 13,27 6,64 3177777 2918822 2029 20% 259612 519225 3274815 3015203 13,61 6,81 3274815 3015203 2030 20% 259612 519225 3303650 3044038 13,73 6,86 3303650 3044038
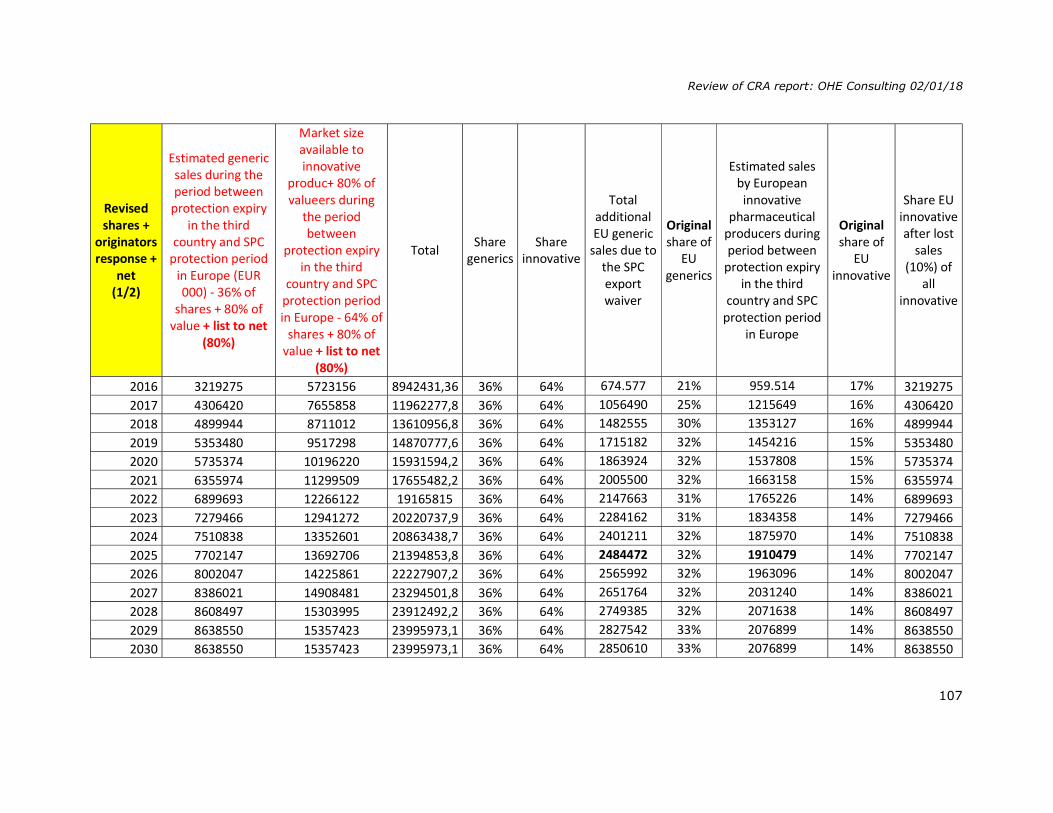
Review of CRA report: OHE Consulting 02/01/18
107
Revised shares +
originators response +
net (1/2)
Estimated generic sales during the period between
protection expiry in the third
country and SPC protection period
in Europe (EUR 000) - 36% of
shares + 80% of value + list to net
(80%)
Market size available to innovative
produc+ 80% of valueers during
the period between
protection expiry in the third
country and SPC protection period in Europe - 64% of
shares + 80% of value + list to net
(80%)
Total Share generics
Share innovative
Total additional EU generic
sales due to the SPC export waiver
Original share of
EU generics
Estimated sales by European innovative
pharmaceutical producers during period between
protection expiry in the third
country and SPC protection period
in Europe
Original share of
EU innovative
Share EU innovative after lost
sales (10%) of
all innovative
2016 3219275 5723156 8942431,36 36% 64% 674.577 21% 959.514 17% 3219275 2017 4306420 7655858 11962277,8 36% 64% 1056490 25% 1215649 16% 4306420 2018 4899944 8711012 13610956,8 36% 64% 1482555 30% 1353127 16% 4899944 2019 5353480 9517298 14870777,6 36% 64% 1715182 32% 1454216 15% 5353480 2020 5735374 10196220 15931594,2 36% 64% 1863924 32% 1537808 15% 5735374 2021 6355974 11299509 17655482,2 36% 64% 2005500 32% 1663158 15% 6355974 2022 6899693 12266122 19165815 36% 64% 2147663 31% 1765226 14% 6899693 2023 7279466 12941272 20220737,9 36% 64% 2284162 31% 1834358 14% 7279466 2024 7510838 13352601 20863438,7 36% 64% 2401211 32% 1875970 14% 7510838 2025 7702147 13692706 21394853,8 36% 64% 2484472 32% 1910479 14% 7702147 2026 8002047 14225861 22227907,2 36% 64% 2565992 32% 1963096 14% 8002047 2027 8386021 14908481 23294501,8 36% 64% 2651764 32% 2031240 14% 8386021 2028 8608497 15303995 23912492,2 36% 64% 2749385 32% 2071638 14% 8608497 2029 8638550 15357423 23995973,1 36% 64% 2827542 33% 2076899 14% 8638550 2030 8638550 15357423 23995973,1 36% 64% 2850610 33% 2076899 14% 8638550
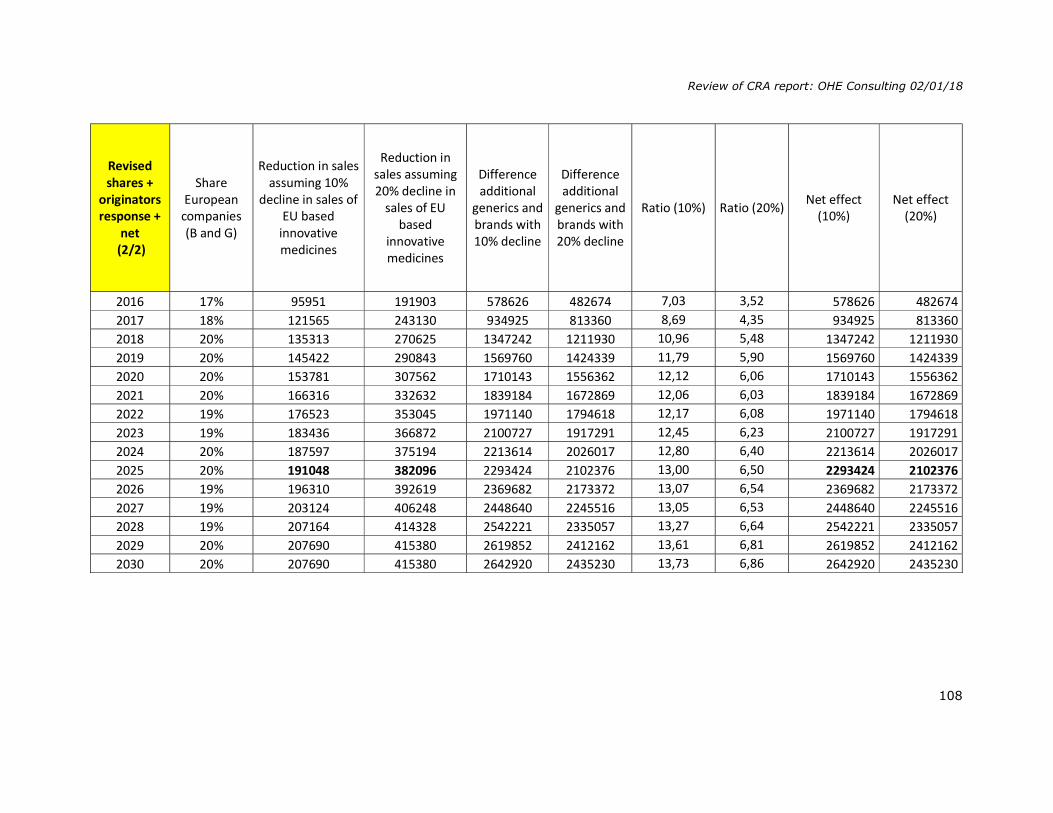
Review of CRA report: OHE Consulting 02/01/18
108
Revised shares +
originators response +
net (2/2)
Share European
companies (B and G)
Reduction in sales assuming 10%
decline in sales of EU based
innovative medicines
Reduction in sales assuming 20% decline in
sales of EU based
innovative medicines
Difference additional
generics and brands with 10% decline
Difference additional
generics and brands with 20% decline
Ratio (10%) Ratio (20%) Net effect (10%)
Net effect (20%)
2016 17% 95951 191903 578626 482674 7,03 3,52 578626 482674 2017 18% 121565 243130 934925 813360 8,69 4,35 934925 813360 2018 20% 135313 270625 1347242 1211930 10,96 5,48 1347242 1211930 2019 20% 145422 290843 1569760 1424339 11,79 5,90 1569760 1424339 2020 20% 153781 307562 1710143 1556362 12,12 6,06 1710143 1556362 2021 20% 166316 332632 1839184 1672869 12,06 6,03 1839184 1672869 2022 19% 176523 353045 1971140 1794618 12,17 6,08 1971140 1794618 2023 19% 183436 366872 2100727 1917291 12,45 6,23 2100727 1917291 2024 20% 187597 375194 2213614 2026017 12,80 6,40 2213614 2026017 2025 20% 191048 382096 2293424 2102376 13,00 6,50 2293424 2102376 2026 19% 196310 392619 2369682 2173372 13,07 6,54 2369682 2173372 2027 19% 203124 406248 2448640 2245516 13,05 6,53 2448640 2245516 2028 19% 207164 414328 2542221 2335057 13,27 6,64 2542221 2335057 2029 20% 207690 415380 2619852 2412162 13,61 6,81 2619852 2412162 2030 20% 207690 415380 2642920 2435230 13,73 6,86 2642920 2435230

Review of CRA report: OHE Consulting 02/01/18
109
Revised shares +
originators response + net + IMS
EU G shares (1 / 2)
Estimated generic sales during the period between
protection expiry in the third
country and SPC protection period
in Europe (EUR 000) - 36% of
shares + 80% of value + list to net
(80%)
Market size available to innovative
producers during the period between
protection expiry in the third
country and SPC protection period in Europe: 80% of
value + 80% of value
Total Share generics
Share innovative
Total additional EU generic
sales due to the SPC export waiver
Original share of
EU generics - 4 p.p.
Estimated sales by European innovative
pharmaceutical producers during period between
protection expiry in the third
country and SPC protection period
in Europe
Original share of
EU innovative
Share EU innovative after lost
sales (10%) of
all innovative
2016 3219275 5723156 8942431 36% 64% 545806 17% 959514 17% 15% 2017 4306420 7655858 11962278 36% 64% 884233 21% 1215649 16% 14% 2018 4899944 8711012 13610957 36% 64% 1286557 26% 1353127 16% 14% 2019 5353480 9517298 14870778 36% 64% 1501043 28% 1454216 15% 14% 2020 5735374 10196220 15931594 36% 64% 1634509 28% 1537808 15% 14% 2021 6355974 11299509 17655482 36% 64% 1751261 28% 1663158 15% 13% 2022 6899693 12266122 19165815 36% 64% 1871675 27% 1765226 14% 13% 2023 7279466 12941272 20220738 36% 64% 1992984 27% 1834358 14% 13% 2024 7510838 13352601 20863439 36% 64% 2100778 28% 1875970 14% 13% 2025 7702147 13692706 21394854 36% 64% 2176386 28% 1910479 14% 13% 2026 8002047 14225861 22227907 36% 64% 2245910 28% 1963096 14% 12% 2027 8386021 14908481 23294502 36% 64% 2316323 28% 2031240 14% 12% 2028 8608497 15303995 23912492 36% 64% 2405045 28% 2071638 14% 12% 2029 8638550 15357423 23995973 36% 64% 2482000 29% 2076899 14% 12% 2030 8638550 15357423 23995973 36% 64% 2505068 29% 2.076.899 14% 12%

Review of CRA report: OHE Consulting 02/01/18
110
Revised shares +
originators response + net + IMS
EU G shares (2/2)
Share European
companies (B and G)
Reduction in sales assuming 10%
decline in sales of EU based
innovative medicines
Reduction in sales assuming 20% decline in
sales of EU based
innovative medicines
Difference additional
generics and brands with 10% decline
Difference additional
generics and brands with 20% decline
Ratio (10%) Ratio (20%) Net effect (10%)
Net effect (20%)
2016 16% 95951 191903 449855 353903 5,69 2,84 449855 353903 2017 17% 121565 243130 762668 641103 7,27 3,64 762668 641103 2018 18% 135313 270625 1151245 1015932 9,51 4,75 1151245 1015932 2019 19% 145422 290843 1355621 1210199 10,32 5,16 1355621 1210199 2020 19% 153781 307562 1480728 1326947 10,63 5,31 1480728 1326947 2021 18% 166316 332632 1584945 1418630 10,53 5,26 1584945 1418630 2022 18% 176523 353045 1695153 1518630 10,60 5,30 1695153 1518630 2023 18% 183436 366872 1809548 1626112 10,86 5,43 1809548 1626112 2024 18% 187597 375194 1913181 1725584 11,20 5,60 1913181 1725584 2025 18% 191048 382096 1985338 1794290 11,39 5,70 1985338 1794290 2026 18% 196310 392619 2049600 1853290 11,44 5,72 2049600 1853290 2027 18% 203124 406248 2113199 1910075 11,40 5,70 2113199 1910075 2028 18% 207164 414328 2197881 1990718 11,61 5,80 2197881 1990718 2029 18% 207690 415380 2274310 2066620 11,95 5,98 2274310 2066620 2030 18% 207690 415380 2297378 2089688 12,06 6,03 2297378 2089688

Review of CRA report: OHE Consulting 02/01/18
111
Table to estimate eliminated first mover advantages sales
Original share of 1st mover
Total generics sales* Eliminated sales Net sales Difference
1% 545806 8091 537715 8091 19% 884233 167443 716790 167443 35% 1286557 453396 833161 453396 39% 1501043 592365 908678 592365 41% 1634509 665497 969011 665497 40% 1751261 694378 1056883 694378 39% 1871675 734949 1136726 734949 40% 1992984 796653 1196331 796653 41% 2100778 863688 1237090 863688 42% 2176386 907095 1269291 907095 42% 2245910 932313 1313597 932313 41% 2316323 950049 1366274 950049 42% 2405045 1003196 1401849 1003196 43% 2482000 1071228 1410772 1071228 44% 2505068 1092706 1412361 1092706
* Column “Total additional EU generic sales due to the SPC export waiver” from table “Revised shares + originators response + net + IMS EU G shares (1 / 2)”
Column ‘net sales’ show sales for EU generics companies after subtracting sales due to first over advantages.
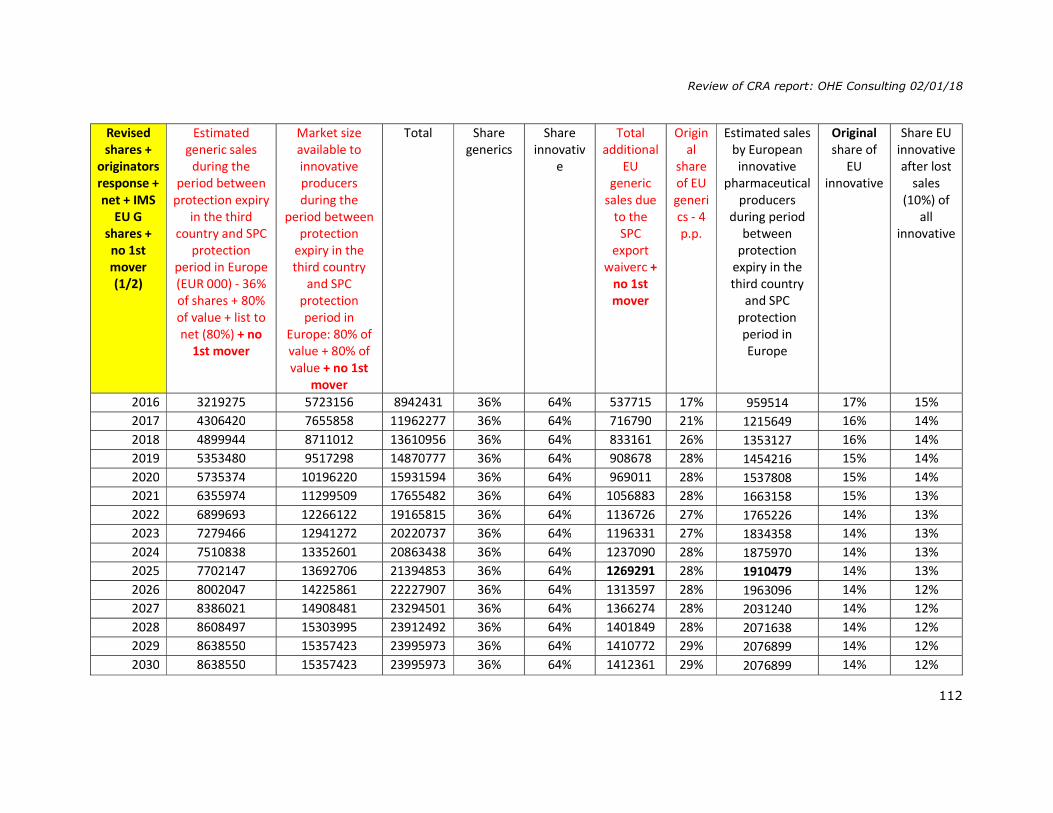
Review of CRA report: OHE Consulting 02/01/18
112
Revised shares +
originators response + net + IMS
EU G shares + no 1st mover (1/2)
Estimated generic sales
during the period between
protection expiry in the third
country and SPC protection
period in Europe (EUR 000) - 36% of shares + 80% of value + list to net (80%) + no
1st mover
Market size available to innovative producers during the
period between protection
expiry in the third country
and SPC protection period in
Europe: 80% of value + 80% of value + no 1st
mover
Total Share generics
Share innovativ
e
Total additional
EU generic
sales due to the
SPC export
waiverc + no 1st mover
Original
share of EU generics - 4 p.p.
Estimated sales by European innovative
pharmaceutical producers
during period between
protection expiry in the third country
and SPC protection period in Europe
Original share of
EU innovative
Share EU innovative after lost
sales (10%) of
all innovative
2016 3219275 5723156 8942431 36% 64% 537715 17% 959514 17% 15% 2017 4306420 7655858 11962277 36% 64% 716790 21% 1215649 16% 14% 2018 4899944 8711012 13610956 36% 64% 833161 26% 1353127 16% 14% 2019 5353480 9517298 14870777 36% 64% 908678 28% 1454216 15% 14% 2020 5735374 10196220 15931594 36% 64% 969011 28% 1537808 15% 14% 2021 6355974 11299509 17655482 36% 64% 1056883 28% 1663158 15% 13% 2022 6899693 12266122 19165815 36% 64% 1136726 27% 1765226 14% 13% 2023 7279466 12941272 20220737 36% 64% 1196331 27% 1834358 14% 13% 2024 7510838 13352601 20863438 36% 64% 1237090 28% 1875970 14% 13% 2025 7702147 13692706 21394853 36% 64% 1269291 28% 1910479 14% 13% 2026 8002047 14225861 22227907 36% 64% 1313597 28% 1963096 14% 12% 2027 8386021 14908481 23294501 36% 64% 1366274 28% 2031240 14% 12% 2028 8608497 15303995 23912492 36% 64% 1401849 28% 2071638 14% 12% 2029 8638550 15357423 23995973 36% 64% 1410772 29% 2076899 14% 12% 2030 8638550 15357423 23995973 36% 64% 1412361 29% 2076899 14% 12%
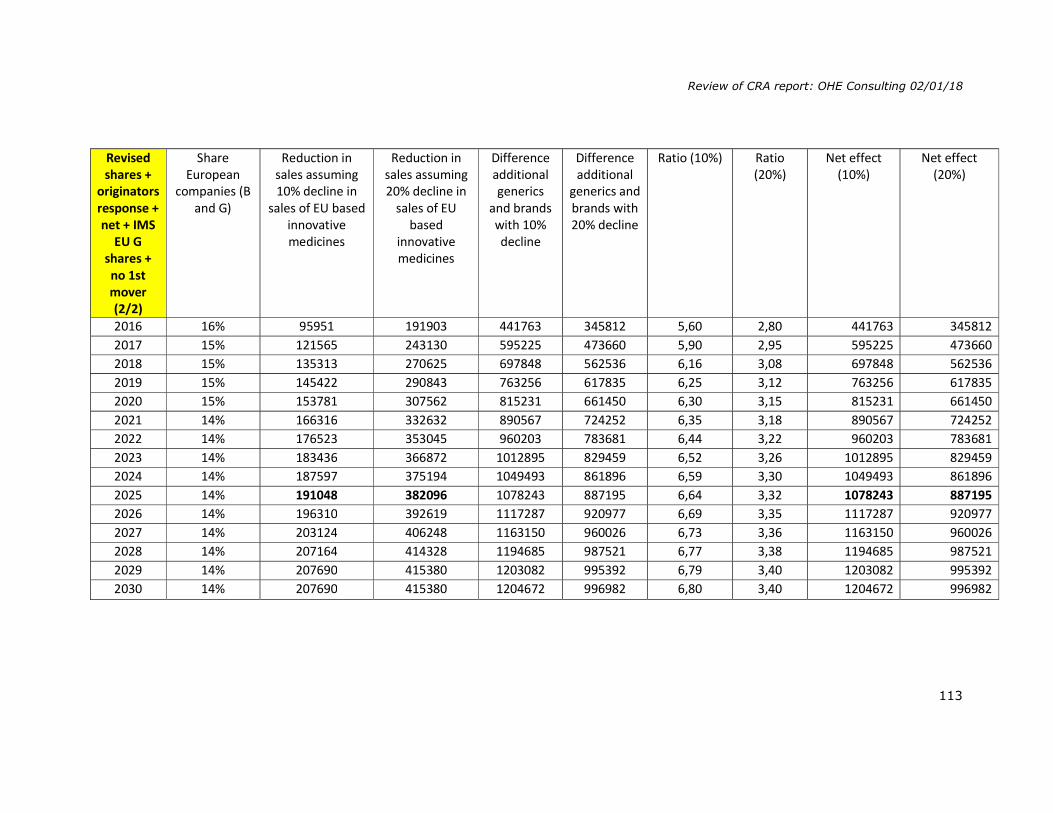
Review of CRA report: OHE Consulting 02/01/18
113
Revised shares +
originators response + net + IMS
EU G shares + no 1st mover (2/2)
Share European
companies (B and G)
Reduction in sales assuming 10% decline in
sales of EU based innovative medicines
Reduction in sales assuming 20% decline in
sales of EU based
innovative medicines
Difference additional generics
and brands with 10% decline
Difference additional
generics and brands with 20% decline
Ratio (10%) Ratio (20%)
Net effect (10%)
Net effect (20%)
2016 16% 95951 191903 441763 345812 5,60 2,80 441763 345812 2017 15% 121565 243130 595225 473660 5,90 2,95 595225 473660 2018 15% 135313 270625 697848 562536 6,16 3,08 697848 562536 2019 15% 145422 290843 763256 617835 6,25 3,12 763256 617835 2020 15% 153781 307562 815231 661450 6,30 3,15 815231 661450 2021 14% 166316 332632 890567 724252 6,35 3,18 890567 724252 2022 14% 176523 353045 960203 783681 6,44 3,22 960203 783681 2023 14% 183436 366872 1012895 829459 6,52 3,26 1012895 829459 2024 14% 187597 375194 1049493 861896 6,59 3,30 1049493 861896 2025 14% 191048 382096 1078243 887195 6,64 3,32 1078243 887195 2026 14% 196310 392619 1117287 920977 6,69 3,35 1117287 920977 2027 14% 203124 406248 1163150 960026 6,73 3,36 1163150 960026 2028 14% 207164 414328 1194685 987521 6,77 3,38 1194685 987521 2029 14% 207690 415380 1203082 995392 6,79 3,40 1203082 995392 2030 14% 207690 415380 1204672 996982 6,80 3,40 1204672 996982