oil and gas in 2018: new competition - forum.rice.edu · •us oil and gas companies will increase...
TRANSCRIPT

Oil and Gas in 2018:Markets, Spending, Projects
Bob Tippee
Editor, Oil & Gas Journal
Rice Global E&C Forum
March 9, 2018

For discussion
• Oil and gas markets will have a transformative year• OPEC wants to institutionalize production restraint
• US LNG export capacity set to triple in two years
• US oil and gas companies will increase capital spending—cautiously—in 2018
• The oil and gas industry’s approach to capital projects is evolving

Crude oil prices…
Source: Charts from US Energy Information Administration Short Term Energy Outlook, February 2018
Increased in 2017 because… Supply deal trimmed stocks, and…
● The Forties Pipeline closed Dec. 11-Jan. 2● Production fell in Venezuela, was under question jeopardy in Iran, Libya, etc.● Belief grew that the slump was ending
Production agreements start?

The global oil balance (MMbd)
Current view of
2018F 2017E 2016
Global demand 99.2 97.8 96.2
Non-OPEC supply 59.9 58.2 57.4
OPEC NGL 7.0 6.9 6.8
Need for OPEC crude 32.3 32.7 32.0
OPEC crude 32.3* 32.3* 32.8
Stock change & other 0* -0.4* +0.8
Source: International Energy Agency Oil Market Report, February 2017
*OPEC crude is IEA estimate for 2017 average; stock change calculated.
Supply-agreement compliance rates,
average 2017
OPEC 12 95%
Non-OPEC 10 82%
Source: IEA Oil Market Report, January 2018
OPEC claims overall compliance of 107% in 2017
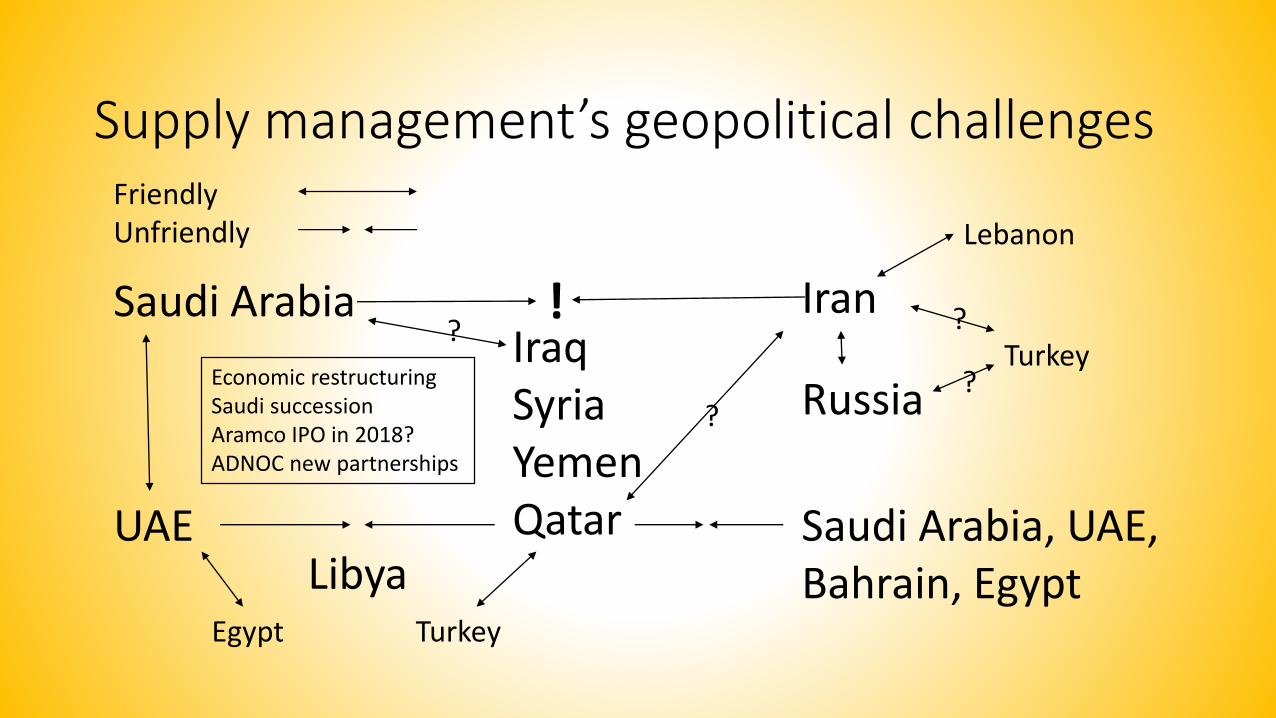
Supply management’s geopolitical challenges
Saudi Arabia IranIraqSyriaYemenQatar
Russia
LibyaUAE
TurkeyEgypt
Saudi Arabia, UAE, Bahrain, Egypt
Economic restructuringSaudi successionAramco IPO in 2018?ADNOC new partnerships
Friendly Unfriendly
?
?
Turkey?
?
Lebanon
!
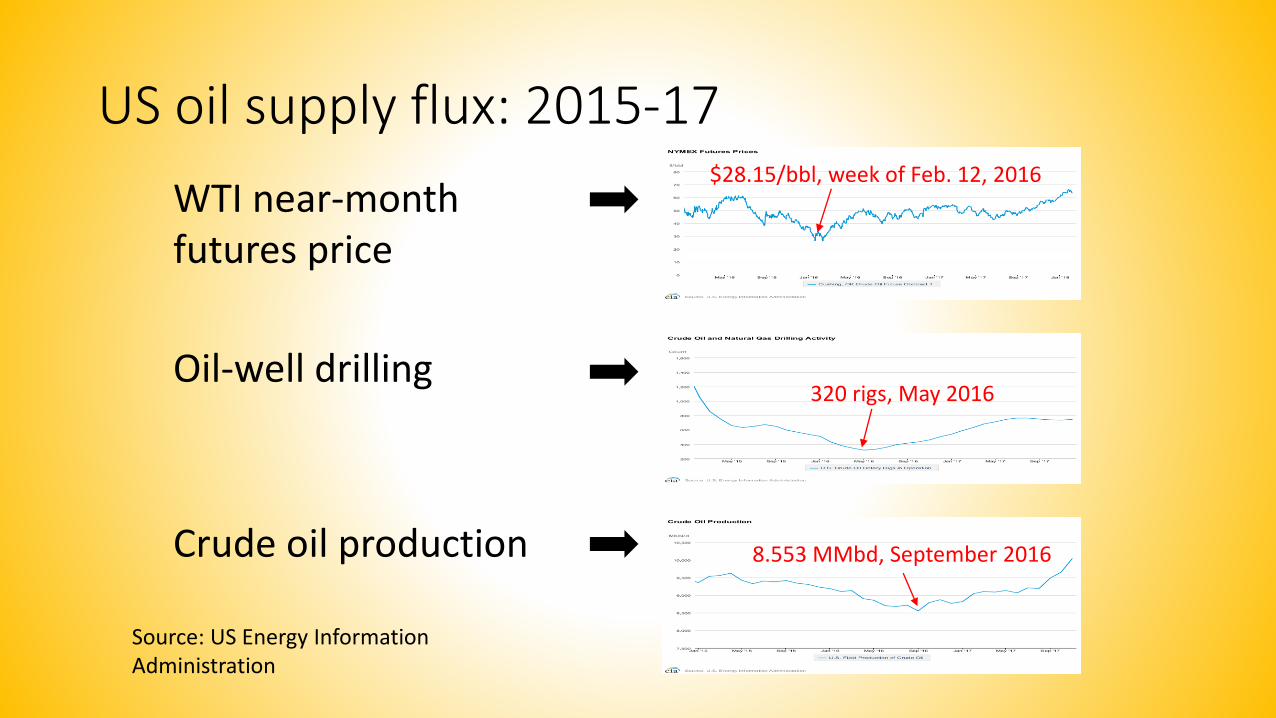
US oil supply flux: 2015-17
WTI near-month futures price
Oil-well drilling
Crude oil production
Source: US Energy Information Administration
$28.15/bbl, week of Feb. 12, 2016
320 rigs, May 2016
8.553 MMbd, September 2016

Tight-oil plays push US production
US production of crude oi land lease condensate will set record above 10 million b/d this year:
EIA says 10.7 million b/d in 2018, 11.3 million b/d in 2019
OGJ says 10.1 million b/d in 2018

Can tight-oil production keep growing?
Why no? Why yes?
Permian basin surge motivated by HBP drilling
Productivity, ultimate-recovery improvements continue
Resources (or sweet spots) have limits The resource is (exponentially) huge
Operator refocus on free cash flow will moderate investment
Technical progress continues:● Longer laterals, more frac stages, higher sand-fluid volumes and pressures, better lateral placement and frac monitoring with microseismic● Sand + slickwater vs. designer proppants + gels● High-grade to best rock● New completion design: denser fracs, closer to wellbore, tighter lateral spacing
Capacity contraction: equipment, supplies, workforce
End of sacrificial pricing by contractors
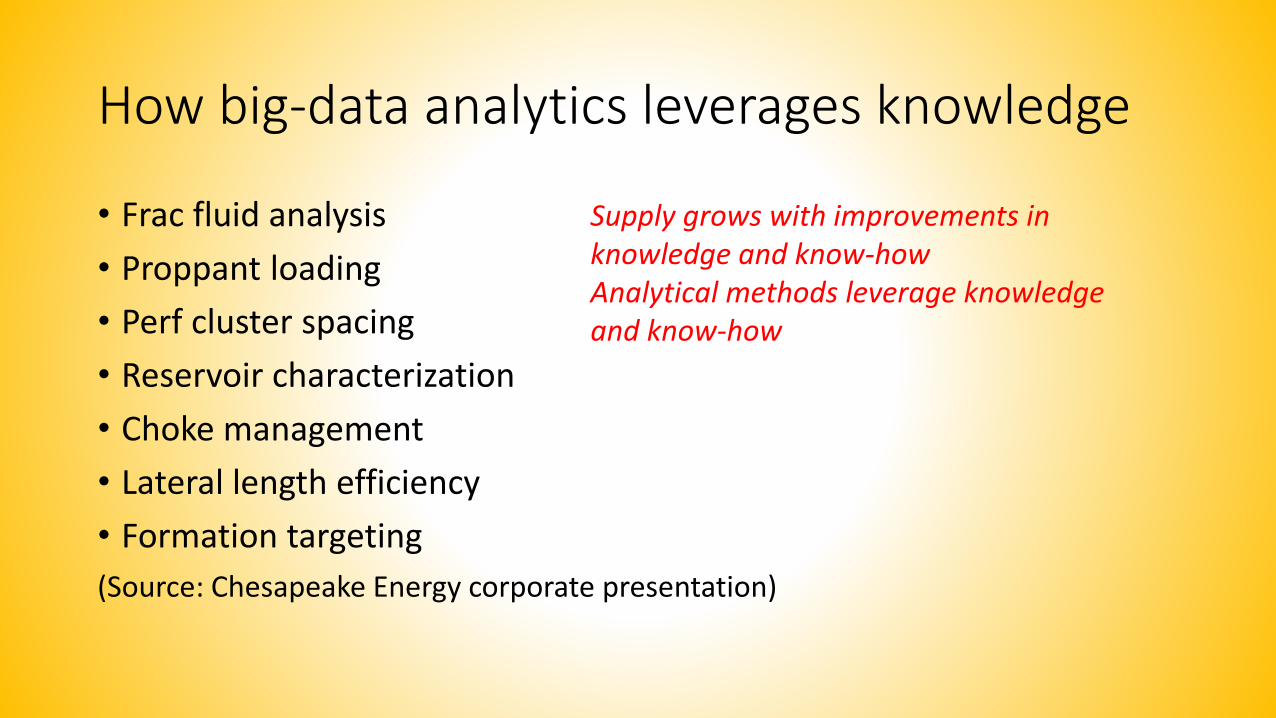
How big-data analytics leverages knowledge
• Frac fluid analysis
• Proppant loading
• Perf cluster spacing
• Reservoir characterization
• Choke management
• Lateral length efficiency
• Formation targeting
(Source: Chesapeake Energy corporate presentation)
Supply grows with improvements in knowledge and know-howAnalytical methods leverage knowledge and know-how

Shale making US a major gas exporter
Source: EIA
Supply trends to present… Assure US gas-trade growth

US LNG export capacity ready to zoom
Source: EIA
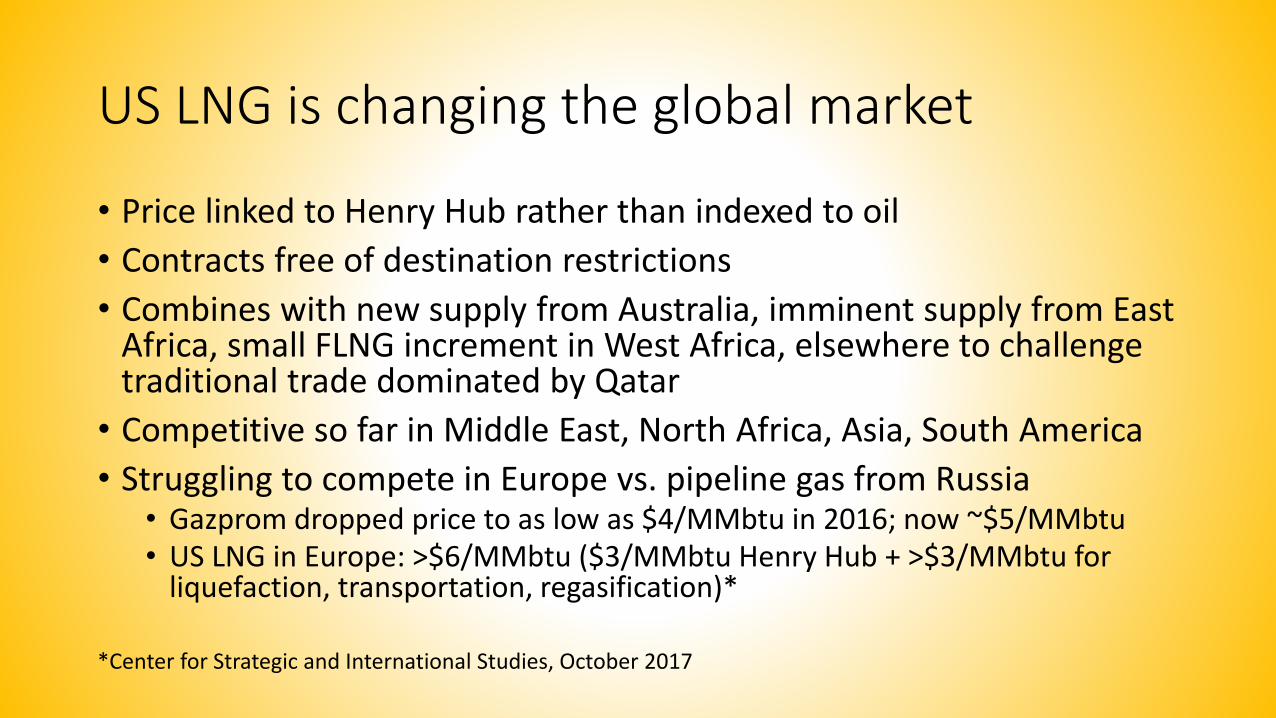
US LNG is changing the global market
• Price linked to Henry Hub rather than indexed to oil
• Contracts free of destination restrictions
• Combines with new supply from Australia, imminent supply from East Africa, small FLNG increment in West Africa, elsewhere to challenge traditional trade dominated by Qatar
• Competitive so far in Middle East, North Africa, Asia, South America
• Struggling to compete in Europe vs. pipeline gas from Russia• Gazprom dropped price to as low as $4/MMbtu in 2016; now ~$5/MMbtu• US LNG in Europe: ˃$6/MMbtu ($3/MMbtu Henry Hub + ˃$3/MMbtu for
liquefaction, transportation, regasification)*
*Center for Strategic and International Studies, October 2017

LNG to dominate gas trade (CEDIGAZ)
2015 = 444 bcm 2035 = 836 bcm
LNG 44% LNG 55%
Pipeline 56% Pipeline 45%
Result of shift from pipeline to LNG dominance of gas trade: increased flexibility of delivery and pricing
Gas will act more like oil.
Market growth, 2015-35: 88%
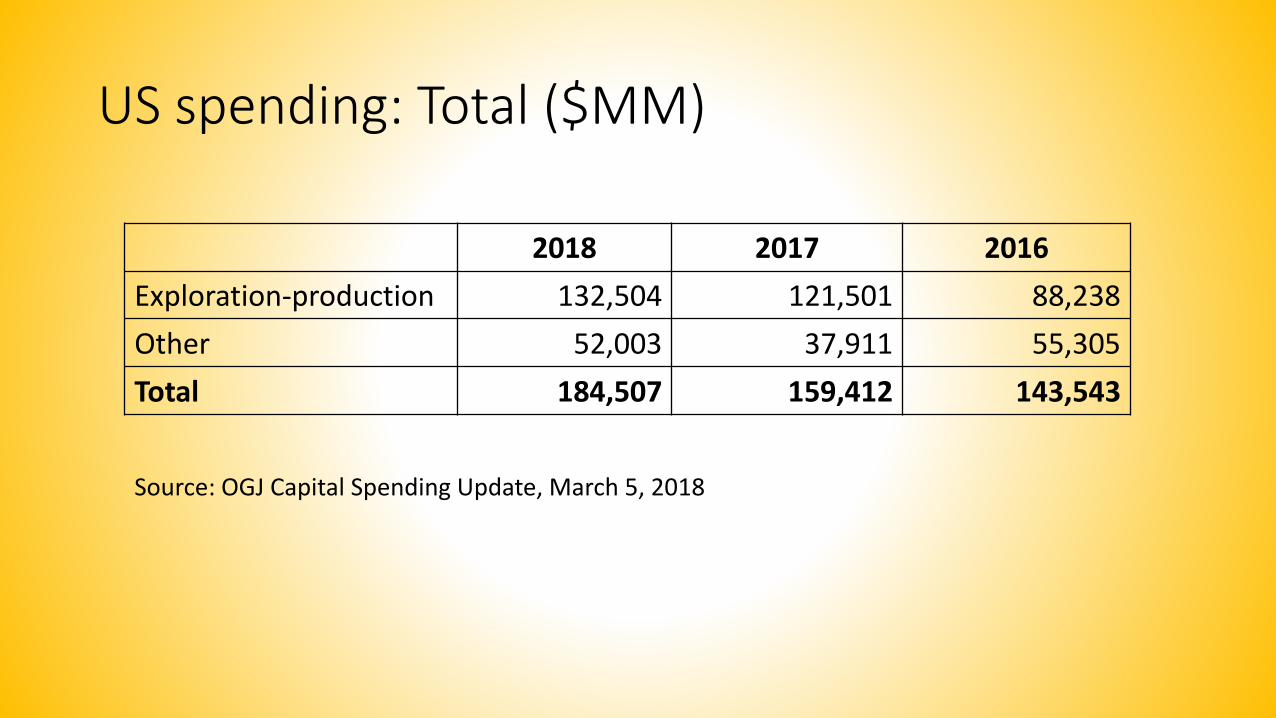
US spending: Total ($MM)
2018 2017 2016
Exploration-production 132,504 121,501 88,238
Other 52,003 37,911 55,305
Total 184,507 159,412 143,543
Source: OGJ Capital Spending Update, March 5, 2018

US spending: Exploration-production ($MM)
2018 2017 2016
Drilling-exploration 111,180 102,000 74,000
Production 21,124 19,380 14,060
OCS lease bonus 200 121 178
Total E-P 132,504 121,501 88,238
● Average rig count (Barclays): 925 in 2018 vs. 850 in 2017● Generally assumed prices: $50-55/bbl WTI crude; more than $3/Mcf Henry Hub gas● Overall emphasis on free cash flow vs. production growth—but production growing● Big companies emphasizing low-cost, short-cycle onshore playsSource: OGJ Capital Spending Update, Mar. 5, 2018 (BEFORE STEEL TARIFFS ANNOUNCED)
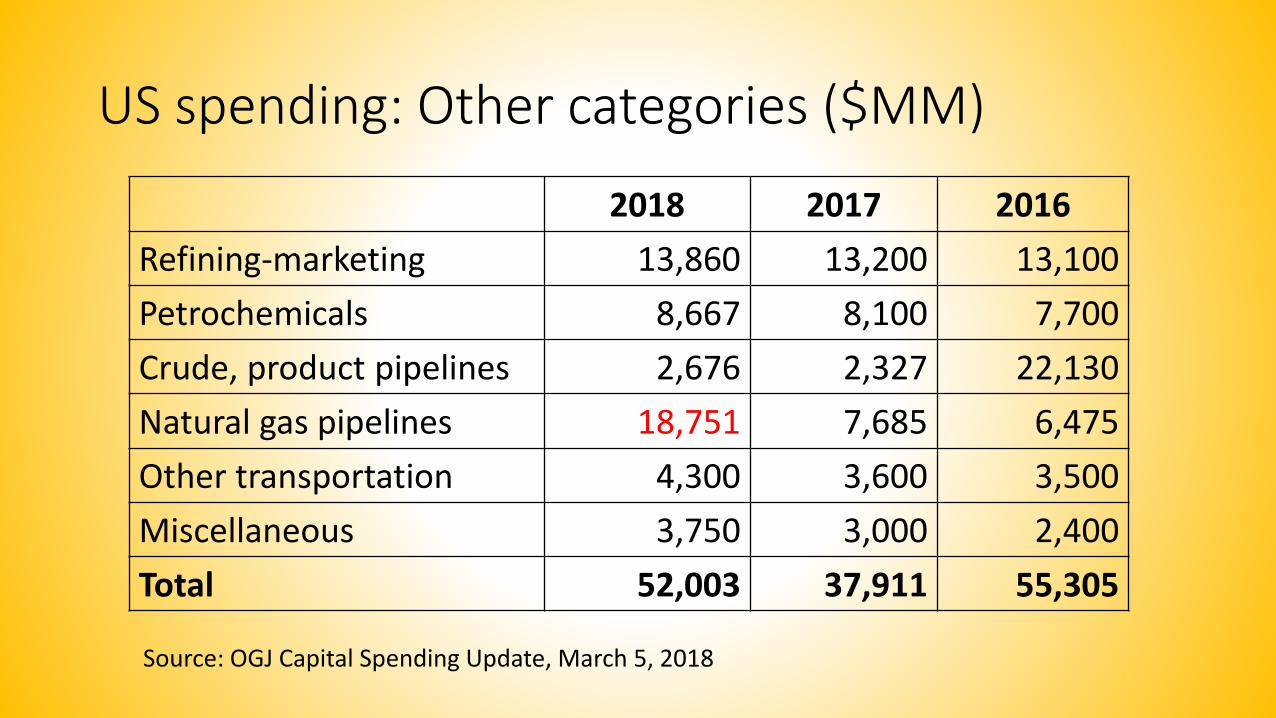
US spending: Other categories ($MM)
2018 2017 2016
Refining-marketing 13,860 13,200 13,100
Petrochemicals 8,667 8,100 7,700
Crude, product pipelines 2,676 2,327 22,130
Natural gas pipelines 18,751 7,685 6,475
Other transportation 4,300 3,600 3,500
Miscellaneous 3,750 3,000 2,400
Total 52,003 37,911 55,305
Source: OGJ Capital Spending Update, March 5, 2018
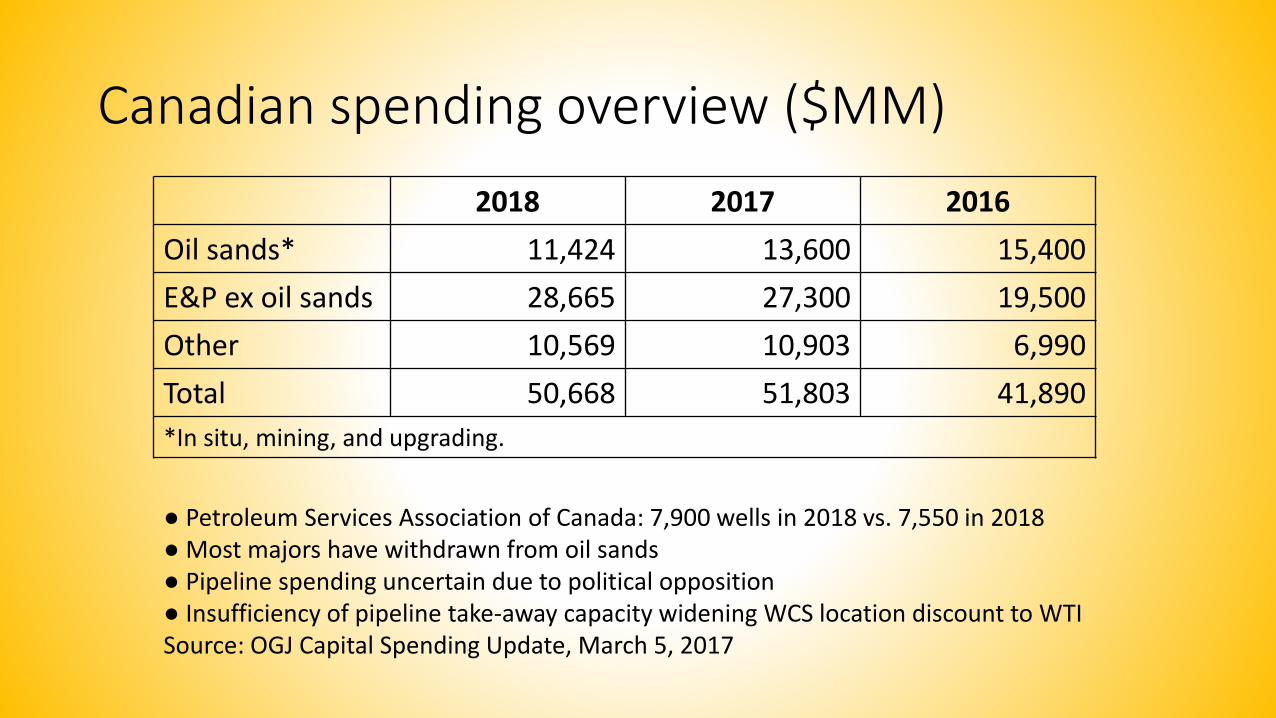
Canadian spending overview ($MM)
2018 2017 2016
Oil sands* 11,424 13,600 15,400
E&P ex oil sands 28,665 27,300 19,500
Other 10,569 10,903 6,990
Total 50,668 51,803 41,890
*In situ, mining, and upgrading.
● Petroleum Services Association of Canada: 7,900 wells in 2018 vs. 7,550 in 2018 ● Most majors have withdrawn from oil sands● Pipeline spending uncertain due to political opposition● Insufficiency of pipeline take-away capacity widening WCS location discount to WTISource: OGJ Capital Spending Update, March 5, 2017

Summary: Oil & Gas Project Cost Reduction Insights Global Survey—4th Quarter 2017• Cost of project funded today is 10-25% less than what it would have
been in 2014• Most savings due to market conditions favoring buyer
• Project funded in 2020 likely to be 10% more than one funded today• Mostly from market changes favoring seller
• Non-market drivers: environmental regs and permitting delays, scope changes, increasing project complexity
• 85% see economic and market risks as moderate to significant, mainly due to uncertainty in global economy

Survey summary—2
• Paradox: 90% have front-end development process, but…
• Highest cost-reduction priorities for owners:• Improving scope definition
• Reducing number of changes during execution
• Engaging contractors earlier in scope definition
• Highest cost-reduction priorities for contractors and suppliers:• Provide owners with more-realistic risk assessments
• Offer more off-the-shelf designs
• Increase skills of project managers and teams
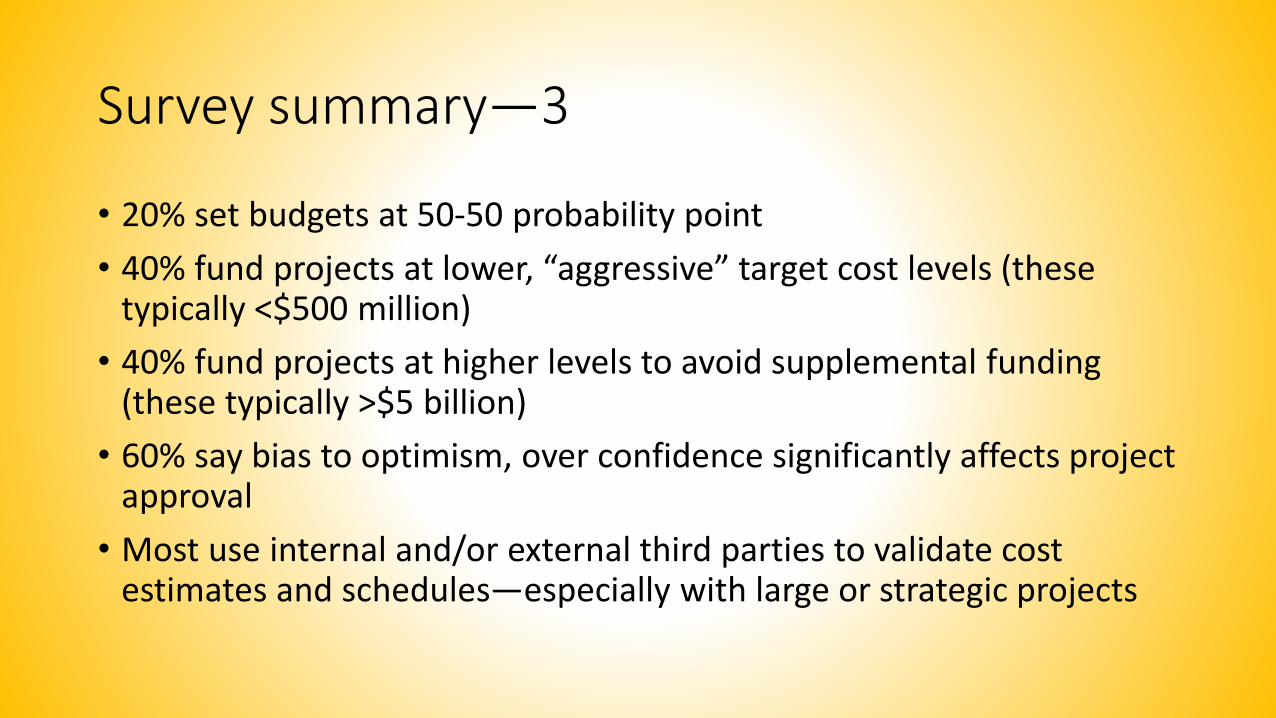
Survey summary—3
• 20% set budgets at 50-50 probability point
• 40% fund projects at lower, “aggressive” target cost levels (these typically <$500 million)
• 40% fund projects at higher levels to avoid supplemental funding (these typically >$5 billion)
• 60% say bias to optimism, over confidence significantly affects project approval
• Most use internal and/or external third parties to validate cost estimates and schedules—especially with large or strategic projects
Survey summary—4
• 70% make moderate to extensive use of technical innovation to reduce cost
• They expect future cost reductions related to innovation to be moderate to significant
• Greatest expected benefit: “transforming the way we design and execute projects;” scored higher than:• “Digital technology advancement”
• “Internally developed new technologies and solutions”

Survey summary—5
• 80% make moderate to extensive use of standardization to…• Reduce cost of engineering custom solutions for each project
• Utilize off-the-shelf components and systems
• Simplify specifications and design requirements
• Gain learning-curve efficiencies through repetition
• They expect future cost reductions related to standardization to be moderate to significant
• Greatest opportunities:• “Using industry standards in place of costlier owner-specific standards”
• Using a “design one, build many” strategy
Survey summary—6
• 75%: Performance risks have moderate to significant impact
• Costs can increase due to ineffective leadership, poor planning and decision-making, and ineffective cost control
• 50%: Loss of experience due to retirements, downsizing a major problem
• More than half concerned about consolidation among engineering contractors and suppliers
• More than half of contractors have “downsized and reorganized to be leaner and more efficient”

Contact information
Bob TippeeEditor, Oil & Gas Journal
713 963 [email protected]
To subscribe: [email protected]
800-633-1657