oil content fraction in tortillas chips during frying and
TRANSCRIPT
ACCEPTED MANUSCRIPT
Oil content fraction in tortillas chips during frying and their prediction by image analysis using computer vision
1
2
3
4 5 6
7 8 9
10 11
12 13
14
15
16 17
18
19
20
21
Silvia B. Matiacevich(1,2,*), Olivia C. Henríquez(1), Domingo Mery(3) and Franco Pedreschi (4)
(1,*) Departamento de Ciencia y Tecnología de los Alimentos, Facultad Tecnológica, Universidad de Santiago de Chile (USACH), Av. Ecuador 3769 (7190200) Santiago, Chile. E-mail corresponding author: [email protected]
(2)CONICET- Departamento de Industrias, Facultad de Ciencias Exactas y Naturales, Universidad de Buenos Aires, Int. Güiraldes s/n, Ciudad Universitaria (EGA1428) Ciudad Autónoma de Buenos Aires, Argentina.
(3) Departamento de Ciencia de la Computación, Pontificia Universidad Católica de Chile, Av. Vicuña Mackenna 4860 (143) Santiago, Chile. E-mail: [email protected]
(4) Departamento de Ingeniería Química y Bioprocesos. Pontificia Universidad Católica de Chile, Av. Vicuña Mackenna 4860 (143) Santiago, Chile. E-mail: [email protected]
Running Title: Oil content prediction by image analysis
Submitted for publication to International Journal of Food Properties
This manuscript has not been published elsewhere and it has not been submitted for publication elsewhere.
Abstract
The increasing consumption worldwide of tortilla chips make relevant to design and optimize
their industrial quality analysis. Surface, structural and total oil content during frying of tortilla
chips fried at 160, 175, 190ºC for different times were analyzed. The aim was to obtain a
ACCEPTED MANUSCRIPT 1
Dow
nloa
ded
by [S
ilvia
Mat
iace
vich
] at 1
5:21
09
Apr
il 20
13
ACCEPTED MANUSCRIPT 22
23
24
25
26
27
28
29
30
31
32
33
34
35
36
37
38
39
relationship between oil content and features from their digital images. The results showed a
high linear correlation (R>0.90) between oil content with image features at each frying
temperature, indicating that trustable models can be developed, allowing the prediction of oil
content of tortilla chips by using selected features extracted from their digital images, without the
necessity of measuring them. Cross-validation technique demonstrated the repeatability of each
model and their good performance (>90%).
Keywords: Oil content; tortilla chips; computer vision; image features; oil fraction
INTRODUCTION
A nixtamalized soft moist dough called ‘masa’ is the raw material used to make the most popular
masa-based-snack products (corn and tortilla chips) (1), which are highly consumed in several
Latin-American countries. The increasing consumption worldwide of tortillas make relevant to
design and optimize their industrial quality analysis. Tortilla chips are baked and then fried,
making them absorb less oil, firmer texture and a stronger alkaline flavor than corn chips (fried
without pre-treatment of baking) (2-4).
Deep-fat frying is one of the oldest processes of food preparation and consists basically in the
immersion of food pieces in hot oil. The high oil temperature causes evaporation of the water
while oil is absorbed by the food piece, replacing some of the lost water (5). Bouchon, Aguilera
and Pile (6) defined three different oil fractions, which can be identified as a consequence of the
ACCEPTED MANUSCRIPT 2
Dow
nloa
ded
by [S
ilvia
Mat
iace
vich
] at 1
5:21
09
Apr
il 20
13

ACCEPTED MANUSCRIPT 40
41
42
43
44
45
46
47
48
49
50
51
52
53
54
55
56
57
58
59
60
different absorption mechanisms in fried potato microstructure, such as (i) Structural oil (STO)
which represents the oil absorbed during frying, (ii) Penetrated surface oil (PSO) which
represents the oil suctioned into the food during cooling after removal from the fryer, and (iii)
Surface oil (SUO) which is the oil that remains on the surface and does not penetrate into
microstructure, remaining on the potato slice surface. On the other hand, Moreira et al (3)
defined the core oil as the oil which penetrates the chip microstructure either during frying and
cooling for tortilla chips. This oil fraction was called structural oil (SO) by Durán et al (7) for
potato slices during frying experiments. A wide spectrum of factors has been reported to affect
oil absorption in fried foods, such as oil quality and composition, temperature and time of frying,
initial moisture content of sample, shape and pre-frying treatment (3, 5, 7).
Computer vision system (CV) is a non-destructive technology for acquiring and analyzing an
image to obtain information of the product, to control industrial processes and to improve the
automatic evaluation of food quality (8, 9, 10). A basic CV consists of a digital camera
connected to a computer for image acquisition, a standard setting illuminants (usually a light
box) and a computer software for image processing and analysis (8, 10). CV has been used in the
food industry for quality and color evaluation, detection of defects, grading and sorting of fruits
and vegetables, meat and fish, bakery products and potato chips, and to determine other physical
features such as textural and geometrical among others (10-15). However, the determination of
oil content in food products using computer vision was previously described in few articles. For
example, (i) optimal harvest time of olives was obtained based on quality features derived from
known image processing algorithms (16), (ii) the inspection and quality grade of oil palm from
ACCEPTED MANUSCRIPT 3
Dow
nloa
ded
by [S
ilvia
Mat
iace
vich
] at 1
5:21
09
Apr
il 20
13
ACCEPTED MANUSCRIPT 61
62
63
64
65
66
67
68
69
70
71
72
73
74
75
76
77
78
79
fresh oil bunches was obtained using an automatic production system (17) (iii) to monitoring and
quantifying of oil migration in cocoa butter (18) and chocolate coated products (19). Also, free
and bound non-polar lipids of six Polish winter wheat varieties were analyzed and correlated
with kernels surface and cross-sections color measured by digital image analysis (20). However,
it was not studied in fried products as in this study. Therefore, using CV capabilities, it is
possible to extract and process a lot of image features with the goal of finding which of them are
relevant for accomplishing the classification task (11, 21) or for predicting physical properties
such as texture parameters from foods (22). The texture of an image (IT) is characterized by the
spatial distribution of gray levels in a neighborhood, that is, the local variation of brightness form
1 pixel to the next (or within a small region) (11, 23). Other food visual properties can be
obtained by extracting geometrical and intensity features from the digital color image (11, 21,
24).
The objective of this research was to characterize oil content fractions in tortilla chips during
frying under different conditions (time and frying temperature) and obtain good correlations
between the oil content in tortillas chips and digital features obtained from their corresponding
digital images, in order to build trustable models which allow predicting oil content of the tortilla
chips by using the image features extracted from their digital images (without the necessity of
experimental measuring them in a Soxhlet analyzer).
ACCEPTED MANUSCRIPT 4
Dow
nloa
ded
by [S
ilvia
Mat
iace
vich
] at 1
5:21
09
Apr
il 20
13
ACCEPTED MANUSCRIPT
MATERIALS AND METHODS 80
81
82
83
84
85
86
87
88
89
90
91
92
93
94
95
96
97
All experimental work was accomplished in the Laboratories of Physical Properties and
Computer Vision located in Universidad de Santiago de Chile.
Tortilla chip preparation
Tortilla chips were self-made prepared from masa of maize (F.H.M. Alimentos Ltd., Santiago,
Chile). The thickness of chips was adjusted in 2.0 r 0.2 mm using a Tortilla Machine (González,
S.A., Guadalupe, México). A circular cutting mold was used to provide tortilla chips with a
diameter of 3.7 r 0.2 cm. The tortillas chips were cooked on an electric iron skillet (Black and
Decker) heated at 215°C for 30 s, flipped, cooked for 30 s, flipped again and cooked for 30 s. In
preliminary frying experiments, the corresponding maxima frying times and the time intervals
for each frying temperature were determined until a final moisture content of about 1.8% (dry
basis) was reached in the tortillas. Ten (10) chips were fried at different time intervals at frying
temperatures of 160°C (0, 36, 72, 108, 144, 180 and 220 s), 175°C (0, 10, 20, 50, 80, 110 and
140 s) and 190°C (0, 5, 15, 30, 45, 60 and 80 s). Frying temperature was kept constant (±1 °C)
by using a thermocouple (mod. GG-30-KK, Tersid, Milano, Italy) inserted in the oil bath, which
was connected to a digital data logger (Model 2700, Keithley, Cleveland, USA). Oil was pre-
heated for 1 h prior to frying, and discarded after 6 h of use (25). Finally, the fried chips were
cooled down to room temperature in desiccators during 2 min and analyzed. A previous study
ACCEPTED MANUSCRIPT 5
Dow
nloa
ded
by [S
ilvia
Mat
iace
vich
] at 1
5:21
09
Apr
il 20
13

ACCEPTED MANUSCRIPT 98
99
100
101
102
103
104
105
106
107
108
109
110
111
112
113
114
115
116
done for batches of ten (10) chips, which were first characterized by digital imaging and then
surface oil content was measured, showed that their oil content fractions did not differ
significantly (data not shown). Experiments were run in triplicate (total n= 30). Moisture content
(mc) of tortillas chips was determined by moisture analyzer oven drying (MS-70, A&D
Company Ltd.). Duplicates of weighed samples (about 5 g) were dried at 160°C until constant
weight, and the average results were reported in % dry basis (%db). The initial moisture content
was 54 ± 2%db.
Computer vision system
Computer vision system (CV) consist of a black box with four natural daylight tubes of 18W
(Phillips) and a Canon Powershot G3 camera of 4 Megapixels placed in vertical position at 22.5
cm of samples, the angle of camera lens and light was 45°, according to Pedreschi et al. (10). The
white balance of the camera was set using a standardized gray color chart from Kodak (Boston,
MA). In order to calibrate the digital color system, the color values (L*a*b* scale) of 35 color
charts were measured using a colorimeter and CV using Balu Toolbox, which was calibrated to
obtain the same L*a*b* color values, according to León et al (26) and Mery et al. (24). Color
charts were photographed an analyzed periodically to ensure that the lighting system and the
color digital camera were working properly.
Each sample at each frying time was placed in front of the camera and two images (front and
back) from each sample were obtained (total n=60). All images (maximum resolution,
ACCEPTED MANUSCRIPT 6
Dow
nloa
ded
by [S
ilvia
Mat
iace
vich
] at 1
5:21
09
Apr
il 20
13

ACCEPTED MANUSCRIPT 117
118
119
120
121
122
123
124
125
126
127
128
129
130
131
132
133
134
2272x1704pixels) were acquired at the same conditions using remote control of ZoomBrowser
program v6.0 (Canon, Intel, Santa Clara, CA). The acquired images were saved as TIFF-24bit
files and retrieved later for subsequent analysis. Analysis images were performed using software
Matlab, Balu Toolbox1 (11).
Feature extraction using image analysis
The Balu Toolbox1 (11) is a software into Matlab software (27) for image analysis and pattern
recognition, which extracts a very large number digital chromatic and geometric features from
digital images (previously segmented to separate it from background), and then permit to
correlate the best feature of the total features analyzed (672 features) with an oil content
experimental parameter. Table 1 (adapted from Mery et al., 24) shows the principal geometric
features that provide information on the size and shape of a segmented region, following three
groups of features (totally, 54 geometrical features) and the intensity features that provide
information about the color intensity of a chip region extracted for each color channel, following
four groups of features (618 intensity features in total).
Oil content measurements
The surface oil content (SUOC) is defined as the oil fraction which does not penetrate the chip
microstructure neither during frying nor during cooling, remaining in the slice surface. For each
selected sample frying time, the fried chips were cooled down to room temperature in desiccators
ACCEPTED MANUSCRIPT 7
Dow
nloa
ded
by [S
ilvia
Mat
iace
vich
] at 1
5:21
09
Apr
il 20
13

ACCEPTED MANUSCRIPT 135
136
137
138
139
140
141
142
143
144
145
146
147
148
149
150
151
during 2 min and then SUOC was measured using petroleum ether extraction by dipping each 10
chips for 10 s in a beaker according to Duran et al. (7), and the oil dropped in the beaker was
collected by evaporating the petroleum ether. The structural oil content (SOC) is defined as the
oil which penetrates the chip microstructure (either during frying (STO) or cooling (PSO),
according to oil fractions definition by Duran et al (7) and it was quantified according to Soxhlet
extraction with petroleum ether (28). Samples used for this analysis were previously surface oil
removed. The total oil content (TOC) was calculated as the sum of SUOC plus SOC at any time
either during the frying or during the cooling process. In order to verify the accuracy of the
methodologies employed for the quantification of the different kinds of oils, TOC was
determined experimentally as well according to the Soxhlet method. The total oil content and the
different oil fractions were expressed as grams of oil per gram of dry solids (dry solids free of
oil).
Kinetics of oil uptake
An empirical first order model (equation 1) was used to describe oil uptake during frying (7):
)1( Kteq eOO �� (1)
Where O is the total oil content at frying time t (g oil/g dry solids); Oeq is the oil content at
equilibrium (or maximum content in dry basis) at t = f and K, the specific rate for the first-order
ACCEPTED MANUSCRIPT 8
Dow
nloa
ded
by [S
ilvia
Mat
iace
vich
] at 1
5:21
09
Apr
il 20
13

ACCEPTED MANUSCRIPT model. In this model, the oil content is null at t=0, and for long times, it becomes the equilibrium
value. The oil uptake ratio was expressed in equation 2 (3):
152
153
removedmoisturecontentoiltotalFinalratiouptakeoil
______ (2) 154
155
156
157
158
159
160
161
162
163
164
165
166
167
168
169
170
Statistical Analysis
Differences between means of data of each treatment were compared by t-test using GraphPad
Prism v.4.0 program (GraphPad Systems Inc.). Statistical significance was expressed at the
p<0.05 level. A statistical analysis was carried out to determine the confidence interval for the
obtained performance. The cross-validation technique, widely used in machine learning
problems (29), classification of potatoes chips using pattern recognition (10, 21) and quality
classification of corn tortillas (24) was used also in this work. This validation technique of k–
partition=N/F permits the evaluation of prediction model in order to obtain a robust model and
accurate error. In cross-validation, some of the collected samples are removed and become the
training set. The data is divided into F folds randomly. Each group contains N/k samples, where
N is the total number of data samples. Then, F-1 folds are used as training data and the remaining
fold is used as testing data to evaluate the performance of the estimation. When training is
performed, the samples that were initially removed can be used to test the performance of the
mathematical model on these testing data. Thus, one can evaluate how well the model works
with samples that have not been already examined. This process is performed (F-1) more times,
rotating training and test data during each cycle. The F individual performances from the folds
ACCEPTED MANUSCRIPT 9
Dow
nloa
ded
by [S
ilvia
Mat
iace
vich
] at 1
5:21
09
Apr
il 20
13
ACCEPTED MANUSCRIPT 171
172
173
174
175
176
177
178
179
180
181
182
183
184
185
186
187
188
189
are averaged to estimate the final performance. In our case, the data consists of 3 temperatures
and 30 samples (N) per temperature for each mechanical properties studied during frying time
and 60 digital images. For these experiments, we choose F=10 folds and we removed the sample
k (n=6) and we trained the model using the remaining 54 (N-k) samples. In each test, the testing
data corresponds to a different group, and the error obtained in each experiment is called ek, for
k=1, …, 10. The F individual performances from the folds were used to estimate the final
performance of the model. The percent of success of the mathematical model obtained of each
sample condition was determined comparing statistically instrumental and mathematical data
obtained for test data, take into not significant differences between data (p>0.05) using Dunnett’s
test and t-test with 10 degrees of freedom and 95% of confidence.
RESULTS AND DISCUSSION
The methodology used in this research allowed determining the structural (SOC) and surface
(SUOC) oil content fractions, as well as the total (TOC) oil content in tortilla chips, as previously
done for potato chips (7). This result was corroborated since a not significant difference (p>0.05)
was obtained between TOC values obtained both experimentally as by the sum of SOC plus
SUOC at the three evaluated temperatures (7).
Total (TOC), structural (SOC) and surface (SUOC) oil content of tortilla chips at different frying
temperatures are shown in Figure 1. Total oil content of the chips increased considerably during
the initial period (a10 s) of frying, and then it remained almost constant at the three frying
ACCEPTED MANUSCRIPT 10
Dow
nloa
ded
by [S
ilvia
Mat
iace
vich
] at 1
5:21
09
Apr
il 20
13

ACCEPTED MANUSCRIPT 190
191
192
193
194
195
196
197
198
199
200
201
202
203
204
205
206
207
208
209
temperatures (Figures 1 and 2). Similar behavior in the kinetics of oil absorption was found both
in potato chips (7) as in tortilla chips fried at 190 °C during the first 10-15 s (3). This result could
be explained by the increasing product temperature with time accompanied by starch
gelatinization, during which pores are created and water is expelled from the product, further
creating capillary pores which are filled with oil (3). During this period, oil adheres to the chip
surface and get into the inner part of the product through its damaged zones. Once that most of
the water is evaporated, product temperature increases and the oil absorption rate diminished.
The final moisture content obtained after frying was a1.8%db in all cases; however, it was
obtained at different frying times depending on the frying temperature (Figures 1 and 2).
Therefore, at the same frying time, the final moisture content will vary resulting in a different
interpretation of the results. Therefore, the final oil content (SOC) obtained at 1.8%db of
moisture content was 32 ± 4 (g oil/ 100g oil dry basis, %db) for structural oil content at frying
temperatures of 160 °C and 190 °C. However, for tortillas fried at 175 °C, oil content was
approximately higher (40 ± 4 %db) than for others temperatures (32 ± 4 %db). Nevertheless, the
final oil content in tortilla chips, both SOC and TOC (Figure 2), was not significantly different
(p>0.05) at different frying temperatures probably related to the remaining moisture content in
the chips rather than to the oil temperature, as has been reported previously by Gamble et al. (30)
and Moreira et al. (3).
On the other hand, while frying temperatures increased, the oil content that penetrates into their
microstructure (structural oil) diminished from 96% to 85%, and the surface oil content increases
ACCEPTED MANUSCRIPT 11
Dow
nloa
ded
by [S
ilvia
Mat
iace
vich
] at 1
5:21
09
Apr
il 20
13

ACCEPTED MANUSCRIPT 210
211
212
213
214
215
216
217
218
219
220
221
222
223
224
225
226
227
228
229
230
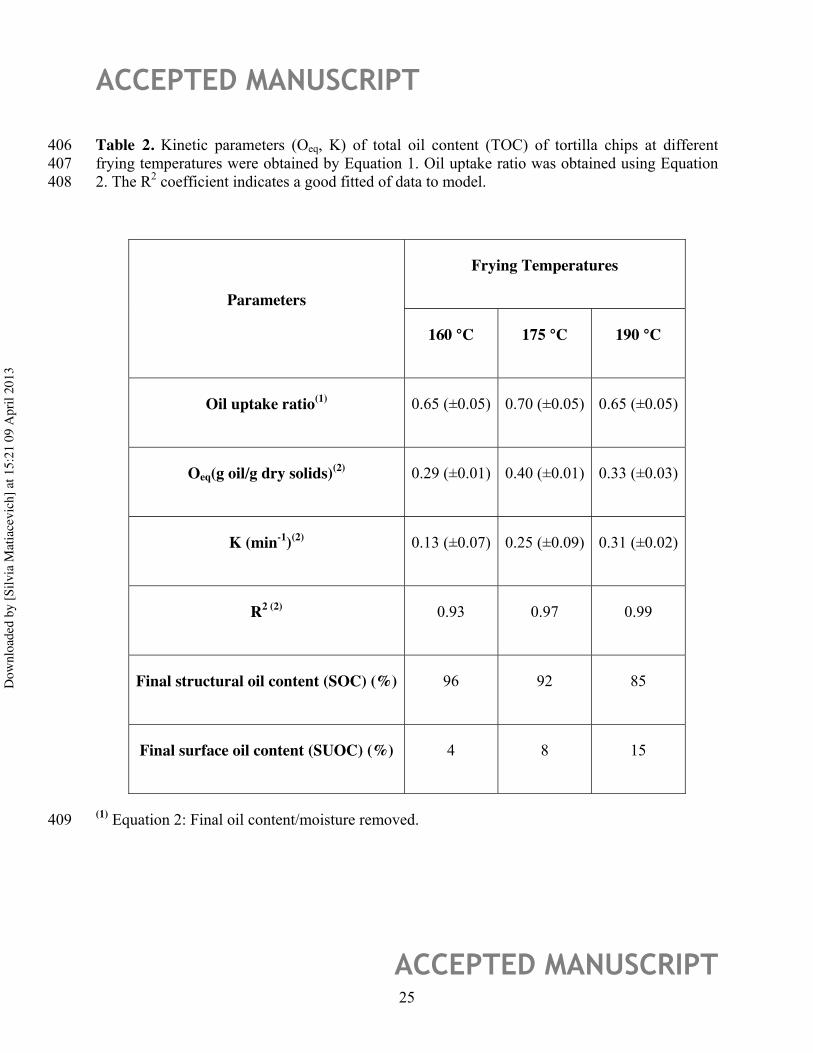
from 4% to 15%, as shown in Table 2. Moreover, in order to eliminate the effect of the different
final frying time, it is more reasonable to consider the water removed during frying to compare
different frying temperatures (3, 31). Table 2 shows the relationship between oil uptake ratios
(oil uptake/water removed) at different frying temperatures. The oil uptake ratio was not
significantly (p>0.05) affected by frying temperature, confirming the results obtained above in
Figure 2 using Anova.
Experimental data corresponding to total oil absorption (TOC) as a function of frying time and
the corresponding curves fitted using Equation 1 are shown in Figure 2. High correlation
coefficients (R2 � 0.95) were obtained between experimental data and the model of oil uptake by
Equation 1. Figure 2 shows that not significant differences (p>0.05) in total oil content by frying
temperatures were obtained. Parameters of this model (Equation 1) calculated for each
experimental conditions are shown in Table 2, showing that the specific rate (K) increased with
frying temperature, as it was observed before in potato chips (7, 32). However, the equilibrium
oil content (Oeq), which is the final TOC, was independent of frying temperatures, according to
oil uptake ratio results observed in Table 2 and Figure 2. Despite, several authors have reported
that higher frying temperatures lead to lower absorbed oil of food products (6, 31). Moreira et al.
(7), however, found that there were not significant differences (p>0.05) in tortilla chips fried at
160 °C and 190 °C, in agreement to the results obtained in this study. As observed of TOC data
at the three evaluated temperatures, this Oeq in tortilla chips could be better related to the
remaining moisture content in the chips (1.8%db, independently of frying temperature) than to
the oil frying temperature, as previously reported in potato and tortilla chips (3, 30).
ACCEPTED MANUSCRIPT 12
Dow
nloa
ded
by [S
ilvia
Mat
iace
vich
] at 1
5:21
09
Apr
il 20
13
ACCEPTED MANUSCRIPT 231
232
233
234
235
236
237
238
239
240
241
242
243
244
245
246
247
248
249
250
251
The aim of this study was to obtain digital features from images of tortilla chips in order to
obtain a linear correlation with oil content fractions. Therefore, the mean (n=60) of each digital
feature obtained (672) at each frying time and each frying temperature was correlated with the
mean of data (n=30) of each oil content fraction measured using Soxhlet method. Thus, the
software searched the best digital feature obtained by CV that lineally correlates (R2>0.95) with
each oil content studied at each temperature, as observed in Table 3. This best digital feature
was different depending on the frying temperature and the oil fraction studied, indicating that
differences in tortilla chips can be observed through image analysis. The image analysis was
nevertheless performed on the surface of each tortilla, where it could have been expected to
obtain only digital features that correlated with surface oil content. The different digital features
obtained for total, surface and structural oil content was mainly attributed to differences in the oil
fraction during time. Using the obtained linear equations from best digital features in each case
(Table 3), the predictions of oil contents (SUOC, SOC and TOC) were obtained to each
replicates (n=4). Figure 3 shows an example of oil content (SOC) prediction at 190 °C using
their corresponding obtained digital feature. In general, when experimental data is fitted using a
mathematical model, the correlation coefficient (r-square) must be greater than 0.9, however for
data prediction, r-squares greater than 0.8 are expected for a model to be validated (11, 22, 22,
24). According to this, a high variation coefficient (R2�0.86) was obtained between instrumental
data obtained experimentally by Soxhlet method and by using the mathematical linear model
obtained from the extracted feature (Table 3) through their image analysis (n=60) (theoretical
feature), indicating low variability between both parameters due replicates (n=20). This high
ACCEPTED MANUSCRIPT 13
Dow
nloa
ded
by [S
ilvia
Mat
iace
vich
] at 1
5:21
09
Apr
il 20
13

ACCEPTED MANUSCRIPT coefficient correlation (R2�0.86) was obtained for all oil fractions studied in each of the tested
conditions.
252
253
254
255
256
257
258
259
260
261
262
263
264
265
266
267
268
269
270
271
A cross-validation technique was used in order to validate each mathematical model obtained for
predict each oil content fraction at each frying condition. The percent of success of linear model
to predict oil content using a corresponding digital feature was higher than 90% (Table 3), being
mostly 100%. Besides, Bartlett's test for equal variances showed no significant differences
(p<0.05) between variances of prediction model and experimental data of each studied
conditions and between the test classification performance. This result demonstrates the
repeatability of the classification and the effectiveness of the each linear model to predict oil
content from tortillas chips during frying using digital features. According to the t-student test
with 10 degrees of freedom and 95% of confidence, we obtained that the performance of the
prediction models was 97 ± 4 %, whereas the confidence interval was between 93% and 100%,
with 95% of probability. The coefficient of variation (defined as 100 × standard deviation/mean
value) was lower than 5%, showing the repeatability and effectiveness of the linear model to
predict mechanical properties using digital features, as well as the good fitting of the prediction.
Therefore, the results obtained by image analysis for the total oil content (TOC) and the other oil
content fractions (SUOC and SOC) compared favorably to those obtained through experimental
classical methods.
It is important to remark that frying temperature was not found to have any significant effect on
total oil content. Therefore, a combination of total oil content data for all temperatures was
ACCEPTED MANUSCRIPT 14
Dow
nloa
ded
by [S
ilvia
Mat
iace
vich
] at 1
5:21
09
Apr
il 20
13

ACCEPTED MANUSCRIPT 272
273
274
275
276
277
278
279
280
281
282
283
284
285
286
287
288
289
290
291
performed to obtain a linear model independently of frying temperature in the range from 160 to
190ºC, in order to obtain more representative results. The mathematical linear model, the digital
feature selected (Mean Laplacian- Blue) and cross-validation data are shown in Table 3,
obtaining lower (moderately) variation coefficient (R2 = 0.843) and lower % of success of the
prediction (70%) of total oil content in comparison to the models obtained to each condition
process. However, this linear model would be a much better outcome and more practicable for
the snack-industry.
CONCLUSIONS
In conclusion, the total oil content of tortilla chips was absorbed principally during first 10 s of
frying, and total oil uptake ratio was independently of oil frying temperature. Intensity and
geometric digital features (total of 672 features) were extracted from their digital images by
using computer vision technique and only 9 of them are selected, which depends mainly on oil
frying temperature and the oil content fraction. Surface, structural and total oil content
experimentally measured showed a linear correlation (R2>0.95) with textural digital features
obtained by CV, such as Fourier Haralick and Hu moments, which permits the prediction of
these chemical parameters through image analysis. According to the cross validation technique,
the performance in the prediction was a97% and the coefficient of variation was lower than 5%
showing the repeatability and effectiveness of each linear model to predict oil content using
digital features and the good fitting of the prediction. Therefore, trustable models which allow
predicting properties of the tortilla chips can be developed by using selected features extracted
ACCEPTED MANUSCRIPT 15
Dow
nloa
ded
by [S
ilvia
Mat
iace
vich
] at 1
5:21
09
Apr
il 20
13

ACCEPTED MANUSCRIPT 292
293
294
295
296
297
298
299
300
301
302
303
304
305
306
307
308
309
310
from their digital images, without the necessity of measuring them. However, the result of the
correlation analysis showed that different combinations of features are needed for each frying
temperature, and that it is necessary to choose individual combinations for each frying
temperature and oil content fraction. These results indicated that it is not easy transferable to
other cases. Despite this, a combination of image features for all temperatures was performed to
predict the total oil content of tortilla chips, which would be a better and more practical outcome.
This emergent procedure could be implemented to improve and control the frying process of
tortilla chips.
ACKNOWLEDGEMENTS
The authors would you like to acknowledge at Sr. Jon May from FHM Alimentos Ltd. for
providing gently the masa to chips elaboration. This work was financial supported by (i)
Vicerrectoría de Investigación y Desarrollo of Universidad de Santiago de Chile (USACH), (ii)
FONDECYT Project 1070031, (iii) LACCIR Virtual Institute (Project R0308LAC003), (iv)
Consejo Nacional de Investigaciones Científicas y Técnicas (CONICET) from Argentina and (v)
PBCT-PSD-62 Project from CONICYT-Chile. Balu Toolbox can be downloaded from
http://dmery.ing.puc.cl.
REFERENCES
Sefa-Dedeh, S.; Cornelius, B.; Sakyi-Dawson, E.; Afoakwa, E.O. Effect of Nixtamalization on
the Chemical and Functional Properties of Maize. Food Chemistry 2004, 86, 317–324.
ACCEPTED MANUSCRIPT 16
Dow
nloa
ded
by [S
ilvia
Mat
iace
vich
] at 1
5:21
09
Apr
il 20
13

ACCEPTED MANUSCRIPT 311
312
313
314
315
316
317
318
319
320
321
322
323
324
325
326
327
328
329
Serna-Saldivar, S.O.; Gomez, M.H.; Rooney, L.W. Technology, Chemistry, and Nutritional
Value of Alkaline-cooked Corn Products. In Advances in Cereal Science and Technology,
Pomeranz, Y., Ed.; American Assoc. Cereal Chemists, St. Paul. 1990; 243.
Moreira, R.G.; Sun, X.; Chen Y. Factors Affecting Oil Uptake in Tortilla Chips in Deep-fat
Frying. Journal of Food Engineering 1997, 31, 485-498.
Kawas, M.L.; Moreira, R.G. Characterization of Product Quality Attributes of Tortilla Chips
during the Frying Process. Journal of Food Engineering 2001, 47, 97-107.
Mellema, M. Mechanism and Reduction of Fat Uptake in Deep-fat Fried Foods. Trends in Food
Science and Technology 2003, 14, 364-373.
Bouchon, P.; Aguilera, J.M.; Pyle, D.L. Structure Oil-absorption Relationships during Deep-fat
Frying. Journal of Food Science 2003, 68, 2711-2716.
Duran, M.; Pedreschi, F.; Moyano, P.; Troncoso, E. Oil Partition in Pre-treated Potato Slices
during Frying and Cooling. Journal of Food Engineering 2007, 81, 257-265.
Brosnan, T.; Sun, D.W. Improving Quality Inspection of Food Products by Computer Vision- A
Review. Journal of Food Engineering 2004, 61, 161-166.
Mery, D.; Pedreschi, F. Segmentation of Colour Food Images using a Robust Algorithm. Journal
of Food Engineering 2005, 66, 353-360.
Pedreschi, F.; León, J.; Mery, D.; Moyano, P. Development of a Computer Vision System to
Measure the Color of Potato Chips. Food Research International 2006, 39, 1092-1098.
ACCEPTED MANUSCRIPT 17
Dow
nloa
ded
by [S
ilvia
Mat
iace
vich
] at 1
5:21
09
Apr
il 20
13

ACCEPTED MANUSCRIPT Mery, D.; Soto, A. Features: The More The Better. In New Aspects of Signal Processing,
Computational, Geometry and Artificial Vision; Proceedings of the 7th WSEAS International
Conference on signal processing, computational geometry and artificial vision, Rodos Island,
Greece August 20-22, 2008; Mastorakis, Demiralp, Mladenov, Bojkovic., Eds.; 46-50.
330
331
332
333
334
335
336
337
338
339
340
341
342
343
344
345
346
347
348
Gunasekaram, S.; Ding, K. Using Computer Vision for Food Quality Evaluation. Food
Technology 1994, 48, 151-154.
Gerrard, D.E.; Gao, X.; Tan, J. Beef Marbling and Color Store Determination by Image
Processing. Journal ofFood Science 1996, 61, 145-148.
Luzuriaga, D.; Balaban, M.O.; Yeralan, S. Analysis of Visual Quality Attributes of White
Shrimp by Machine Vision. Journal of Food Science. 1997, 61, 113-118.
Leemans, V.; Magein, H.; Destain, M.F. Defects Segmentation on ‘Golden Delicious’ Apples by
using Color Machine Vision. Computers and Electronics in Agriculture 1998, 20, 117-130.
Ram, T.; Wiesman, Z.; Parmet, I.; Edan, Y. Olive Oil Content Prediction Models Based on
Image Processing. Biosystem Engineering 2010, 10, 221-232.
Abdullah, M.Z.; Guan, L.C.; Mohd Azemi, B.M.N. Stepwise Discriminant Analysis for Colour
Grading of Oil Palm Using Machine Vision System. Food and Bioproducts Processing 2001, 79,
223-231.
Marty, S.; Baker, K.W.; Marangoni, A.G. Optimization of a Scanner Imaging Technique to
Accurately Study Oil Migration Kinetics. Food Research International 2009, 42, 368-373.
ACCEPTED MANUSCRIPT 18
Dow
nloa
ded
by [S
ilvia
Mat
iace
vich
] at 1
5:21
09
Apr
il 20
13

ACCEPTED MANUSCRIPT 349
350
351
352
353
354
355
356
357
358
359
360
361
362
363
364
365
366
Nopens, I.; Foubert, I.; De Graef, V.; Van Laere, D.; Dewettinck, K.; Vanrolleghem, P.
Automated Image Analysis Tool for Migration Fat Bloom Evaluation of Chocolate Coated Food
Products. LWT - Food Science and Technology 2008, 41, 1884-1891.
Konopka, I.; Kozirok, W.; Rotkiewicz, D. Lipids and Carotenoids of Wheat Grain and Flour and
Attempt of Correlating them with Digital Image Analysis of Kernel Surface and Cross-sections.
Food Research International 2004, 37, 429-438.
Pedreschi, P.; Mery, D.; Mendoza, F.; Aguilera, J.M. Classification of Potato Chips using Pattern
Recognition. Journal of Food Science 2004, 69, 264-270.
Matiacevich, S.; Mery, D.; Pedreschi, F. Prediction of Mechanical Properties of Corn and
Tortilla Chips using Computer Vision. Food Processing Technology. 2011. DOI
10.1007/s11947-011-0662-z.
Haralick, R. Statistical and Structural Approaches to Texture. Proceedings of the IEEE. 1979, 67,
786-804.
Mery, D.; Chanona-Perez, J.J.; Soto, A.; Aguilera, J.M.; Cipriano, A.; Veléz-Rivera, N.; Arzate-
Vázquez, I.; Gutiérrez-López, G.F. Quality Classification of Corn Tortillas using Computer
Vision. Journal of Food Engineering 2010, 101, 357-364.
Blumenthal, M. A New Look at the Chemistry and Physics of Deep Fat Frying. Food
Technology. 1991, 45, 68-71.
ACCEPTED MANUSCRIPT 19
Dow
nloa
ded
by [S
ilvia
Mat
iace
vich
] at 1
5:21
09
Apr
il 20
13

ACCEPTED MANUSCRIPT 367
368
369
370
371
372
373
374
375
376
377
378
379
380
381
382
León, K.; Mery, D.; Pedreschi, F.; León, J. Color measurement in L*a*b* units from RGB
digital images. Food Research International 2006, 39, 1084–1091.
MathWorks. Image Processing Toolbox for Use with MATLAB: User's Guide
The MathWorks Inc. 2008.
AACC. Oil content. In Approved Methods of the American Association of Cereal Chemists.
AACC, St Paul, MN, 1986.
Mitchell, T.M. Machine Learning. McGraw-Hill; Boston, 1997; 414 pp.
Gamble, M.H.; Rice, P.; Selman, J.D. Relationships between Oil Uptake and Moisture Loss
during Frying of Potato Slices from cv. Record U.K. Tubers. International Journal of Food
Science and Technololgy 1987, 22, 233-241.
Pinthus, E.J.; Weinberg, P.; Saguy, I.S. Criterion for Oil Uptake during Deep-fat Frying. Journal
of Food Science 1993, 58, 204-205.
Moyano, P.E.; Pedreschi, F. Kinetics of Oil Uptake during Frying of Potato Slices: Effect of pre-
treatments. LWT - Food Science and Technology 2006, 39, 285-291.
ACCEPTED MANUSCRIPT 20
Dow
nloa
ded
by [S
ilvia
Mat
iace
vich
] at 1
5:21
09
Apr
il 20
13

ACCEPTED MANUSCRIPT
Captions of Figures 383
384 385
Figure 1. Oil content fractions (surface, structural and total) of tortilla chips during frying at different temperatures: a) 160°C, b) 175°C, d) 190°C.
386
387
ACCEPTED MANUSCRIPT 21
Dow
nloa
ded
by [S
ilvia
Mat
iace
vich
] at 1
5:21
09
Apr
il 20
13

ACCEPTED MANUSCRIPT
Figure 2. Total oil uptake for tortilla chips during frying. Experimental data (mean) and their fitting by model equation 1. Error bars indicate standard deviation.
388 389
390
391
ACCEPTED MANUSCRIPT 22
Dow
nloa
ded
by [S
ilvia
Mat
iace
vich
] at 1
5:21
09
Apr
il 20
13

ACCEPTED MANUSCRIPT
Figure 3. Prediction of structural oil content (SOC) of tortilla chips fried at 190°C using the digital or theorical feature obtained by computer vision that best correlated with experimental data. Linear equation and correlation coefficient (R2) was inserted.
392 393 394
395
396
397
ACCEPTED MANUSCRIPT 23
Dow
nloa
ded
by [S
ilvia
Mat
iace
vich
] at 1
5:21
09
Apr
il 20
13

ACCEPTED MANUSCRIPT
398 399
400
401
402
403
404
405
Table 1. Extracted features by Balu Toolbox from Matlab software (Adapted by Mery et al., 2010). Coefficients without units.
Family Group Name of features
Geometric
Standard
Center of gravity I, center of gravity j, height, width, area, perimeter, Euler number, equivalent, diameter, major axis length, minor axis length, orientation, solidity, extent, eccentricity, convex area and filled area.
Fourier descriptors
Descriptors (0,…,15) Shape information invariant to scale, orientation and position based on Fourier descriptors, they may also be good choice for establishing the shape
Invariant moments
Hu (1,…,7) can be used because they are invariant under magnification, translation and rotation.
Color (gray, Red,
Green, Blue, Hue, Saturation, Value, L*,
a*, b*)
Standard
Mean intensity, standard deviation intensity, Standard deviation intensity with neighbor, mean Laplacian and mean gradient
Statistical textures
Tx (k,p) (mean/range) for k= 1.Angular Second Moment, 2.Contrast, 3.Correlation, 4.Sum of squares, 5.Inverse Difference Moment, 6.Sum Average, 7.Sum variance, entropy, 8.Sum Variance, 9.Entropy, 10.Difference Variance, 11.Difference Entropy, 12.,13. Information Measures of Correlation and 14.Maximal Correlation Coefficient, and p=1,…, 5 pixels.
Filter banks Discrete Fourier Transform, DFT (1,2; 1,2) and Discrete Cosine Transform, DCT (1,2; 1,2) coefficients
Invariant moments
Int-Hu (1,…,7) Hu moments with intensity information
ACCEPTED MANUSCRIPT 24
Dow
nloa
ded
by [S
ilvia
Mat
iace
vich
] at 1
5:21
09
Apr
il 20
13
ACCEPTED MANUSCRIPT
Table 2. Kinetic parameters (Oeq, K) of total oil content (TOC) of tortilla chips at different frying temperatures were obtained by Equation 1. Oil uptake ratio was obtained using Equation 2. The R2 coefficient indicates a good fitted of data to model.
406 407 408
409
Parameters
Frying Temperatures
160 °C 175 °C 190 °C
Oil uptake ratio(1) 0.65 (±0.05) 0.70 (±0.05) 0.65 (±0.05)
Oeq(g oil/g dry solids)(2) 0.29 (±0.01) 0.40 (±0.01) 0.33 (±0.03)
K (min-1)(2) 0.13 (±0.07) 0.25 (±0.09) 0.31 (±0.02)
R2 (2) 0.93 0.97 0.99
Final structural oil content (SOC) (%) 96 92 85
Final surface oil content (SUOC) (%) 4 8 15
(1) Equation 2: Final oil content/moisture removed.
ACCEPTED MANUSCRIPT 25
Dow
nloa
ded
by [S
ilvia
Mat
iace
vich
] at 1
5:21
09
Apr
il 20
13

ACCEPTED MANUSCRIPT (2) Kinetic parameters of Equation 1. Oeq is the oil content at equilibrium (or maximum content in
dry basis) at t=f, t is the frying time and K is the specific rate for the first-order model.
410
411
412
413
* Numbers in brackets indicate standard deviation.
ACCEPTED MANUSCRIPT 26
Dow
nloa
ded
by [S
ilvia
Mat
iace
vich
] at 1
5:21
09
Apr
il 20
13

ACCEPTED MANUSCRIPT
Table 3. Digital features (y) obtained by computer vision that best correlated with oil content and their respective linear equation. R2: correlation coefficient indicating a good fit to experimental data for linear regression. Cross Validation: Percent of success.
414 415 416
Oil Content
(g/gdb)
Frying
Temperature
(°C)
Digital feature (y) Equation of
correlation R2
Cross
Validation
(%)
Surface
(SUOC)
160°C Fourier 4 - Saturation y=0.056x-0.190 0.950 90
175°C Tx14, d5 (range) - Red y=0.086x+0.031 0.971 100
190°C Int. Hu moment 1 -
Saturation y=0.93x+0.270 0.985 100
Structural
(SOC)
160°C Int. Hu moment 1 - b y=12e5x-1.3 0.981 100
175°C Tx1, d2 (mean) - b y=-2.3x+0.940 0.984 100
190°C Tx13, d1 (mean) - a y=3.1x-0.011 0.968 90
Total 160°C Tx12, d1 (mean) - a y=9.1x+0.5 0.969 100
ACCEPTED MANUSCRIPT 27
Dow
nloa
ded
by [S
ilvia
Mat
iace
vich
] at 1
5:21
09
Apr
il 20
13

ACCEPTED MANUSCRIPT
ACCEPTED MANUSCRIPT 28
(TOC) 175°C Tx14, d1 (mean) - L y=-2.2x+0.51 0.970 100
190°C Mean Laplacian - b y=0.36x-0.52 0.961 100
TOC 160-190ºC Mean Laplacian- Blue y=-2.18x+0.66 0.845 70
417
Dow
nloa
ded
by [S
ilvia
Mat
iace
vich
] at 1
5:21
09
Apr
il 20
13